Categories
Commentary

Daily Brief For March 9, 2023

Physik Invest’s Daily Brief is read free by thousands of subscribers. Join this community to learn about the fundamental and technical drivers of markets.

Graphic updated 8:30 AM ET. Sentiment Neutral if expected /MES open is inside of the prior day’s range. /MES levels are derived from the profile graphic at the bottom of this letter. Click here for the latest levels. SqueezeMetrics Dark Pool Index (DIX) and Gamma (GEX) with the latter calculated based on where the prior day’s reading falls with respect to the MAX and MIN of all occurrences available. A higher DIX is bullish. The lower the GEX, the more (expected) volatility. Click to learn the implications of volatility, direction, and moneyness. Breadth reflects a reading of the prior day’s NYSE Advance/Decline indicator. The CBOE VIX Volatility Index (INDEX: VVIX) reflects the attractiveness of owning volatility. UMBS prices via MNDClick here for the economic calendar.

Fundamental

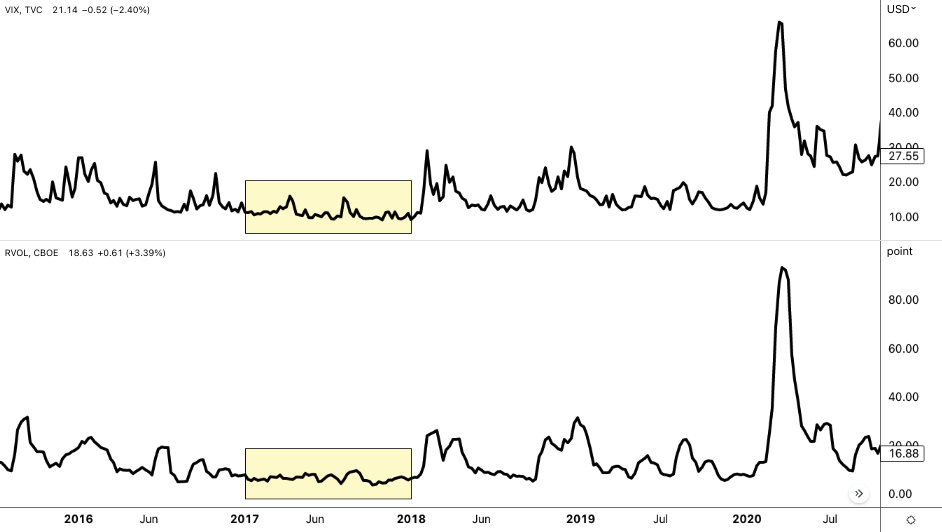
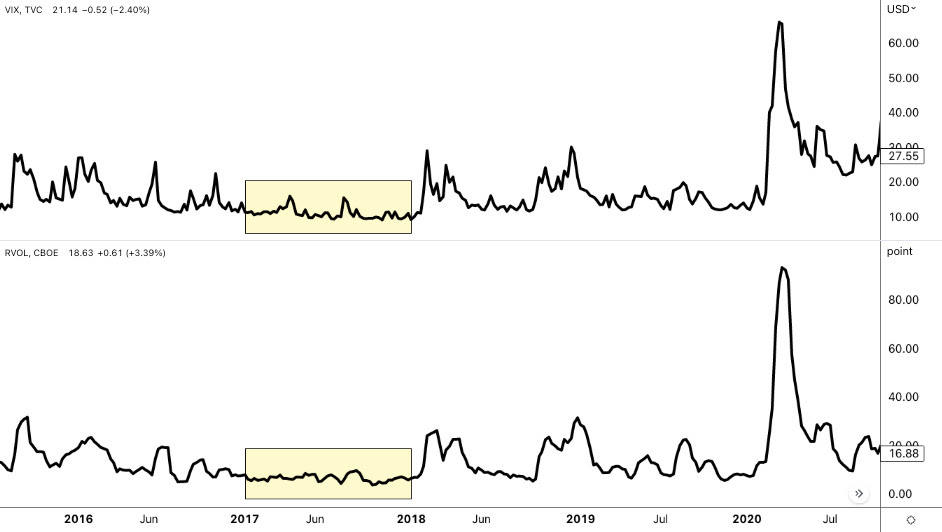
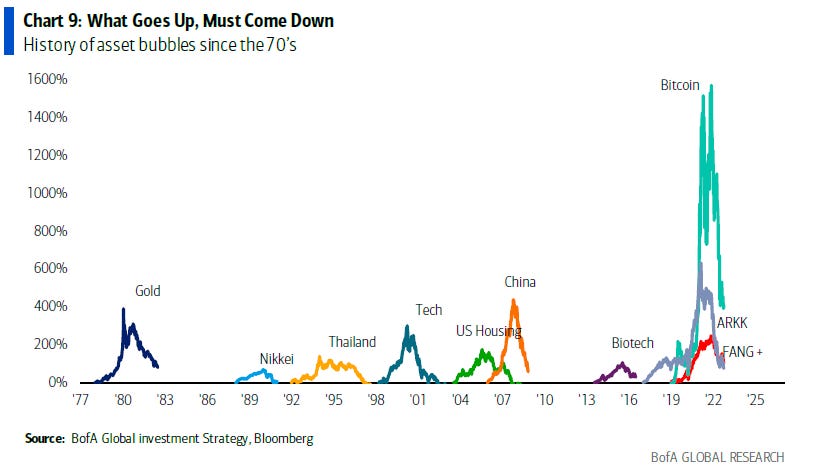
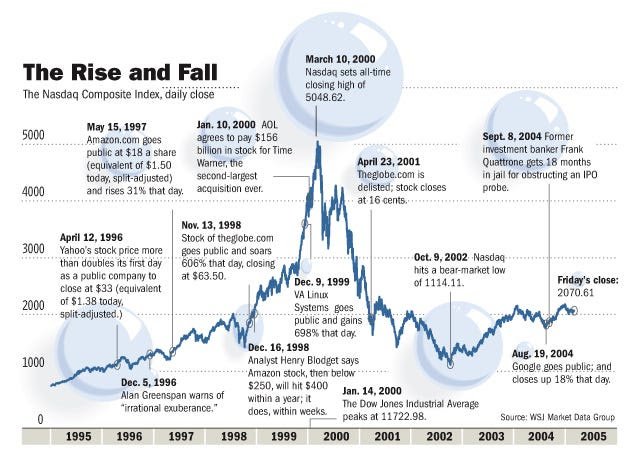
Last year, Simplify Asset Management’s Michael Green, an active manager focused on creating portfolios mimicking traditional constructions like 60/40, albeit with less realized volatility (RVOL), thought a dot-com-type collapse was unfolding under the surface of the indexes.

In an interview for an upcoming Benzinga article, Green explained to your letter writer that he maintains today’s action is similar to the early 2000s.

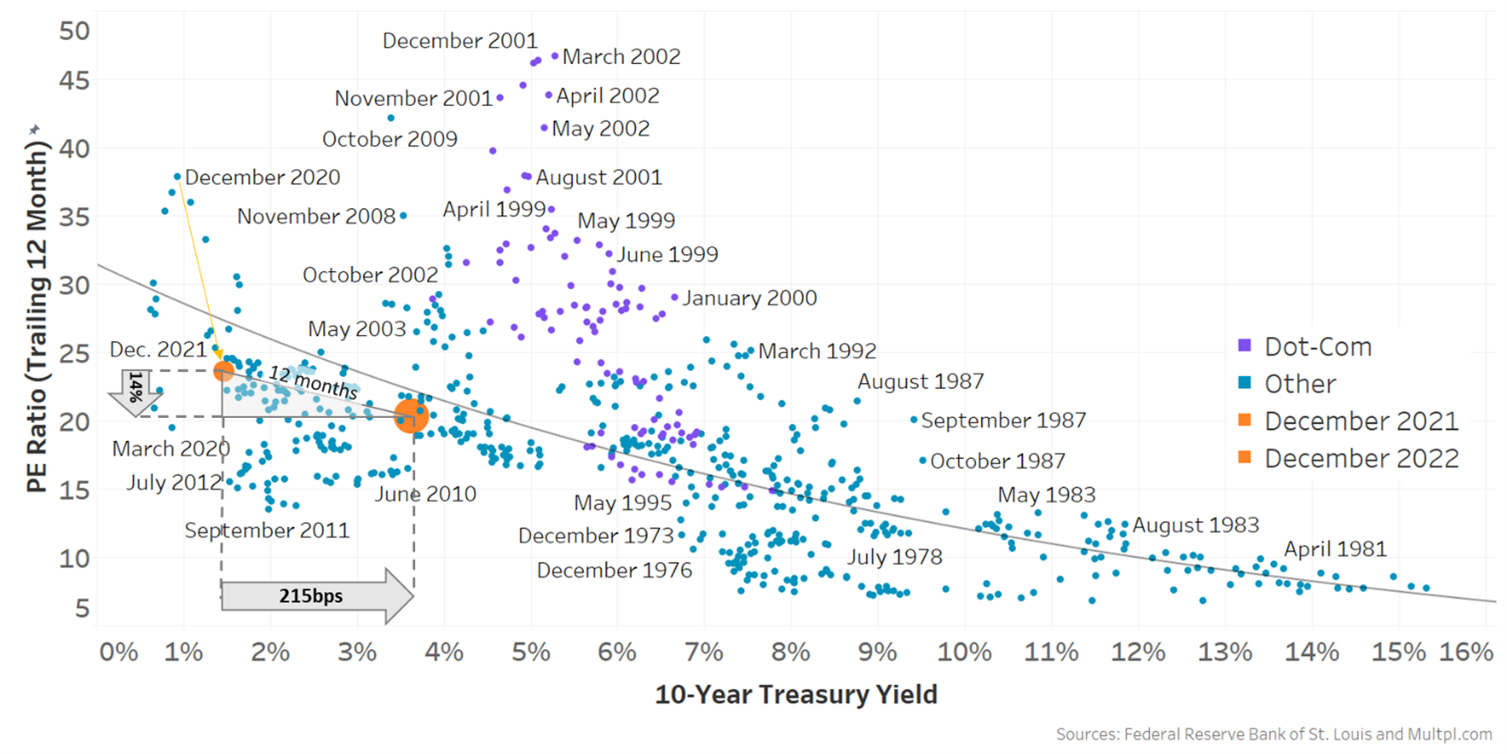
Prior to 1999, “many of the early winners in the dot-com cycle had already started to falter and, as we came into the market peak for the Nasdaq (INDEX: NDX) in March of 2000, the Nasdaq was much higher and the market was much more narrow,” Green says. “This is 2021 into 2022.” Green adds that the S&P 500 (INDEX: SPX) correction didn’t begin until late-2000, and the homebuilder- and energy-type stocks were the ones that outperformed, as we saw in 2022.

Ultimately, a recession hit in 2001, and credit deteriorated, Green explains, revealing fraud among many high-flyers of the dot-com boom. Many were unprepared, Green adds, drawing parallels to 2022 events concerning the likes of FTX.

Graphic: Retrieved from WSJ Market Data Group.

In 2023 and beyond, Green thinks the economy and markets are set for a bumpy ride. He projects that rising interest rates cause pain for businesses that received a stay of execution in 2020 through PPP loans and subsidized borrowing.

“Many of them put in two- or three-year paper as a stopgap,” he explains. Now, due to the higher rate environment, “companies can’t refinance, so we’re seeing Blackstone Inc (NYSE: BX) and Brookfield Corp (NYSE: BN) hand in keys.”

As put in yesterday’s letter, the deterioration in markets has, in part, been “offset by a lack of inventory,” as well as the hesitancy to sell (i.e., lack of supply). However, the marginal impact of one new person “in distress … [may] set a new clearing price” that changes valuations for everybody. Green says that investors know supply will cause markets to weaken, and that is why products like Bitcoin (CRYPTO: BTC) are intact.

“If we tie up stuff in bankruptcy courts for the next three or four years, nothing will get done,” Green elaborates. “That’s part of what we’re seeing in the crypto space where part of the strength for Bitcoin is simply the absence of sellers as we navigate our way through bankruptcy on many of these entities.”

As an example, Voyager Digital Ltd (ex-OTC: VYGVF) claimants “desperately [sought] to submit a bid to prevent Bitcoin from having to be sold” because these sales would pressure prices and “increase the damage across the entire crypto universe.”

relates to Fed Minutes Show Three Weeks Is a Long Time
Graphic: Retrieved from Bank of America (NYSE: BAC) via Bloomberg.

Green went on to add his firm objection to Federal Reserve’s (Fed) policy choices noting that deterioration is threatening the “commercial real estate bubble … and residential real estate” currently afloat on a “lack of inventory.”

The “multiplier effect” will be a serious challenge for markets; monetary policy drives fiscal policy and this has an impact elsewhere on geopolitics, manufacturing, and so on (e.g., the cost of interest rates offset by credits to households, the relocation and addition of manufacturing at home and outside of China), which only serves to boost inflation over the short term and further complicate things for the Fed.

Positioning

With data very unreliable and markets fearful of a 2020-like decline, 2022 was a far more orderly year than expected.

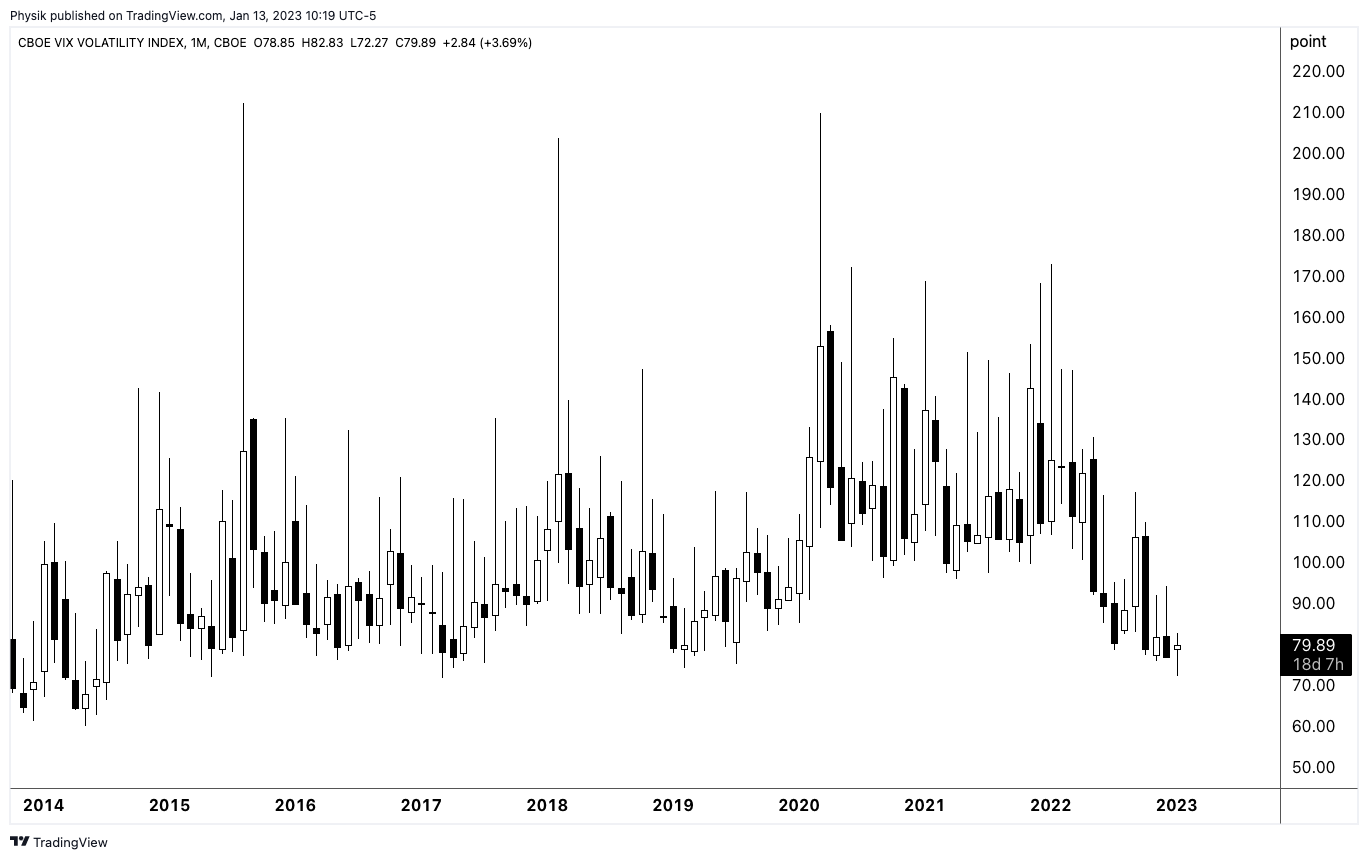
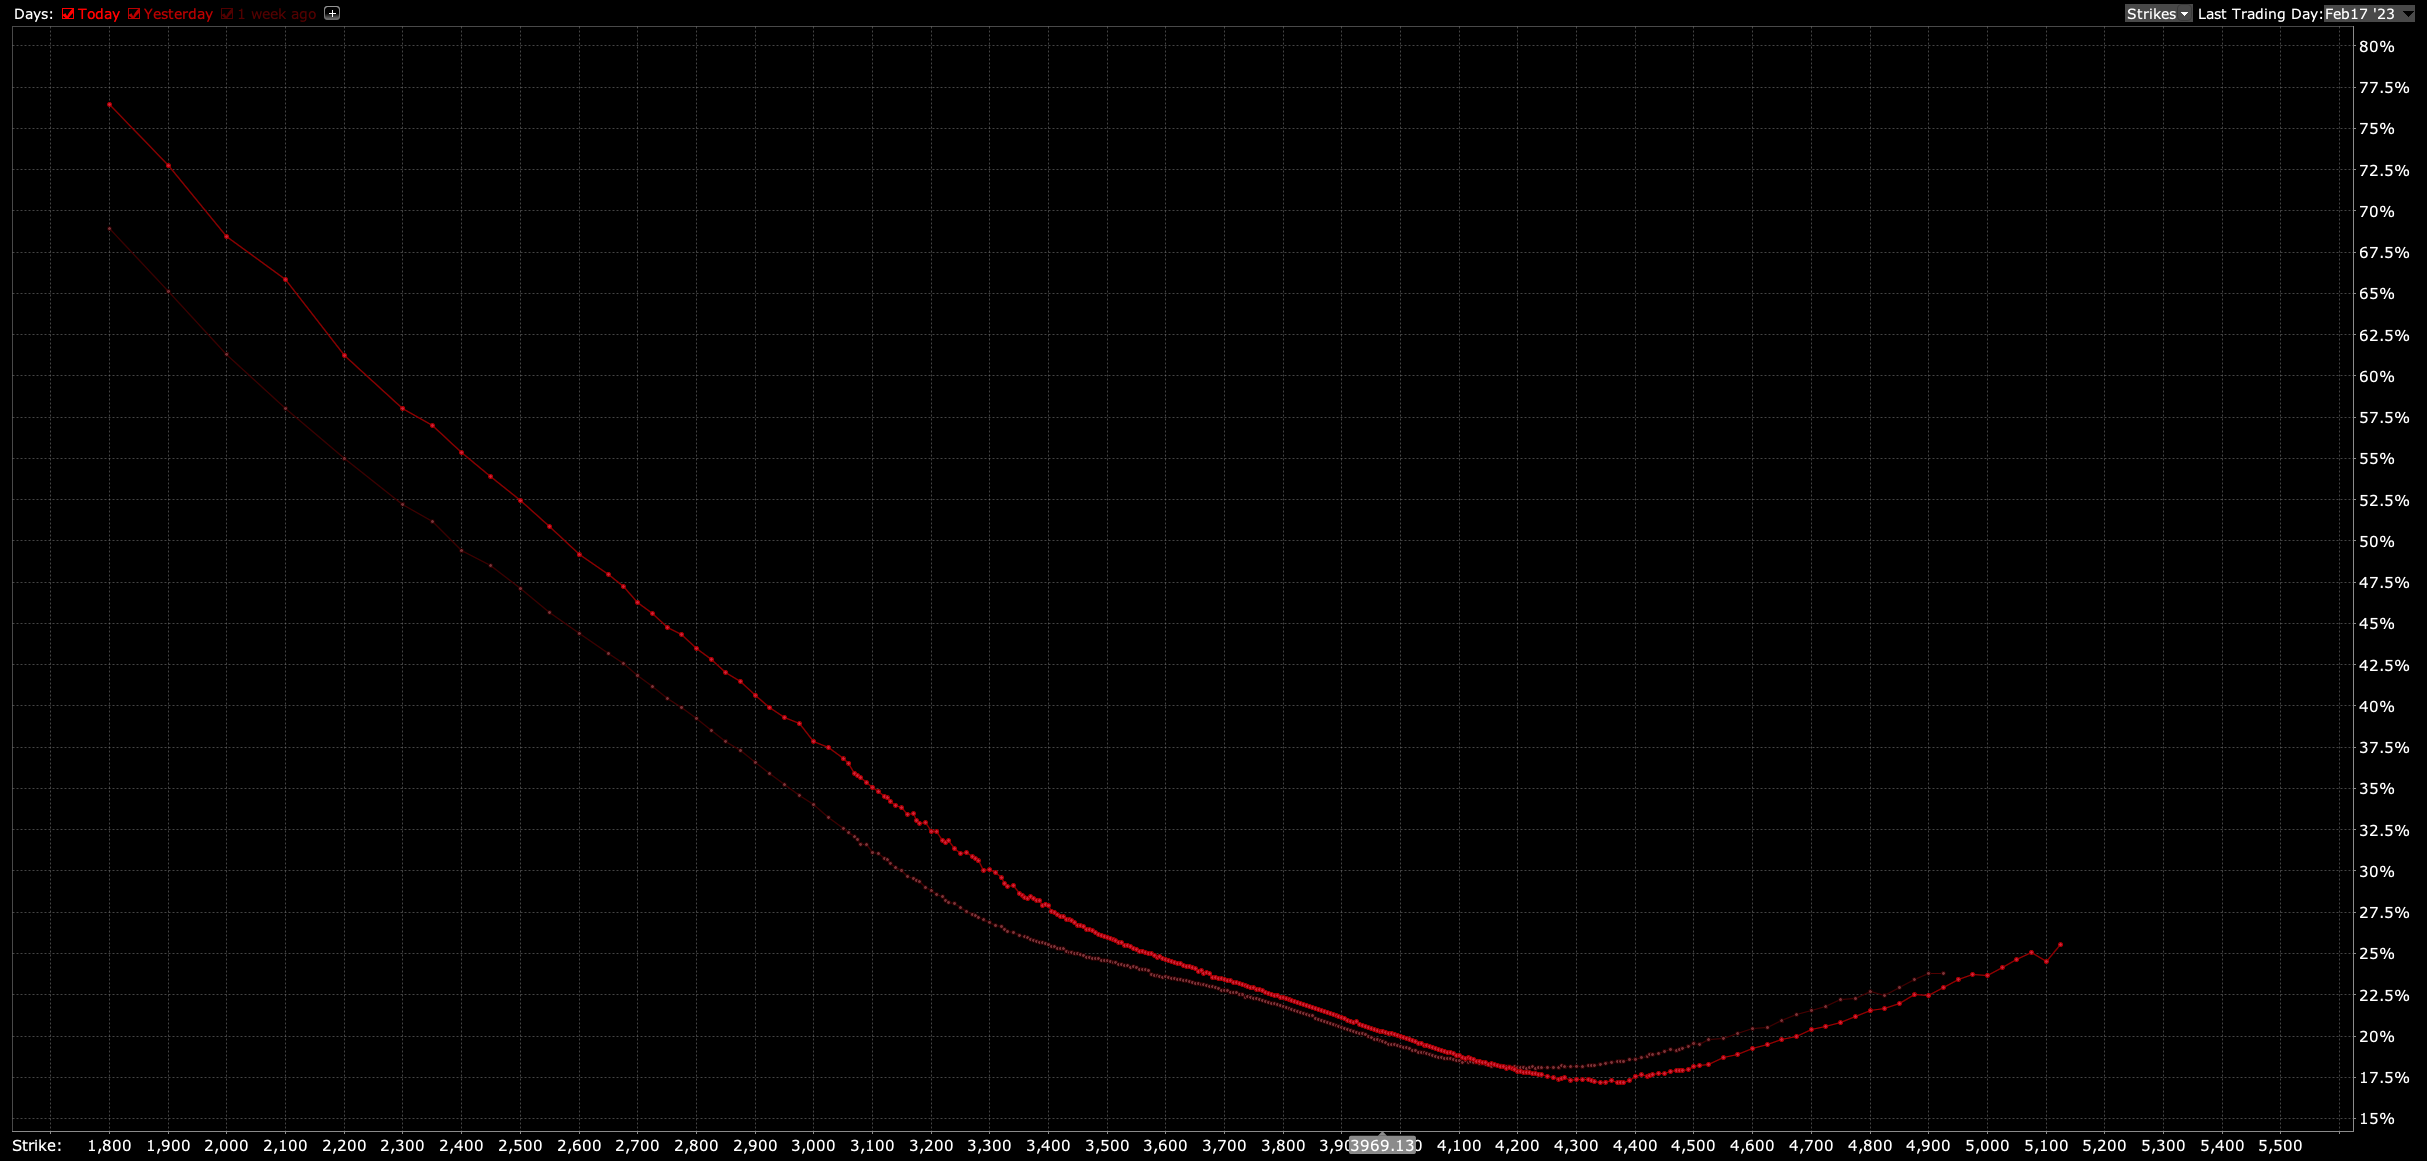
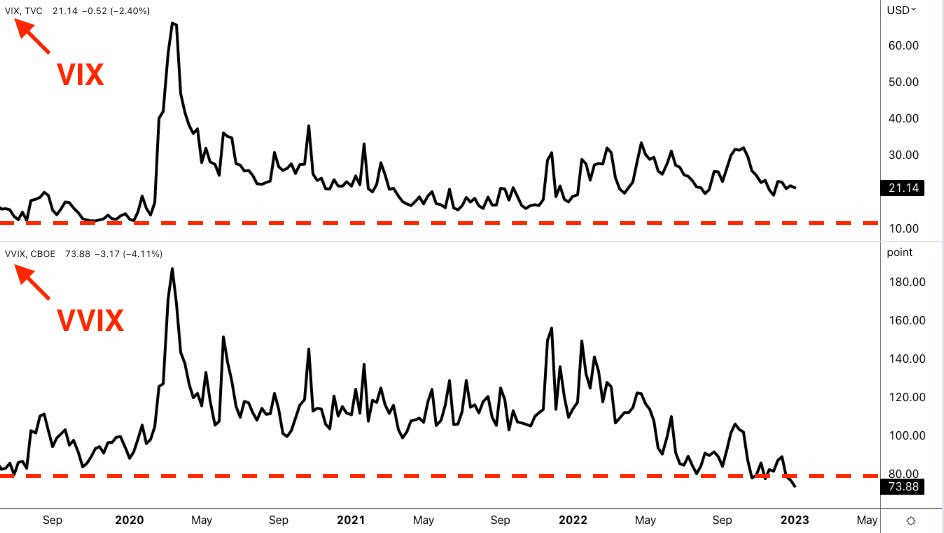
“I think people were extremely well-hedged,” he explains. “There was a tremendous amount of exposure that had been purchased for deep out-of-the-money, relatively long-dated [put options], and that created conditions under which the volatility surface, beyond six months, was extremely elevated heading into 2022.”

Green says one-year variance swaps and implied volatility (IVOL) on at-the-money S&P 500 puts was “in the neighborhood of 25-30%, … which is very expensive … [and this] implies a level of daily price movement that is difficult to achieve.”

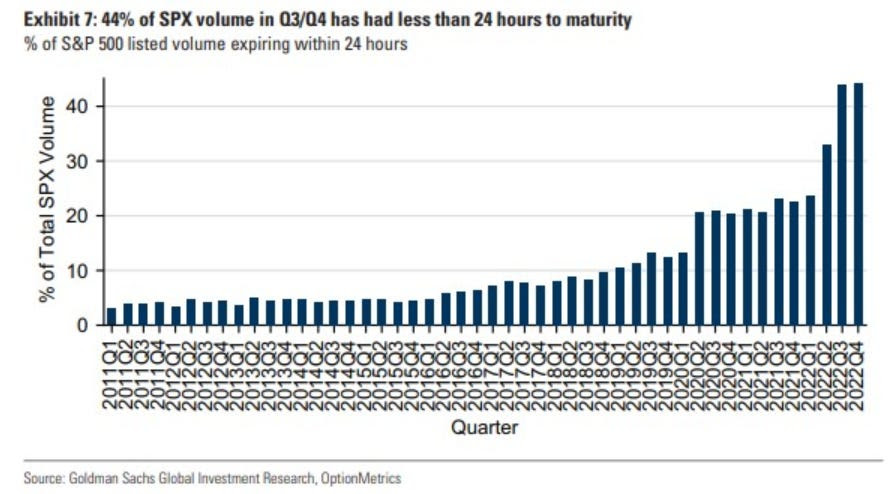
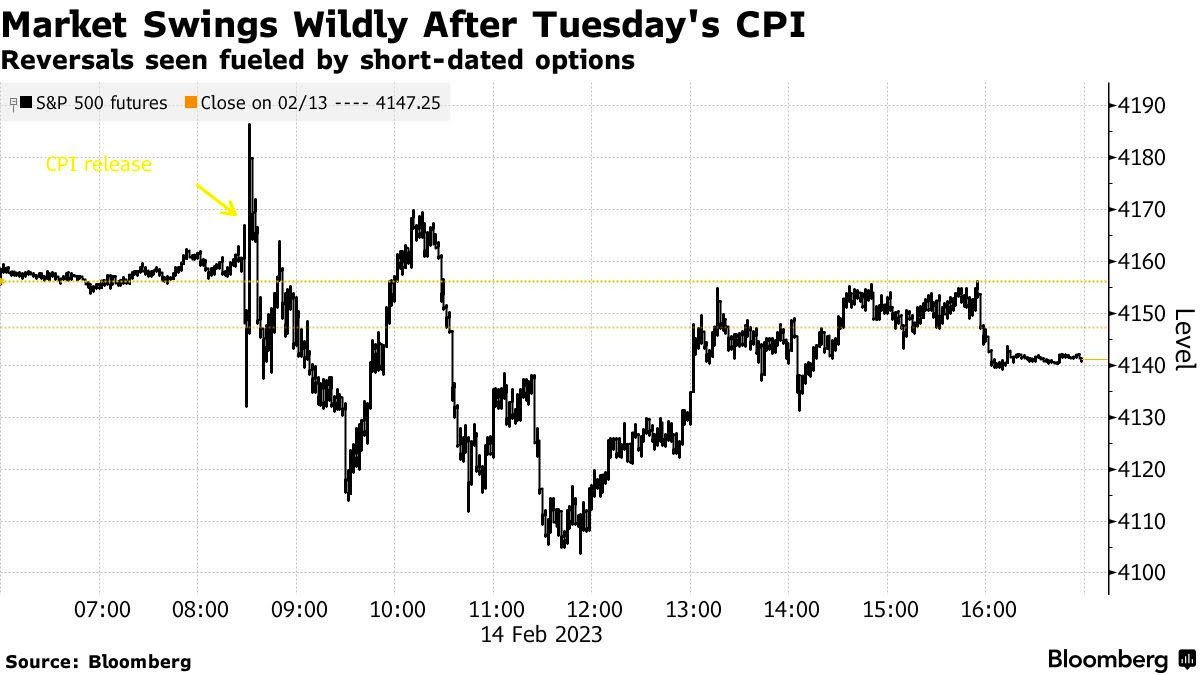
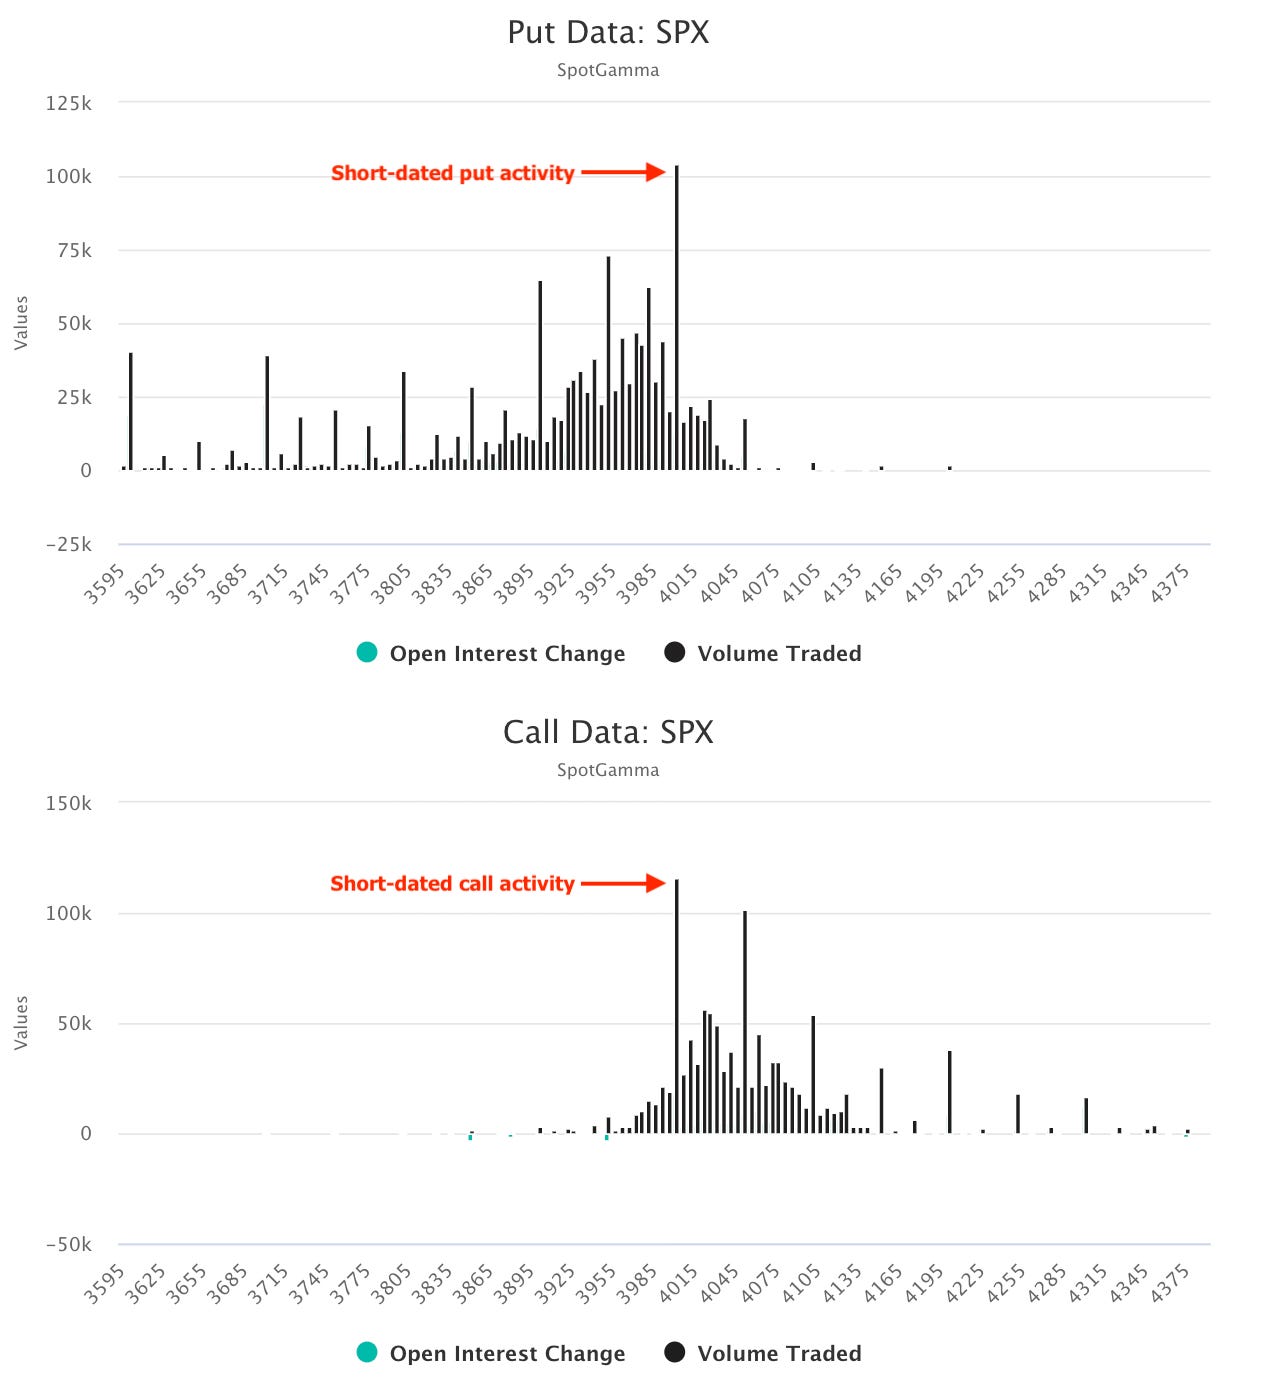
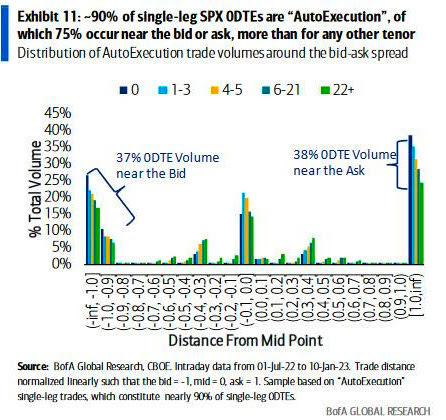
Consequently, investors’ hedges did not work. Green adds that “having learned their lesson from 2022, people have by and large abandoned those types of hedges and have instead moved, even as skew moves to near-record cheapness, … to spreads” and shorter-dated options (e.g., 0 DTE).

relates to Clueless Wall Street Is Racing to Size Up Zero-Day Options Boom
Graphic: Retrieved from Goldman Sachs Group Inc (NYSE: GS) via Bloomberg.

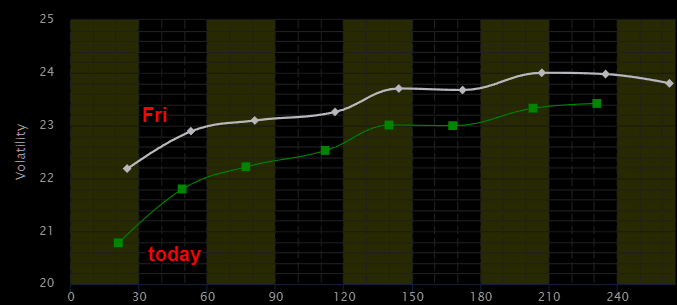
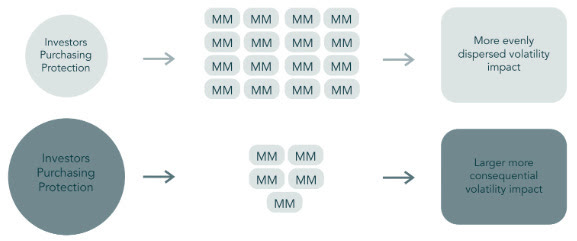
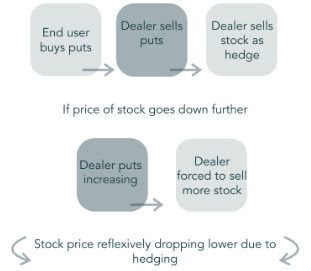
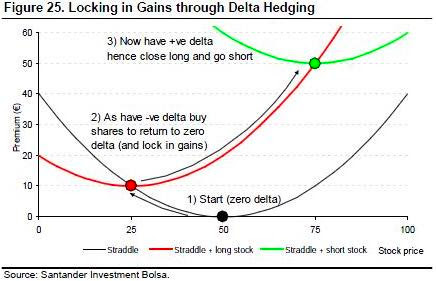
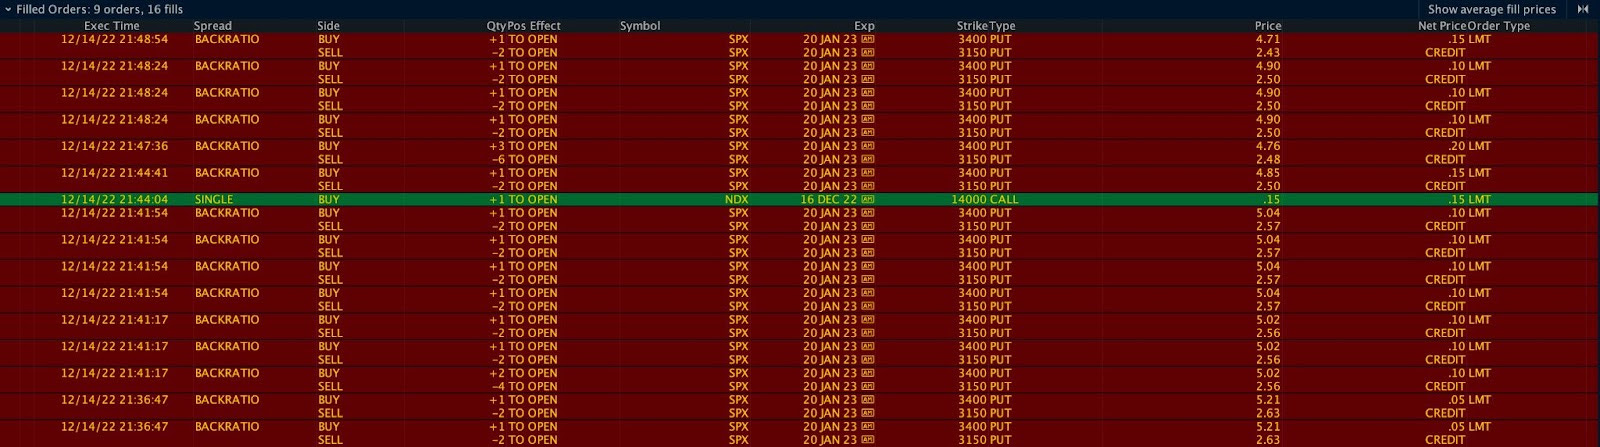
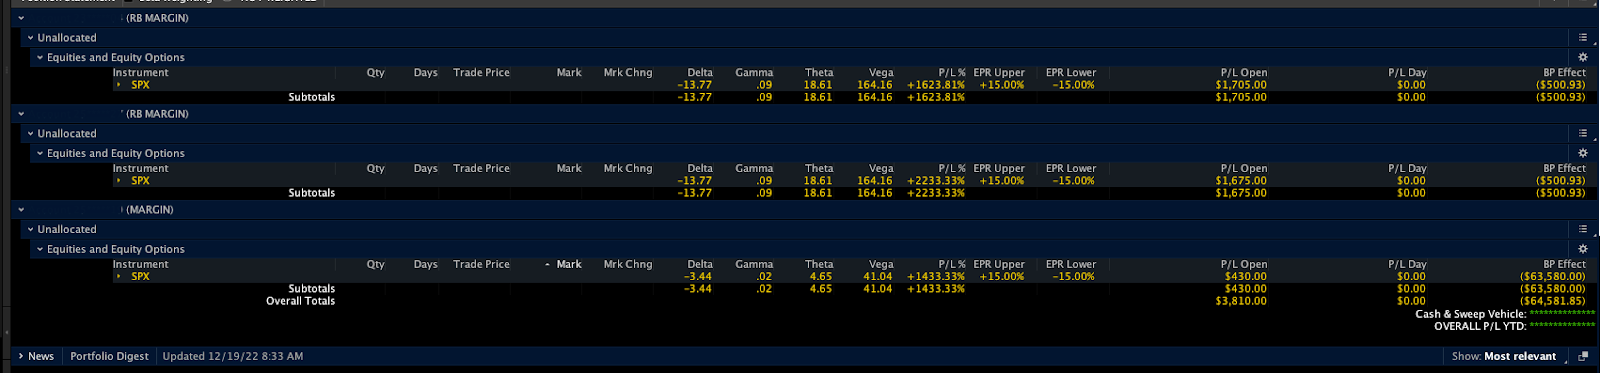
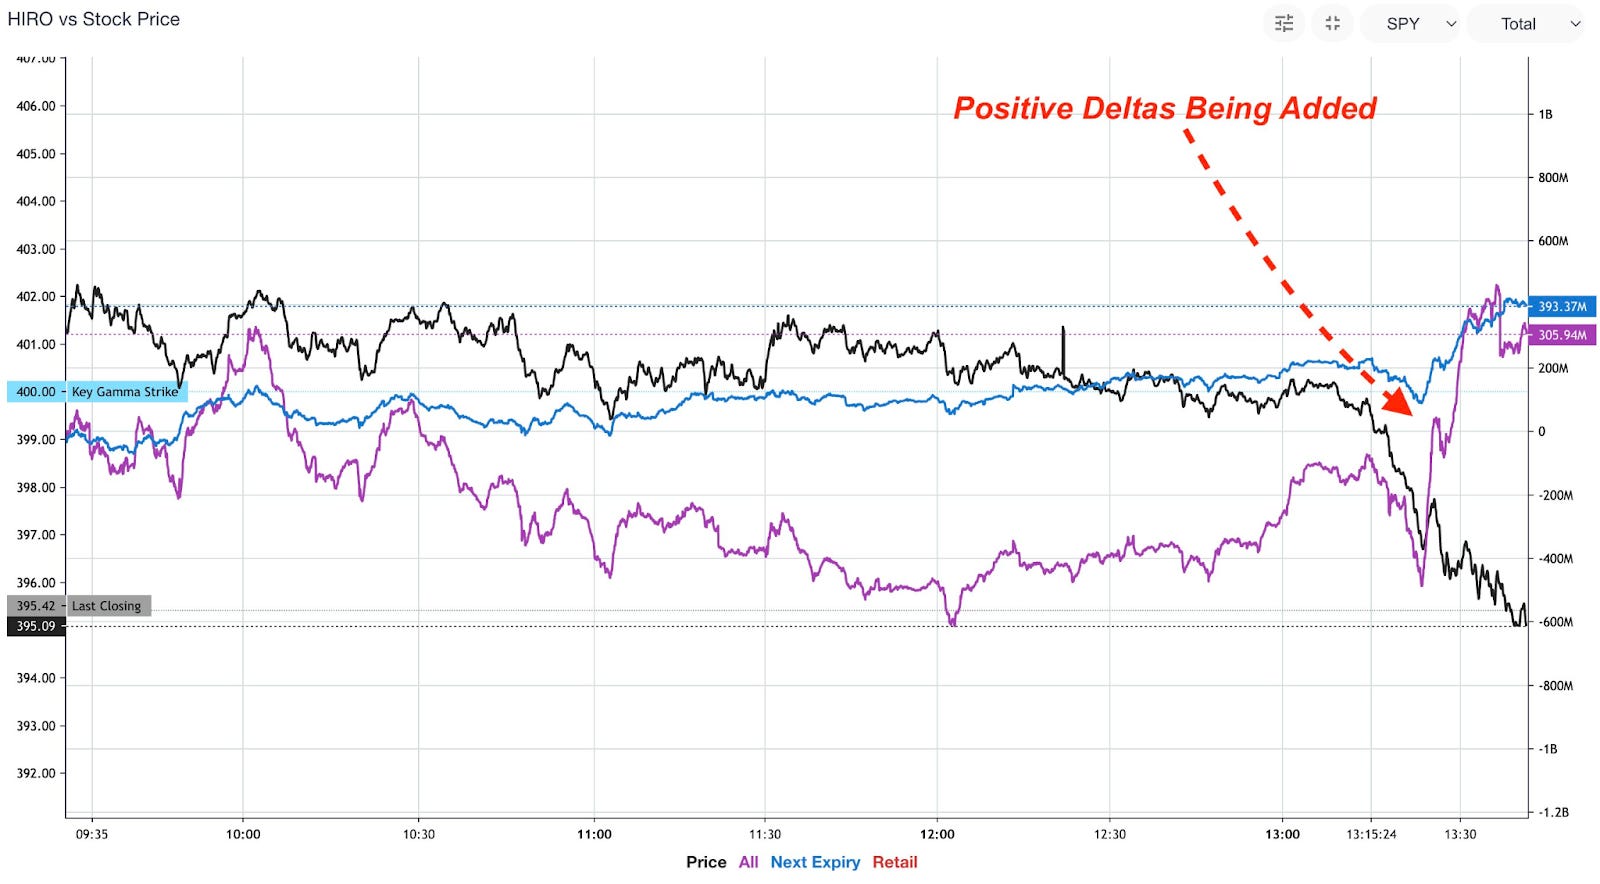
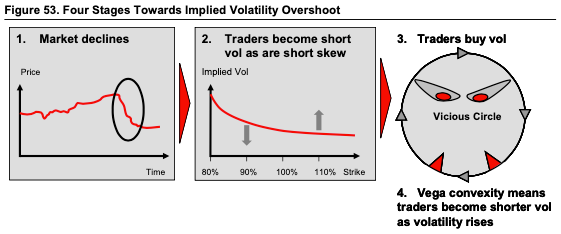
With a vast majority of these shorter-dated options exposures held short by investors, this creates conditions of suppressed volatility that can last; dealers own volatility and in hedging that, they promote mean reversion-type activity (i.e., instead of institutions writing calls against long exposure out one-month, they are writing calls against long exposure out one-day, and this supply of options has dealers pressuring the market on their initial hedging and supporting the market on later re-hedging) over the very short-term. In other words, when investors sell those calls, the dealer receives them and sells futures to hedge. This “pressures the market lower which causes … the delta of that option or replicating exposure to decline and, now, the dealers have to buy back that exposure and push the markets upward,” later, because the risk they are exposed to by that exposure has declined (i.e., lower delta). See the image below.

Graphic: Retrieved from Bank of America Corporation (NYSE: BAC).

This options activity may become problematic. If there is a gap, investors’ “scramble to hedge those positions” may lead to even larger movement, given that the market “is not prepared to provide liquidity,” generally speaking.

Green suggests that investors can side-step a lot of the turmoil by allocating some or all of their portfolio to bonds. Any cash remaining could be used to amplify portfolio returns in a fixed-risk manner (e.g., buy bond and SPX options and options spreads).

More detail to come in the next sessions. Hope you enjoyed this (rushed) letter.

Technical

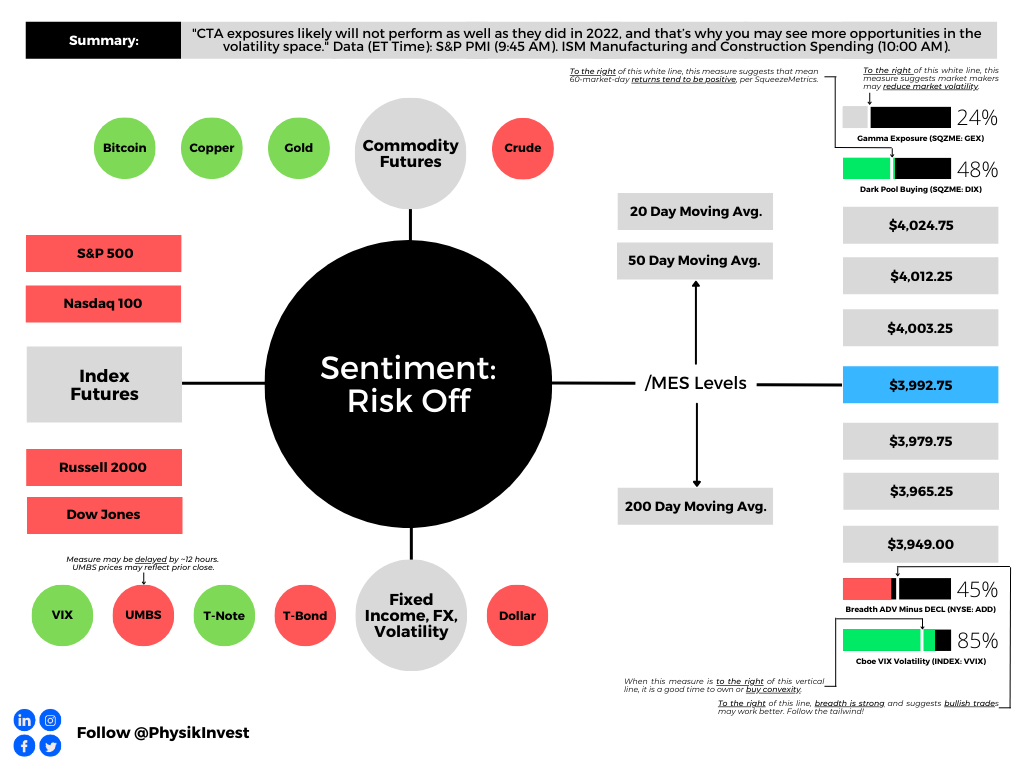
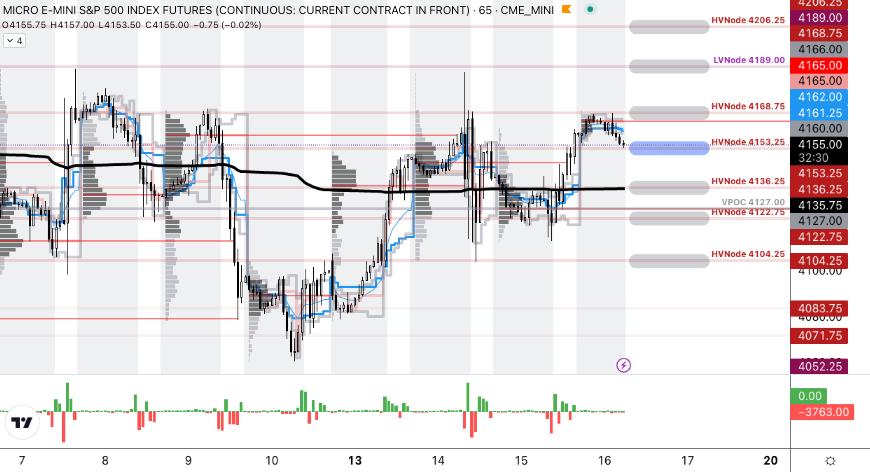
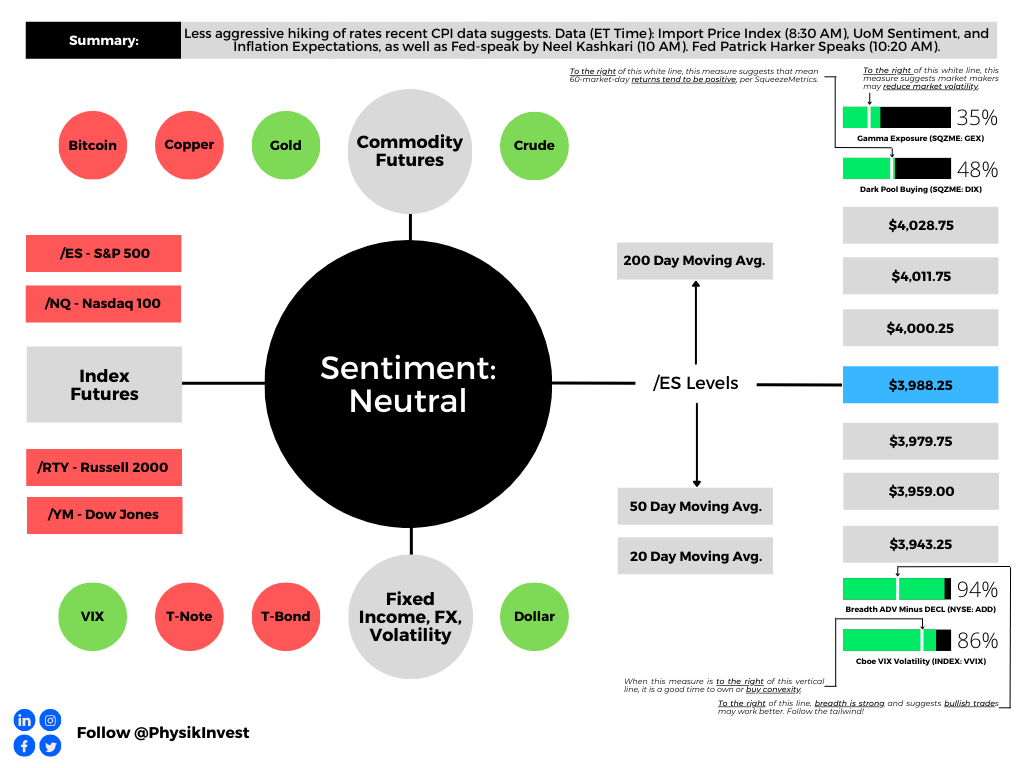
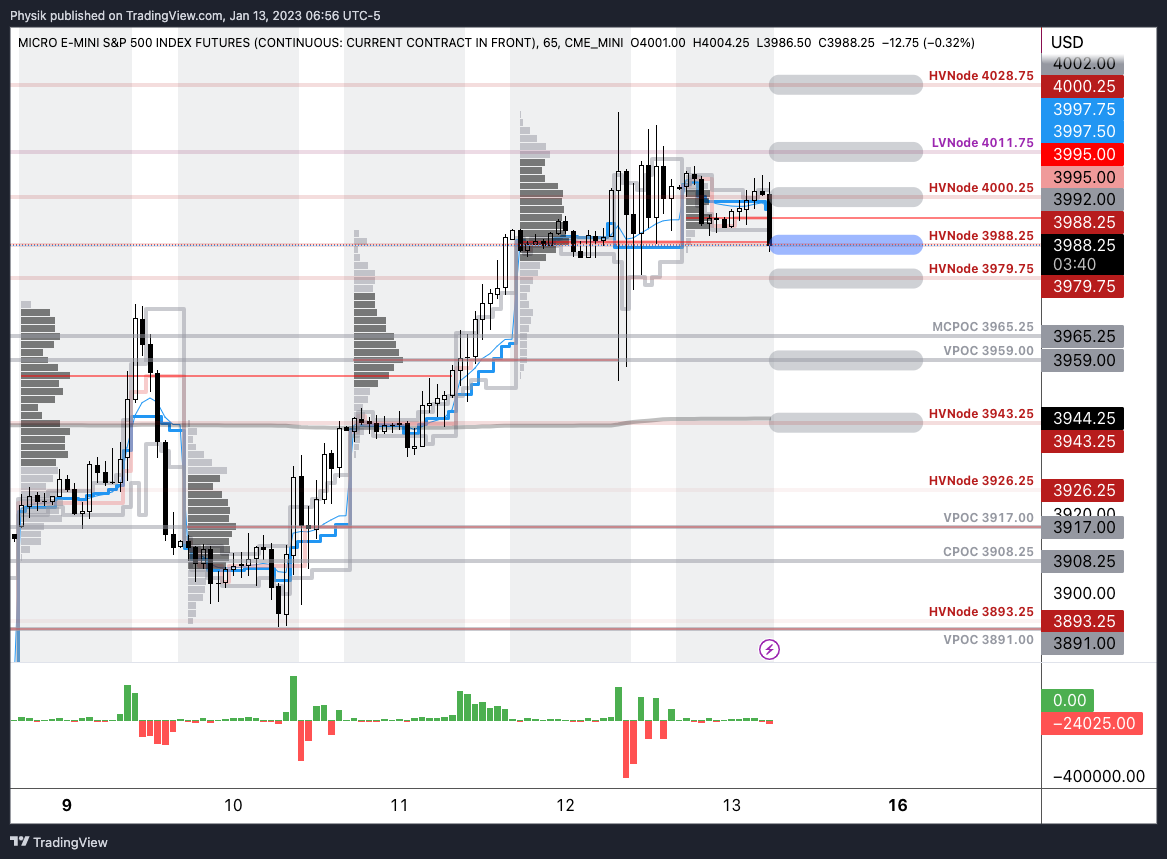
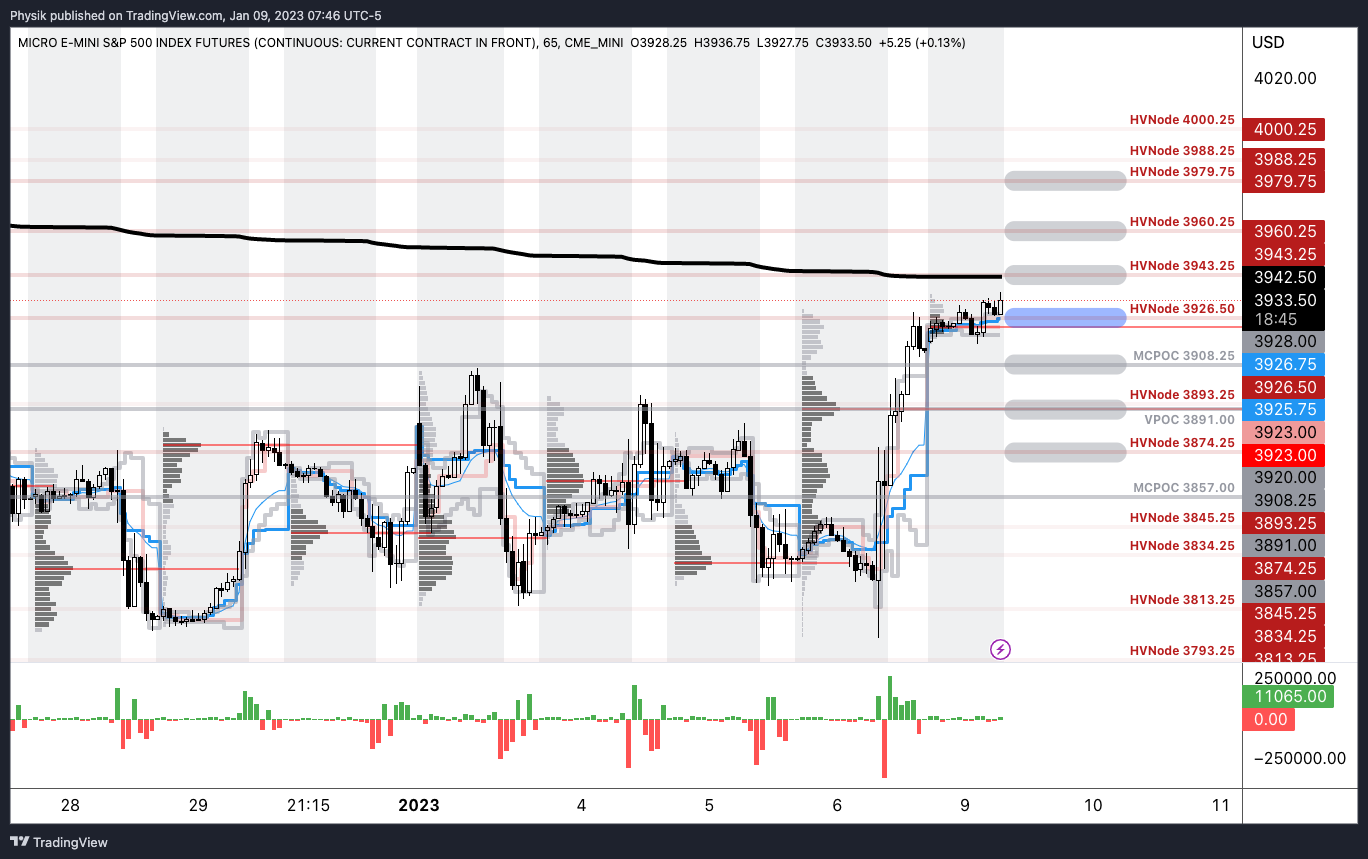
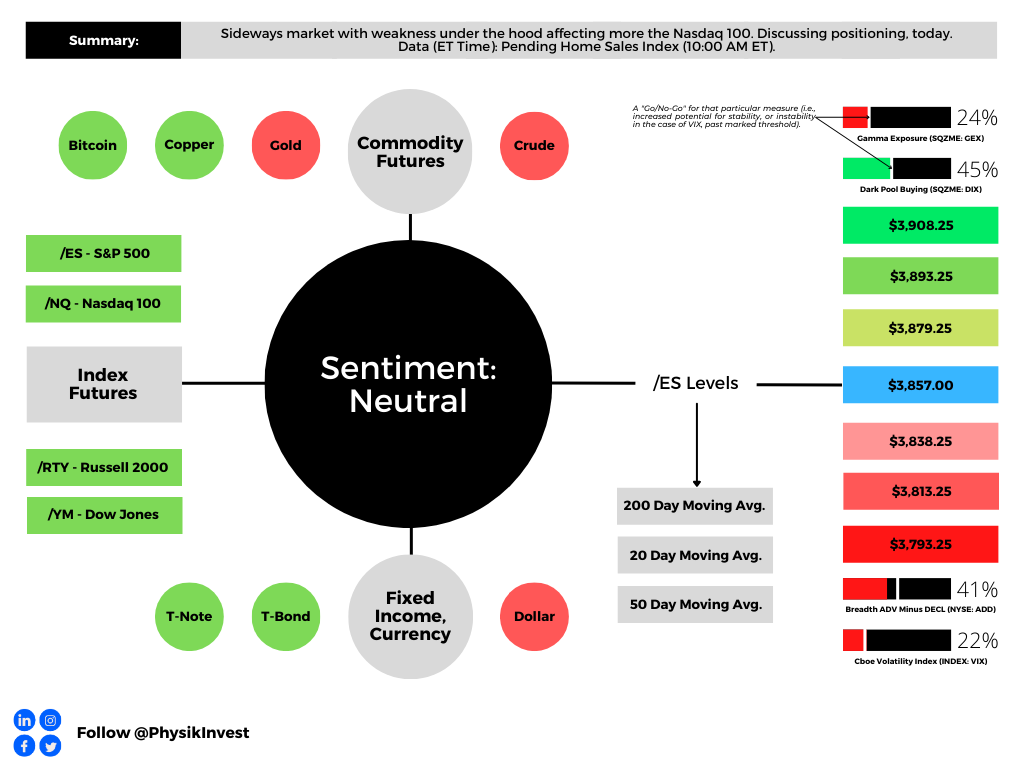
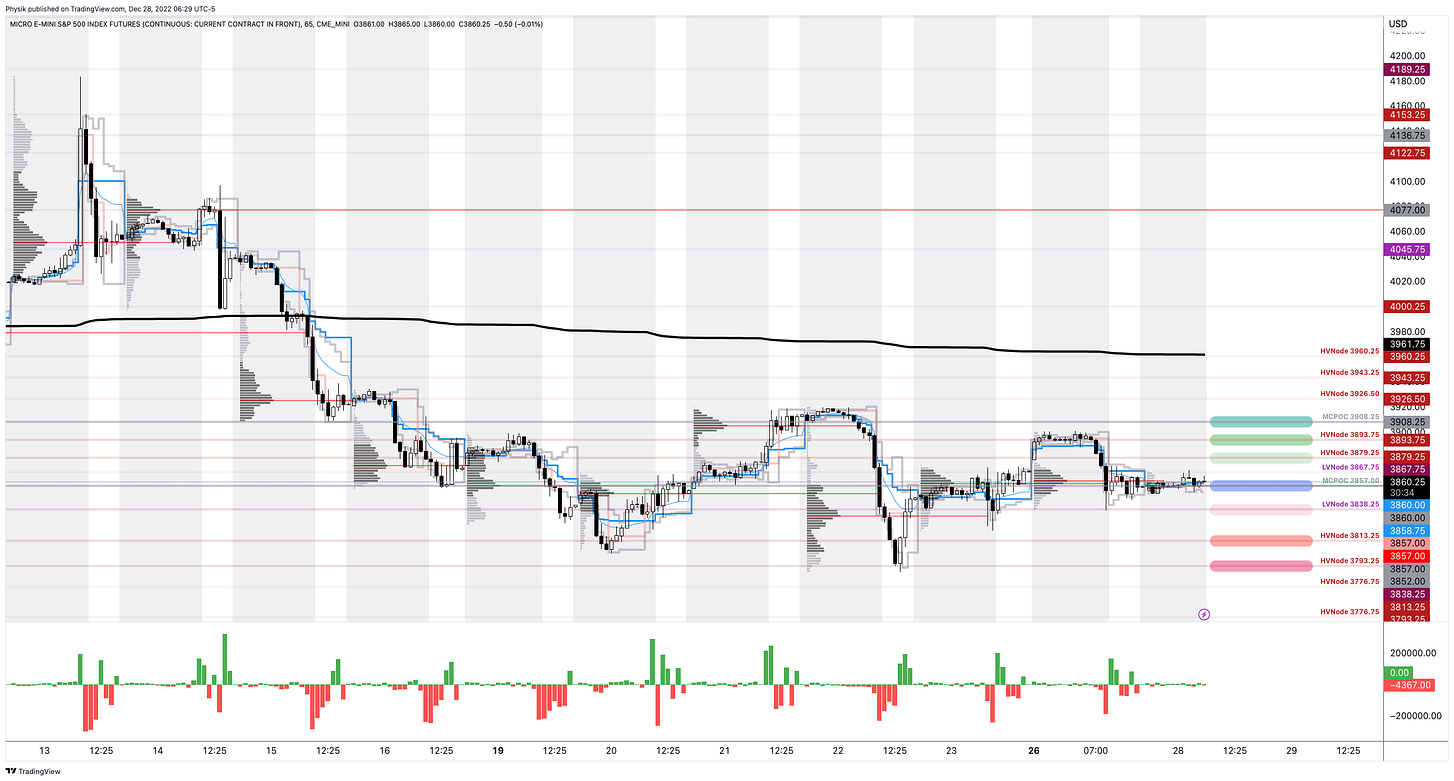
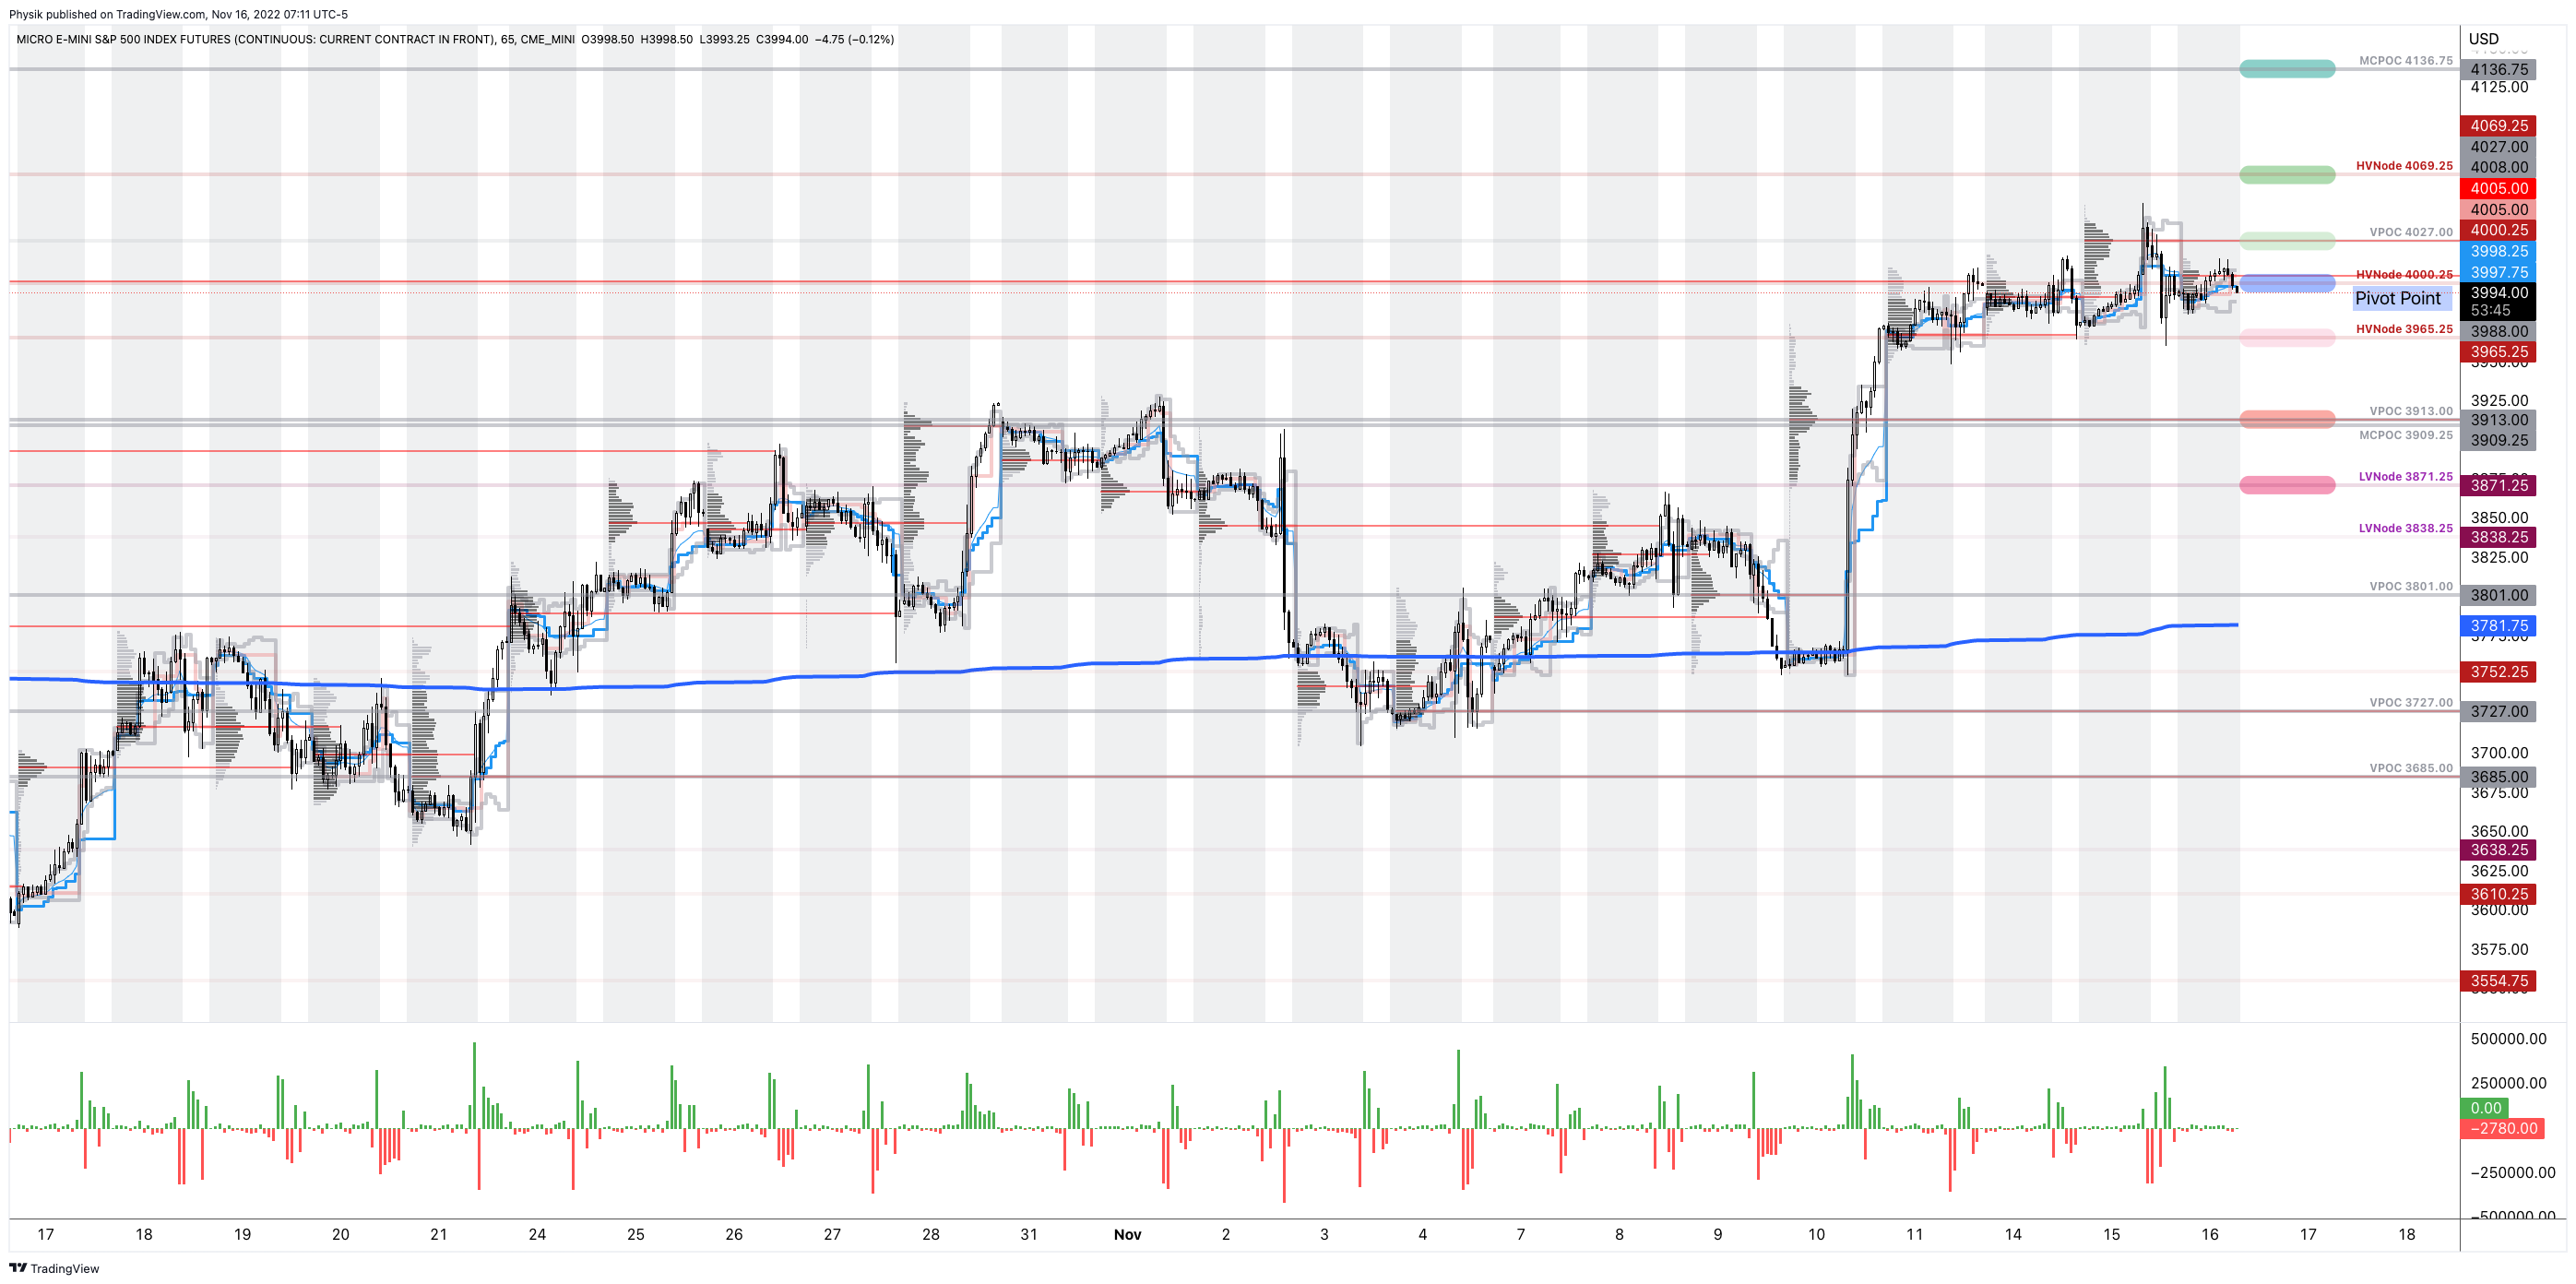
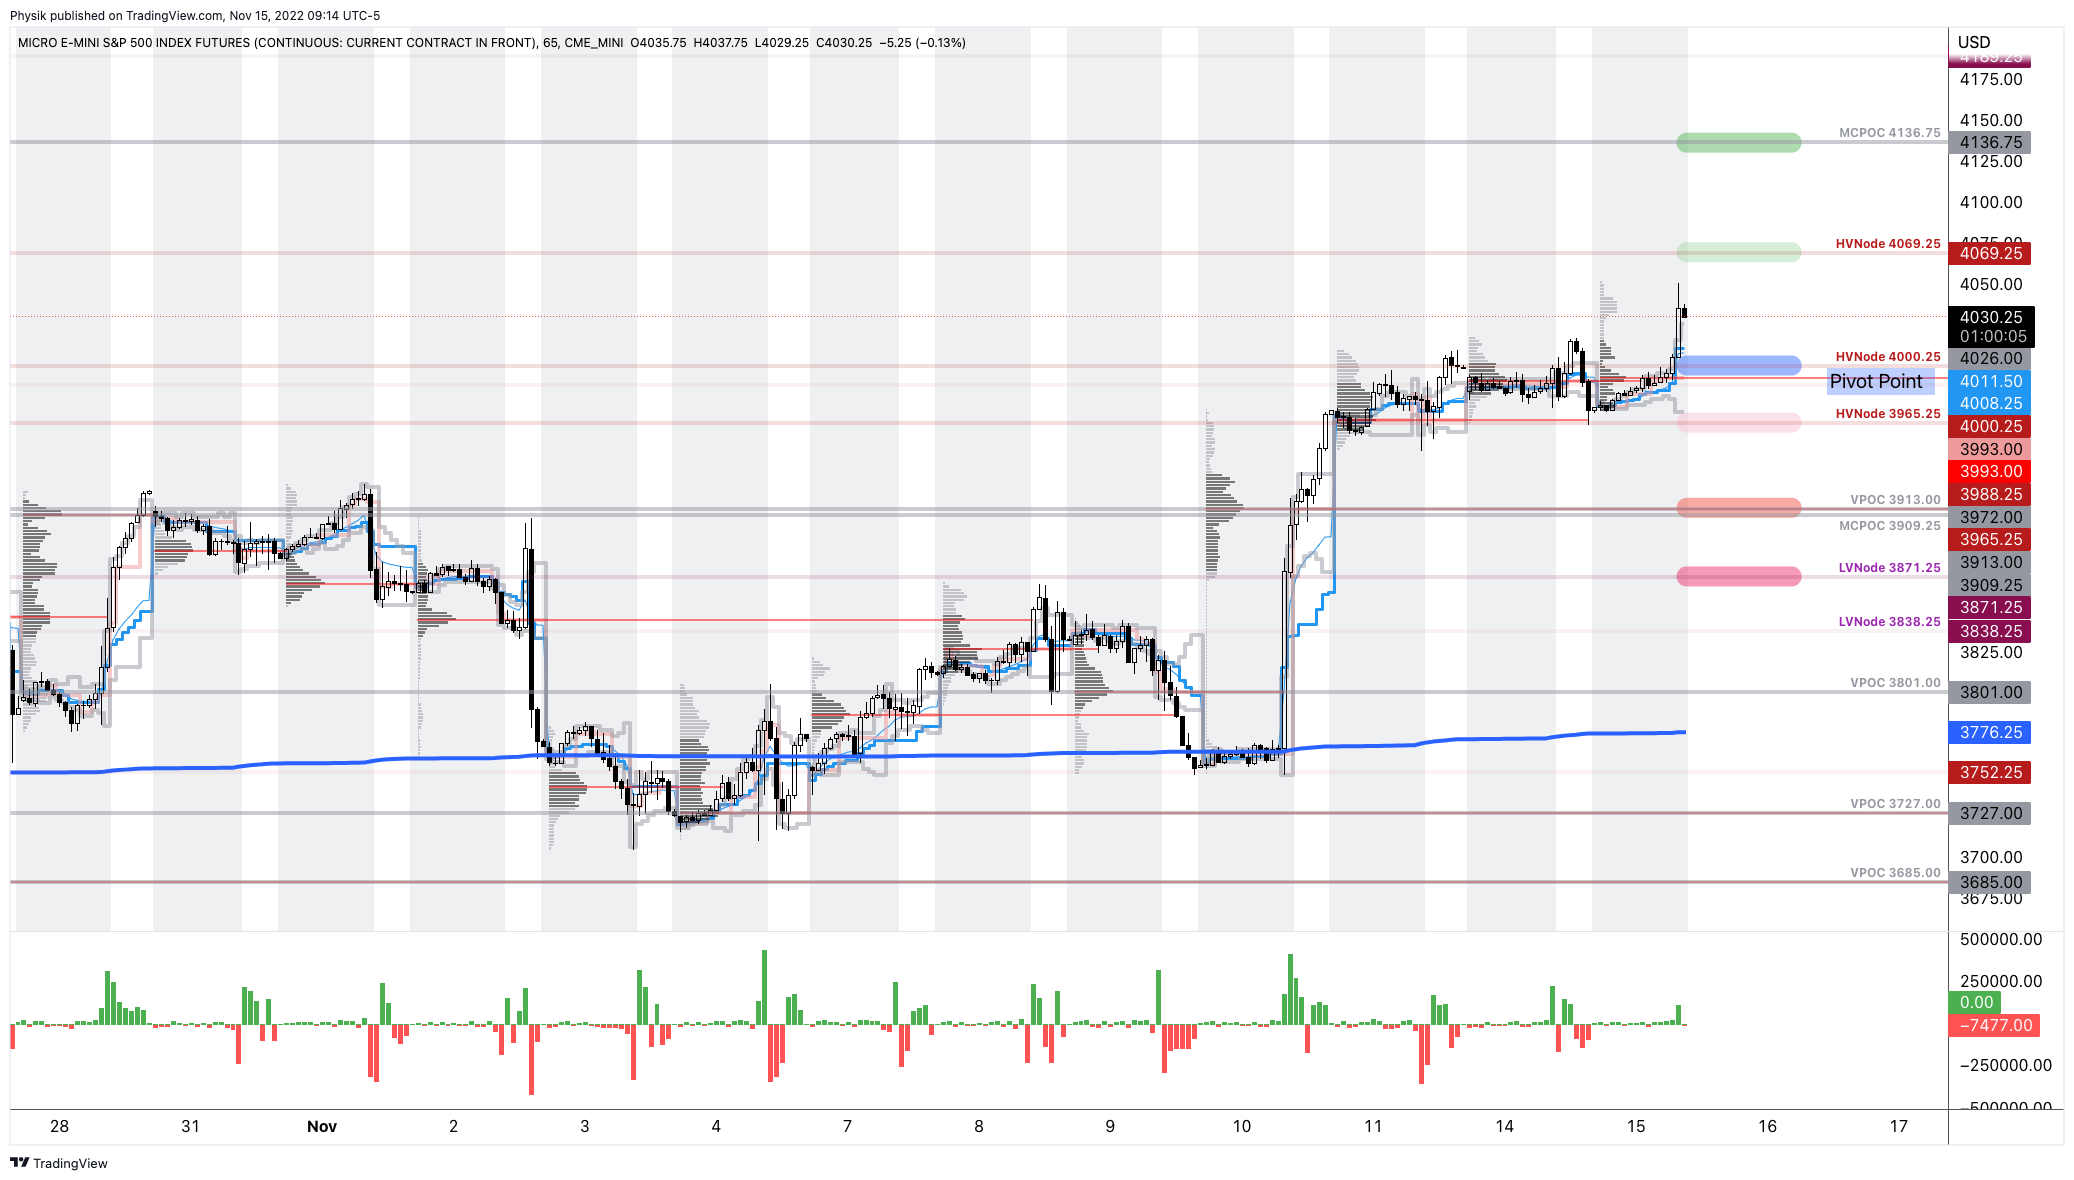
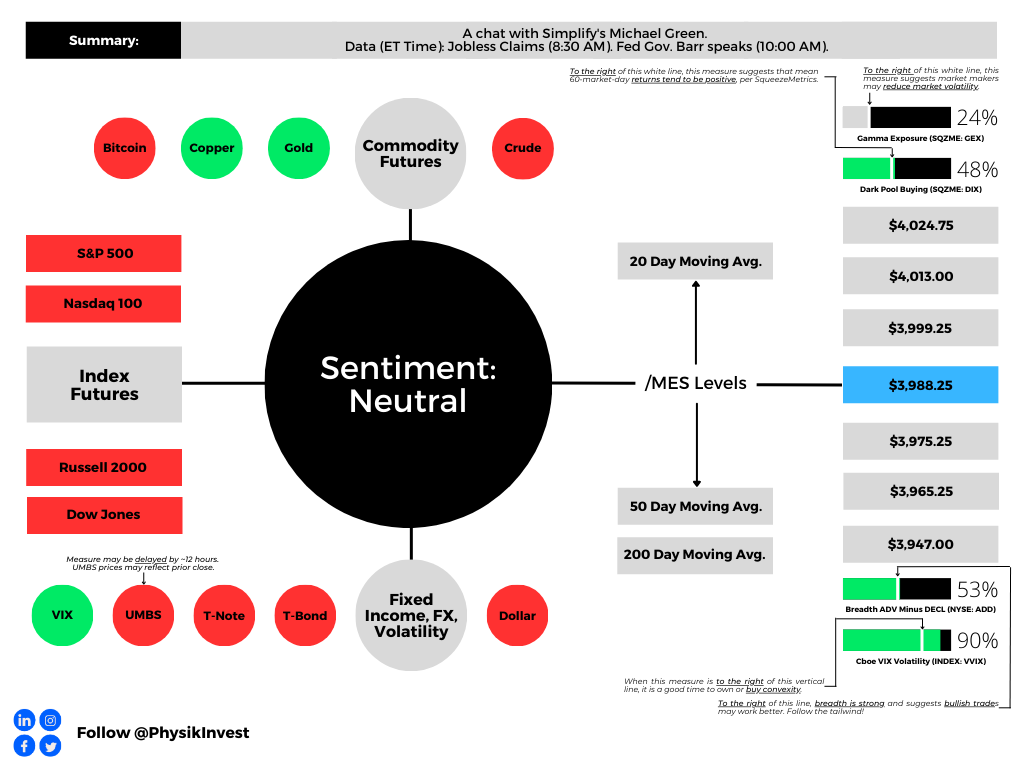
As of 8:30 AM ET, Thursday’s regular session (9:30 AM – 4:00 PM ET), in the S&P 500, is likely to open in the lower part of a negatively skewed overnight inventory, inside of the prior day’s range, suggesting a limited potential for immediate directional opportunity.

The S&P 500 pivot for today is $3,988.25. 

Key levels to the upside include $3,999.25, $4,013.00, and $4,024.75.

Key levels to the downside include $3,975.25, $3,965.25, and $3,947.00.

Disclaimer: Click here to load the updated key levels via the web-based TradingView platform. New links are produced daily. Quoted levels likely hold barring an exogenous development.

Graphic: 65-minute profile chart of the Micro E-mini S&P 500 Futures.

About

The author, Renato Leonard Capelj, spends the bulk of his time at Physik Invest, an entity through which he invests and publishes free daily analyses to thousands of subscribers. The analyses offer him and his subscribers a way to stay on the right side of the market. 

Separately, Capelj is an accredited journalist with past works including interviews with investor Kevin O’Leary, ARK Invest’s Catherine Wood, FTX’s Sam Bankman-Fried, North Dakota Governor Doug Burgum, Lithuania’s Minister of Economy and Innovation Aušrinė Armonaitė, former Cisco chairman and CEO John Chambers, and persons at the Clinton Global Initiative.

Connect

Direct queries to renato@physikinvest.com. Find Physik Invest on TwitterLinkedInFacebook, and Instagram. Find Capelj on TwitterLinkedIn, and Instagram. Only follow the verified profiles.

Calendar

You may view this letter’s content calendar at this link.

Disclaimer

Do not construe this newsletter as advice. All content is for informational purposes. Capelj and Physik Invest manage their own capital and will not solicit others for it.

Categories
Commentary

Daily Brief For March 1, 2023

Physik Invest’s Daily Brief is read free by thousands of subscribers. Join this community to learn about the fundamental and technical drivers of markets.

Graphic updated 9:25 AM ET. Sentiment Risk-Off if expected /MES open is below the prior day’s range. /MES levels are derived from the profile graphic at the bottom of this letter. Click here for the latest levels. SqueezeMetrics Dark Pool Index (DIX) and Gamma (GEX) with the latter calculated based on where the prior day’s reading falls with respect to the MAX and MIN of all occurrences available. A higher DIX is bullish. The lower the GEX, the more (expected) volatility. Click to learn the implications of volatility, direction, and moneyness. Breadth reflects a reading of the prior day’s NYSE Advance/Decline indicator. The CBOE VIX Volatility Index (INDEX: VVIX) reflects the attractiveness of owning volatility. UMBS prices via MNDClick here for the economic calendar.

Administrative

Pardon, the delay. Also, the levels in this letter are a little messy to the downside. Too many confluences. Will clear them up over the coming days. Have a great day!

Fundamental

In the face of contrarian economic indications, based on CME Group Inc’s (NASDAQ: CME) FedWatch Tool, traders’ activity in the Fed Fund Futures shows the terminal rate peaking at 5.25-5.50%. Expectations for easing are pushed out to 2024, though at a less steep rate. This context, coupled with the prospects of slower economic growth, presents uninspiring realities for investors.

Graphic: Retrieved from CME Group Inc’s (NASDAQ: CME) FedWatch Tool.

Consequently, the equity-bond correlation break is set to persist.

Graphic: Retrieved from Credit Suisse Group AG (NYSE: CS).

Quoting a Bloomberg analysis of Credit Suisse’s Global Investment Returns Yearbook, “[b]onds, equities and real estate tend to be negatively correlated with inflation,” while “only commodities had a positive correlation, making them the only true hedge.”

However, commodities are “often susceptible to deep and lengthy drawdowns … in periods of disinflation” and falling growth expectations. Though commodities are a hedge against inflation, they aren’t a hedge against (rising odds of) recession.

Graphic: Retrieved from Credit Suisse Group AG (NYSE: CS).

So, interest rates are likely to rise and stay higher for longer. 

Graphic: Retrieved from Bridgewater Associates LP. “Nominal spending on services has continued to grow at a rapid clip of about 6% annualized. Real and nominal demand for goods has been gradually weakening. This shift in the mix of demand has implications. Services spending is an upward pressure on employment and wages, while weak goods demand has a more pronounced impact on listed company sales.”

Equities, which are particularly sensitive to interest rates, are likely to weaken despite economic and earnings growth which is set to fall (i.e., close to zero earnings growth).

Graphic: Retrieved January 5, 2023, from Nasdaq Inc’s (NASDAQ: NDAQ) Phil Mackintosh.

Quantitative tightening or QT (i.e., the flow of capital out of capital markets and an asset headwind), which has been offset by the running off of the Treasury General Account and injecting liquidity into markets (i.e., TGA runoff increases the room banks have to lend and finance trading activities) in the face of the debt ceiling issue, is set to accelerate and compound the rising rate impact.

Graphic: Via Physik Invest. Data compiled by @jkonopas623. Fed Balance Sheet data, here. Treasury General Account Data, here. Reverse Repo data, here. NL = BS – TGA – RRP.

In light of rates and QT risk asset headwind, as well as slowing growth and inflation headwind to bonds and commodities, how does one protect their portfolio? As The Ambrus Group’s Kris Sidial explains, “[e]ven if inflation continues, the rate at which it rises won’t be the same. Due to this, CTA exposures likely will not perform as well as they did in 2022, and that’s why you may see more opportunities in the volatility space … [where] we can get cheap exposure to convexity.”

Graphic: Retrieved from Bloomberg via Tier1Alpha. “[T]he correlation between bond yields and equities, has begun to turn higher from a negative level. Remember that a negative correlation between bond yields and equity prices means equities go lower as bond prices go lower, defeating the historical diversification benefits of a 60/40-type portfolio.  Historically, this rotation has been associated with a period of LOWER returns, but it’s important to emphasize that this is because these periods are associated with Fed-induced slowdowns. Whether 2023 follows the same pattern remains to be seen.”

Please refer to past letters for trade examples. Though such trades may not be as attractive to enter now, they are attractive to keep on for longer.

Graphic: Retrieved from Nomura Holdings Inc (NYSE: NMR). Downside trades are rather attractive now in the absence of hedging demands in longer-dated protection convex in price and volatility. Naive measures like the Cboe VIX Volatility (INDEX: VVIX), as well as the graphic above, allude to the little demands for convexity and a declining sensitivity of the VIX with respect to changes in share prices.

If, as Bridgewater Associates put it, there is another stage to tightening “marked either by an economic downturn or failure to meet the inflation target, prompting more tightening,” risk assets will perform poorly and this letter’s trade examples are likely to protect portfolios well until assets appear attractive enough to buy again.

Graphic: Retrieved from NDR via Macro Ops.

Positioning

SpotGamma explains that more of the same (i.e., back-and-forth consolidation and a grind higher or lower) can be expected until some macroeconomic catalysts solicit demand for upside or downside protection and, accordingly, counterparty hedging pressures catalyze a far-reaching movement. 

As an aside, “With IV at already low levels, the bullish impact of it falling further is weak, hence the SPX trending lower all the while IV measures (e.g., VIX term structure) have shifted markedly lower since last week. If IV was at a higher starting point, its falling would work to keep the market in a far more positive/bullish stance.”

Graphic: VIX Term Structure retrieved from VIX Central via The Market Ear.

Consequently, “if traders enter the market and demand protection, particularly that which is farther-dated, the bearish effect of rising IV will far outweigh the bullish effect of it falling. This will add to the underlying/fundamental pressure we see building via weak price action.”

Technical

As of 9:20 AM ET, Wednesday’s regular session (9:30 AM – 4:00 PM ET), in the S&P 500, is likely to open in the lower part of a positively skewed overnight inventory, outside of the prior day’s range, suggesting a potential for immediate directional opportunity.

The S&P 500 pivot for today is $3,965.25. 

Key levels to the upside include $3,979.75, $3,992.75, and $4,003.25.

Key levels to the downside include $3,949.00, $3,927.50, and $3,908.25.

Disclaimer: Click here to load the updated key levels via the web-based TradingView platform. New links are produced daily. Quoted levels likely hold barring an exogenous development.

Graphic: 65-minute profile chart of the Micro E-mini S&P 500 Futures.

Definitions

Volume Areas: Markets will build on areas of high-volume (HVNodes). Should the market trend for a period of time, this will be identified by a low-volume area (LVNodes). The LVNodes denote directional conviction and ought to offer support on any test.

If participants auction and find acceptance in an area of a prior LVNode, then future discovery ought to be volatile and quick as participants look to the nearest HVNodes for more favorable entry or exit.

POCs: Areas where two-sided trade was most prevalent in a prior day session. Participants will respond to future tests of value as they offer favorable entry and exit.

MCPOCs: Denote areas where two-sided trade was most prevalent over numerous sessions. Participants will respond to future tests of value as they offer favorable entry and exit.


About

The author, Renato Leonard Capelj, works in finance and journalism.

Capelj spends the bulk of his time at Physik Invest, an entity through which he invests and publishes free daily analyses to thousands of subscribers. The analyses offer him and his subscribers a way to stay on the right side of the market. Separately, Capelj is an options analyst at SpotGamma and an accredited journalist.

Capelj’s past works include conversations with investor Kevin O’Leary, ARK Invest’s Catherine Wood, FTX’s Sam Bankman-Fried, North Dakota Governor Doug Burgum, Lithuania’s Minister of Economy and Innovation Aušrinė Armonaitė, former Cisco chairman and CEO John Chambers, and persons at the Clinton Global Initiative.

Connect

Direct queries to renato@physikinvest.com. Find Physik Invest on TwitterLinkedInFacebook, and Instagram. Find Capelj on TwitterLinkedIn, and Instagram. Only follow the verified profiles.

Calendar

You may view this letter’s content calendar at this link.

Disclaimer

Do not construe this newsletter as advice. All content is for informational purposes. Capelj and Physik Invest manage their own capital and will not solicit others for it.

Categories
Commentary

Daily Brief For February 16, 2023

Physik Invest’s Daily Brief is read by thousands of subscribers. You, too, can join this community to learn about the fundamental and technical drivers of markets.

Graphic updated 6:15 AM ET. Sentiment Neutral if expected /ES open is inside of the prior day’s range. /ES levels are derived from the profile graphic at the bottom of this letter. Click here for the latest levels. SqueezeMetrics Dark Pool Index (DIX) and Gamma (GEX) with the latter calculated based on where the prior day’s reading falls with respect to the MAX and MIN of all occurrences available. A higher DIX is bullish. At the same time, the lower the GEX, the more (expected) volatility. Click to learn the implications of volatility, direction, and moneyness. Breadth reflects a reading of the prior day’s NYSE Advance/Decline indicator. The CBOE VIX Volatility Index (INDEX: VVIX) reflects the attractiveness of owning volatility. UMBS price via MNDClick here for the calendar.

Positioning

In the news is quite a bit of noise surrounding ultra-short-dated options with little time to expiry. To quote Nomura Holdings Inc’s (NYSE: NMR) Charlie McElligott, the trading of these options is adding noise; “US equities are such an untradable mess right now.” 

However, your letter writer, who mainly trades complex spreads on the cash-settled indexes, thinks there has never been a better time to trade. Ultra-short-dated options enable you to express your opinion in more efficient ways. Additionally, the trade of these options, in the aggregate, can influence market movements, and this is added opportunity if you understand it.

Graphic: Retrieved from Goldman Sachs Group Inc (NYSE: GS) via Bloomberg.

Darrin Johnson, a volatility trader, recently discussed sharp ways to use these options.

Heading into some big events this week, John noted S&P 500 (INDEX: SPX) implied volatility (IVOL) was trading at ~25% on a five-day straddle. Traders could buy this structure while, in the interim, selling other structures like it “against CPI, Retail Sales, and PPI” where IVOL was higher. This would enable you to lower the cost of having positive exposure to movement or positive gamma via the five-day straddle, though this is operating on the premise “that Friday’s volatility will hold mostly steady, while the other 3 deflate.”

Moreover, the ultra-short-dated options are palatable if we will, and other traders, potentially much bigger in size, are observant of this too. The growing interest in these products (e.g., in the second half of last year, ultra-short-dated options made up more than 40% of the S&P 500’s trading volume) is growing in impact on underlying products like the SPX.

In fact, JPMorgan Chase & Co’s (NYSE: JPM) Peng Cheng found these options have an impact that “can vary from a drag of as much as 0.6% to a boost of up to 1.1%.” 

To explain, though as of late options counterparties may be playing a smaller role as “customers have taken equal and opposite sides” of positions, per SqueezeMetrics, we can naively look at there being a pool of liquidity to absorb the demand for these ultra-short-dated options which are very sensitive to time, price, and volatility. These increased sensitivities are hedged in a way that impacts this available pool of liquidity. If the trade or impact is large enough, it is transmitted onto underlying market prices. 

For instance, consider so-called meme mania and stocks like GameStop Corporation (NYSE: GME) that rocketed as traders’ interest in short-dated options demands rose. To hedge increased demand in call options, for instance, counterparties must buy the underlying stock. This demand boosts the stock.

Likewise, if traders’ consensus is that markets won’t move much until some large macroeconomic events, then their bets against market movement (i.e., sell ultra-short-dated options) will result in counterparties having more exposure to bets on market movement (i.e., positive gamma) which they will hedge in a way that reduces market movement (i.e., buy weakness or sell strength in the underlying stock). So, if traders bet against the movement, resulting in more counterparty positive gamma, then market movement is reduced due to the reaction to this positioning.

On the other hand, if traders’ consensus is that markets may move a lot, particularly to the downside, their bets on market movement (e.g., buy ultra-short-dated put) will result in counterparties having more exposure to bets against market movement (i.e., negative gamma). This demand for protection will bid options prices, particularly at the front-end of the IVOL term structure as counterparties price this demand in, and the counterparty will sell underlying to hedge. If fears are assuaged and traders no longer demand these bets on market movements, the counterparty can unwind their hedge which, in the put buying example provided, may provide a market boost, such as that which we saw immediately following the release of consumer price updates (CPI) this week; to quote Bloomberg, “[w]hen the worst didn’t happen, these hedges were unwound, helping propel a recovery in futures. It’s partly why the Cboe Volatility Index, or VIX, dropped 7% in a seemingly outsize reaction in a market when the S&P 500 ended the session basically flat.”

Graphic: Retrieved from Bloomberg.

Additionally, the re-hedging-inspired recovery was short-lived as well; the impact of ultra-short-dated options, as this letter has stated before, is short-dated. It, too, does much less to influence measures like the Cboe Volatility Index (INDEX: VIX), a floating measure of ~30 day-to-expiry SPX options trading at a fixed-strike IVOL, though it does have an impact. Thus, the dis-interest to hedge stocks traders do not own (or hedge further stocks that may be hedged) out in time, does less to boost the VIX.

Anyways, in January, your letter writer interviewed The Ambrus Group’s co-CIO Kris Sidial about major risks to markets in 2023, as well as reasons why volatility could outperform in 2023 and beyond. Some of the information in that Benzinga interview made it into this newsletter in the days following its release. 

Basically, the SPX and VIX complexes are growing and, on the other side, are a small concentrated group of market makers taking on far more exposure to risk. 

Graphic: Retrieved from Ambrus’ publicly available research.

During moments of stress, as we’ve seen in the past with GME for example, options counterparties may be unable to keep up with the demands of investors, so you get a reflexive dynamic that helps push the stock higher. “That same dynamic can happen on the way down”; counterparties will mark up options prices during intense selling. As the options prices rise, options deltas (i.e., their exposure to direction) rise and this prompts so-called bearish vanna counterparty hedging flows in the underlying.

“Imagine a scenario where [some disaster happens] and everybody starts buying 0 DTE puts. That’s going to reflexively drive the S&P lower,” Sidial said. “Take, for example, the JPMorgan collar position that clearly has an effect on the market, and people are starting to understand that effect. That’s just one fund. Imagine the whole derivative ecosystem” leaning one way.

Graphic: Retrieved from Ambrus’ publicly available research.

Well, that’s what JPM’s Marko Kolanovic just said is a major risk and could exacerbate market volatility. “While history doesn’t repeat, it often rhymes,” he explained, noting that the trade of ultra-short-dated options portends a Volmageddon 2.0. If you recall, in 2018, Volmageddon 1.0 turned successful long-running short-volatility trades on their head when traders who were betting against big movements in the market saw their profits erode in days.

Further, to conclude this section since your letter writer is running short on time, as Sidial said, “if you’re trading volatility, let there be an underlying catalyst for doing so.” From a “risk-to-reward perspective, … it’s a better bet to be on the long volatility side,” given “that there are so many things that … keep popping up” from a macro perspective. Check out our letters from the past weeks where we talked about protecting profits (e.g., sell call vertical to finance and buy a put vertical with a lot of time to expiry).

For Ambrus’ publicly available research, click here. Also, follow Sidial on Twitter, here. Consider reading your letter writer’s past two conversations with Sidial, as well. Here is an article on 2021 and the meme stock debacle. Here is another article talking more about Ambrus’ processes.

Technical

As of 6:15 AM ET, Thursday’s regular session (9:30 AM – 4:00 PM ET), in the S&P 500, is likely to open in the lower part of a balanced overnight inventory, inside of the prior day’s range, suggesting a limited potential for immediate directional opportunity.

The S&P 500 pivot for today is $4,153.25. 

Key levels to the upside include $4,168.75, $4,189.00, and $4,206.25.

Key levels to the downside include $4,136.25, $4,122.75, and $4,104.25.

Disclaimer: Click here to load the updated key levels via the web-based TradingView platform. New links are produced daily. Quoted levels likely hold barring an exogenous development.

Graphic: 65-minute profile chart of the Micro E-mini S&P 500 Futures.

Definitions

Volume Areas: Markets will build on areas of high-volume (HVNodes). Should the market trend for a period of time, this will be identified by a low-volume area (LVNodes). The LVNodes denote directional conviction and ought to offer support on any test.

If participants auction and find acceptance in an area of a prior LVNode, then future discovery ought to be volatile and quick as participants look to the nearest HVNodes for more favorable entry or exit.

POCs: Areas where two-sided trade was most prevalent in a prior day session. Participants will respond to future tests of value as they offer favorable entry and exit.


About

The author, Renato Leonard Capelj, works in finance and journalism.

Capelj spends the bulk of his time at Physik Invest, an entity through which he invests and publishes free daily analyses to thousands of subscribers. The analyses offer him and his subscribers a way to stay on the right side of the market. Separately, Capelj is an options analyst at SpotGamma and an accredited journalist.

Capelj’s past works include conversations with investor Kevin O’Leary, ARK Invest’s Catherine Wood, FTX’s Sam Bankman-Fried, Lithuania’s Minister of Economy and Innovation Aušrinė Armonaitė, former Cisco chairman and CEO John Chambers, and persons at the Clinton Global Initiative.

Connect

Direct queries to renato@physikinvest.com or find Physik Invest on TwitterLinkedInFacebook, and Instagram.

Calendar

You may view this letter’s content calendar at this link.

Disclaimer

Do not construe this newsletter as advice. All content is for informational purposes.

Categories
Commentary

Daily Brief For January 13, 2023

Physik Invest’s Daily Brief is read by thousands of subscribers. You, too, can join this community to learn about the fundamental and technical drivers of markets.

Graphic updated 7:00 AM ET. Sentiment Neutral if expected /ES open is inside of the prior day’s range. /ES levels are derived from the profile graphic at the bottom of this letter. Levels may have changed since initially quoted; click here for the latest levels. SqueezeMetrics Dark Pool Index (DIX) and Gamma (GEX) with the latter calculated based on where the prior day’s reading falls with respect to the MAX and MIN of all occurrences available. A higher DIX is bullish. At the same time, the lower the GEX, the more (expected) volatility. Click to learn the implications of volatility, direction, and moneyness. Breadth reflects a reading of the prior day’s NYSE Advance/Decline indicator. The CBOE VIX Volatility Index (INDEX: VVIX) measure reflects the total attractiveness of owning volatility.

Administrative

A bit late as your letter writer is getting ready to travel. Sorry and have a great Friday!

Fundamental

Thursday’s inflation update was as expected.

The Consumer Price Index (CPI) saw a 6.5% rise year-over-year (YoY) and a 0.1% fall month-over-month (MoM). Core CPI was +5.7% YoY and +0.3% MoM. 

In his post-CPI analysis, Andreas Steno Larsen said inflation has mostly disappeared, and, if we cut shelter costs, which are outdated, “deflation on a quarterly and monthly basis is here.”

Graphic: Retrieved from Andreas Steno Larsen.

The Federal Reserve’s (Fed) “favored statistical measures for underlying inflationary pressure all confirm a decline,” added Bloomberg’s John Authers.

Prices are beginning to behave more as central bankers would wish,” paving the way to a downshift in tightening, as is priced by the markets. Using the CME Group Inc’s (NASDAQ: CME) FedWatch Tool, traders were split, and the odds of a 25 or 50 basis point hike were more even prior to CPI.

The odds are now skewed toward a 25 basis point hike.

Graphic: Retrieved from CME Group Inc’s (NASDAQ: CME) FedWatch Tool. Depending on the measure, rates are seen peaking between 4.9% and 5.10%.

Despite the odds of a less aggressive hike – yields falling and swaps suggesting the Fed could skip a hike in March – and the impact that has on valuing businesses (e.g., firm profits worth less at higher interest rates hence the de-rate of 2022), the data suggests that “inflation spikes have never been vanquished until the federal funds rate exceeds the inflation rate,” and, with the return in deflation, Steno Larsen said, the outlook for stocks remains poor.

“Remember that the PPI (and the CPI for that matter) is a leading indicator for EPS.” Consequently, “we are in for negative EPS.”

If you’re not an active trader and unable to participate in both the up- and down-side of markets, then you may capitalize on higher interest rates with Treasury bills or Box Spreads, which allow you to create loan structures similar to a Treasury bill. Upon the spread’s maturity, it settles and earns a competitive interest rate.

Graphic: Retrieved from boxtrades.com.

If you’re an active trader, as I said to one subscriber privately, “the more depressed technology names to the upside for debits [were] attractive” (i.e., buying call option structures in the likes of Tesla and Amazon).

This is while put structures you may monetize in case of a large repricing in volatility have kept their values well amid what appears to be a shift higher in the skew; in the past days, we talked about measures including the Cboe VIX Volatility (INDEX: VVIX) printing at historic levels.

Graphic: Updated January 12, 2023. S&P 500 (INDEX: SPX) volatility skew retrieved from Interactive Brokers Group Inc’s (NASDAQ: IBKR) Trader Workstation.

Measures like the VVIX suggests “we can get cheap exposure to convexity while a lot of people are worried,” as The Ambrus Group’s Kris Sidial said in one article. Though volatility can be bimodal (i.e., stay low for longer for lack of better phrasing), from a “risk-to-reward perspective, … it’s a better bet to be on the long volatility side,” given “that there are so many things that … keep popping up” from a macro perspective.

Graphic: Cboe VIX Volatility (INDEX: VVIX) via TradingView.

Technical

As of 7:00 AM ET, Friday’s regular session (9:30 AM – 4:00 PM ET), in the S&P 500, is likely to open in the lower part of a negatively skewed overnight inventory, inside of prior-range and -value, suggesting a limited potential for immediate directional opportunity.

Our S&P 500 pivot for today is $3,988.25 HVNode. 

Key levels to the upside include $4,000.25, $4,011.75, and $4,028.75.

Key levels to the downside include $3,979.75, $3,959.00, and $3,943.25.

Click here to load today’s key levels into the web-based TradingView platform. All levels are derived using the 65-minute timeframe. New links are produced, daily. 

As a disclaimer, the S&P 500 could trade beyond the levels quoted in the letter. Therefore, you should load the above link on your browser for more relevant levels.

Graphic: 65-minute profile chart of the Micro E-mini S&P 500 Futures.

Definitions

Volume Areas: Markets will build on areas of high-volume (HVNodes). Should the market trend for long periods of time, it will be identified by low-volume areas (LVNodes). LVNodes denote directional conviction and ought to offer support on any test.

If participants auction and find acceptance in an area of a prior LVNode, then future discovery ought to be volatile and quick as participants look to HVNodes for favorable entry or exit.

POCs: Denote areas where two-sided trade was most prevalent in a prior day session. Participants will respond to future tests of value as they offer favorable entry and exit.

MCPOCs: Denote areas where two-sided trade was most prevalent over numerous sessions. Participants will respond to future tests of value as they offer favorable entry and exit.


About

In short, an economics graduate working in finance and journalism.

Capelj spends most of his time as the founder of Physik Invest through which he invests and publishes daily analyses to subscribers, some of whom represent well-known institutions.

Separately, Capelj is an equity options analyst at SpotGamma and an accredited journalist interviewing global leaders in business, government, and finance.

Past works include conversations with investor Kevin O’Leary, ARK Invest’s Catherine Wood, FTX’s Sam Bankman-Fried, Lithuania’s Minister of Economy and Innovation Aušrinė Armonaitė, former Cisco chairman and CEO John Chambers, and persons at the Clinton Global Initiative.

Contact

Direct queries to renato@physikinvest.com or Renato Capelj#8625 on Discord.

Calendar

You may view this letter’s content calendar at this link.

Disclaimer

Do not construe this newsletter as advice. All content is for informational purposes.

Categories
Commentary

Daily Brief For January 9, 2023

Physik Invest’s Daily Brief is read by thousands of subscribers. You, too, can join this community to learn about the fundamental and technical drivers of markets.

Graphic updated 7:50 AM ET. Sentiment Risk-On if expected /ES open is above the prior day’s range. /ES levels are derived from the profile graphic at the bottom of this letter. Levels may have changed since initially quoted; click here for the latest levels. SqueezeMetrics Dark Pool Index (DIX) and Gamma (GEX) with the latter calculated based on where the prior day’s reading falls with respect to the MAX and MIN of all occurrences available. A higher DIX is bullish. At the same time, the lower the GEX, the more (expected) volatility. Click to learn the implications of volatility, direction, and moneyness. Breadth reflects a reading of the prior day’s NYSE Advance/Decline indicator. The CBOE VIX Volatility Index (INDEX: VVIX) measure reflects the attractiveness of owning volatility. Green means that owning volatility is attractive.

Administrative

In last week’s letters, we discussed, mainly, fundamental and positioning contexts. Today’s letter will add to the discussion on the positioning.

Positioning

Last week, for an article published on Benzinga.com over the weekend, your letter writer spoke with The Ambrus Group’s co-chief investment officer Kris Sidial. Shared were the things to look out for in 2023 and tips for newer traders. The article can be viewed here, at this link.

In short, there are four big takeaways. 

First, though options prices could stay under pressure, naive measures like the VVIX, which is the volatility of the VIX, or the volatility of the S&P 500’s volatility, are printing at levels last seen in 2017. This means “we can get cheap exposure to convexity while a lot of people are worried.”

Graphic: Retrieved from TradingView. Cboe Volatility Index (INDEX: VIX) is on the top. The volatility of the VIX itself (INDEX: VVIX) is at the bottom.

Second, on the other side of the growing S&P 500 and VIX complexes is a small concentrated group of market makers taking on far more exposure to risk. 

Graphic: Retrieved from Ambrus’ publicly available research.

During moments of stress, these market makers may be “unable to keep up with the demands of frenetic investors,” Sidial said, pointing to GameStop Corporation (NYSE: GME) where “there was this reflexive dynamic” that helped push the stock higher in 2021.

“That same dynamic can happen on the way down”; market makers will mark up options prices during intense selling. As the options prices rise, options deltas (i.e., their exposure to direction) rise and this prompts so-called bearish vanna hedging flows.

Graphic: Retrieved from Ambrus’ publicly available research.

“Imagine a scenario where [some disaster happens] and everybody starts buying 0 DTE puts. That’s going to reflexively drive the S&P lower,” Sidial said. “Take, for example, the JPMorgan collar position that clearly has an effect on the market, and people are starting to understand that effect. That’s just one fund. Imagine the whole derivative ecosystem” leaning one way.

Graphic: Retrieved from Ambrus’ publicly available research.

The third is in reference to liquidity. As private market investors’ “deals are getting marked down, [t]o source liquidity, they may have to sell some of their holdings in the public equity markets.” Benn Eifert, the CIO at QVR Advisors, recently put forth that “late-stage technology is a great example where public comps are down 80-90% but privates marked down 20% or not at all. It is possible to imagine large institutions engaging in forced selling of liquid public equities to meet capital calls in private fund investments.”

And, lastly, investors often go “back and forth” and do not stick to a strict process. In trying to pick what will work at one specific time, investors can “miss what is going to work in the future.” Consequently, Sidial says investors should have an outlook and process to express that outlook. “It’s not as easy as saying: ‘Buy volatility because it’s cheap or sell it because it is expensive.’” 

As a validation, in the Benzinga article, your letter writer wrote about 2017 when volatility was at some of its lowest levels. Back then, the correct trade was to sell volatility, in some cases, due to volatility’s bimodality; if you sold volatility back then, you made money due to its clustering.

Graphic: Retrieved from TradingView. Cboe Volatility Index (INDEX: VIX) is on the top. Cboe Realized Volatility (INDEX: RVOL) is at the bottom.

So, “if you’re trading volatility, let there be an underlying catalyst for doing so.” That said, from a “risk-to-reward perspective, … it’s a better bet to be on the long volatility side,” given “that there are so many things that … keep popping up” from a macro perspective.

For Ambrus’ publicly available research, click here. Also, follow Sidial on Twitter, here. Consider reading your letter writer’s past two conversations with Sidial, as well. Here is an article on 2021 and the meme stock debacle. Here is another article talking more about Ambrus’ processes.

Technical

As of 7:50 AM ET, Monday’s regular session (9:30 AM – 4:00 PM ET), in the S&P 500, is likely to open in the upper part of a positively skewed overnight inventory, outside of prior-range and -value, suggesting a potential for immediate directional opportunity.

Our S&P 500 pivot for today is $3,926.50. 

Key levels to the upside include $3,943.25, $3,960.25, and $3,979.75.

Key levels to the downside include $3,908.25, $3,891.00, and $3,874.25.

Click here to load today’s key levels into the web-based TradingView platform. All levels are derived using the 65-minute timeframe. New links are produced, daily. 

As a disclaimer, note the S&P 500 could trade beyond the levels quoted in the letter. Therefore, you should load the key levels on your browser.

Graphic: 65-minute profile chart of the Micro E-mini S&P 500 Futures.

Definitions

Volume Areas: Markets will build on areas of high-volume (HVNodes). Should the market trend for long periods of time, it will be identified by low-volume areas (LVNodes). LVNodes denote directional conviction and ought to offer support on any test.

If participants auction and find acceptance in an area of a prior LVNode, then future discovery ought to be volatile and quick as participants look to HVNodes for favorable entry or exit.

Vanna: The rate at which the Delta of an option changes with respect to implied volatility.

POCs: Denote areas where two-sided trade was most prevalent in a prior day session. Participants will respond to future tests of value as they offer favorable entry and exit.

MCPOCs: Denote areas where two-sided trade was most prevalent over numerous sessions. Participants will respond to future tests of value as they offer favorable entry and exit.


About

In short, an economics graduate working in finance and journalism.

Capelj spends most of his time as the founder of Physik Invest through which he invests and publishes daily analyses to subscribers, some of whom represent well-known institutions.

Separately, Capelj is an equity options analyst at SpotGamma and an accredited journalist interviewing global leaders in business, government, and finance.

Past works include conversations with investor Kevin O’Leary, ARK Invest’s Catherine Wood, FTX’s Sam Bankman-Fried, Lithuania’s Minister of Economy and Innovation Aušrinė Armonaitė, former Cisco chairman and CEO John Chambers, and persons at the Clinton Global Initiative.

Contact

Direct queries to renato@physikinvest.com or Renato Capelj#8625 on Discord.

Calendar

You may view this letter’s content calendar at this link.

Disclaimer

Do not construe this newsletter as advice. All content is for informational purposes.

Categories
Commentary

Daily Brief For January 6, 2023

Physik Invest’s Daily Brief is read by thousands of subscribers. You, too, can join this community to learn about the fundamental and technical drivers of markets.

Graphic updated 8:30 AM ET. Sentiment Neutral if expected /ES open is inside of the prior day’s range. /ES levels are derived from the profile graphic at the bottom of this letter. Levels may have changed since initially quoted; click here for the latest levels. SqueezeMetrics Dark Pool Index (DIX) and Gamma (GEX) with the latter calculated based on where the prior day’s reading falls with respect to the MAX and MIN of all occurrences available. A higher DIX is bullish. At the same time, the lower the GEX, the more (expected) volatility. Click to learn the implications of volatility, direction, and moneyness. Breadth reflects a reading of the prior day’s NYSE Advance/Decline indicator. VIX reflects a current reading of the CBOE Volatility Index (INDEX: VIX) from 0-100.

Administrative

Hey team, hope you had a great week! Please consider reading our letters for January 3 and 4. In those letters, we discussed the potential drivers of long-lasting inflation that may not be good for traditional portfolio constructions like 60/40. 

In today’s letter, we talk about some positioning contexts, leaning into this letter writer’s interview with The Ambrus Group’s Kris Sidial for a Benzinga article to be published either this weekend or next week.

This letter will serve as a primer. Next week, we will go into further depth. Have a great weekend!

Positioning

In a conversation with your letter writer prior to 2022, and on YouTube, Sidial and some other Ambrus members said markets were increasingly fragile and traditional portfolio constructions such as 60/40 (i.e., 60% of holdings held in stocks and 40% of the holdings held in bonds) would not perform as well as history would imply. 

Instead, options (colloquially referred to as volatility) may “potentially outperform the market” and limit losses.

Pursuant to Ambrus’ warnings, 60/40 logged one of its worst stretches as inflation and interest rates rose. On the other hand, Ambrus, which is a volatility arbitrage fund, managed to end the year unscathed.

“That does not mean all volatility funds ended the same way,” Sidial said in a nod to his team’s unique approach to leveraging options’ multi-dimensionality in reducing the cost of protection they own for investors.

Here’s more on Ambrus’ approach from a previous conversation your letter writer had with Sidial for a Benzinga article.

Graphic: Text retrieved from Benzinga.com.

This approach is limiting, though, Sidial notes. Increasing assets under management can eat into the firm’s own alpha.

Anyways, Sidial went on to discuss the performance of volatility in 2022 and its potential to outperform in 2023 and beyond. 

“It caught everybody by surprise that long volatility underperformed,” he said in reference to a high spot-vol beta (i.e., volatility’s sensitivity to underlying prices) in 2021 suggesting volatility was likely to come to life in 2022, and “there would be more follow-through.”

However, there was no follow-through, and Sidial believes this was the result of allocations to commodity trading advisors or CTAs, and the “consensus trade,” or the sales of volatility on expectations markets would grind and chop lower for the entirety of 2022. 

As this letter has put forth in the past, traders proactively hedged heading into 2022. The unwind or supply of some of these hedges, coupled with investors’ expectation markets would continue to grind far lower, prompted more volatility sales (a pressure on options prices), masked by the persistently high, albeit tame Cboe Volatility Index (INDEX: VIX) and metrics like the put-to-call ratio appearing inflated, potentially the result of stock loan desks replacing short stock with in-the-money puts given high-interest rates.

Though the price of volatility could move toward the extremes (i.e., clustering/mean-reverting), trends may be near exhaustion.

Naive measures like the VVIX, which is the volatility of the VIX (i.e., the volatility of the S&P 500 volatility), are printing at levels last seen in 2017. This suggests “we can get cheap exposure to convexity while a lot of people are worried.”

Therefore, “even if inflation continues, the rate at which inflation rises won’t be the same. Due to this, CTA exposures likely will not perform as well as they did in 2022, and that’s why you may see more opportunities in the volatility space.”

Moving on, though not catalysts or reasons for Ambrus to initiate trades per se, risks Sidial said could result in volatility performing well include the concentration of market makers and private markets’ sourcing of liquidity (or raising cash) through sales of public equity markets.

“During moments of market stress, the market makers are unable to keep up with the demands of frenetic investors. If you think of GameStop Corp (NYSE: GME), which we talked about before, there was this reflexive dynamic that happened when investors rushed into the stock one way.”

“That same dynamic can happen on the way down”; market makers mark up volatility during stress which can pressure markets. As the price of volatility rises, option deltas rise and this prompts bearish vanna hedging flows, as they are called. 

Your letter writer will pause the commentary at this point while he further unpacks his discussion with Sidial, but at least you got a sneak peek ahead of next week’s article release. Take care!

Technical

As of 8:30 AM ET, Friday’s regular session (9:30 AM – 4:00 PM ET), in the S&P 500, is likely to open in the middle part of a balanced overnight inventory, inside of prior-range and -value, suggesting a limited potential for immediate directional opportunity.

Our S&P 500 pivot for today is $3,834.25. 

Key levels to the upside include $3,845.25, $3,857.00, and $3,867.75. 

Key levels to the downside include $3,813.25, $3,793.25, and $3,776.75.

Click here to load today’s key levels into the web-based TradingView platform. All levels are derived using the 65-minute timeframe. New links are produced, daily.

Note that early morning news may result in quoted levels not performing well. Please make sure to use the link to view the real-time chart for more levels that may be in play.

Graphic: 65-minute profile chart of the Micro E-mini S&P 500 Futures.

Definitions

Volume Areas: Markets will build on areas of high-volume (HVNodes). Should the market trend for long periods of time, it will be identified by low-volume areas (LVNodes). LVNodes denote directional conviction and ought to offer support on any test.

If participants auction and find acceptance in an area of a prior LVNode, then future discovery ought to be volatile and quick as participants look to HVNodes for favorable entry or exit.

MCPOCs: Denote areas where two-sided trade was most prevalent over numerous sessions. Participants will respond to future tests of value as they offer favorable entry and exit.


About

In short, an economics graduate working in finance and journalism.

Capelj spends most of his time as the founder of Physik Invest through which he invests and publishes daily analyses to subscribers, some of whom represent well-known institutions.

Separately, Capelj is an equity options analyst at SpotGamma and an accredited journalist interviewing global leaders in business, government, and finance.

Past works include conversations with investor Kevin O’Leary, ARK Invest’s Catherine Wood, FTX’s Sam Bankman-Fried, Lithuania’s Minister of Economy and Innovation Aušrinė Armonaitė, former Cisco chairman and CEO John Chambers, and persons at the Clinton Global Initiative.

Contact

Direct queries to renato@physikinvest.com or Renato Capelj#8625 on Discord.

Calendar

You may view this letter’s content calendar at this link.

Disclaimer

Do not construe this newsletter as advice. All content is for informational purposes.

Categories
Commentary

Daily Brief For December 28, 2022

Physik Invest’s Daily Brief is read by thousands of subscribers. You, too, can join this community to learn about the fundamental and technical drivers of markets.

Graphic updated 6:40 AM ET. Sentiment Neutral if expected /ES open is inside of the prior day’s range. /ES levels are derived from the profile graphic at the bottom of this letter. Levels may have changed since initially quoted; click here for the latest levels. SqueezeMetrics Dark Pool Index (DIX) and Gamma (GEX) with the latter calculated based on where the prior day’s reading falls with respect to the MAX and MIN of all occurrences available. A higher DIX is bullish. At the same time, the lower the GEX, the more (expected) volatility. Click to learn the implications of volatility, direction, and moneyness. Breadth reflects a reading of the prior day’s NYSE Advance/Decline indicator. VIX reflects a current reading of the CBOE Volatility Index (INDEX: VIX) from 0-100.

Positioning

In Physik Invest’s Market Intelligence letter for December 21, we discussed the potential for “pressure on options prices [to] remain through December.” In short, on the odds that “nothing happens through the holidays,” it made sense to sell implied volatility (IVOL) after CPI and FOMC targeting an end-of-month expiration.

The downward trajectory in IVOL remains intact in spite of some pockets of weakness under the hood in index heavyweights like Tesla Inc (NASDAQ: TSLA); expectations of future movement remain mute at both the index and single stock levels. As a result, short volatility trades (e.g., short straddle) in the indexes and near current market prices, expiring later this month, are doing really well.

Graphic: Retrieved from Kris Sidial. Tesla Inc (NASDAQ: TSLA) 1-month IVOL “relatively muted throughout the pain.”

Part of the equation resulting in this sideways market and tame IVOL environment was discussed in the December 21 letter. Today we add color.

In short, traders’ anticipation of a market drop, as evidenced by them reducing equity exposures into and through the 2022 market decline, coupled with the exploitation of loopholes manifesting increased demand for short-dated exposure to movements (i.e., gamma), and a supply of IVOL that is farther-dated, has put a lid on broad equity IVOL measures like the Cboe Volatility Index (INDEX: VIX) and pushed skew lower.

Consequently, hedges performing well have a lot of +gamma intraday and exposure to realized volatility (RVOL), and less exposure to longer-dated IVOL. The other side of this trade (and those who may be warehousing this risk) has exposure to -gamma and, to hedge that, they must act in a manner that exacerbates realized movement, hence RVOL’s meaningful outperformance.

In fact, RVOL in 2022 is nearly two times the level of RVOL in 2021, all the while the IVOL term structure is basically at the “same place it was a year ago,” according to Danny Kirsch of Piper Sandler Companies (NYSE: PIPR).

Graphic: Retrieved from Danny Kirsch, the head of options at Piper Sandler Companies (NYSE: PIPR). “Rolling 1 year realized volatility [for] … 2022 nearly 2x the level of 2021, speaks to long gamma and not vega for 2022.”

In a two-and-a-half-hour Twitter Spaces discussion, Kai Volatility’s Cem Karsan discussed what is the potential cause of this. Some of the blame rests on the way margin calculations (i.e., the loophole mentioned earlier); less cash must be posted if trades are closed the same day, basically. 

Anyways, at the macro level, yes, the trends continue. Generally speaking, IVOL is mute and not accounting for the activity in short-dated options, as discussed by The Ambrus Group’s recent paper, while RVOL is about two times the level it was in 2021, making +gamma profitable.

However, at the micro level, so to speak, as we started out this discussion, traders’ anticipation that “nothing happens through the holidays,” has resulted in the supply of short-dated volatility, boosting the stickiness of open interest at current market prices.

Let’s unpack this further and explain why this activity won’t continue forever.

Near current market prices sit large concentrations of options positions. For instance, we have the $3,835.00 SPX strike (the call part of a massively popular collar trade that is rolled every quarter). At $3,835.00 is the short strike of a big collar trade.

This means the trader (or fund owner) is short the call, hence -delta and -gamma. The other side (or counterpart) is long the call, hence +delta and +gamma.

In theory, the other side, in response to this exposure, will buy weakness and sell strength. In other words, to hedge a long call, the other side sells futures. If the market falls, the call’s delta will fall and become less positive. Therefore, the other side will buy back some of their initial futures hedges (reduce -delta from short futures) to neutralize delta risk. If the market rises, the other side will have more exposure to +delta. To neutralize the delta, the other side will sell more futures.

As a consequence, the market pins.

Graphic: Retrieved from Banco Santander SA (NYSE: SAN).

This is a trend, as we discussed on December 21, that likely continues through year-end. After year-end, the market is likely to “move more freely,” per SpotGamma, “because this options activity that is promoting mean reversion will no longer be there,” and, therefore, the indexes likely trade more “in sync with its wild constituents of the likes of Tesla and beyond.”

More on what’s next:

As Karsan dissected, yesterday, there’s a “liquidity premium” that’s getting crowded short; in this less well-hedged market environment, traders’ realization with respect to liquidity and collateral needs for supporting trading activities may provide the context for some sharp drops. But first, it’s likely (though not certain) the market experiences some relief. Knowing that the long-end is cheap (hence near-zero percentile skew) on a supply and demand basis, it does not make sense to sell options blindly out in time.

Technical

As of 6:30 AM ET, Wednesday’s regular session (9:30 AM – 4:00 PM ET), in the S&P 500, is likely to open in the middle part of a balanced overnight inventory, inside of prior-range and -value, suggesting a limited potential for immediate directional opportunity.

Our S&P 500 pivot for today is $3,857.00. 

Key levels to the upside include $3,879.25, $3,893.75, and $3,908.25. 

Key levels to the downside include $3,838.25, $3,813.25, and $3,793.25.

Click here to load today’s key levels into the web-based TradingView platform. All levels are derived using the 65-minute timeframe. New links are produced, daily.

Graphic: 65-minute profile chart of the Micro E-mini S&P 500 Futures.

Definitions

Volume Areas: Markets will build on areas of high-volume (HVNodes). Should the market trend for long periods of time, it will be identified by low-volume areas (LVNodes). LVNodes denote directional conviction and ought to offer support on any test.

If participants auction and find acceptance in an area of a prior LVNode, then future discovery ought to be volatile and quick as participants look to HVNodes for favorable entry or exit.

MCPOCs: Denote areas where two-sided trade was most prevalent over numerous sessions. Participants will respond to future tests of value as they offer favorable entry and exit.


About

In short, an economics graduate working in finance and journalism.

Capelj spends most of his time as the founder of Physik Invest through which he invests and publishes daily analyses to subscribers, some of whom represent well-known institutions.

Separately, Capelj is an equity options analyst at SpotGamma and an accredited journalist interviewing global leaders in business, government, and finance.

Past works include conversations with investor Kevin O’Leary, ARK Invest’s Catherine Wood, FTX’s Sam Bankman-Fried, Lithuania’s Minister of Economy and Innovation Aušrinė Armonaitė, former Cisco chairman and CEO John Chambers, and persons at the Clinton Global Initiative.

Contact

Direct queries to renato@physikinvest.com or Renato Capelj#8625 on Discord.

Calendar

You may view this letter’s content calendar at this link.

Disclaimer

Do not construe this newsletter as advice. All content is for informational purposes.

Categories
Commentary

Daily Brief For December 23, 2022

Physik Invest’s Daily Brief is read by thousands of subscribers. You, too, can join this community to learn about the fundamental and technical drivers of markets.

Graphic updated 8:30 AM ET. Sentiment Neutral if expected /ES open is inside of the prior day’s range. /ES levels are derived from the profile graphic at the bottom of this letter. Levels may have changed since initially quoted; click here for the latest levels. SqueezeMetrics Dark Pool Index (DIX) and Gamma (GEX) with the latter calculated based on where the prior day’s reading falls with respect to the MAX and MIN of all occurrences available. A higher DIX is bullish. At the same time, the lower the GEX, the more (expected) volatility. Click to learn the implications of volatility, direction, and moneyness. Breadth reflects a reading of the prior day’s NYSE Advance/Decline indicator. VIX reflects a current reading of the CBOE Volatility Index (INDEX: VIX) from 0-100.

Positioning

Friends, please read the entire post.

In the Daily Brief for December 21, 2022, this letter dissected some of the positioning contexts responsible for fixed-strike and top-line implied volatility (IVOL) measures’ downward trajectory with the S&P 500. Since this detailed letter was published, IVOL has increased, albeit not by a massive amount so to speak. The moves lower, coupled with the volatility skew not blowing out, have enabled your letter writer to monetize structures entered into while on travel for a nice return. Let’s talk about it, further.

Heading into consumer price (i.e., inflation) updates, as well as updates from the Federal Reserve on their commitment to stemming inflation, traders sought to protect against (or bet on) movement thereby bidding measures of IVOL.

To quote The Ambrus Group’s Kris Sidial, the “entire term structure was jacked going into CPI and FOMC.” Additionally, “granted nothing out of left field,” Sidial added, it would be tough “for December and January vol[atility] to remain bid.”

Graphic: IVOL term structure retrieved from Tier1Alpha.com.

Accordingly, after the CPI and FOMC, market concerns ebbed and traders’ supply of the options they demanded, particularly at the front-end of the curve, pushed the term structure back to an upward-sloping so-called contango.

Graphic: IVOL term structure retrieved from Tier1Alpha.com.

As was detailed in the December 21 letter, this dynamic following the release of CPI and FOMC would do a lot to keep IVOL and equity movement contained. Knowing this, your letter writer’s trading partner alerted him while on a trip of skew presenting some nice, zero-cost trades that would expand should the market trade lower and IVOL remain contained (i.e., volatility skew not blowing out).

Upon analysis, entered was a simple +1 x -2 Put Ratio Spread (Trade Ticket: SOLD -1 1/2 BACKRATIO SPX 100 20 JAN 23 [AM] 3400/3150 PUT @.10) for a ~$10.00 credit before fees and commissions, a favorite of your letter writer’s.

Graphic: Filled orders on December 14, 2022.

The trades provided exposure to -Delta (direction) and +Gamma (movement).

Graphic: Position statement on December 14, 2022. Using portfolio margin to lower BP Effect.

As an aside, from the start the Vega (sensitivity to changes in IVOL) was negative but, this has a lot to do with how far out the spread is on the chain and, should there be movement as you’re about to see, enabling the put leg you own to start kicking in, so to speak, Vega ends up turning positive very quickly, all else equal.

The below graphic, taken on December 19, prior to much of the spread being monetized, shows a large -Delta, +Gamma, and +Vega (i.e., if the market moves lower or IVOL rises, the spread is to rise in value), much like it did when the market traded down into the beginning of this week and IVOL rose into the end of this week.

Graphic: Position statement on December 19, 2022. Using portfolio margin to lower BP Effect.

For one account, 50% of the initial trade was closed for $205-220.00 in credit per spread. After this closure, the remaining structure, in this one account, was turned into a +2 x -5 Ratio. Why? In short, the market was strengthening and the odds of a large move lower were, in short, low. To have downside exposure but be paid for the initial effort, the conversion from a +4 x -8 to a +2 x -5 resulted in an additional $8.10 credit, leaving your letter writer with a -Delta, +Gamma, and +Vega, still.

Graphic: Trade history on December 23, 2022.

In the days after, the market turned and traded lower, far more than expected. Notwithstanding, the remaining structures (both +1 x -2 and +2 x -5) performed well, though the 2×5’s Vegas briefly turned negative on the sharp selling yesterday, which, if it had remained like that, would have solicited action (i.e., repositioning, closure, or hedging via correlated instrument).

Graphic: Working orders on December 23, 2022.

At the end of the day, what’s important to your letter writer, here, is how the spread prices if the market moves to it today, all else (e.g., time, IVOL, etc) remains equal. If the spread prices at a better price to close at the money, that’s a quick check that says: “Hey, your bet on the market moving lower actually makes money if the market moves lower, all else equal.”

To explain further, look at the working orders above. At current S&P 500 levels, the +1 x -2 prices for $215.00 credit to close. The Delta is negative, as desired, and both the Gamma and Vega are positive. If the spread was at the money, it prices for nearly a $4,500.00 credit to close as shown below.

Graphic: Pricing an order on December 23, 2022.

So, what now? Well, the exposure is really light and much of the structure was monetized. From here, if the market moves lower that would likely be good for the remaining structures. Any costs to enter have been covered and, at this point, the trade is a free bet on the downside.

Obviously, there are pieces not included in this trade dissection, today, including how to properly manage your greek risk, as well as size the position at entry. These are the secret sauces, so to speak, that will either make or break you in the long run.

Should you want more write-ups like this, comment below. Your letter writer attempts to make these updates as informative and engaging as possible. It’s tough, at times, given the dullness of the material. Separately, trading is not as hard as it’s all made out to be. Sure, you need to have a good read on markets (e.g., skew), but, as your letter writer has learned over the many years he’s been engaging with markets, the theory is nothing like practice. No formula will help you price and enter the correct trade structure in a fast-moving meme stock with IVOL blowing out. 

If all could be automated, there would be no market. Markets are the product of human emotion. Avoid acting on theory, blindly. Price different structures, like the ones this letter has detailed, and observe how the different parts of the trade interact with each other as the market moves, IVOL moves, time passes, interest rates change, and so on.

For instance, you could have owned puts early in the week and still lost money as the market moved lower. If you would have leveraged a short leg against your long leg, then you could have offset the decay, as your letter writer did above.

There’s no substitute for time in the seat (e.g., you could have observed the -Vega at the entry on the trade structure above and not entered, missing out on the trade’s expansion. Time in the seat taught your letter writer better).

Don’t construe this letter’s simplicity as naivety, also. In the end, what’s your exposure to movement? If your bet is on movement, will you make money if the market moves? If not, find another trade structure or sit out.

Anyways, happy holidays to you and your closest. It’s been quite the year and I have a lot to be thankful for and reflect on. See you next week, most likely (though your letter writer’s burn-out may result in new publications being delayed until the new year).

Technical

As of 8:20 AM ET, Friday’s regular session (9:30 AM – 4:00 PM ET), in the S&P 500, is likely to open in the upper part of a positively skewed overnight inventory, inside of prior-range and -value, suggesting a limited potential for immediate directional opportunity.

Our S&P 500 pivot for today is $3,867.75. 

Key levels to the upside include $3,879.25, $3,893.75, and $3,908.25. 

Key levels to the downside include $3,833.00, $3,813.25, and $3,793.25.

Click here to load today’s key levels into the web-based TradingView platform. All levels are derived using the 65-minute timeframe. New links are produced, daily.

Graphic: 65-minute profile chart of the Micro E-mini S&P 500 Futures.

Definitions

Volume Areas: Markets will build on areas of high-volume (HVNodes). Should the market trend for long periods of time, it will be identified by low-volume areas (LVNodes). LVNodes denote directional conviction and ought to offer support on any test.

If participants auction and find acceptance in an area of a prior LVNode, then future discovery ought to be volatile and quick as participants look to HVNodes for favorable entry or exit.

POCs: Denote areas where two-sided trade was most prevalent in a prior day session. Participants will respond to future tests of value as they offer favorable entry and exit.

MCPOCs: Denote areas where two-sided trade was most prevalent over numerous sessions. Participants will respond to future tests of value as they offer favorable entry and exit.


About

In short, an economics graduate working in finance and journalism.

Capelj spends most of his time as the founder of Physik Invest through which he invests and publishes daily analyses to subscribers, some of whom represent well-known institutions.

Separately, Capelj is an equity options analyst at SpotGamma and an accredited journalist interviewing global leaders in business, government, and finance.

Past works include conversations with investor Kevin O’Leary, ARK Invest’s Catherine Wood, FTX’s Sam Bankman-Fried, Lithuania’s Minister of Economy and Innovation Aušrinė Armonaitė, former Cisco chairman and CEO John Chambers, and persons at the Clinton Global Initiative.

Contact

Direct queries to renato@physikinvest.com or Renato Capelj#8625 on Discord.

Calendar

You may view this letter’s content calendar at this link.

Disclaimer

Do not construe this newsletter as advice. All content is for informational purposes.

Categories
Commentary

Daily Brief For November 16, 2022

Physik Invest’s Daily Brief is read by over 1,200 people. To join this community and learn about the fundamental and technical drivers of markets, subscribe below.

Graphic updated 7:15 AM ET. Sentiment Neutral if expected /ES open is inside of the prior day’s range. /ES levels are derived from the profile graphic at the bottom of this letter. Levels may have changed since initially quoted; click here for the latest levels. SqueezeMetrics Dark Pool Index (DIX) and Gamma (GEX) with the latter calculated based on where the prior day’s reading falls with respect to the MAX and MIN of all occurrences available. A higher DIX is bullish. At the same time, the lower the GEX, the more (expected) volatility. Click to learn the implications of volatility, direction, and moneyness. Breadth reflects a reading of the prior day’s NYSE Advance/Decline indicator. VIX reflects a current reading of the CBOE Volatility Index (INDEX: VIX) from 0-100.

Administrative

There will be no Daily Brief published on Thursday, November 17, 2022.

Positioning

Given where realized (RVOL) and implied (IVOL) volatility measures are, as well as skew, it is beneficial to enter into such trades including protective collars (i.e., sell call, buy put), as stated in yesterday’s letter and explicitly discussed by the likes of Nomura Holdings Inc’s (NYSE: NMR) Charlie McElligott. 

To quote McElligott: The “legacy ‘short skew’ trade that’s been the key US equities vol theme of 2022 is now at risk of its own ‘regime change’ reversal, too. This is, then, especially interesting when considering that ongoing VIX call [or] call spread buying … generally some pretty ‘tail-y’ stuff that is beginning to get loaded into.”

Graphic: Retrieved from The Ambrus Group’s Kris Sidial. This is “gutter low vol.”

Entering trades that change non-linearly with respect to changes in implied volatility (IVOL) and direction (Delta) exposes participants to convexity (Gamma).

A simple way to think about this is if the market was to shock lower by one, all else equal, the derivative’s value would change in excess of that. On the other hand, if one was short static (not dynamic) Delta, meaning they profit from that movement lower, profits realized would be one for one with the change in the underlying.

Graphic: Retrieved from Banco Santander SA (NYSE: SAN).

So, given the flat skew we mentioned earlier, it is attractive in price to hedge against the downside. Whether that downside materializes, is another story.

Graphic: Retrieved from Goldman Sachs Group Inc (NYSE: GS). Equity skew is so depressed in the US that one could buy a multiple of the calls they sold in the S&P 500, elsewhere.

Food For Thought:

This is amidst the responsiveness near key technical areas provided in past letters. It suggests traders with short time horizons are very active and anchoring to key areas, such as $4,000.00 in the S&P 500. These same participants will often lack the wherewithal to defend retests, and big participants (some of whom move by committee) seldom respond to those technical inflections. 

Graphic: Retrieved from SpotGamma.

According to SpotGamma, a provider of data and written analyses on the options market, data shows the “$4,000.00 strike continu[ing] to dominate both in terms of position sizing” with calls, at that level most likely “being sold, which has helped maintain $4,000.00 resistance.”

The sale of IVOL leaves counterparties with long (+Delta) exposure to be hedged through sales (-Delta) of the underlying. As the market trades higher, these options, which are very close to current market prices, have a lot of Gamma, meaning they are very sensitive to changes in the price of the underlying (or convex and non-linear to direction). That means these options can go from having little value to a lot of value, quickly.

Graphic: Taken from Exotic Options and Hybrids: A Guide to Structuring, Pricing and Trading. 

If the market is below $4,000.00 and trading higher, while at $4,000.00 there is a lot of this trade going on, then the counterparty will sell the underlying to offset gains in their options while the reverse happens if the market is trading down, as SpotGamma data showed, yesterday. When the market traded lower, positive Delta was firing off, which is supportive, hence the mean-reversion back to $4,000.00 into the close.

Graphic: SPY HIRO. Retrieved from SpotGamma’s Twitter. Posted 11/15/2022 at 1:42 PM ET.

A quick check of how sticky these areas may be, look at the level of positive Gamma.

As traders bet against the market movement, counterparties take on more exposure to positive Gamma. In hedging this positive Gamma, the counterparty does more to reduce market movement.

Couple this mean-reversion-type activity with the structural Delta buyback linked to the passage of time (Charm) and compression of volatility (Vanna), these conditions do more to bolster continued relief, as put forth by Goldman Sachs Group Inc.

Another consequence, as picked up by individuals online including Darrin John, the S&P 500’s realized volatility (RVOL) “is so high” with “a basket of 500 of the ‘best’ stocks in the US [wildly] swing[ing] +5% in a single day,” while the S&P 500 is relatively mute, as your letter writer sees it.

In general, something has to give. If there are forces that are pinning the S&P 500, all the while there are arbitrage constraints connecting the components and all, then correlation must break and dispersion must increase. In short, this is a trader’s market; data shows managers tend to “outperform the worst by more during periods of lower correlation,” as does “higher dispersion.”

Should traders continue to hone in on key areas, and add to the interest and volume near those areas, then the market is likely prone to more of the same. Expect pinning and sideways to up. If there were to be a decrease in positive Gamma exposures, that likely opens the door to more movement. Likewise, if traders’ bets are concentrated elsewhere (higher or lower), that can open the door to relief. A catalyst for that may be something fundamental.

The Key Takeaway:

Recent happenings mimic that of the Global Financial Crisis when, according to The Ambrus Group’s Kris Sidial, “vol slowly [ground] until the eventual October 2008 move (i.e., Lehman).” 

“The markets were understanding that there was a change going on, especially in credit. But that risk was discounted until it was forced into realization.”

Simple trades to protect (or capitalize on this) include collars, as stated earlier, as well as calendars. If you expect RVOL on the index level, at least, to be mute, then sell short-dated exposure and use those proceeds to purchase farther-dated exposure (e.g., sell weekly put to buy monthly put).

Why? 

When you think there is to be an outsized move in the underlying, relative to what is priced, you buy options (+Gamma). When you think there is to be an outsized move in the implied volatility, relative to what is priced, you buy options (+Volga). If there’s a large change in direction (RVOL) or IVOL repricing, you may make money. 

Ultimately, “liquidity providers’ response to demand for protection (en masse) would, then, likely exacerbate the move and aid in the repricing of IVOL to levels where there would be more stored energy to catalyze a rally,” as we saw after elections and CPI … 

Graphic: Commentary published by Kai Volatility.

… alongside the Dollar’s (INDEX: DXY) weakness which is easing the burden on margins and global funding.

Per Morgan Stanley (NYSE: MS), “simple math on S&P 500 earnings from currency is that for every percentage point increase on a YoY basis, it’s [] a 0.5 hit to EPS growth.”

Graphic: Retrieved from Bloomberg.

Technical

As of 7:15 AM ET, Wednesday’s regular session (9:30 AM – 4:00 PM ET), in the S&P 500, is likely to open in the middle part of a balanced overnight inventory, inside of prior-range and -value, suggesting a limited potential for immediate directional opportunity.

Our S&P 500 pivot for today is $4,000.25. 

Key levels to the upside include $4,027.00, $4,069.25, and $4,136.75. 

Key levels to the downside include $3,965.25, $3,913.00, and $3,871.25.

Click here to load today’s key levels into the web-based TradingView platform. All levels are derived using the 65-minute timeframe. New links are produced, daily.

Graphic: 65-minute profile chart of the Micro E-mini S&P 500 Futures.

Definitions

Volume Areas: A structurally sound market will build on areas of high volume (HVNodes). Should the market trend for long periods of time, it will lack sound structure, identified as low volume areas (LVNodes). LVNodes denote directional conviction and ought to offer support on any test. 

If participants were to auction and find acceptance into areas of prior low volume (LVNodes), then future discovery ought to be volatile and quick as participants look to HVNodes for favorable entry or exit.

POCs: POCs are valuable as they denote areas where two-sided trade was most prevalent in a prior day session. Participants will respond to future tests of value as they offer favorable entry and exit.

MCPOCs: POCs are valuable as they denote areas where two-sided trade was most prevalent over numerous day sessions. Participants will respond to future tests of value as they offer favorable entry and exit.

About

After years of self-education, strategy development, mentorship, and trial-and-error, Renato Leonard Capelj began trading full-time and founded Physik Invest to detail his methods, research, and performance in the markets. 

Capelj also writes options market analyses at SpotGamma and is a Benzinga journalist. 

His past works include private discussions with ARK Invest’s Catherine Wood, investors Kevin O’Leary and John Chambers, the infamous Sam Bankman-Fried of FTX, former Bridgewater Associate Andy Constan, Kai Volatility’s Cem Karsan, The Ambrus Group’s Kris Sidial, the Lithuanian Delegation’s Aušrinė Armonaitė, among many others.

Contact

Direct queries to renato@physikinvest.com or Renato Capelj#8625 on Discord.

Disclaimer

Do not construe this newsletter as advice. All content is for informational purposes.

Categories
Commentary

Daily Brief For November 15, 2022

Physik Invest’s Daily Brief is read by over 1,200 people. To join this community and learn about the fundamental and technical drivers of markets, subscribe below.

Graphic updated 9:00 AM ET. Sentiment Risk-On if expected /ES open is above the prior day’s range. /ES levels are derived from the profile graphic at the bottom of this letter. Levels may have changed since initially quoted; click here for the latest levels. SqueezeMetrics Dark Pool Index (DIX) and Gamma (GEX) with the latter calculated based on where the prior day’s reading falls with respect to the MAX and MIN of all occurrences available. A higher DIX is bullish. At the same time, the lower the GEX, the more (expected) volatility. Click to learn the implications of volatility, direction, and moneyness. Breadth reflects a reading of the prior day’s NYSE Advance/Decline indicator. VIX reflects a current reading of the CBOE Volatility Index (INDEX: VIX) from 0-100.

Fundamental

S&P Global Inc (NYSE: SPGI) put it really well in a recent update comparing today to the events of the mid-to-late 1630s. Dutch tulip bulbs traded as high as $750,000 per bulb (today’s money) before collapsing to near-zero.

That’s akin to what happened with the non-fungible token (NFT) craze of the late 2010s and early 2020s. Pictures of rocks sold for millions as recently as last year. Those pictures are worthless, now, and this has done a bit to dent the ecosystem’s apparent value, as well.

Graphic: Retrieved from Bank of America Corporation (NYSE: BAC) via @LanceRoberts.

What’s going on to cause this:

It’s basically the case that easy money policies enabled market participants to borrow and fund longer-duration bets on ideas with (potential) promise in the future.

Financial asset investments, too, were far more attractive, and that’s why we saw the asset inflation accelerate, followed by goods and services inflation that was bolstered by chokepoints and trends (e.g., deglobalization via supply chain security and geopolitics) and, ultimately, prompted policymakers to pivot.

FTX (CRYPTO: FTT) is among the victims of this pivot. It’s apparent that the events surrounding the collapse of crypto ecosystems months back prompted a so-called “credit crunch,” an insider close to FTX’s leadership explained.

“Many loaners suddenly recalled all of their loans just to see who was still liquid. Alameda lost a lot from giving out loans to firms [that] defaulted. Alameda was now, also, on the hook for money they didn’t have since they had given a lot of the loan money to FTX or had lost it loaning to now bankrupt counterparties. [Founder and CEO Sam Bankman-Fried] had two choices at this point, let Alameda get liquidated or send user money from FTX to ensure Alameda’s survival.”

Bankman-Fried, a massive risk taker at heart, chose the latter.

The repercussions include the following:

Apart from “strong governance and transparency [to] grow in importance as the cryptocurrency industry attempts to reassure investors and customers, … regulation of cryptocurrency markets, which was already a matter of serious debate, could accelerate,” SPGI explained, noting that some “other areas of the decentralized finance [or DeFi] market may be affected. And lastly, these contagion effects are unlikely to ripple into traditional finance [or TradFi].”

Check out Reuters (FTX bankruptcy filings in, French central bank wants quick regulation) and The Information (Startups should prepare for ‘second order fallout’ from FTX collapse).

Simplify Asset Management’s Michael W. Green (who we quoted in the past for his perspective and belief that we are in “a dot-com type collapse” that’s happened “underneath the surface of the indices which is [a result of] … passive flows supporting the largest stocks within the index, whereas the smaller stocks can be influenced to a greater extent by [] discretionary managers”) said a likely result is a Central Bank Digital Currency (CBDC) and an “almost certain … change in the monetary system,” echoing what Kai Volatility’s Cem Karsan said a long-time ago: “I don’t see … a clear window where cryptocurrency is not subject to constraints and I think it’s highly likely that we move towards a digital dollar.”

CBDCs are highly controversial per my chats with the likes of Edge & Node’s Tegan Kline. She said they could “be used as a mass surveillance tool. Leaders have done little to invalidate her beliefs given their recent discussions on, for example, using CBDCs to derive “carbon footprint.” 

That means having a read on where people are “traveling, how are they traveling, what are they eating, what are they consuming … This is something we’re working on,” leaders have put forth.

The point of this all is as follows:

As many may know, “there’s no ultimate buyer” in spaces like crypto and DeFi, as ex-Goldman Sachs Group Inc (NYSE: GS) emerging market FX and yield trader Seraphim Czecker, who is now heading risk and product management at Euler Labs, said

It’s that and the persistent interest in illiquid products that leave the door open to manipulation. Barring illiquidity, “if there’s a 10 or 15 standard deviation move, the liquidity will allow for … you [to] offload those assets quickly.

However, that’s not the widespread case.

“For example, look at what happened in the UK with the pension funds and margin calls. That is a classic DeFi strategy. You take your bonds and borrow cash against them. Then, you put it back into bonds and loop it a couple of times. That way, you have a leveraged interest rate exposure. That’s the same principle of lending staked Ethereum (CRYPTO: ETH), borrowing ETH, and doing it a couple of times.”

So, there may be “second order fallout” amid all this tightening. Markets, everywhere, are to de-rate. Ultimately, there’s probably a pivot to happen, in the future, with many leaders and strategists in finance unable to agree whether that (pivot) is the result of a recession.

“To take the foot off the brake right now and not finish the job, I think it’s the absolute worst mistake that the Fed could possibly make,” Citadel’s Ken Griffin said at the Bloomberg New Economy Forum in Singapore. In spite of Citadel seeing a recession averted, Griffin said: “I am finding it a bit hard to believe we are not going to have a recession at that point of time, sometime in the middle to back half of 2023,” adding this year finishes with “modest growth.”

Those in agreement include Stanley Druckenmiller, who once managed George Soros’ funds. “You don’t even need to talk about Black Swans to be worried here. To me, the risk-reward of owning assets doesn’t make a lot of sense,” Druckenmiller said

“When you make a mistake, you got to admit you’re wrong and move on that nine or 10 months, that [policymakers] just sat there and bought $120 billion in bonds,” he added. The “repercussions of that are going to be with us for a long, long time.”

Positioning

From a positioning perspective, much of what we’ve discussed in past notes is still true. Among others, Goldman Sachs Group Inc calculates up to $40 billion in buying over the next weeks with more than $80 billion of buying in an up market.

Graphic: Retrieved from @LanceRoberts. “Goldman calculates a whopping $38 billion to buy over the next week and substantially more (green line) if the market is up big. The chart below shows that the bank expects more than +$79 billion of net buying over the month.”

This is pursuant to our statements on the compression of implied volatility (evidenced by a shift lower in the term structure, particularly at the front end where options are most sensitive) compounding macro-type repositioning, with follow-on support coming from the reach for “Deltas and leverage” to the upside (call options)

Graphic: Retrieved from Goldman Sachs Group Inc (NYSE: GS).

As Alfonso Peccatiello of The Macro Compass puts it well: “incentive schemes drive people to be much more willing to pay and chase upside.” 

Preferred are “convex structures” that would benefit from rallies. 

However, in traders’ monetization of put protection they owned, as well as reach for upside calls (to not miss out on a potential reversal), skew is at its lows.

Graphic: Retrieved from The Ambrus Group’s Kris Sidial. “2017 is a year that is notorious for extremely low implied and realized vol. It is fascinating to see how insanely low the call-side volatility has been this year. There is low vol and then there is, in the gutter low vol.”

If the assumption is that “further tightening monetary policy and draining liquidity off the market might cause some problems down the road,” per Fabian Wintersberger, downside convexity (bets that trade non-linearly to changes in underlying price and volatility) are attractive.

Graphic: Retrieved from Banco Santander SA (NYSE: SAN).

Trades that may be attractive include collars, as well explained in a recent thread by IPS Strategic Capital’s Pat Hennessy. 

“[T]he combination of historically flat skew [and] the highest rates we’ve seen in 15 years makes longer dated collars an attractive trade for those who are worried about the performance of stocks over the next year but do not want to sell or try timing the market.”

Technical

As of 9:00 AM ET, Tuesday’s regular session (9:30 AM – 4:00 PM ET), in the S&P 500, is likely to open in the upper part of a positively skewed overnight inventory, outside of prior-range and -value, suggesting a potential for immediate directional opportunity.

Our S&P 500 pivot for today is $4,000.25. 

Key levels to the upside include $4,069.25, $4,136.75, and $4,231.00. 

Key levels to the downside include $3,965.25, $3,913.00, and $3,871.25.

Click here to load today’s key levels into the web-based TradingView platform. All levels are derived using the 65-minute timeframe. New links are produced, daily.

Graphic: 65-minute profile chart of the Micro E-mini S&P 500 Futures.

Definitions

Volume Areas: A structurally sound market will build on areas of high volume (HVNodes). Should the market trend for long periods of time, it will lack sound structure, identified as low volume areas (LVNodes). LVNodes denote directional conviction and ought to offer support on any test. 

If participants were to auction and find acceptance into areas of prior low volume (LVNodes), then future discovery ought to be volatile and quick as participants look to HVNodes for favorable entry or exit.

POCs: POCs are valuable as they denote areas where two-sided trade was most prevalent in a prior day session. Participants will respond to future tests of value as they offer favorable entry and exit.

MCPOCs: POCs are valuable as they denote areas where two-sided trade was most prevalent over numerous day sessions. Participants will respond to future tests of value as they offer favorable entry and exit.

About

After years of self-education, strategy development, mentorship, and trial-and-error, Renato Leonard Capelj began trading full-time and founded Physik Invest to detail his methods, research, and performance in the markets. 

Capelj also develops insights around impactful options market dynamics at SpotGamma and is a Benzinga journalist.

His works include private discussions with ARK Invest’s Catherine Wood, investors Kevin O’Leary and John Chambers, the infamous Sam Bankman-Fried of FTX, ex-Bridgewater Associate Andy Constan, Kai Volatility’s Cem Karsan, The Ambrus Group’s Kris Sidial, the Lithuanian Delegation’s Aušrinė Armonaitė, among many others.

Contact

Direct queries to renato@physikinvest.com or Renato Capelj#8625 on Discord.

Disclaimer

Do not construe this newsletter as advice. All content is for informational purposes.