
Physik Invest’s Daily Brief is read free by thousands of subscribers. Join this community to learn about the fundamental and technical drivers of markets.
Administrative
As previously indicated, through the end-of-this week, newsletters may be shorter due to the letter writer’s commitments. Take care!
Fundamental
Based on the 30-Day Fed Funds (FUTURE: /ZQ), traders expect the Federal Reserve (Fed) to continue its tightening campaign with a 25 basis point rate hike at the next Federal Open Market Committee (FOMC) meeting. Following this, traders expect one more 25 basis point hike that brings the terminal or peak rate to 5.00-5.25%.
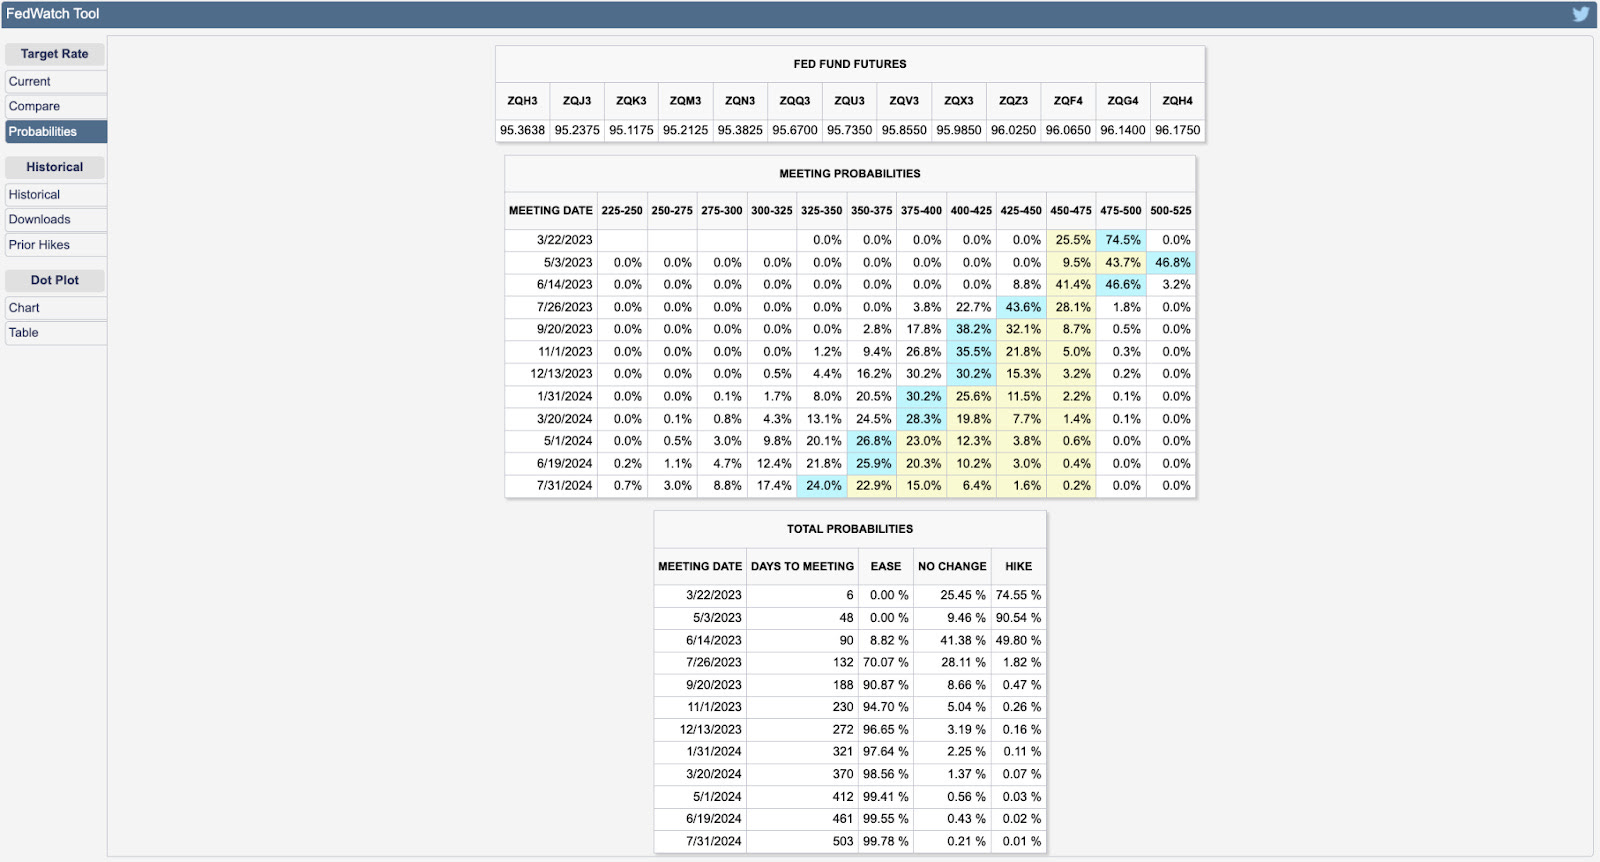
Earlier this week, traders were pricing out hikes on financial institutions’ liquidity issues (e.g., SVB Financial Group) and data, including producer prices and retail sales, “moving in the right direction,” said Vital Knowledge’s Adam Crisafulli.

Now, with fear of contagion ebbing on authorities’ commitment to preventing an “all-out systemic crisis,” explains Bloomberg’s John Authers, traders are again expecting a 5.00-5.25% terminal or peak rate.
Read: Credit Suisse Group AG (NYSE: CS) protection reaches prohibitively expensive levels as banks rush into CDS after big shareholders hesitate to boost their stake. Switzerland was forced to step in with a $54 billion lifeline to stabilize the crisis.
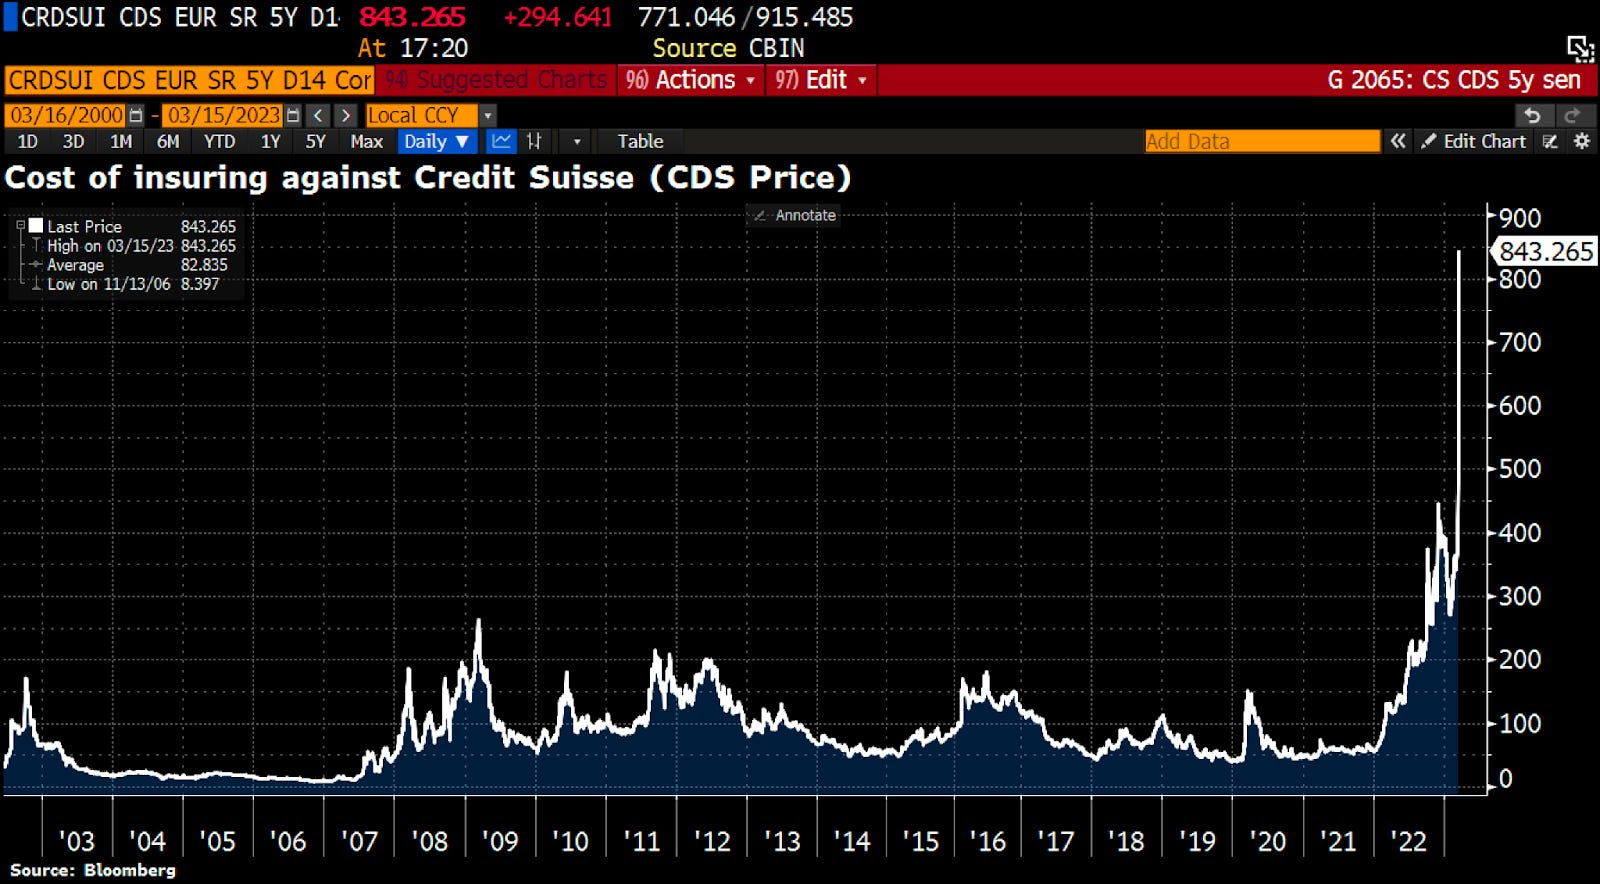
Adding, as Unlimited’s Bob Elliott puts it, “in the [Global Financial Crisis], credit risk spread rapidly. Today, there is very little [credit default swap] impact” or carryover.
Read: Daily Brief for October 4, 2022, for calculating CDS market-implied probability of default.

Positioning
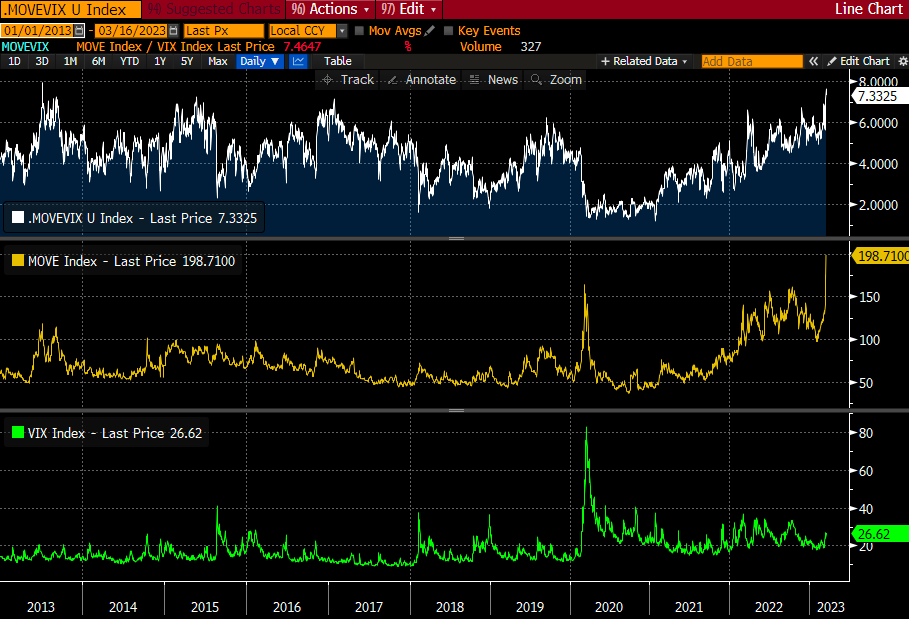
Following measures of US Treasury yield volatility implied by options (i.e., bets or hedges on or against market movement) adjusting higher, equity market volatility strengthened as observed by measures of convexity (e.g., Cboe VIX Volatility Index or VVIX). The Daily Brief for March 14 talked about this in detail.
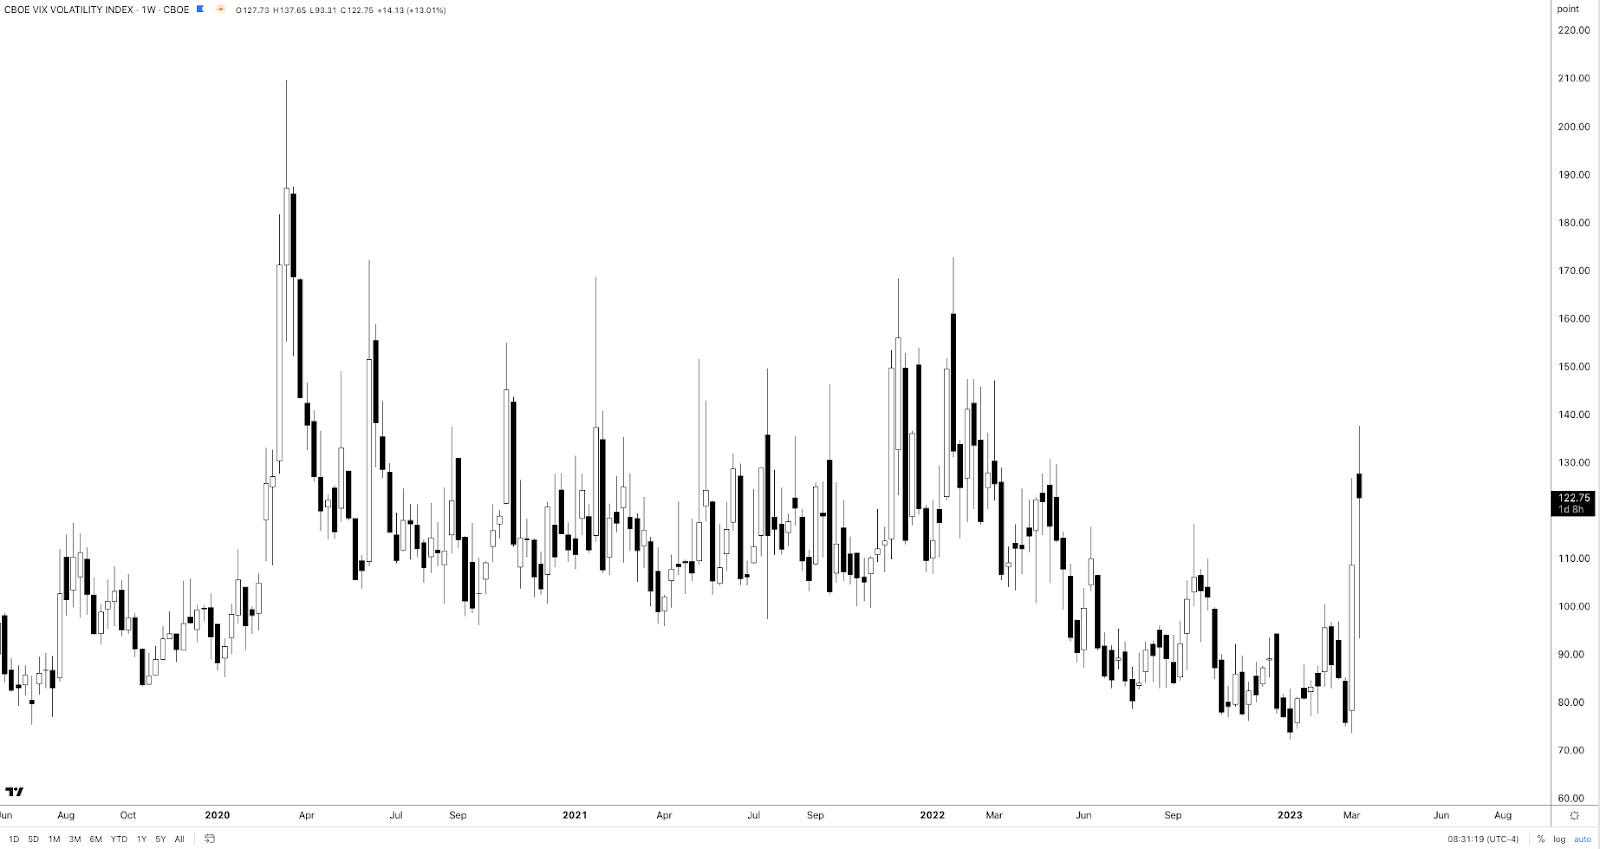
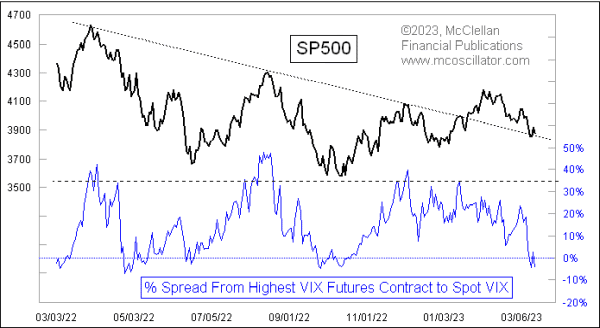
For this protection to keep its value and continue to perform well, realized volatility or RVOL must shift higher substantially and stay elevated. That’s not really happening to some big extent, at least in the equity market. Consequently, put structures such as bear put spreads in the S&P 500 (INDEX: SPX), for example, are not performing.
This information, coupled with falling implied volatility or IVOL, the passage of nearing derivatives expiries, and the strength of products like the Nasdaq 100 (INDEX: NDX) relative to others like the Russell 2000 (INDEX: RUT), has your letter writer leaning optimistic. Though it may be too early to position for strength, one may consider it the way it was explained in the Daily Brief on March 14.
Technical
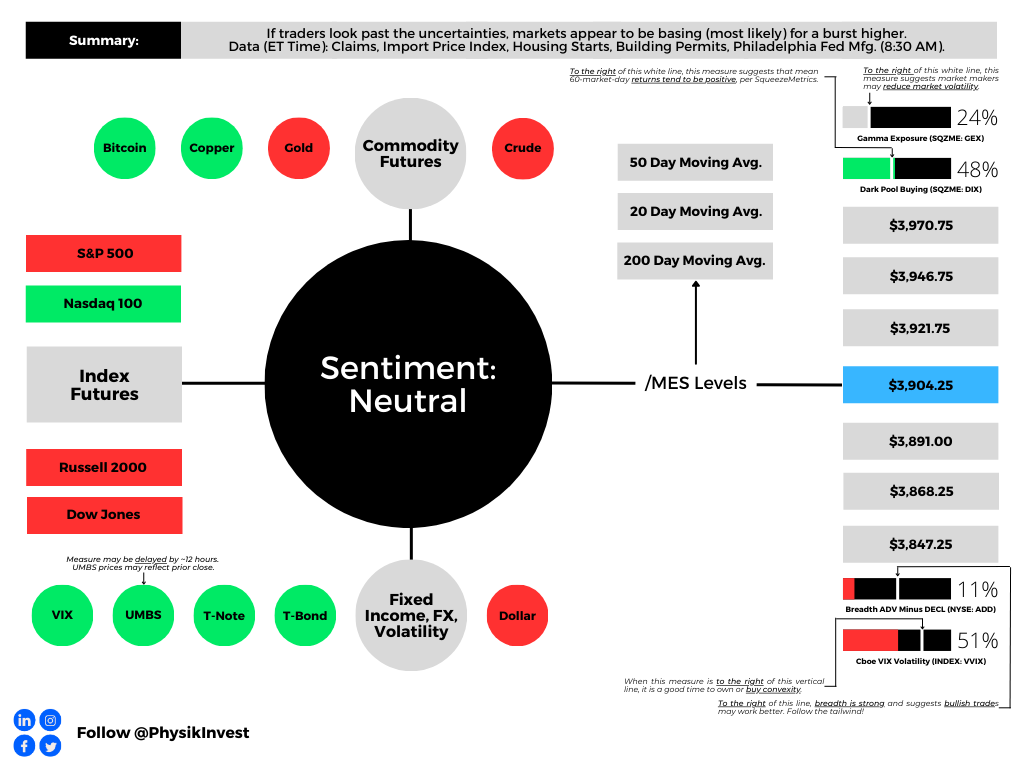
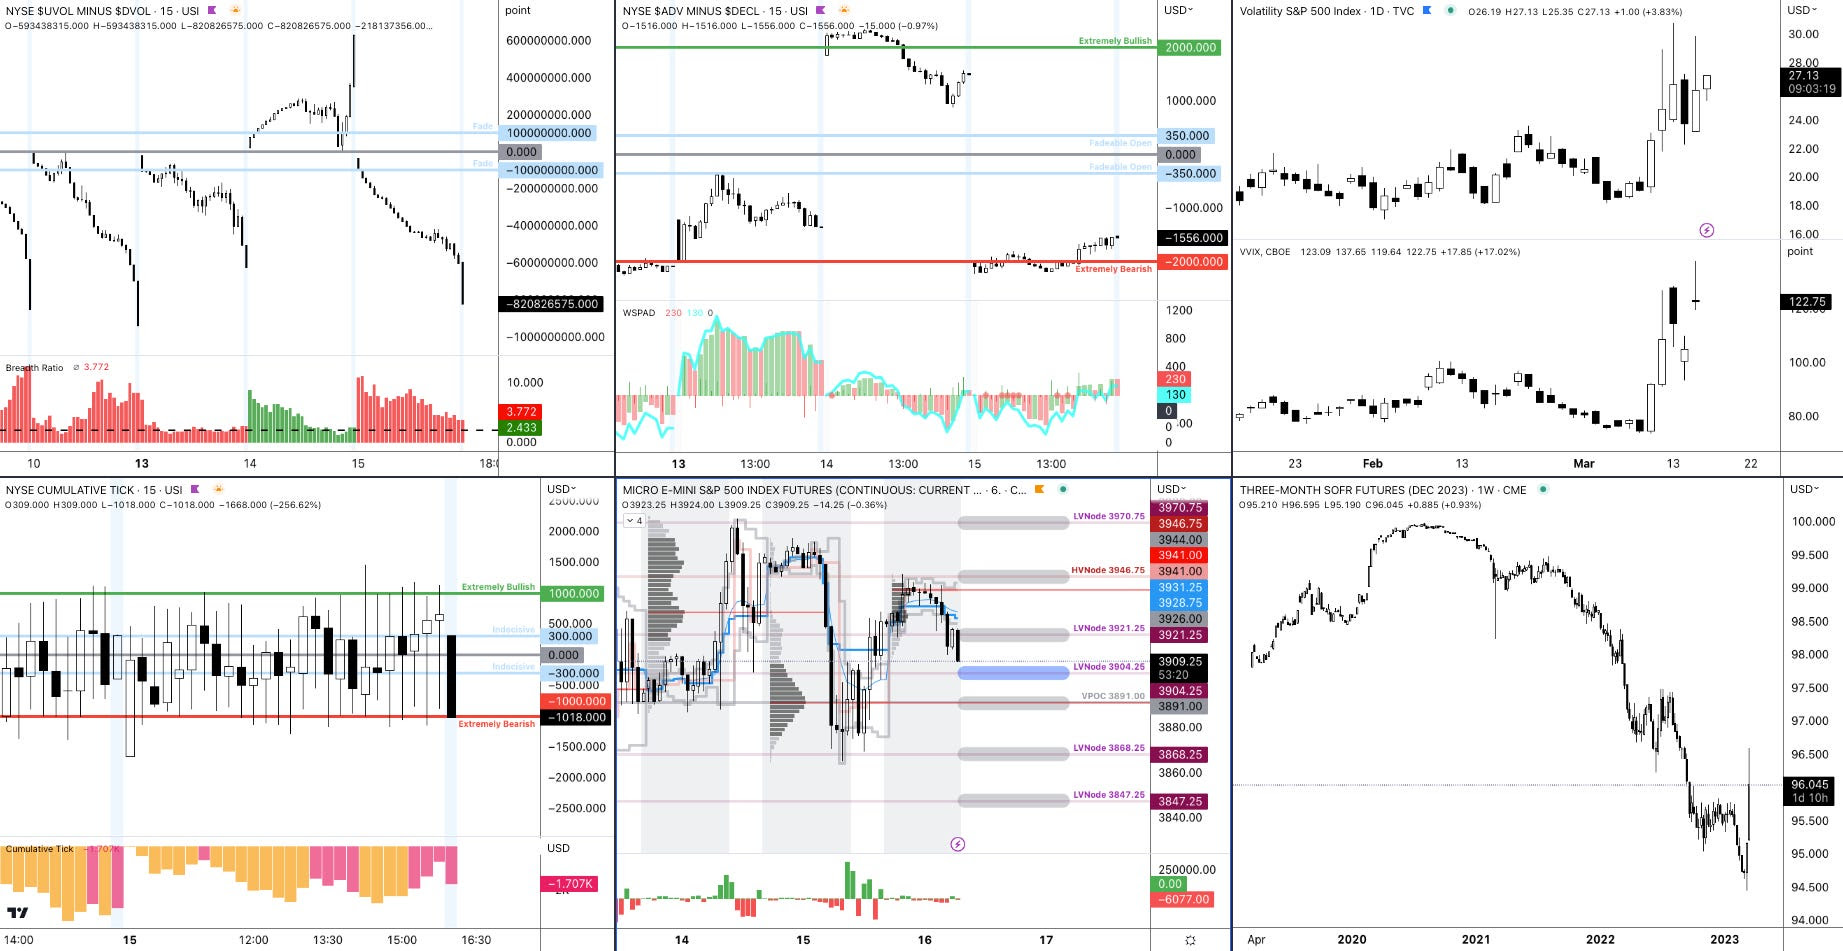
As of 7:15 AM ET, Thursday’s regular session (9:30 AM – 4:00 PM ET), in the S&P 500, is likely to open in the lower part of a balanced overnight inventory, inside of the prior day’s range, suggesting a limited potential for immediate directional opportunity.
The S&P 500 pivot for today is $3,904.25.
Key levels to the upside include $3,921.25, $3,946.75, and $3,970.75.
Key levels to the downside include $3,891.00, $3,868.25, and $3,847.25.
Disclaimer: Click here to load the updated key levels via the web-based TradingView platform. New links are produced daily. Quoted levels likely hold barring an exogenous development.
Definitions
Volume Areas: Markets will build on areas of high-volume (HVNodes). Should the market trend for a period of time, this will be identified by a low-volume area (LVNodes). The LVNodes denote directional conviction and ought to offer support on any test.
If participants auction and find acceptance in an area of a prior LVNode, then future discovery ought to be volatile and quick as participants look to the nearest HVNodes for more favorable entry or exit.
POCs: Areas where two-sided trade was most prevalent in a prior day session. Participants will respond to future tests of value as they offer favorable entry and exit.
Volume-Weighted Average Prices (VWAPs): A metric highly regarded by chief investment officers, among other participants, for quality of trade. Additionally, liquidity algorithms are benchmarked and programmed to buy and sell around VWAPs.
About
The author, Renato Leonard Capelj, spends the bulk of his time at Physik Invest, an entity through which he invests and publishes free daily analyses to thousands of subscribers. The analyses offer him and his subscribers a way to stay on the right side of the market.
Separately, Capelj is an accredited journalist with past works including interviews with investor Kevin O’Leary, ARK Invest’s Catherine Wood, FTX’s Sam Bankman-Fried, North Dakota Governor Doug Burgum, Lithuania’s Minister of Economy and Innovation Aušrinė Armonaitė, former Cisco chairman and CEO John Chambers, and persons at the Clinton Global Initiative.
Connect
Direct queries to renato@physikinvest.com. Find Physik Invest on Twitter, LinkedIn, Facebook, and Instagram. Find Capelj on Twitter, LinkedIn, and Instagram. Only follow the verified profiles.
Calendar
You may view this letter’s content calendar at this link.
Disclaimer
Do not construe this newsletter as advice. All content is for informational purposes. Capelj and Physik Invest manage their own capital and will not solicit others for it.


