
Notice: Up to January 3, 2022, any commentaries published will be lighthearted and, generally, shorter in length.
What Happened
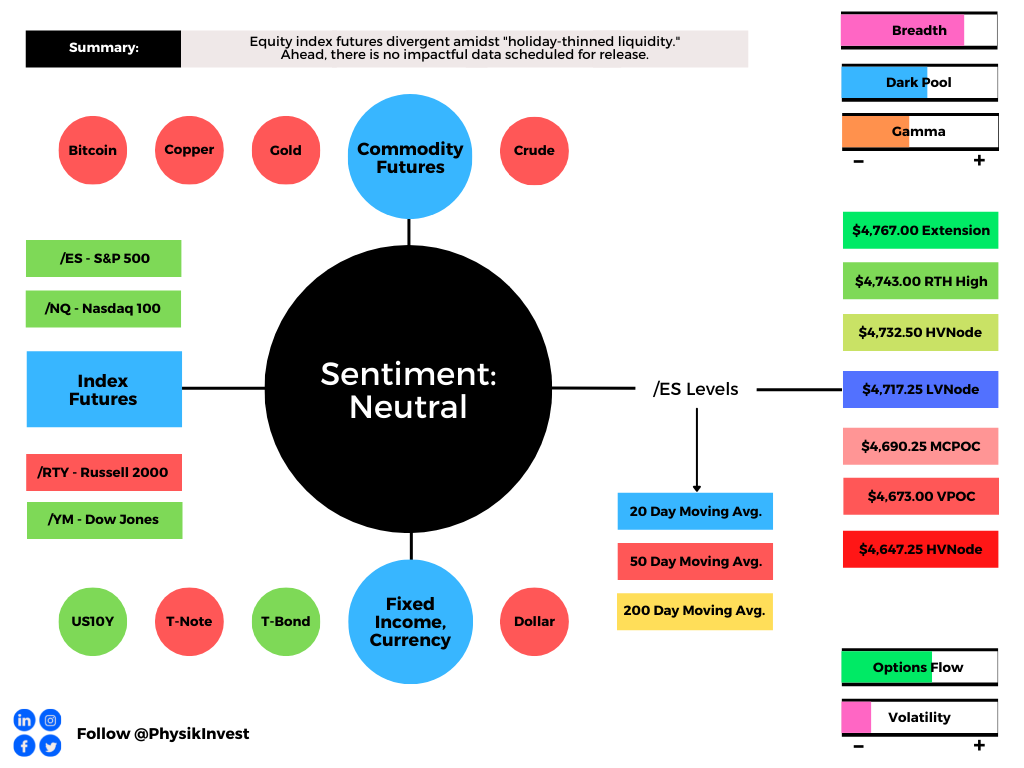
Overnight, equity index and bond futures were divergent while most commodities traded lower.
In the face of “holiday-thinned liquidity,” the CBOE Volatility Index (INDEX: VIX) rose ~1.15; this week, the expectation is (A) flatlined volatility or (B) ugly, headline-driven intraday moves.
Ahead, there is no data scheduled for release.
What To Expect
Last week, on lackluster intraday breadth and market liquidity metrics, the best case outcome occurred via an expansion of range and separation of value, the levels at which participants found it most favorable to transact.
The aforementioned activity, which marks the continuation of a trend, is built on poor structure.
That, ultimately, adds to technical instability.
Why? As explained, Thursday, given the persistence of mechanical responses to key technical levels, visually-driven, weaker-handed participants (which seldom bear the wherewithal to defend retests) carry a heavier hand in recent price discovery.
Via volume profile analysis, we see a plethora of low-volume pockets – voids, if you will – that likely hold virgin tests. As stated, yesterday, successful penetration portends follow-through given the participants that were most active at those technical levels. Caution is still warranted.

Context: In the face of a “stealth correction,” and an “off-loading of risk by professional speculators,” the S&P 500 closed beyond a visual resistance level, last week, on light volume.
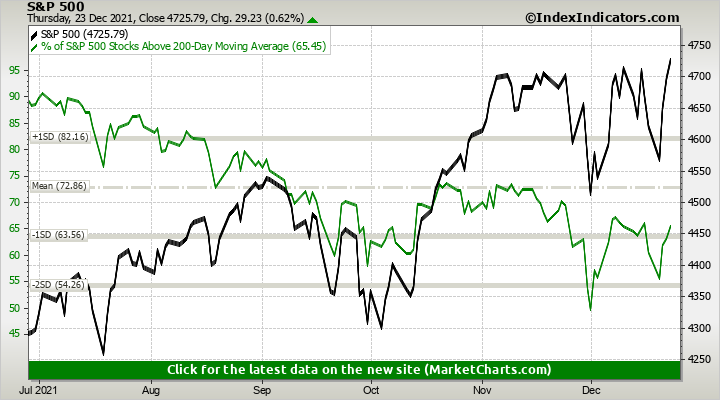
This is as, according to Ryan Detrick of LPL Financial, the “official Santa Claus Rally starts this Monday (last 5 days of the year and the first two of the following year).”
Kai Volatility’s Cem Karsan echoes Detrick’s remarks.
“Since 1980, there have been 10 instances where the S&P 500 was up 20% or more going into the last stretch of trading, and in 9 of those years, it ended the final 6 days higher.”
Moreover, despite an eventual decline in fiscal support, negative adjustments to the EPS guidance of more index constituents, and revisions lower in growth forecasts, Morgan Stanley’s (NYSE: MS) saw flows shift in high-growth, rate-sensitive names – “flows have reversed in recent sessions as there have been small levels of net buying.”
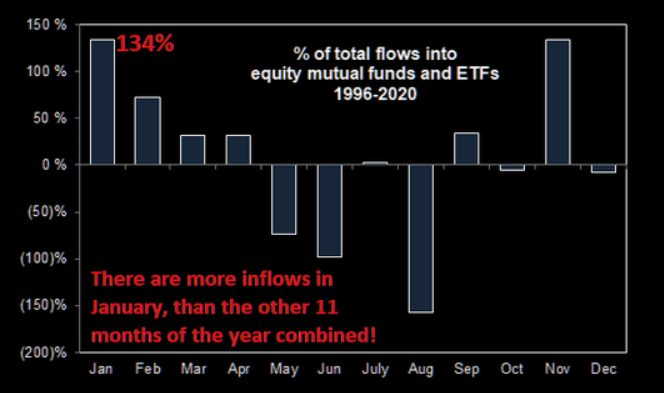
The change in tone with respect to flows is seasonally-aligned, so to speak; per Goldman Sachs Group (NYSE: GS), January sees more inflows than all other months combined.
Adding, in the face of this week’s weighty “Quarterlys” expiry, Goldman Sachs sees options selling attractive, near term; a commitment of capital on lower volatility likely results in counterparties to customer options trades taking on more exposure to sticky positive gamma.
Note: As a position’s delta rises with stock or index price rises, gamma (or how an option’s delta is expected to change given a change in the underlying) is added to the delta.
This is while many products are in lower liquidity and short-gamma (wherein an options delta decreases with stock prices rises and increases when stock prices drop) in which moves are more erratic.
Therefore, coming into weighty options expiration, correlations may be off (as that is the only reconciliation in an environment where, at the index level, hedging pressures are sticky, whereas elsewhere they aren’t).
Thereafter, participants ought to monitor the sides and levels capital is committed for clues as to where we go next.
Continued compression of volatility, as well as a commitment to options higher in prices and further out in time, supports upward price discovery.
Expectations: As of 5:45 AM ET, Monday’s regular session (9:30 AM – 4:00 PM ET), in the S&P 500, will likely open in the upper part of a balanced overnight inventory, inside of prior-range and -value, suggesting a limited potential for immediate directional opportunity.
In the best case, the S&P 500 trades sideways or higher; activity above the $4,717.25 low volume area (LVNode) puts in play the $4,732.50 high volume area (HVNode). Initiative trade beyond the HVNode could reach as high as the $4,743.00 regular trade high (RTH High) and $4,767.00 extension, or higher.
In the worst case, the S&P 500 trades lower; activity below the $4,717.25 LVNode puts in play the $4,690.25 micro composite point of control (MCPOC). Initiative trade beyond the MCPOC could reach as low as the $4,673.00 untested point of control (VPOC) and $4,647.25 HVNode, or lower.
Click here to load today’s key levels into the web-based TradingView charting platform. Note that all levels are derived using the 65-minute timeframe. New links are produced, daily.

What People Are Saying
Definitions
Volume Areas: A structurally sound market will build on areas of high volume (HVNodes). Should the market trend for long periods of time, it will lack sound structure, identified as low volume areas (LVNodes). LVNodes denote directional conviction and ought to offer support on any test.
If participants were to auction and find acceptance into areas of prior low volume (LVNodes), then future discovery ought to be volatile and quick as participants look to HVNodes for favorable entry or exit.
POCs: POCs are valuable as they denote areas where two-sided trade was most prevalent in a prior day session. Participants will respond to future tests of value as they offer favorable entry and exit.
MCPOCs: POCs are valuable as they denote areas where two-sided trade was most prevalent over numerous day sessions. Participants will respond to future tests of value as they offer favorable entry and exit.
Volume-Weighted Average Prices (VWAPs): A metric highly regarded by chief investment officers, among other participants, for quality of trade. Additionally, liquidity algorithms are benchmarked and programmed to buy and sell around VWAPs.
About
After years of self-education, strategy development, and trial-and-error, Renato Leonard Capelj began trading full-time and founded Physik Invest to detail his methods, research, and performance in the markets.
Additionally, Capelj is a Benzinga finance and technology reporter interviewing the likes of Shark Tank’s Kevin O’Leary, JC2 Ventures’ John Chambers, and ARK Invest’s Catherine Wood, as well as a SpotGamma contributor, helping develop insights around impactful options market dynamics.
Disclaimer
At this time, Physik Invest does not carry the right to provide advice. In no way should the materials herein be construed as advice. Derivatives carry a substantial risk of loss. All content is for informational purposes only.