
What Happened
Overnight, equity indices auctioned sideways to higher as the bellwether S&P 500 continues to encounter difficulty in overcoming the forces associated with the large derivatives expiry, Friday.
One headline worth mentioning concerns JPMorgan Chase & Co’s (NYSE: JPM) prediction the Federal Reserve (Fed) will raise interest rates next September, earlier than expected.
Ahead is data on jobless claims and the Philadelphia Fed manufacturing index (8:30 AM ET), leading economic indicators (10:00 AM ET), as well as Fed-speak scattered throughout the day.
What To Expect
On lackluster intraday breadth and market liquidity metrics, the best case outcome occurred, evidenced by a Gaussian profile, as well as the balance and overlap of value in the S&P 500.
This activity, which denotes participants positioning themselves for directional resolve, is adding structure, a technically stabilizing dynamic, in short.
Context: Amidst a rather large monthly options expiration (OPEX) this Friday, participants are having difficulty directionally resolving the S&P 500.
This is most visible by the S&P 500’s failure to move away from the $4,695.25 high volume area (HVNode), a level at which there is concentrated participation in the options market.
As noted before, according to SqueezeMetrics, this level ought to be a magnet given hedging.
“As realized volatility falls from its peak around a year ago, more sold SPX options cluster at strikes nearer to spot. And as implied volatility falls with it, the gamma of those options increases. More dealer long gamma means more liquidity. More liquidity means less movement.”
Moreover, yesterday, there was a note about the market’s reaction to what SpotGamma labels a Call Wall, the strike with the largest net positive gamma in the underlying stock.
This Call Wall is a reflection of participants’ commitment to higher prices. Should that level continue to move up, then that confirms a willingness to do business, higher, so to speak.
Since participants were able to roll their exposure to positive options gamma, higher in price and out in time, dealers have to hedge. This maintains that positive (stabilizing) dealer flow we talk so often about, which has bolstered this equity bull market.

That leads us to a dynamic I briefly mentioned last week. After being brought to my attention again, yesterday, there is obviously more to unpack there. However, in keeping it short, I’ll hit on the basics.
The bond market’s pricing of risk, according to Bloomberg, based on an “erratic … handling [of] large transfers of risk” – as evidenced by the Merrill Lynch Option Volatility Estimate (INDEX: MOVE) – has diverged from the pricing of equity market risk via the CBOE Volatility Index (INDEX: VIX).
Fear in one market tends to feed into the fear in another; regardless of the cause, equity and bond market participants are not on the same page.
What does that mean?
At its core, the fear is in tandem with “broad uncertainty about the direction of the economy and monetary policy amid surging prices, labor shortages and yields that are holding well below the rate of inflation,” according to Bloomberg.
In combating high inflation, policymakers ought to raise rates, right?
Well, that’s at least what economists at institutions like JPM believe may happen as soon as next September, earlier than once forecasted.
Rising rates, among other factors, have the potential to decrease the present value of future earnings, thereby making stocks, especially those that are high growth, less attractive to own.
As the market is a forward-looking mechanism, the implications of this seem staggering.
Prevailing monetary frameworks and max liquidity promoted a large divergence in price from fundamentals. The growth of passive investing – the effect of increased moneyness among nonmonetary assets – and derivatives trading imply a lot of left-tail risks.
As Kai Volatility’s Cem Karsan once told me: “There’s this constant structural positioning that naturally drives markets higher as long as volatility is compressed,” or there is supply.
“At the end of the day, though, the higher you go, the further off the ground you are and the more tail risk.”
Eventually, fear on the part of bond market participants may feed into equity market positioning.
Expectations: As of 6:00 AM ET, Thursday’s regular session (9:30 AM – 4:00 PM ET), in the S&P 500, will likely open in the upper part of a positively skewed overnight inventory, just outside of prior-range and -value, suggesting a potential for immediate directional opportunity.
Gap Scenarios: Gaps ought to fill quickly. Should they not, that’s a signal of strength; do not fade. Leaving value behind on a gap-fill or failing to fill a gap (i.e., remaining outside of the prior session’s range) is a go-with indicator.

Auctioning and spending at least 1-hour of trade back in the prior range suggests a lack of conviction; in such a case, do not follow the direction of the most recent initiative activity.
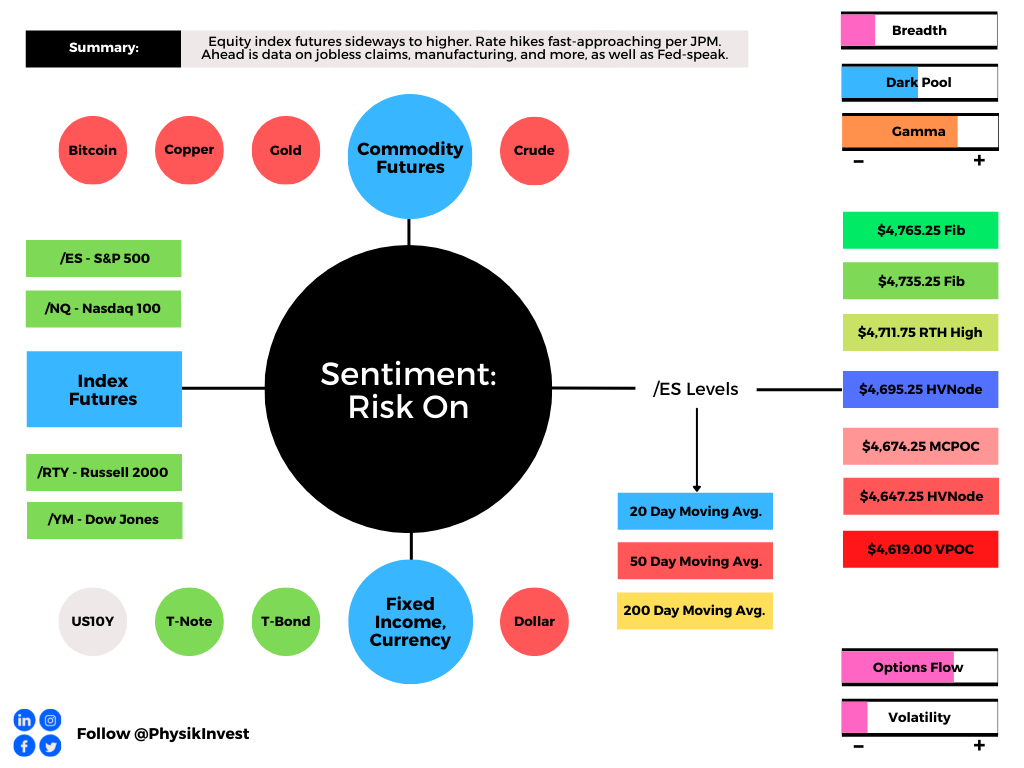
In the best case, the S&P 500 trades sideways or higher; activity above the $4,695.25 high volume area (HVNode) puts in play the $4,711.75 regular-trade high (RTH High). Initiative trade beyond the RTH High could reach as high as the $4,735.25 and $4,765.25 Fibonacci, or higher.
In the worst case, the S&P 500 trades lower; activity below the $4,695.25 HVNode puts in play the $4,674.25 micro composite point of control (MCPOC). Initiative trade beyond the MCPOC could reach as low as the $4,647.25 HVNode and $4,619.00 untested point of control (VPOC), or lower.
Click here to load today’s updated key levels into the web-based TradingView charting platform. Note that all levels are derived using the 65-minute timeframe. New links are produced, daily.

Definitions
Volume Areas: A structurally sound market will build on areas of high volume (HVNodes). Should the market trend for long periods of time, it will lack sound structure, identified as low volume areas (LVNodes). LVNodes denote directional conviction and ought to offer support on any test.
If participants were to auction and find acceptance into areas of prior low volume (LVNodes), then future discovery ought to be volatile and quick as participants look to HVNodes for favorable entry or exit.
VPOCs: POCs are valuable as they denote areas where two-sided trade was most prevalent in a prior day session. Participants will respond to future tests of value as they offer favorable entry and exit.
MCPOCs: POCs are valuable as they denote areas where two-sided trade was most prevalent over numerous day sessions. Participants will respond to future tests of value as they offer favorable entry and exit.
Options Expiration (OPEX): Traditionally, option expiries mark an end to pinning (i.e, the theory that market makers and institutions short options move stocks to the point where the greatest dollar value of contracts will expire) and the reduction dealer gamma exposure.
Significance Of Prior ATHs, ATLs: Prices often encounter resistance (support) at prior highs (lows) due to the supply (demand) of old business. These areas take time to resolve. Breaking and establishing value (i.e., trading more than 30-minutes beyond this level) portends continuation.
About
After years of self-education, strategy development, and trial-and-error, Renato Leonard Capelj began trading full-time and founded Physik Invest to detail his methods, research, and performance in the markets.
Additionally, Capelj is a Benzinga finance and technology reporter interviewing the likes of Shark Tank’s Kevin O’Leary, JC2 Ventures’ John Chambers, and ARK Invest’s Catherine Wood, as well as a SpotGamma contributor, developing insights around impactful options market dynamics.
Disclaimer
At this time, Physik Invest does not manage outside capital and is not licensed. In no way should the materials herein be construed as advice. Derivatives carry a substantial risk of loss. All content is for informational purposes only.
One reply on “Daily Brief For November 18, 2021”
[…] Context: The aforementioned trade is happening in the context of dynamics I touched on in weeks prior, as well as yesterday’s commentary. […]