
What Happened
Overnight, equity index futures were divergent. This comes as there were no significant news catalysts and there is a weighty CBOE Volatility Index (INDEX: VIX) expiration today.
Ahead is data on building permits and housing starts (8:30 AM ET). Numerous Federal Reserve members are scheduled to speak today.
What To Expect
When analyzing the composite (i.e., overnight and day time frame) volume profile, yesterday’s double distribution suggests participants initiated from one area of acceptance to another.
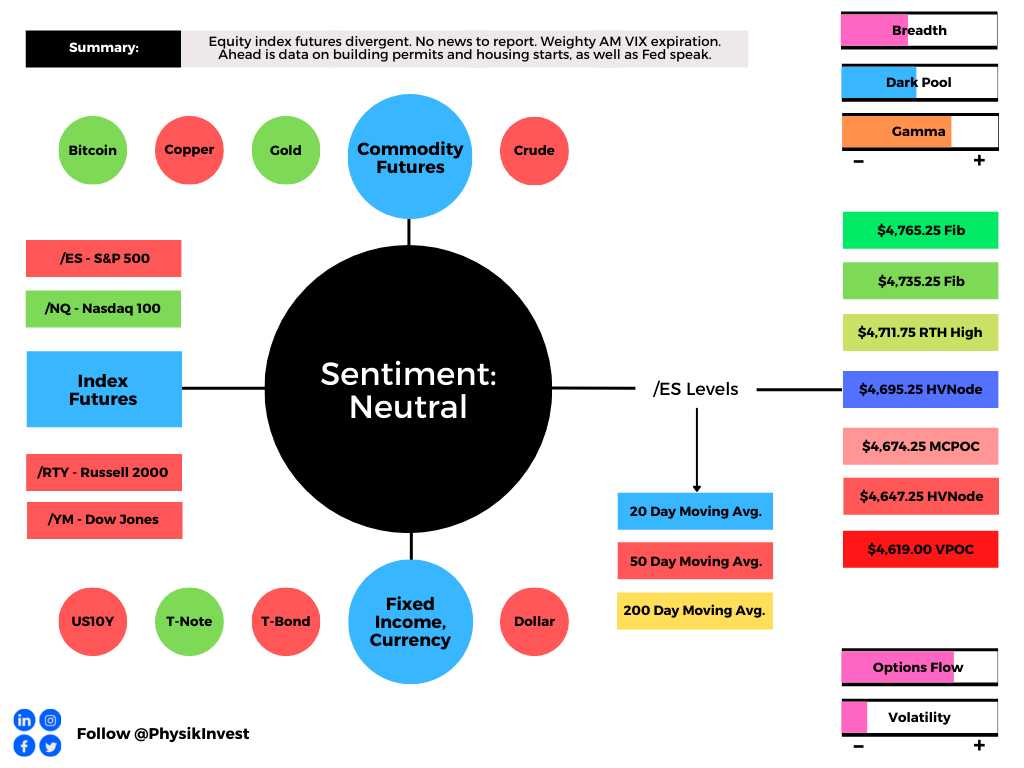
Amidst divergent intraday breadth and market liquidity metrics, the S&P 500 came back into range and participants defended the $4,695.25 high volume area (HVNode). This level corresponds with what options analysis provider SpotGamma says is a Call Wall.
Given an implosion in volatility over the past sessions, the Call Wall is a near-term magnet due to associated hedging.
“As realized volatility falls from its peak around a year ago, more sold SPX options cluster at strikes nearer to spot. And as implied volatility falls with it, the gamma of those options increases. More dealer long gamma means more liquidity. More liquidity means less movement.” – SqueezeMetrics
Context: The aforementioned trade is happening in the context of what Goldman Sachs Group Inc’s (NYSE: GS) CEO David Solomon says is a market environment dominated by greed.
“[T]here have been periods of time when greed has far outpaced fear — we are in one of those periods,” he said. “My experience says those periods aren’t long-lived. Something will rebalance it and bring a little bit more perspective.”
This comes as markets surge alongside historic amounts of stimulus, improvements in fundamentals (i.e., earnings), supply chain demand/supply imbalances, inflation, and more.
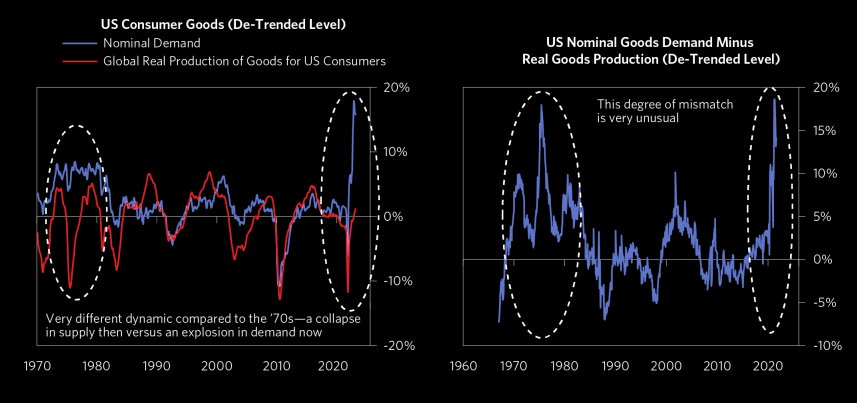
Further, as stated over the past few commentaries, economic structures are different and we are not in the 1970s. That said, there are a few big dynamics that are of concern.
The first is that we see supply pressures beginning to ease as at-home inventory build-ups are expected to take away from consumption during the holidays (for which businesses are scrambling to stock). Ultimately, this may pressure commodity inflation.
The second is this concept of the velocity of money slowing as participants extend moneyness to nonmonetary assets. This is primarily because of monetary policies and an environment of debt and leverage that ultimately cuts into asset price volatility. Overall, this dynamic adds to the prevailing risks of carry when volatility does rise and the demand for money pushes deflation.
Solomon adds: “Chances are interest rates will move up, and if interest rates move up that in of itself will take some of the exuberance out of certain markets.”
With prevailing monetary frameworks and max liquidity promoting a divergence in price from fundamentals, as well as the growth of passive investing and derivatives trading, we ought to have some concern for pending monetary evolution, so to speak.
As Kai Volatility’s Cem Karsan once told me: “A lot of the processes that enforce these bubbles are embedded in the volatility market.”
“There’s this constant structural positioning that naturally drives markets higher as long as volatility is compressed, or there’s a supply of volatility.” However, “At the end of the day, though, the higher you go, the further off the ground you are and the more tail risk.”
Note: This structural positioning in the S&P 500 can be construed as customer long equity, long put, short call. This sort of positioning tends to leave the market in long-gamma whereby dealers buy into weakness and sell into strength. Amidst the decay in protection, dealers are to unwind their hedges (supply less liquidity), and this is a force that bolsters market price rises.
Even the slightest reduction in liquidity has the potential to prick the bubble, prompting a reaction that exacerbates underlying price movements; the response by customers, as well as the dynamics of dealers’ risk exposure to direction and volatility, ought to cut into liquidity and aid in an unraveling.
“It’s not a coincidence that the mid-February to mid-March 2020 downturn literally started the day after February expiration and ended the day of March quarterly expiration. These derivatives are incredibly embedded in how the tail reacts and there’s not enough liquidity, given the leverage, if the Fed were to taper.”
Case in point, the market’s reaction to prices near SpotGamma’s Call Wall. If participants were unable to roll that exposure to positive options gamma higher in price and out in time, dealers would not have to hedge. This cuts into dealers’ need to unwind hedges to customers’ options positions. This removes one positive (stabilizing) flow that has bolstered this equity bull market.

We have seasonally-aligned inflows and earnings growth, among other things, bolstering the most recent rally to new highs. With this week’s implosion in implied volatility most noticeable at the front end of the VIX futures term structure, given the decay in shorter-dated customer protection, it may be an opportune time to hedge.
As The Market Ear stated yesterday, “Playing the term structure (i.e., [buying the] short end of the curve vs [selling] the longer part of the term structure curve) is becoming a rather cheap way to hedge some risks here.”
Expectations: As of 5:45 AM ET, Wednesday’s regular session (9:30 AM – 4:00 PM ET), in the S&P 500, will likely open in the middle part of a balanced overnight inventory, inside of prior-range and -value, suggesting a limited potential for immediate directional opportunity.
Balance-Break Scenarios: A change in the market (i.e., the transition from two-time frame trade, or balance, to one-time frame trade, or trend) may occur.

We shall monitor for acceptance (i.e., more than 1-hour of trade) outside of the prior day’s balance area (i.e., the price levels at which 70% of the day’s volume occurred). Rejection (i.e., return inside of balance) portends a move to the opposite end of the balance.
In the best case, the S&P 500 trades sideways or higher; activity above the $4,695.25 high volume area (HVNode) puts in play the $4,711.75 regular-trade high (RTH High). Initiative trade beyond the RTH High could reach as high as the $4,735.25 and $4,765.25 Fibonacci, or higher.
In the worst case, the S&P 500 trades lower; activity below the $4,695.25 HVNode puts in play the $4,674.25 micro composite point of control (MCPOC). Initiative trade beyond the MCPOC could reach as low as the $4,647.25 HVNode and $4,619.00 untested point of control (VPOC), or lower.
Click here to load today’s updated key levels into the web-based TradingView charting platform. Note that all levels are derived using the 65-minute timeframe. New links are produced, daily.

What People Are Saying
Definitions
Volume Areas: A structurally sound market will build on areas of high volume (HVNodes). Should the market trend for long periods of time, it will lack sound structure, identified as low volume areas (LVNodes). LVNodes denote directional conviction and ought to offer support on any test.
If participants were to auction and find acceptance into areas of prior low volume (LVNodes), then future discovery ought to be volatile and quick as participants look to HVNodes for favorable entry or exit.
POCs: POCs are valuable as they denote areas where two-sided trade was most prevalent in a prior day session. Participants will respond to future tests of value as they offer favorable entry and exit.
MCPOCs: POCs are valuable as they denote areas where two-sided trade was most prevalent over numerous day sessions. Participants will respond to future tests of value as they offer favorable entry and exit.
Options Expiration (OPEX): Traditionally, option expiries mark an end to pinning (i.e, the theory that market makers and institutions short options move stocks to the point where the greatest dollar value of contracts will expire) and the reduction dealer gamma exposure.
Significance Of Prior ATHs, ATLs: Prices often encounter resistance (support) at prior highs (lows) due to the supply (demand) of old business. These areas take time to resolve. Breaking and establishing value (i.e., trading more than 30-minutes beyond this level) portends continuation.
About
After years of self-education, strategy development, and trial-and-error, Renato Leonard Capelj began trading full-time and founded Physik Invest to detail his methods, research, and performance in the markets.
Additionally, Capelj is a Benzinga finance and technology reporter interviewing the likes of Shark Tank’s Kevin O’Leary, JC2 Ventures’ John Chambers, and ARK Invest’s Catherine Wood, as well as a SpotGamma contributor, developing insights around impactful options market dynamics.
Disclaimer
At this time, Physik Invest does not manage outside capital and is not licensed. In no way should the materials herein be construed as advice. Derivatives carry a substantial risk of loss. All content is for informational purposes only.