What Happened: U.S. stock index futures auctioned sideways as participants looked to position themselves for new information with respect to the Federal Reserve’s intent to make policy adjustments.
In other news, Wall Street analysts suggest China’s Evergrande debacle is not a Lehman moment.
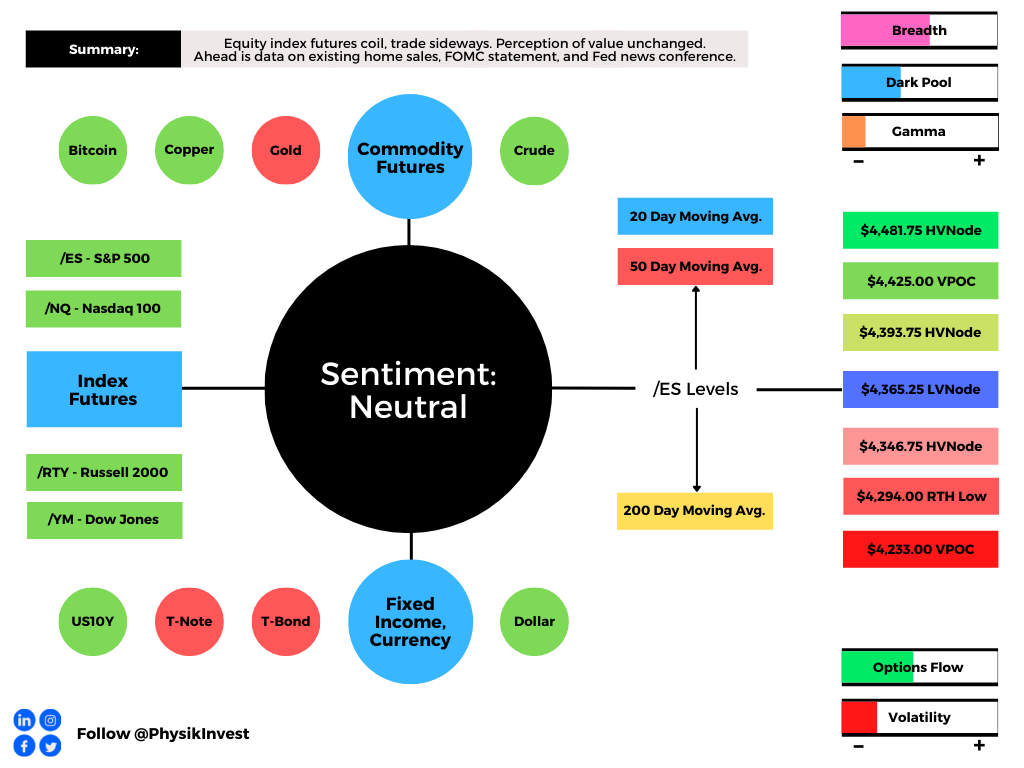
Ahead is data on existing home sales (8:30 AM ET), an FOMC statement (2 PM ET), as well as Fed Chair Jerome Powell’s news conference (2:30 PM ET).
Graphic updated 6:30 AM ET. Sentiment Neutral if expected /ES open is inside of the prior day’s range. /ES levels are derived from the profile graphic at the bottom of the following section. SqueezeMetrics Dark Pool Index (DIX) and Gamma (GEX) calculations are based on where the prior day’s reading falls with respect to the MAX and MIN of all occurrences available. A higher DIX is bullish. At the same time, the lower the GEX, the more (expected) volatility. SHIFT data used for S&P 500 (INDEX: SPX) options activity. Note that options flow is sorted by the call premium spent; if more positive then more was spent on call options. Breadth reflects a reading of the prior day’s NYSE Advance/Decline indicator. VIX reflects a current reading of the CBOE Volatility Index (INDEX: VIX) from 0-100.
What To Expect: As of 6:30 AM ET, Wednesday’s regular session (9:30 AM – 4:00 PM EST) in the S&P 500 will likely open inside of prior-range and -value, suggesting a limited potential for immediate directional opportunity.
Adding, during the prior day’s regular trade, on lackluster intraday breadth and market liquidity metrics, the worst-case outcome occurred, evidenced by symmetrical, overlapping value areas.
This is significant because sideways trade (i.e., balance) marks acceptance, or a willingness to transact at lower prices, after an earlier liquidation.
We’re carrying forward the overhead supply; the 20- and 50-day simple moving averages, as well as the anchored volume-weighted average prices (VWAP), north of the $4,425.00 untested point of control (VPOC), are some key dynamic levels that must be taken to change the tone.
Balance (Two-Timeframe Or Bracket) Is The Status Quo: Rotational trade that denotes current prices offer favorable entry and exit. Balance-areas make it easy to spot a change in the market (i.e., the transition from two-time frame trade, or balance, to one-time frame trade, or trend).

Modus operandi is responsive trade (i.e., fade the edges), rather than initiative trade (i.e., play the break).
Further, according to JPMorgan Chase & Co’s (NYSE: JPM) Marko Kolanovic, the aforementioned trade is happening in the context of “technical selling flows (CTAs and option hedgers) in an environment of poor liquidity, and overreaction of discretionary traders to perceived risks.”
Despite these conditions, Kolanovic anticipates a continued move higher in the equity market as the COVID-19 delta wave fades and companies beat third-quarter earnings expectations.
“We remain constructive on risk assets and last week upgraded our S&P 500 price target, given expectations of a reacceleration in activity as the delta wave fades and better than expected earnings,” Kolanovic added. “Risks are well-flagged and priced in, with stock multiples back at post-pandemic lows for many reopening/recovery exposures; we look for Cyclicals to resume leadership as delta inflects. We expect the S&P 500 to reach 4,700 by the end of 2021 and to surpass 5,000 next year.”
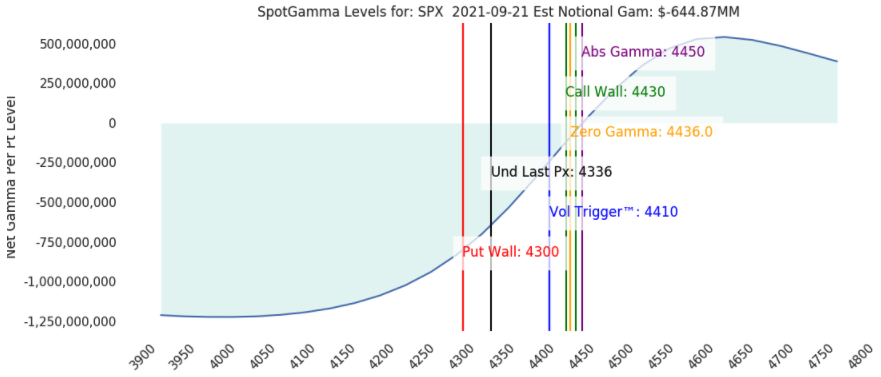
In terms of positioning, SpotGamma data suggests the S&P 500 is at an important junction ahead of the Federal Open Market Committee statement and news conference, later today; a directional move higher (lower) could set the index up for lower (higher)volatility.
Graphic: Based on an analysis of positioning in the options market, SpotGamma plots key levels to be aware of; presently, the S&P 500 is in short-gamma territory. Gamma is the sensitivity of an option to changes in the underlying price. Those that take the other side and warehouse these risks hedge their exposure by buying and selling the underlying. When dealers are short-gamma, they hedge by buying into strength and selling into weakness. When dealers are long-gamma, they hedge by selling into strength and buying into weakness. The former exacerbates volatility. The latter calms volatility.
Moreover, for today, participants may make use of the following frameworks.
In the best case, the S&P 500 trades sideways or higher; activity above the $4,365.25 LVNode pivot puts in play the $4,393.75 high volume area (HVNode). Initiative trade beyond the HVNode could reach as high as the $4,425.00 untested point of control (VPOC) and $4,481.75 HVNode, or higher.
In the worst case, the S&P 500 trades lower; activity below the $4,365.25 LVNode pivot puts in play the $4,346.75 HVNode. Initiative trade beyond the HVNode could reach as low as the $4,294.00 regular trade low (RTH Low) and $4,233.00 VPOC, or lower.
Graphic: 65-minute profile chart of the Micro E-mini S&P 500 Futures updated 6:30 AM ET.
Definitions
Volume Areas: A structurally sound market will build on areas of high volume (HVNodes). Should the market trend for long periods of time, it will lack sound structure, identified as low volume areas (LVNodes). LVNodes denote directional conviction and ought to offer support on any test.
If participants were to auction and find acceptance into areas of prior low volume (LVNodes), then future discovery ought to be volatile and quick as participants look to HVNodes for favorable entry or exit.
Volume-Weighted Average Prices (VWAPs): A metric highly regarded by chief investment officers, among other participants, for quality of trade. Additionally, liquidity algorithms are benchmarked and programmed to buy and sell around VWAPs.
POCs: POCs are valuable as they denote areas where two-sided trade was most prevalent in a prior day session. Participants will respond to future tests of value as they offer favorable entry and exit.
Value-Area Placement: Perception of value unchanged if value overlapping (i.e., inside day). Perception of value has changed if value not overlapping (i.e., outside day). Delay trade in the former case.
News And Analysis
A modest shift in retail spending amid variant uncertainty.
The gobal economic recovery is hitting some speed limits.
Areas of emerging markets present investor opportunities.
The Fed debate on tapering just became a lot more tricky.
House passes debt limit suspension, setting up standoffs.
Democrats pursue the debt move with emergency option.
Evergrande is not another Lehman. Here is the bad news.
What People Are Saying
“once an event has passed … the excess ‘Event Vol’ from the event … releases potential energy in the form of [natural supportive] Wanda … flows” = 1st move
"it's impossible to know if options are a good deal or not because we don't know a) what the true distribution of stock prices is or will be and b ) what random event (either to the high vol (2020) or low vol (2017) side is coming."
After years of self-education, strategy development, and trial-and-error, Renato Leonard Capelj began trading full-time and founded Physik Invest to detail his methods, research, and performance in the markets.
Additionally, Capelj is a finance and technology reporter. Some of his biggest works include interviews with leaders such as John Chambers, founder and CEO, JC2 Ventures, Kevin O’Leary, businessman and Shark Tank host, Catherine Wood, CEO and CIO, ARK Invest, among others.
Disclaimer
At this time, Physik Invest does not manage outside capital and is not licensed. In no way should the materials herein be construed as advice. Derivatives carry a substantial risk of loss. All content is for informational purposes only.
Editor’s Note: Keeping it light today; the main takeaway is that we’re in a window of volatility and participants should maintain a cautiously bullish stance, for the time being. Skew makes it so we can hedge for little-to-no cost using complex spreads (more on this below).
Please note that levels in the below graphics should only be relied upon as rough areas of resistance and support due to the December contract roll. Updated levels to come later this week, after daily commentaries resume Thursday, September 16.
Equity index futures trade lower, last week, resolving a multi-week consolidation area.
Narratives around slower recovery rising.
Equity indices falling; SPX above 50-day.
Positioning risks mount case for volatility.
A couple trade ideas for the week ahead.
What Happened: U.S. stock index futures resolved lower, last week, alongside the evolution of some important dynamics with respect to the pace of the pandemic recovery and trend growth, non-seasonally aligned flows and positioning risks, as well as divergent sentiment.
Of interest this week is data on the consumer price index, industrial production, retail sales, and some Fed manufacturing surveys.
Graphic updated 12:00 PM ET Saturday. Sentiment Neutral if expected /ES open is inside of the prior day’s range. SqueezeMetrics Dark Pool Index (DIX) and Gamma (GEX) calculations are based on where the prior day’s reading falls with respect to the MAX and MIN of all occurrences available. A higher DIX is bullish. At the same time, the lower the GEX, the more (expected) volatility. SHIFT data used for S&P 500 (INDEX: SPX) options activity approximation. Note that options flow is sorted by the call premium spent; if more positive then more was spent on call options. Breadth reflects a reading of the prior day’s NYSE Advance/Decline indicator. VIX reflects a current reading of the CBOE Volatility Index (INDEX: VIX) from 0-100.
What To Expect: During the prior week’s regular trade, on weak intraday breadth and mostly divergent market liquidity metrics, the worst-case outcome occurred, evidenced by trade below a key micro-composite high volume area (HVNode).
This activity resolved a multi-week consolidation area (ie., balance).
Volume Areas: A structurally sound market will build on past areas of high volume. Should the market trend for long periods of time, it will lack sound structure (identified as a low volume area which denotes directional conviction and ought to offer support on any test).

If participants were to auction and find acceptance into areas of prior low volume, then future discovery ought to be volatile and quick as participants look to areas of high volume for favorable entry or exit.

Balance (Two-Timeframe Or Bracket): Rotational trade that denotes current prices offer favorable entry and exit. Balance-areas make it easy to spot a change in the market (i.e., the transition from two-time frame trade, or balance, to one-time frame trade, or trend).

Modus operandi is responsive trade (i.e., fade the edges), rather than initiative trade (i.e., play the break).
To note, initially, participants had a tough time separating value and expanding range lower.
This was evidenced by the minimal excess at Wednesday’s regular trade low (RTH Low), coupled with Thursday’s overnight response at the 20-day simple moving average (i.e., a visual level likely paid attention to by short-term, technically-driven market participants who generally are unable to defend retests).
Graphic: S&P 500 loses the 20-day simple moving average. A loss of that level officially changes the tone; “We maintain a cautiously bullish stance.”
Given that action – the difficulty participants had in moving prices out and away from balance – the path of least resistance was not down; stronger sellers were not yet on board, I explained.
Excess: A proper end to price discovery; the market travels too far while advertising prices. Responsive, other-timeframe (OTF) participants aggressively enter the market, leaving tails or gaps which denote unfair prices.

Value-Area Placement: Perception of value unchanged if value overlapping (i.e., inside day). Perception of value has changed if value not overlapping (i.e., outside day). Delay trade in the former case.
Graphic: 30-minute profile chart of the Micro E-mini S&P 500 Futures and market liquidity, via Bookmap, for the SPDR S&P 500 ETF Trust (NYSE: SPY) coming into Thursday’s regular trade. Notice the cumulative volume delta (CVD) or buying and selling power as calculated by the difference in volume traded at the bid and offer. So, coming into Friday’s trade, stronger sellers were likely not yet on board.
The tone changed Friday when selling intensified; the 20-day simple moving average was lost and the S&P 500 closed the session on a spike lower, away from value.
Spike Rules In Play: Spike’s mark the beginning of a break from value. Spikes higher (lower) are validated by trade at or above (below) the spike base (i.e., the origin of the spike).
Further, the aforementioned trade is happening in the context of peak growth and a moderation in the economic recovery, heightened valuations, the prospects of stimulus reduction, as well as non-seasonally aligned inflows, impactful options market dynamics, divergent sentiment, and fears of a mid-cycle transition.
The implications of these themes on price are contradictory.
To elaborate, Morgan Stanley (NYSE: MS), Citigroup Inc (NYSE: C), and Goldman Sachs Group Inc (NYSE: GS) cautioned investors about equity outlooks. Of concern, in particular, is a rise in cases of the delta variant, tensions between inflation expectations and yields, as well as seasonality.
Among other risks, as SpotGamma notes, “markets are fast approaching a window of volatility which could produce some pretty sharp volatility: 9/15 VIX expiration, 9/17 Quarterly OPEX and the 9/22 FOMC. This lineup is particularly interesting as we believe that expiration leads to a pickup in volatility.” Read more on SpotGamma’s perspectives, here.
Graphic: @pat_hennessy breaks down returns for the S&P 500, categorized by the week relative to OPEX. Based on his analysis, Pat sees that the “2 weeks prior to OPEX (e.g., 7/30/21 to 8/6/21 in this late-cycle) [have] been extremely bullish,” while “OPEX week returns peaked in 2016 and have trended lower since.”
SqueezeMetrics – which saw “the current combination of weak put flows and large customer vanna exposure” as fragile – echoes the risks of volatility adding “people are overexposed to changes in VIX, and will be hurt more than usual if VIX starts moving up. Historically, this means SPX down, VIX up.”
Moreover, for early trade next week, given an increased potential for heightened volatility and Friday’s end-of-day spike from value, participants may make use of the following framework.
If participants manage to find acceptance (i.e., spend multiple hours of trade) above the $4,467.00 spike base, then the odds of downside follow-through are lower. We’d look to maintain a cautiously bullish stance.
On the other hand, should participants have trouble maintaining prices above the $4,467.00 spike base, then the focus ought to be on big-picture risk management levels like the August 19, 2021 swing low and 50-day simple moving average.
Graphic: 65-minute profile chart of the Micro E-mini S&P 500 Futures updated 12:00 PM ET Saturday. Note that the roll to the December contract occurred on September 9, 2021. Therefore, levels in the above graphic should only be relied upon as rough areas of resistance and support. Updated levels to come Thursday, September 16, 2021.
Weekly Trade Idea
Please Note: In no way is the below a trade recommendation. Derivatives carry a substantial risk of loss. All content is for informational purposes only.
Options offer an efficient way to gain directional exposure.
If an option buyer was short (long) stock, he or she could buy a call (put) to hedge upside (downside) exposure. Additionally, one can spread, or buy (+) and sell (-) options together, strategically.
Commonly discussed spreads include credit, debit, ratio, back, and calendar.
Credit: Sell -1 option closer to the money. Buy +1 option farther out of the money.
Debit: Buy +1 option closer to the money. Sell -1 option farther out of the money.
Ratio: Buy +1 option closer to the money. Sell -2 options farther out of the money.
Back: Sell -1 option closer to the money. Buy +2 options farther out of the money.
Calendar: Sell -1 option. Buy +1 option farther out in time, at the same strike.
Typically, if bullish (bearish), sell at-the-money put (call) credit spread and/or buy a call (put) debit/ratio spread structured around target price. Alternatively, if the expected directional move is great (small), opt for a back spread (calendar spread). Also, if credit spread, capture 50-75% of the premium collected. If debit spread, capture 2-300% of the premium paid.
Be cognizant of risk exposure to direction (delta), time (theta), and volatility (vega).
Negative (positive) delta = synthetic short (long).
Negative (positive) theta = time decay hurts (helps).
Trade Idea 1: SELL -1 1/2 BACKRATIO SPX 100 (Weeklys) 17 SEP 21 4350/4250 PUT @3.80 LMT
I’m neutral-to-bearish on the S&P 500 and I think the index may travel sideways to lower over the next week, past its key moving averages. I will structure a spread below the current index price, expiring in 1 week. I will buy the 4350 put option once (+1) and sell the 4250 put option twice (-2) for a $3.80 credit. Should the index not move to my target, I keep the $380 credit. Should it move to $4,250.00, past the 50-day simple moving average, I could make $10,380.00 at expiry. Should the index move past $4,150.00 or so, I may incur unlimited losses. My goal, with this spread, is to capture the initial credit and close for additional credit if the index moves lower.
If necessary, I will hedge the position by either (A) selling futures, (B) widening strikes, (C) buying a far out-of-the-money put option to cap downside in case of an unpredictable move lower, or (D) roll strikes down in price and out in time.
Trade Idea 2: SELL -1 1/2 BACKRATIO GOOGL 100 17 SEP 21 2775/2700 PUT @.90 LMT
I’m neutral-to-bearish on Alphabet Inc and I think the stock may travel sideways to lower over the next week, past its key moving averages. I will structure a spread below the current stock price, expiring in 1 week. I will buy the 2775 put option once (+1) and sell the 2700 put option twice (-2) for a $0.90 credit. Should the stock not move to my target, I keep the $90 credit. Should it move to $2,700.00, toward the 50-day simple moving average, I could make $7,500.00 at expiry. Should the stock move past $2,625.00 or so, I may incur unlimited losses. My goal, with this spread, is to capture the initial credit and close for additional credit if the stock moves lower.
If necessary, I will hedge the position by either (A) selling stock, (B) widening strikes, (C) buying a far out-of-the-money put option to cap downside in case of an unpredictable move lower, or (D) roll strikes down in price and out in time.
News And Analysis
Lenders continue to expect falling profits, refinancing demand.
Manchin seeing delay in Congress for vote on Biden’s agenda.
Massive decline in forbearances, down nearly 67% from peak.
Oil prices continuing to fall as pandemic worries slow demand.
Moody’s: Democrats are at a fork in the road, may not take it.
COVID-19 and China risks won’t pass for years, some project.
Nasdaq talks market infrastructure, the real trends in volumes.
Bonds turning hot; European Central Bank redefines tapering.
What People Are Saying
Producer Price Inflation is above 10% for the first time since 1981 on a finished goods basis (the main measure used until 2011). On a final demand basis, it's 8.3%, highest since inception in 2011. Either way, it's worryingly high. pic.twitter.com/vIYCRAjd79
In this the SPX chart, OPEX is marked. It does give the appearance that volatility has shifted from end of month aka "mid OPEX cycle" to OPEX itself. pic.twitter.com/huedOFaMGL
With every up swing shorter than the previous one and loss of momentum, this market tells me it wants to correct. No top reversal chart pattern. No breakdown signal as of Friday's close. 4,100-4,200 area is support. #SPXpic.twitter.com/sPkQEPghQ8
After years of self-education, strategy development, and trial-and-error, Renato Leonard Capelj began trading full-time and founded Physik Invest to detail his methods, research, and performance in the markets.
Additionally, Capelj is a finance and technology reporter. Some of his biggest works include interviews with leaders such as John Chambers, founder and CEO, JC2 Ventures, Kevin O’Leary, businessman and Shark Tank host, Catherine Wood, CEO and CIO, ARK Invest, among others.
Disclaimer
At this time, Physik Invest does not manage outside capital and is not licensed. In no way should the materials herein be construed as advice. Derivatives carry a substantial risk of loss. All content is for informational purposes only.
Editor’s Note: Daily market commentaries to pause until Thursday, September 16, 2021, due to travel commitments. A weekend commentary will be in your inbox earlier this week.
Equity index futures trade lower with yields, dollar, and bitcoin. Most commodities were green.
Narratives around slower recovery rising.
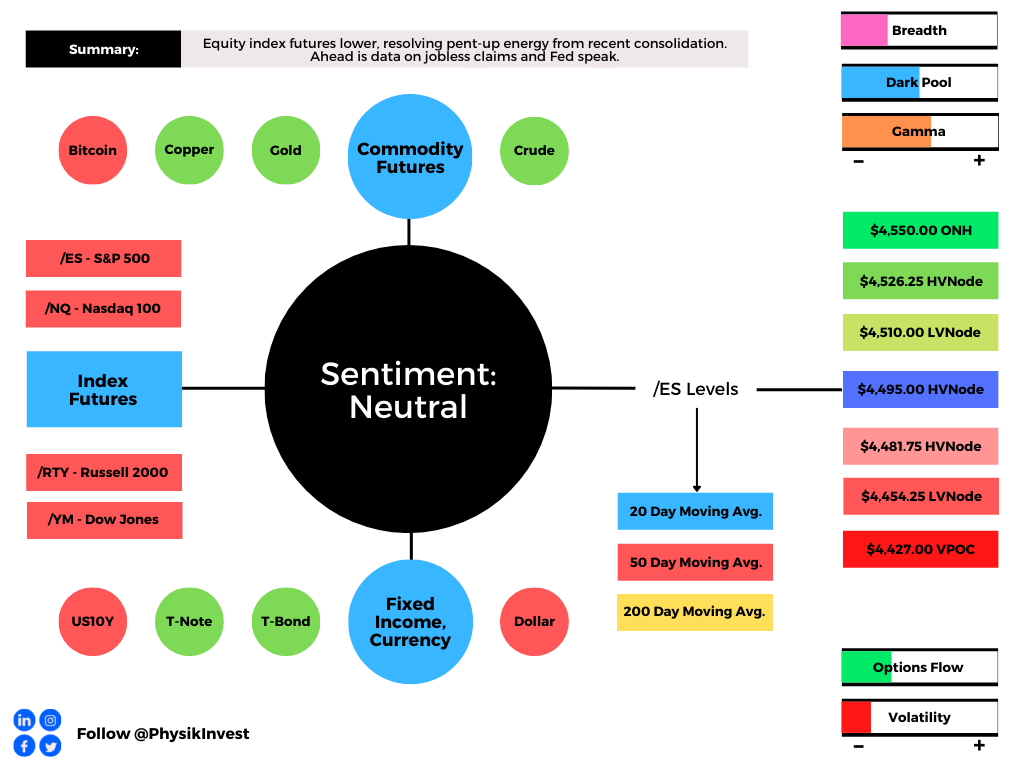
Ahead is jobless claims data, Fed speak.
Positioning risks mounting case for lower.
What Happened: U.S. stock index futures auctioned lower overnight alongside narratives surrounding a slowed economic recovery and stimulus reductions.
Ahead is data on jobless claims (8:30 AM ET), as well as Fed-speak by Bowman (1:00 PM ET) and Williams (2:00 PM ET).
Graphic updated 6:30 AM ET. Sentiment Neutral if expected /ES open is inside of the prior day’s range. SqueezeMetrics Dark Pool Index (DIX) and Gamma (GEX) calculations are based on where the prior day’s reading falls with respect to the MAX and MIN of all occurrences available. A higher DIX is bullish. At the same time, the lower the GEX, the more (expected) volatility. SHIFT data used for S&P 500 (INDEX: SPX) options activity approximation. Note that options flow is sorted by the call premium spent; if more positive then more was spent on call options. Breadth reflects a reading of the prior day’s NYSE Advance/Decline indicator. VIX reflects a current reading of the CBOE Volatility Index (INDEX: VIX) from 0-100.
What To Expect: As of 6:30 AM ET, Thursday’s regular session (9:30 AM – 4:00 PM EST) in the S&P 500 will likely open inside of prior-range and -value, suggesting a limited potential for immediate directional opportunity.
Adding, during the prior day’s regular trade, on weak intraday breadth and divergent market liquidity metrics, the best case outcome occurred, evidenced by sideways trade at the $4,510.00 pivot, the low end of a recent consolidation (i.e., balance) area.
Balance (Two-Timeframe Or Bracket): Rotational trade that denotes current prices offer favorable entry and exit. Balance-areas make it easy to spot a change in the market (i.e., the transition from two-time frame trade, or balance, to one-time frame trade, or trend).

Modus operandi is responsive trade (i.e., fade the edges), rather than initiative trade (i.e., play the break).
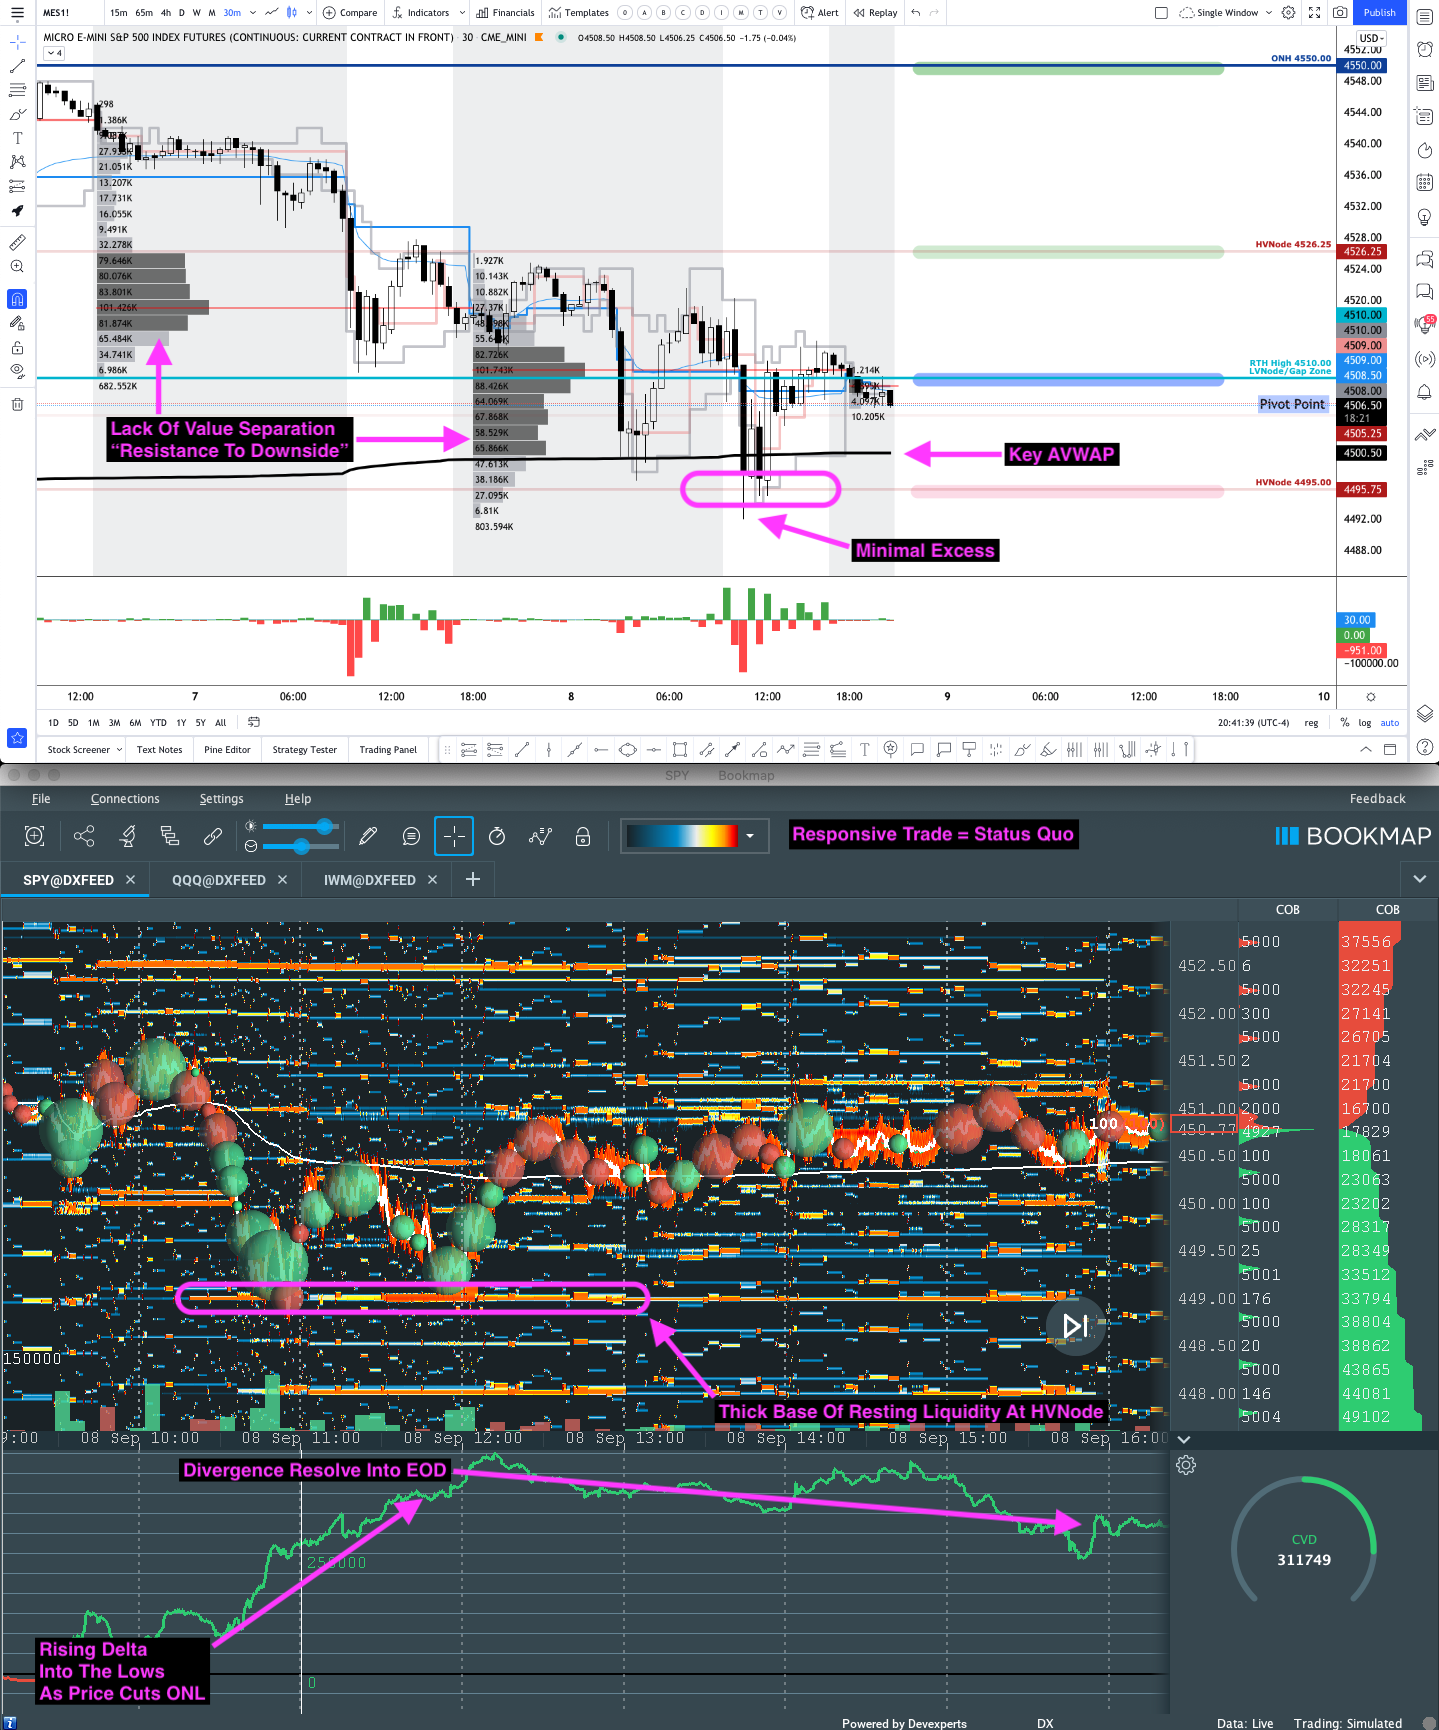
To note, participants had a tough time separating value and expanding range lower.
This is evidenced by the minimal excess at yesterday’s regular trade low (RTH Low), coupled with an overnight response at the 20-day simple moving average (i.e., a visual level likely paid attention to by short-term, technically-driven market participants).
In other words, we’re carrying forward the difficulty participants had, in days prior, to moving prices out and away from balance. The path of least resistance – at least in prior trade – was not down; stronger sellers are not yet on board.
Excess: A proper end to price discovery; the market travels too far while advertising prices. Responsive, other-timeframe (OTF) participants aggressively enter the market, leaving tails or gaps which denote unfair prices.

Value-Area Placement: Perception of value unchanged if value overlapping. Perception of value has changed if value not overlapping (i.e., outside day). Delay action in the former case.
Graphic: 30-minute profile chart of the Micro E-mini S&P 500 Futures and market liquidity, via Bookmap, for the SPDR S&P 500 ETF Trust (NYSE: SPY). Notice the volume delta (CVD) or buying and selling power as calculated by the difference in volume traded at the bid and offer.
Balance-Break Scenarios In Play: A change in the market (i.e., the transition from two-time frame trade, or balance, to one-time frame trade, or trend) has occurred.

Though we expect sideways to lower trade – for the time being – we monitor for rejection (i.e., return inside of balance) which portends a move higher, to the opposite end of the balance.
Further, the aforementioned trade is happening in the context of peak growth and a moderation in the economic recovery, as well as non-seasonally aligned inflows, impactful options market dynamics, divergent sentiment, and fears of a mid-cycle transition.
The implications of these themes on price are contradictory.
To elaborate, Morgan Stanley (NYSE: MS), Citigroup Inc (NYSE: C), and Goldman Sachs Group Inc (NYSE: GS) cautioned investors about equity outlooks. Of concern, in particular, is a rise in cases of the delta variant, tensions between inflation expectations and yields, as well as seasonality.
Among other risks, as SqueezeMetrics summarizes, “[p]eople pretty much stopped buying S&P 500 puts [last] week. At the same time, people are overexposed to changes in VIX, and will be hurt more than usual if VIX starts moving up. Historically, this means SPX down, VIX up.”
Moreover, for today, given an increased potential for moderate volatility and responsive trade, participants may make use of the following frameworks.
In the best case, the S&P 500 trades sideways or higher; activity above the $4,495.00 high volume area (HVNode) pivot puts in play the $4,510.00 low volume area (LVNode). Initiative trade beyond the LVNode could reach as high as the $4,526.25 HVNode and $4,550.00 overnight high (ONH).
In the worst case, the S&P 500 trades lower; activity below the $4,495.00 HVNode puts in play the $4,481.75 HVNode. Initiative trade beyond the $4,481.75 HVNode could reach as low as the $4,454.25 LVNode and $4,427.00 untested point of control (VPOC).
Note the developing volume-weighted average price (VWAP) pinch. VWAP is a metric highly regarded by chief investment officers, among other participants, for quality of trade. Additionally, liquidity algorithms are benchmarked and programmed to buy and sell around VWAPs. We look to buy above a flat/rising VWAP pinch. Sell below a flat/declining VWAP pinch.
Overnight Rally Highs (Lows): Typically, there is a low historical probability associated with overnight rally-highs (lows) ending the upside (downside) discovery process.

Volume Areas: A structurally sound market will build on past areas of high volume. Should the market trend for long periods of time, it will lack sound structure (identified as a low volume area which denotes directional conviction and ought to offer support on any test).

If participants were to auction and find acceptance into areas of prior low volume, then future discovery ought to be volatile and quick as participants look to areas of high volume for favorable entry or exit.

POCs: POCs are valuable as they denote areas where two-sided trade was most prevalent. Participants will respond to future tests of value as they offer favorable entry and exit.
Graphic: 65-minute profile chart of the Micro E-mini S&P 500 Futures updated 6:30 AM ET.
News And Analysis
Traders rush to dump China tech stocks as gaming targeted again.
Decision Guide: The ECB counts risks in setting bond-buying pace.
Aluminum notches fresh 13-year high on supply woes and demand.
China’s zero-COVID approach will aggravate rising corporate risks.
Fauci: We don’t even have “modestly good control” over COVID-19.
Coinbase threat shows there’s a new cryptocurrency sheriff in town.
White House eyeing increased hacking around the coming holidays.
What People Are Saying
1/2 Yes this is still true but old news. Elevated skew has been a major drivers of the Vanna & Charm flows that have pushed us higher in a straight line now for 1.5 years…The world is increasingly worried & hedged. Whether through hedged equity products like JHEQX, structured
Share with at least 1 dose in Europe 🇵🇹 Portugal 86% 🇪🇸 Spain 79% 🇩🇰 Denmark 76% 🇮🇪 Ireland 75% 🇫🇮 Finland 73% 🇧🇪 Belgium 73% 🇫🇷 France 73% 🇮🇹 Italy 72% 🇳🇴 Norway 72% 🇬🇧 UK 71% 🇳🇱 Netherlands 70% 🇸🇪 Sweden 68% 🇩🇪 Germany 65%
Incredibly but actually unsurprisingly, 10 day realized vol on ES is at 6.15 after numerous days doing nothing at ATHs and struggling to make progress.
A >1% daily move already puts it outside the recent norm.
After years of self-education, strategy development, and trial-and-error, Renato Leonard Capelj began trading full-time and founded Physik Invest to detail his methods, research, and performance in the markets.
Additionally, Capelj is a finance and technology reporter. Some of his biggest works include interviews with leaders such as John Chambers, founder and CEO, JC2 Ventures, Kevin O’Leary, businessman and Shark Tank host, Catherine Wood, CEO and CIO, ARK Invest, among others.
Disclaimer
At this time, Physik Invest does not manage outside capital and is not licensed. In no way should the materials herein be construed as advice. Derivatives carry a substantial risk of loss. All content is for informational purposes only.