
Editor’s Note: The Daily Brief is a free glimpse into the prevailing fundamental and technical drivers of U.S. equity market products. Join the 200+ that read this report daily, below!
What Happened
Overnight, equity index futures auctioned sideways to lower, extending the sell-off that began with the release of Consumer Price Index (CPI) data.
The Federal Reserve will convene, today, at 11:30 AM ET for an unscheduled meeting of the Board of Governors to discuss “the advance and discount rates to be charged by the Federal Reserve banks.”
Scheduled is an interview with St. Louis Fed President James Bullard (8:30 AM ET).
What To Expect
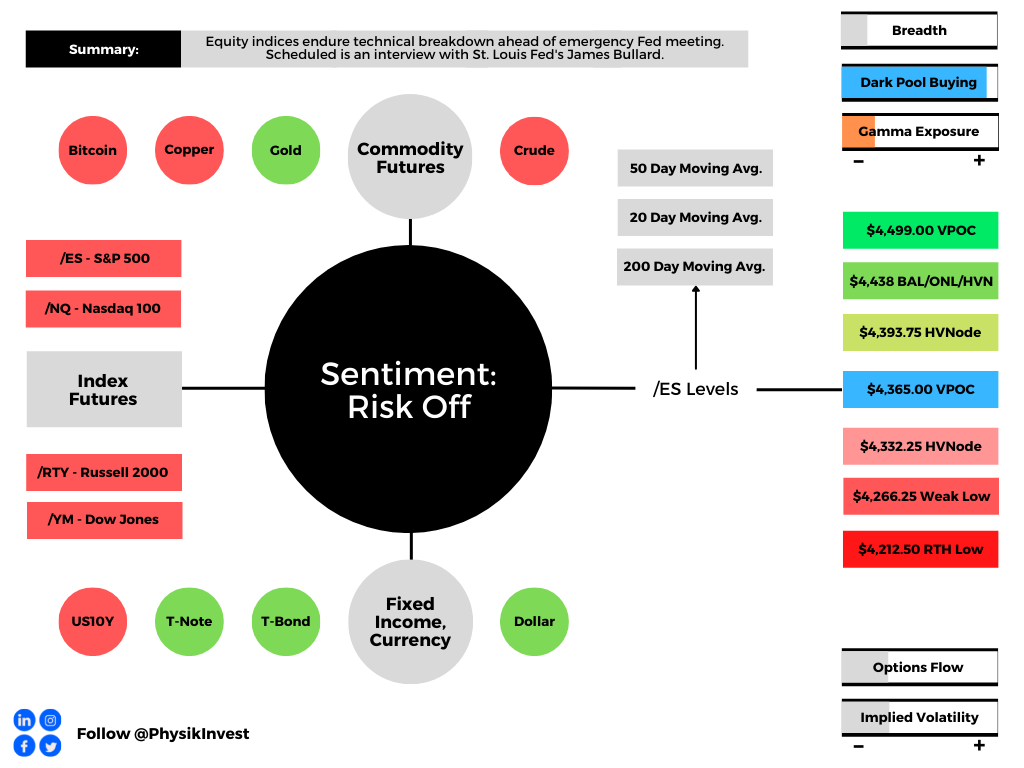
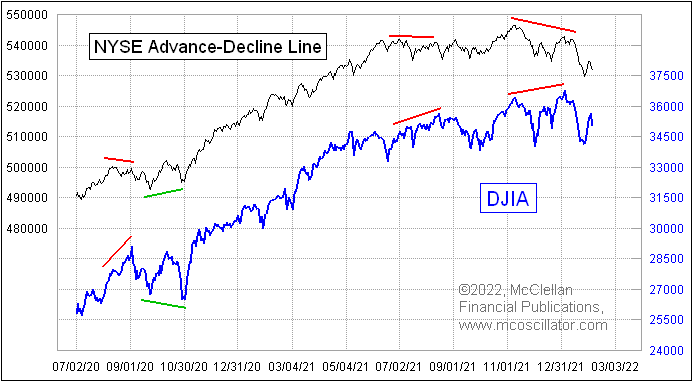
Fundamental: Markets are catching up to divergences in breadth, trading down in the face of narratives around the Federal Reserve’s (Fed) response to heightened inflation, a challenging economic growth outlook, and geopolitical tensions.
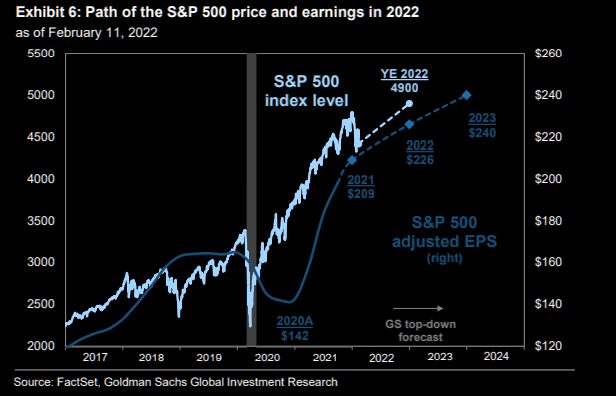
Pursuant to these narratives, Goldman Sachs Group Inc (NYSE: GS) lowered its targets for the S&P 500 from $5,100.00 to $4,900.00.
“The macro backdrop this year is considerably more challenging than in 2021. However, we continue to expect that equity prices will rise alongside earnings and reach a new all-time high in 2022,” strategists said on earnings growth in light of the impact of higher rates on valuations.
“During the last 50 years, a ‘goldilocks’ environment of accelerating GDP growth and stable real yields has typically been associated with a 12-month S&P 500 return of +16%. However, when growth is decelerating and real yields are rising, 12-month S&P 500 returns have averaged +8%.”
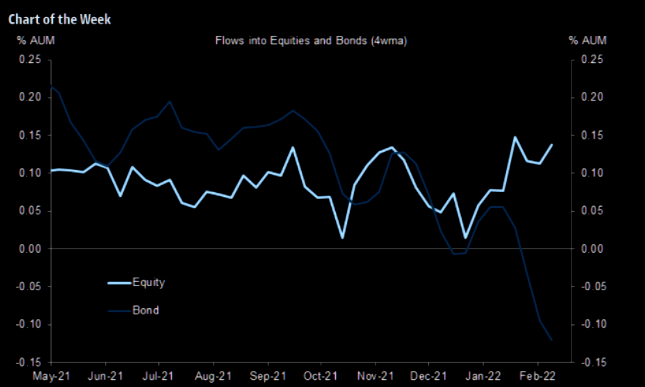
At the same time, participants are withdrawing their cash and assets held in money market funds in size.
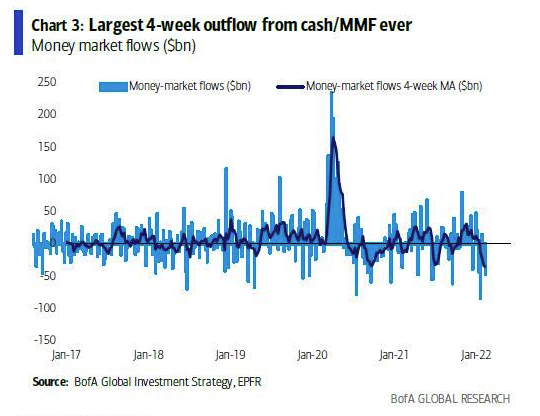
Based on flows into equities, participants appear to be opportunistically buying the dip.
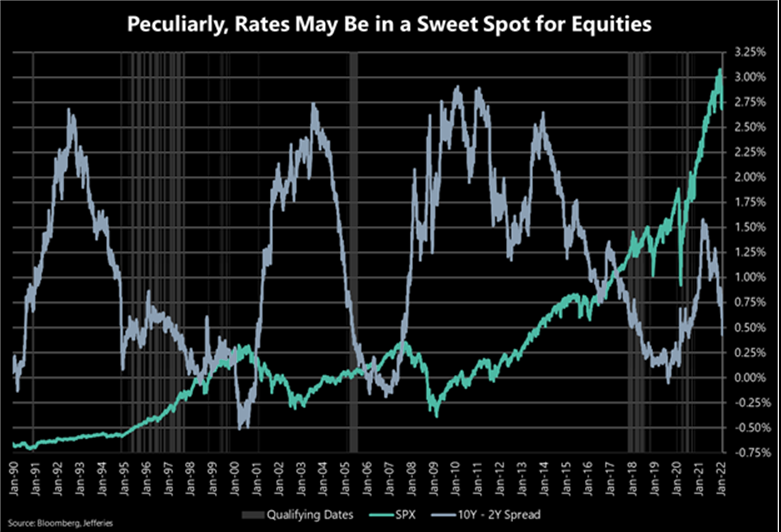
Looking back, when the yield curve – e.g., spread between 10- and 2-year – is between 75 and 25 basis points, stocks actually perform well.
According to The Market Ear, “[S]imilar periods of time have typically coincided with the middle of prior cycles when economic expansion was broad-based. Worth highlighting the mid-90s, mid-00s, and late-10s.”
“Both short and long-term SPX performance following similar instances were well above typical return profiles. Average 6M performance is over 9% and average 12M performance is over 17%. Almost more notably, SPX performance was positive 90%+ of the time.”
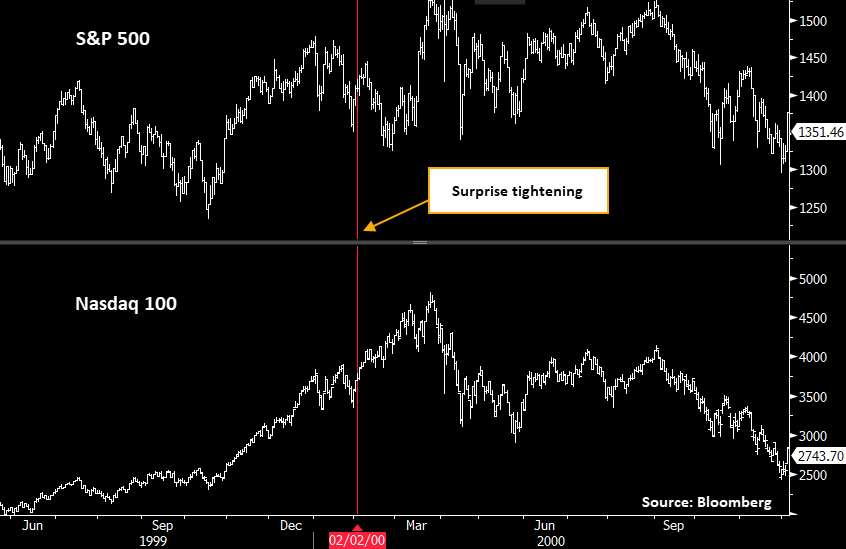
To end this section, we point to the so-called unscheduled Fed meeting, today, and the potential for surprise rate increases, despite some policymakers, like Kansas City Fed President Esther George, attempting to cool expectations.
The historical reaction, months out, is not what participants expect would happen by default.
Positioning: As stated, Friday, Thursday’s post-CPI trade disrupted the balance of trade.
Lower prices and demand for protection, in the face of lower levels of “on-screen liquidity,” solicited dealer selling to hedge increased exposure to the positive delta from demanded short-dated, highly convex options.
Lower prices and higher volatility compound macro flows, exacerbating weakness.
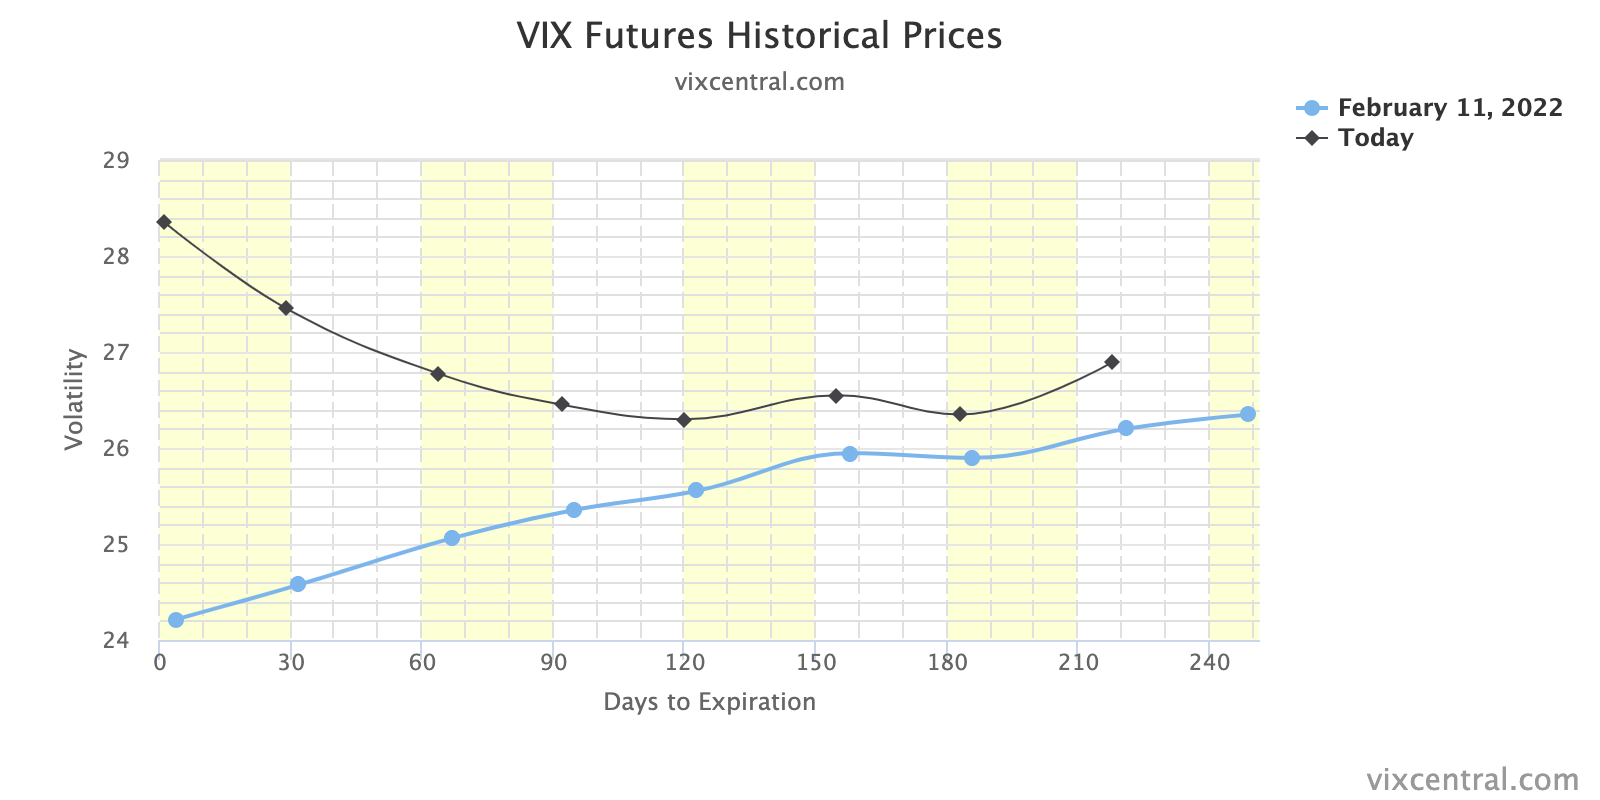
To note, much of the demand for protection is concentrated in shorter-dated options that are more sensitive to changes in implied volatility and direction. The demand is well visualized by the VIX term structure which shifted markedly at the front-end, Friday.
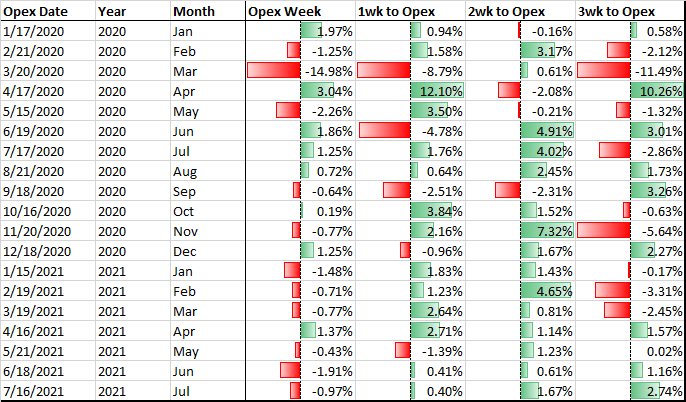
Going forward, there is a large monthly options expiration (OPEX) this week. OPEX is a sort-of reset; options roll-off, as do the counterparties’ hedges.
According to data compiled and analyzed by Pat Hennessy a while back, “OPEX week returns peaked in 2016 and have trended lower since.”
Post-OPEX, though, according to SpotGamma, “In an environment characterized by negative gamma (wherein an options delta falls with stock price rises and rises when stock prices fall), options expiries ought to make gamma less negative.”
“Therefore, a reset that may make gamma exposures less negative, there will be a removal of [counterparties’] linear short (-delta) hedges which may further bolster attempts higher.”
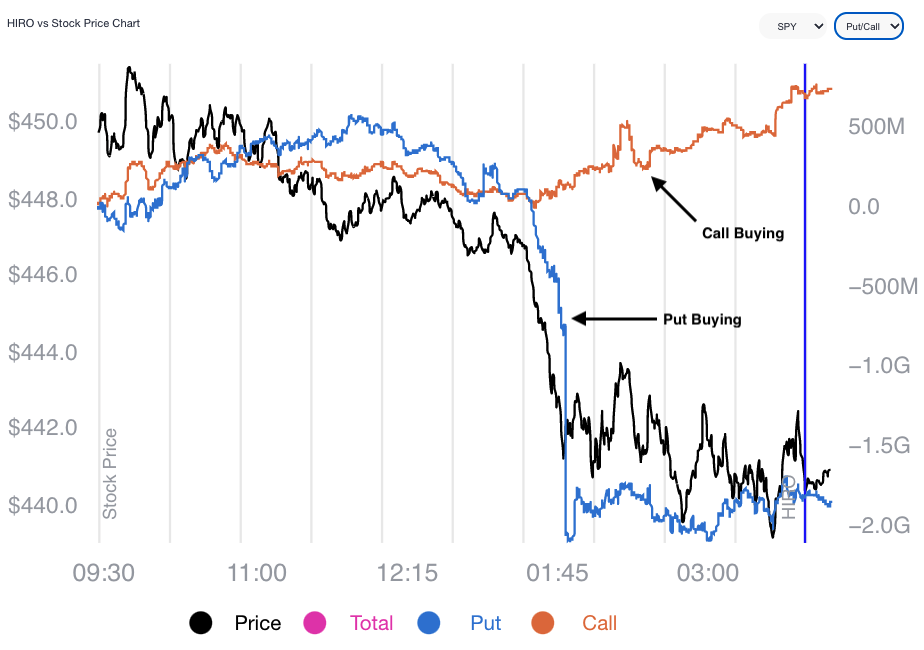
So, the dip lower and demand for protection could serve to prime the market for upside (when volatility starts to compress again and counterparties unwind hedges to put-heavy exposures).
Commitment to higher prices would likely coincide with increased interest in options at higher strike prices. We have yet to see this occur.
Technical: As of 6:30 AM ET, Monday’s regular session (9:30 AM – 4:00 PM ET), in the S&P 500, will likely open in the lower part of a negatively skewed overnight inventory, outside of prior-range and -value, suggesting a potential for immediate directional opportunity.
Balance-Break + Gap Scenarios: A change in the market (i.e., the transition from two-time frame trade, or balance, to one-time frame trade, or trend) occurred.

Acceptance (i.e., more than 1-hour of trade) outside of the balance area has been established.

Leaving value behind on a gap-fill or failing to fill a gap (i.e., remaining outside of the prior session’s range) is a go-with indicator (i.e., nothing has changed since Friday).

Rejection (i.e., return inside of balance) portends a move to the opposite end of the balance.
In the best case, the S&P 500 trades higher; activity above the $4,365.00 point of control (POC) puts in play the $4,393.75 high volume area (HVNode). Initiative trade beyond the HVNode could reach as high as the $4,438.00 key response area and $4,499.00 POC, or higher.
In the worst case, the S&P 500 trades lower; activity below the $4,365.00 POC puts in play the $4,332.25 HVNode. Initiative trade beyond the HVNode could reach as low as the $4,266.25 Weak Low and $4,212.50 regular trade low (RTH Low), or lower.
Click here to load today’s key levels into the web-based TradingView charting platform. Note that all levels are derived using the 65-minute timeframe. New links are produced, daily.

What People Are Saying
Definitions
Overnight Rally Highs (Lows): Typically, there is a low historical probability associated with overnight rally-highs (lows) ending the upside (downside) discovery process.
Volume Areas: A structurally sound market will build on areas of high volume (HVNodes). Should the market trend for long periods of time, it will lack sound structure, identified as low volume areas (LVNodes). LVNodes denote directional conviction and ought to offer support on any test.
If participants were to auction and find acceptance into areas of prior low volume (LVNodes), then future discovery ought to be volatile and quick as participants look to HVNodes for favorable entry or exit.
Gamma: Gamma is the sensitivity of an option to changes in the underlying price. Dealers that take the other side of options trades hedge their exposure to risk by buying and selling the underlying. When dealers are short-gamma, they hedge by buying into strength and selling into weakness. When dealers are long-gamma, they hedge by selling into strength and buying into weakness. The former exacerbates volatility. The latter calms volatility.
Vanna: The rate at which the delta of an option changes with respect to volatility.
Charm: The rate at which the delta of an option changes with respect to time.
POCs: POCs are valuable as they denote areas where two-sided trade was most prevalent in a prior day session. Participants will respond to future tests of value as they offer favorable entry and exit.
Options Expiration (OPEX): Traditionally, option expiries mark an end to pinning (i.e, the theory that market makers and institutions short options move stocks to the point where the greatest dollar value of contracts will expire) and the reduction dealer gamma exposure.
Volume-Weighted Average Prices (VWAPs): A metric highly regarded by chief investment officers, among other participants, for quality of trade. Additionally, liquidity algorithms are benchmarked and programmed to buy and sell around VWAPs.
About
After years of self-education, strategy development, mentorship, and trial-and-error, Renato Leonard Capelj began trading full-time and founded Physik Invest to detail his methods, research, and performance in the markets.
Capelj is also a Benzinga finance and technology reporter interviewing the likes of Shark Tank’s Kevin O’Leary, JC2 Ventures’ John Chambers, FTX’s Sam Bankman-Fried, and ARK Invest’s Catherine Wood, as well as a SpotGamma contributor developing insights around impactful options market dynamics.
Disclaimer
Physik Invest does not carry the right to provide advice.
In no way should the materials herein be construed as advice. Derivatives carry a substantial risk of loss. All content is for informational purposes only.