The daily brief is a free glimpse into the prevailing fundamental and technical drivers of U.S. equity market products. Join the 300+ that read this report daily, below!
Fundamental
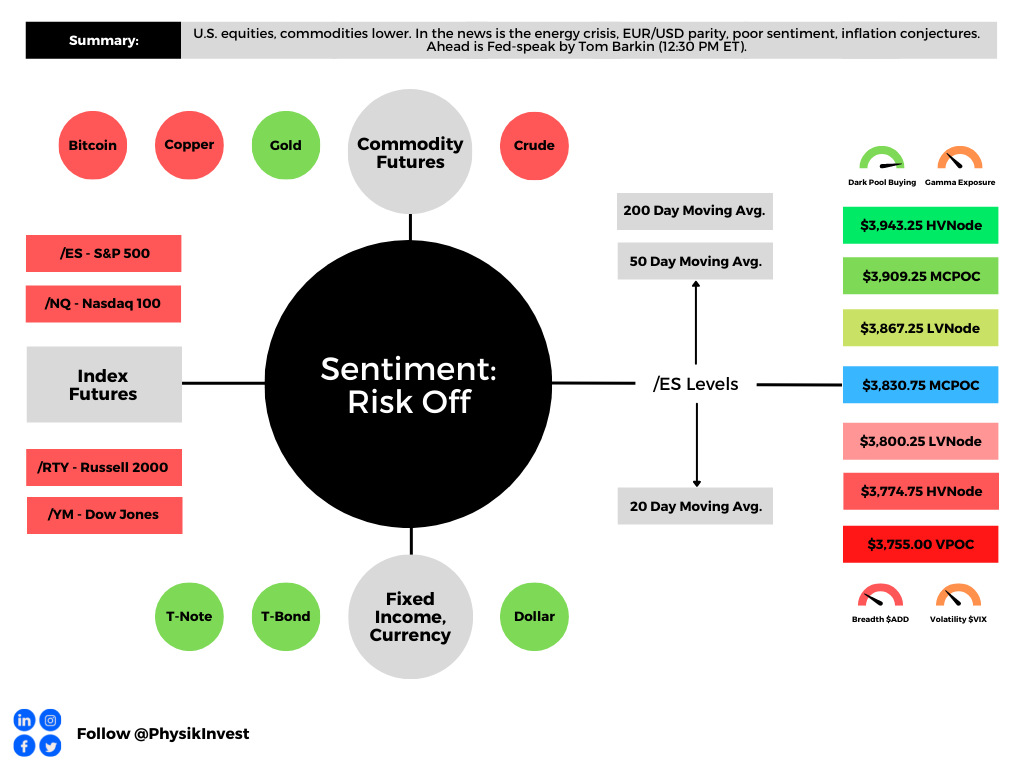
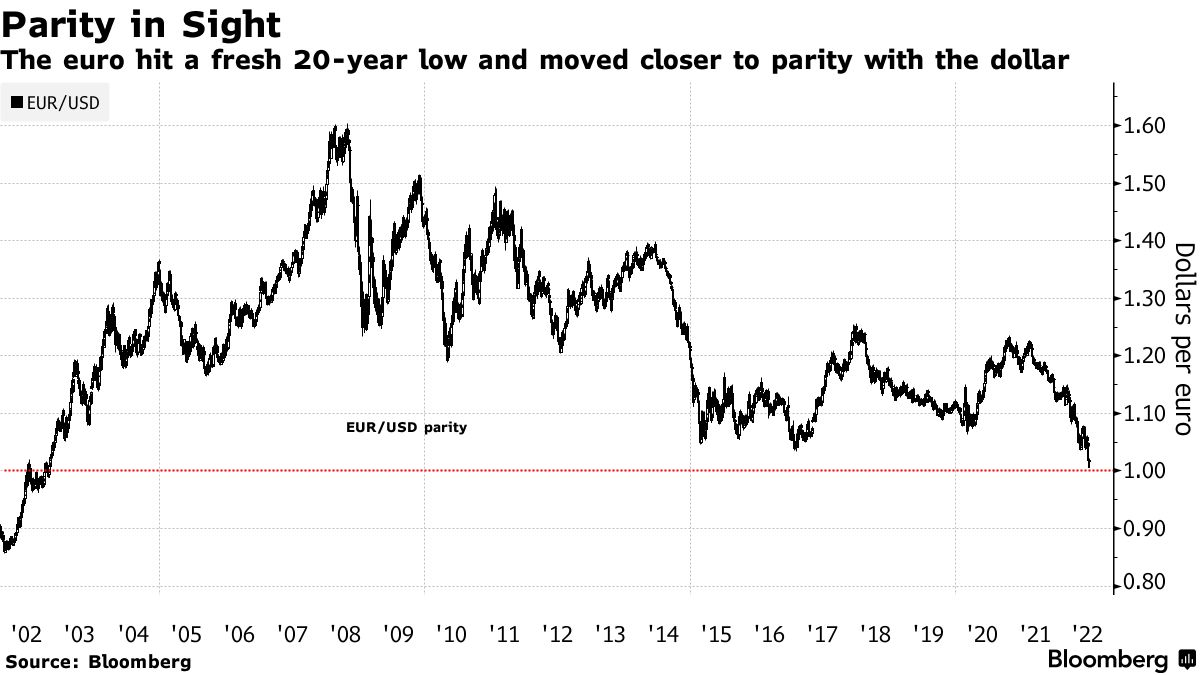
The top headlines are on the inflation conjectures, the depth and breadth of the energy crisis, supply constraints, EUR/USD parity, geopolitical unrest, and global economic slowing.
A boiling point, if not already, is soon to be reached, in short.
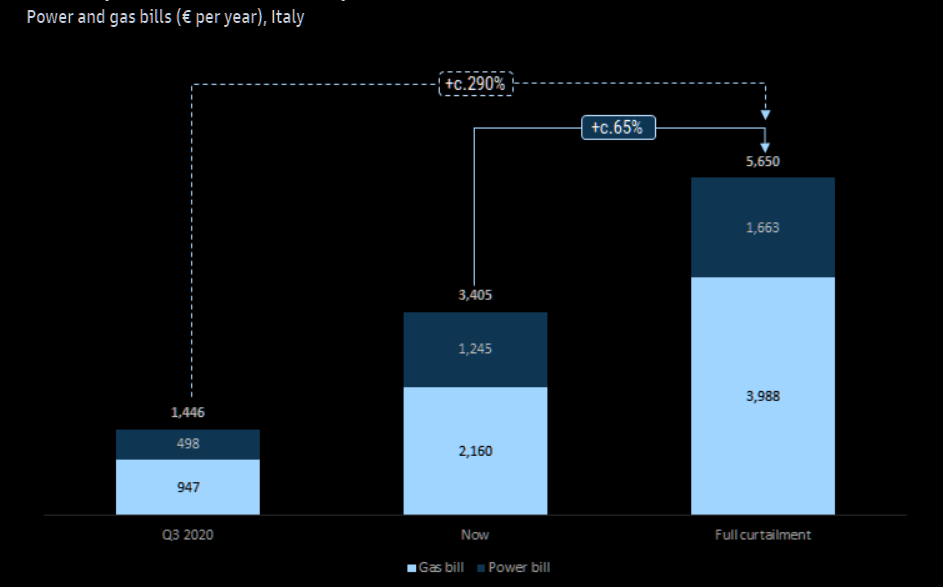
For instance, the energy crisis, which is, in part, the result of earlier capacity erosion, short-term triggers, and panic, is expected to worsen according to the International Energy Agency (IEA).
Per Goldman Sachs Group Inc (NYSE: GS), a “full interruption to Russian flows to Europe would be equivalent to a 35% supply shock to the European gas market.”
What does this mean for the markets we’re focused on day-to-day in this letter?
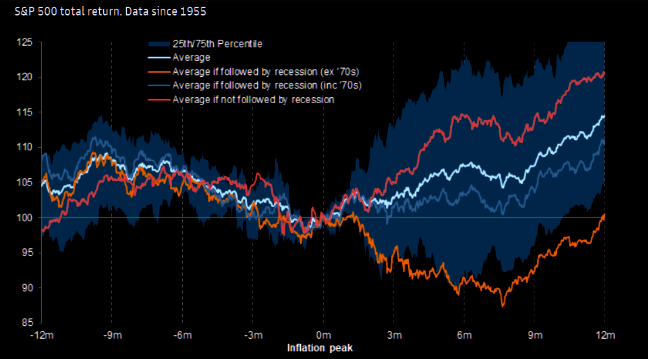
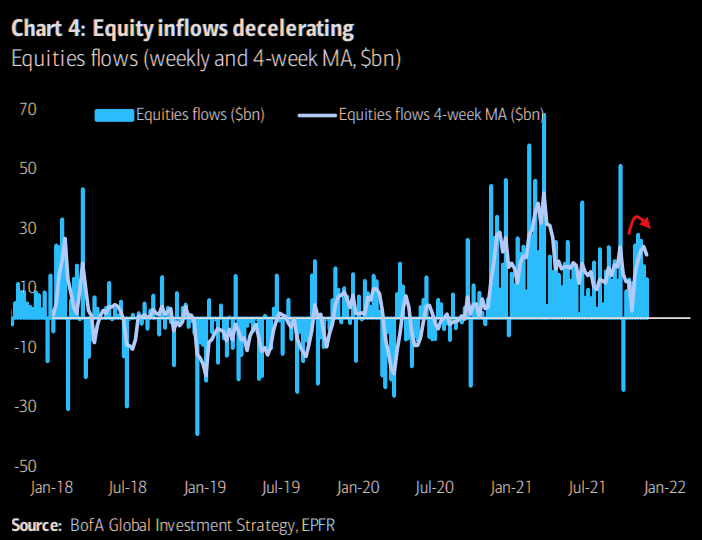
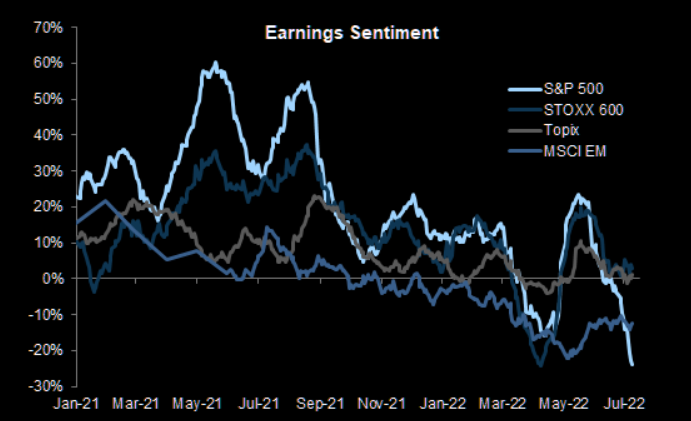
Well – and this is pursuant to the Daily Brief for Monday, July 11 – markets have only suffered through compression in multiples. Does it stop or is there a looming earnings compression?
Most likely there is an earnings compression. For now, it is only sentiment that is taking the hit.
When will the turn occur?
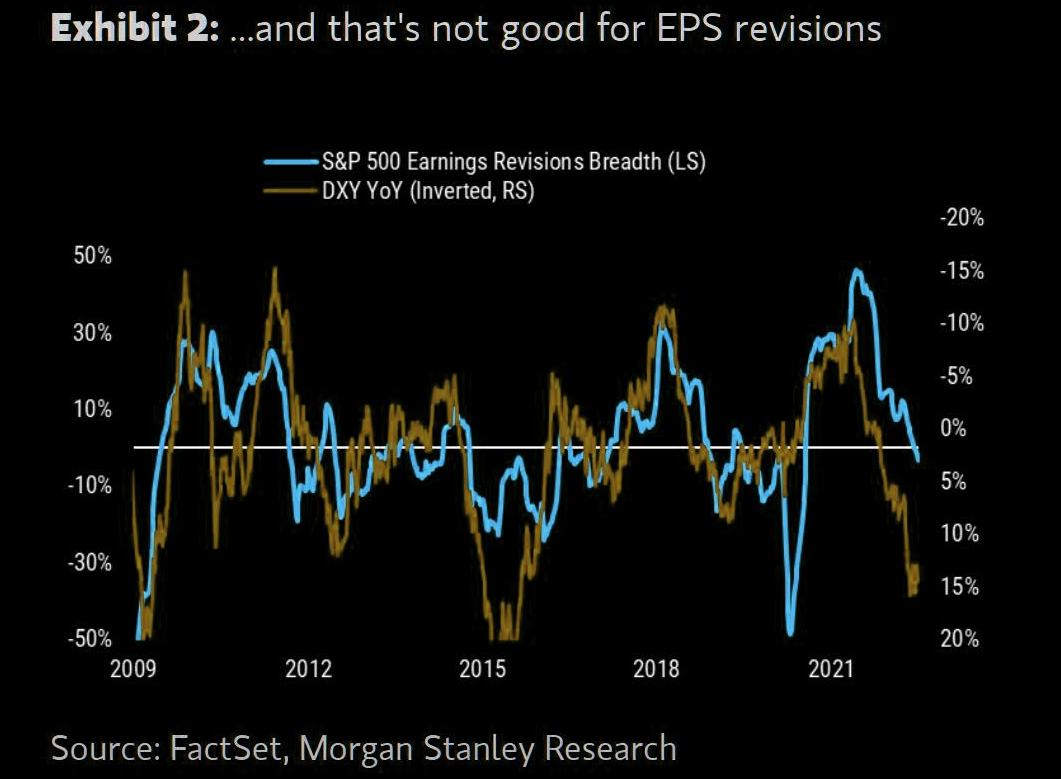
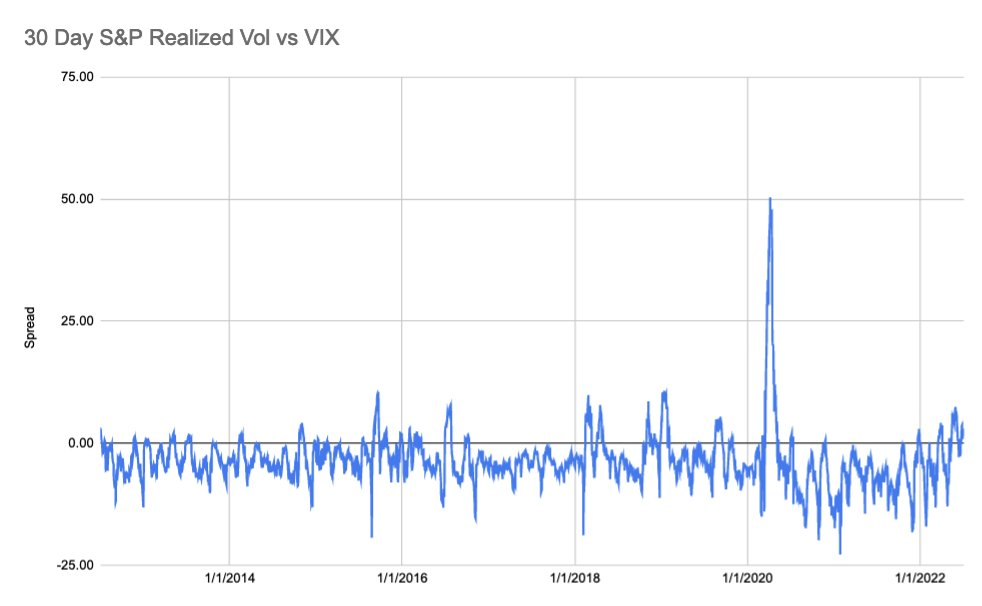
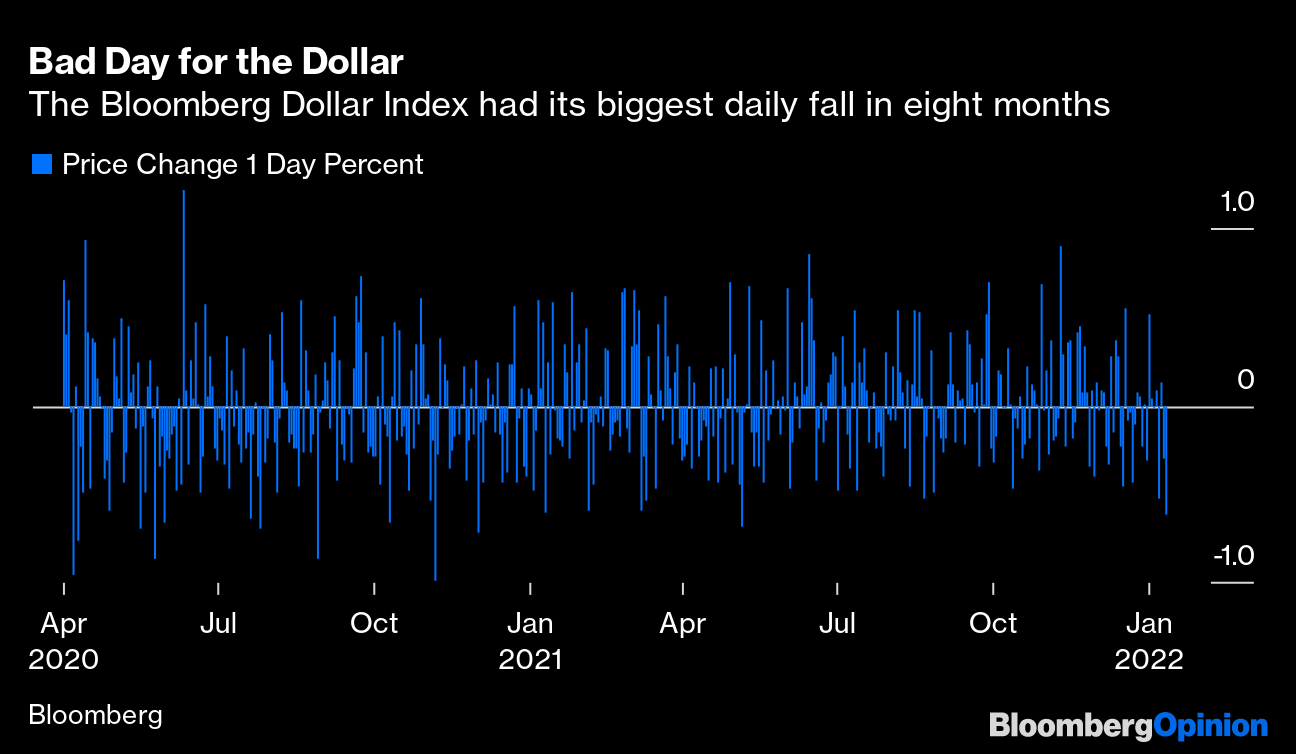
As stated yesterday, it will be the earnings season that is likely to shed clarity on the answer all the while – what is known right now – a strong dollar is for sure to translate into a headwind for S&P 500 earnings growth.
What’s lending to the dollar’s strength?
Let’s start with the following. Participants were extending moneyness to nonmonetary assets, given easy monetary policies and an environment of ample debt and leverage (which cuts into asset price volatility).
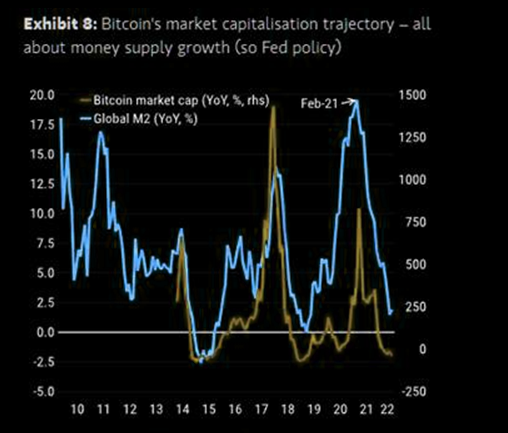
When the reverse happens – tighter liquidity and credit – and volatility eventually rises, the demand (and competition) for money (or cash) deflates assets.
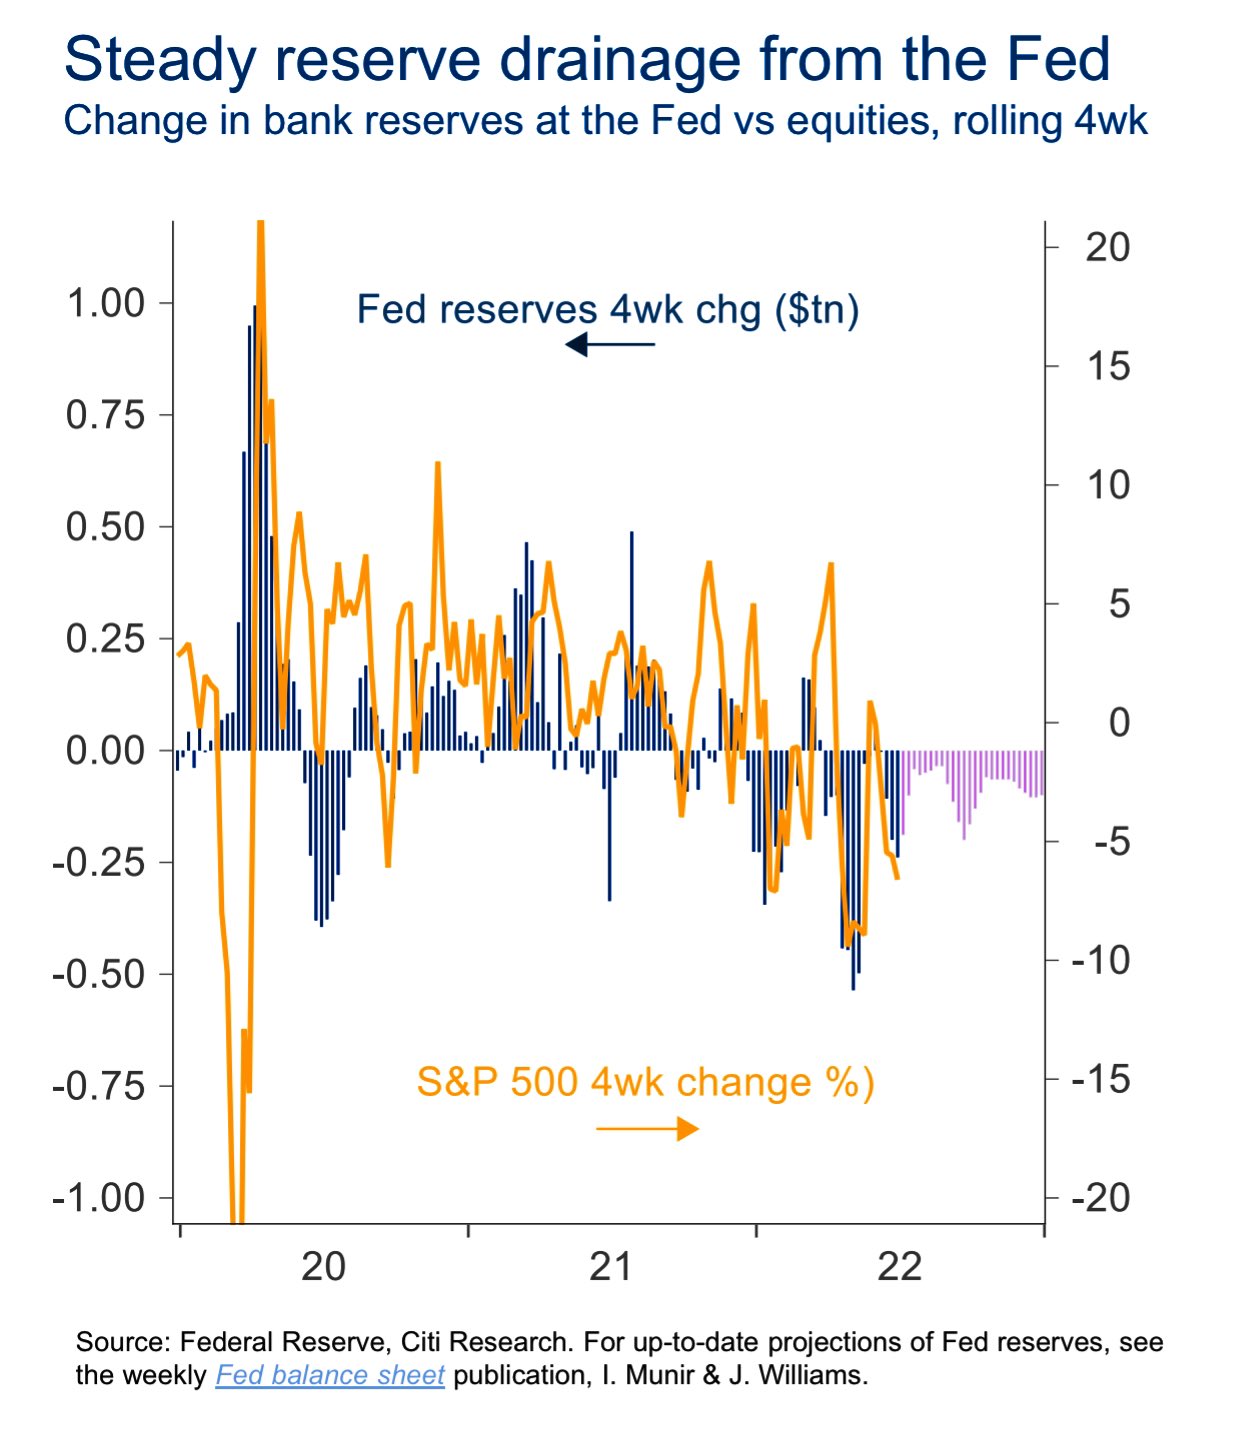
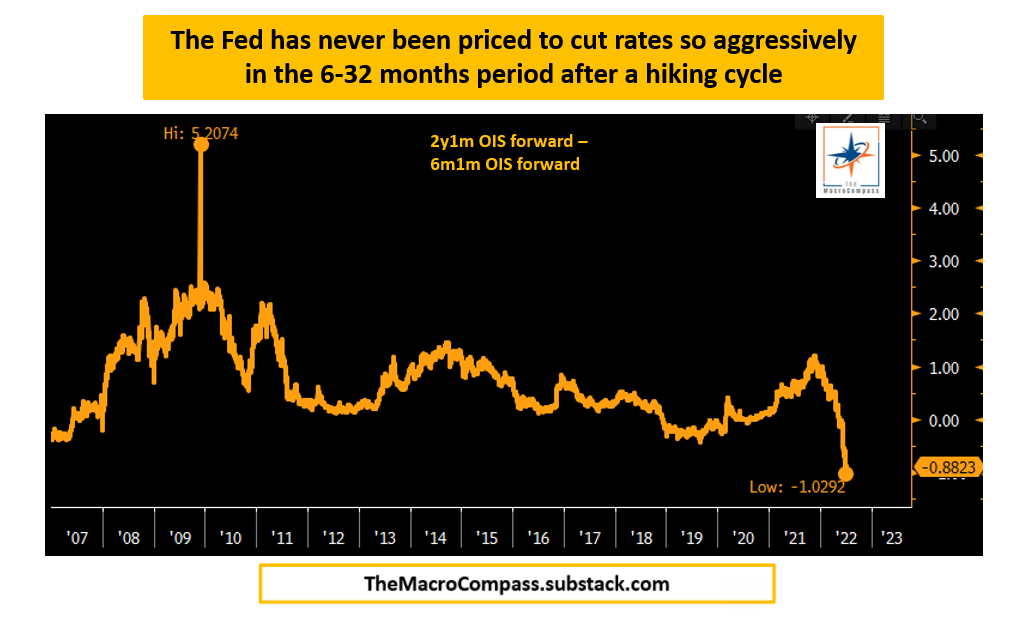
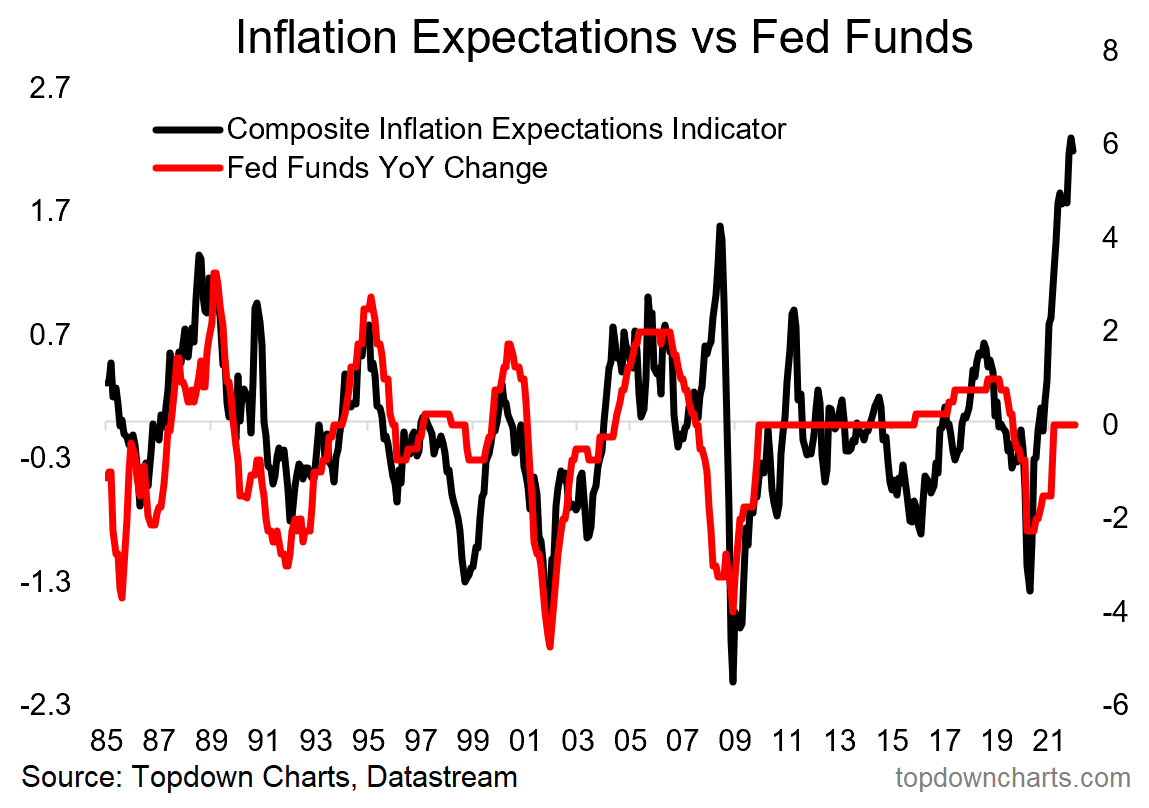
It is a deflationary pulse manifesting disinflation in consumer prices, that will prompt the Fed to reverse itself on rates and quantitative tightening (QT).
What does this mean?
Depends on the timeframe.
Though the policy pivot may come alongside a peak in the de-rate markets are experiencing, now, longer-term there are multi-decade trends brewing on the back of the de-globalization pulse, for instance, and a tendency to spend wealth, instead of creating it (as supply chains are replicated here at home), is inflationary which makes the context for a more two-sided market in the future (rather than straight up or down).
Read: Former Bridgewater Associate talks recession odds, capturing a macro edge.
What about the dollar?
With the Fed “still perceived as having more room to hike rates going forward,” per Unicredito SPA (OTC: UNCRY), all the while “other central banks, such as the ECB and the BoE … [are] more prudent, given … the[ir] gas and energy crisis,” short-term dollar strength does more to diminish the global reliance on the U.S.
This is explained even better by Lyn Alden of Lyn Alden Investment Strategy.
The dollar is the dominant currency for carry primarily due to easy monetary policies removing the risk of an ultra-strong dollar. Accordingly, the dollar is “the currency that most offshore debt is denominated in all over the world,” as explained by Bankless, who interviewed Alden.
“Non-US entities make dollar-based loans and transactions in pretty much all markets everywhere because it’s considered more trustworthy than native fiat,” they add. “When there’s a disruption in global cash flows, there’s effectively a short squeeze on the dollar.”
“The stronger the dollar gets in comparison, the less tenable it becomes as a global reserve,” and that is a pressure on the long-term trajectory of that currency.
Positioning
Yesterday’s letter was spot on with respect to positioning.
We can speculate as to where the market may move next, after the release of inflation figures, this week. What’s likely is that, even if the print is hot, the first move is to be structural, per Kai Volatility’s Cem Karsan.
“A function of inevitable rebalancing of dealer inventory post-event. The second move and final resolution, if you wait for it, is usually tied to the incremental effects on liquidity (QE/QT).”
Rising inflation probably bolsters the Fed’s backing of a 75 basis point rate hike on July 27. So, don’t fight the Fed. Rising rates and the withdrawal of liquidity prompts a continued de-rate.
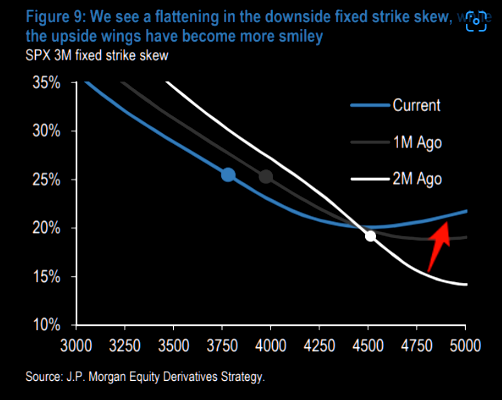
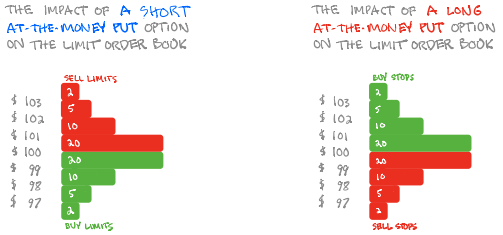
Knowing this, the “flattening in the downside fixed strike skew, while the upside wings [are] more smiley,” as described by JPMorgan Chase & Co (NYSE: JPM), has made for attractive low-cost spread opportunities, as talked about yesterday and in the July 8, 2022 letter.
The moral is as follows: own volatility where the market is likely to not expire. Sell it where the market is likely to expire. Just because implied (IVOL) volatility is at a high starting point does not mean it should be sold, blindly.
Read: Explanations and Applications – Moontower on Gamma.
Technical
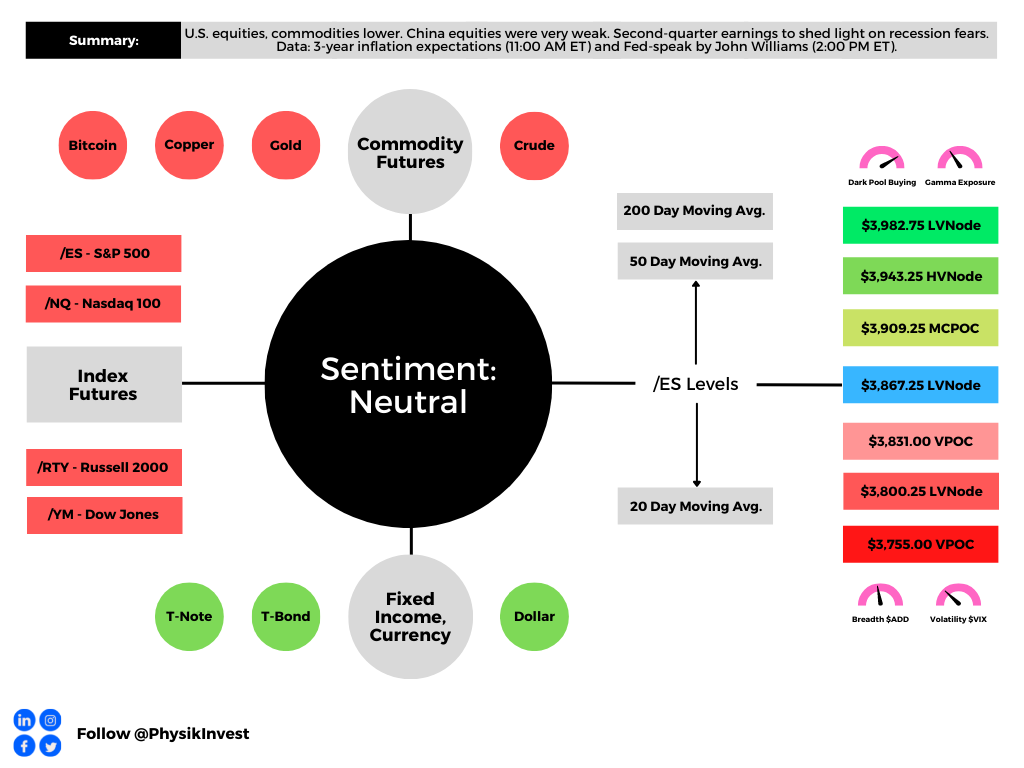
As of 7:00 AM ET, Tuesday’s regular session (9:30 AM – 4:00 PM ET), in the S&P 500, is likely to open in the lower part of a negatively skewed overnight inventory, outside of prior-range and -value, suggesting a potential for immediate directional opportunity.
In the best case, the S&P 500 trades higher.
Any activity above the $3,830.75 MCPOC puts into play the $3,867.25 LVNode. Initiative trade beyond the LVNode could reach as high as the $3,909.25 MCPOC and $3,943.25 HVNode, or higher.
In the worst case, the S&P 500 trades lower.
Any activity below the $3,830.75 MCPOC puts into play the $3,800.25 LVNode. Initiative trade beyond the LVNode could reach as low as the $3,774.75 HVNode and $3,755.00 VPOC, or lower.
Click here to load today’s key levels into the web-based TradingView charting platform. Note that all levels are derived using the 65-minute timeframe. New links are produced, daily.

Considerations: Responsiveness near key-technical areas (that are discernable visually on a chart), suggests technically-driven traders with short time horizons are very active.
Such traders often lack the wherewithal to defend retests and, additionally, the type of trade may be indicative of the other time frame participants waiting for more information to initiate trades.
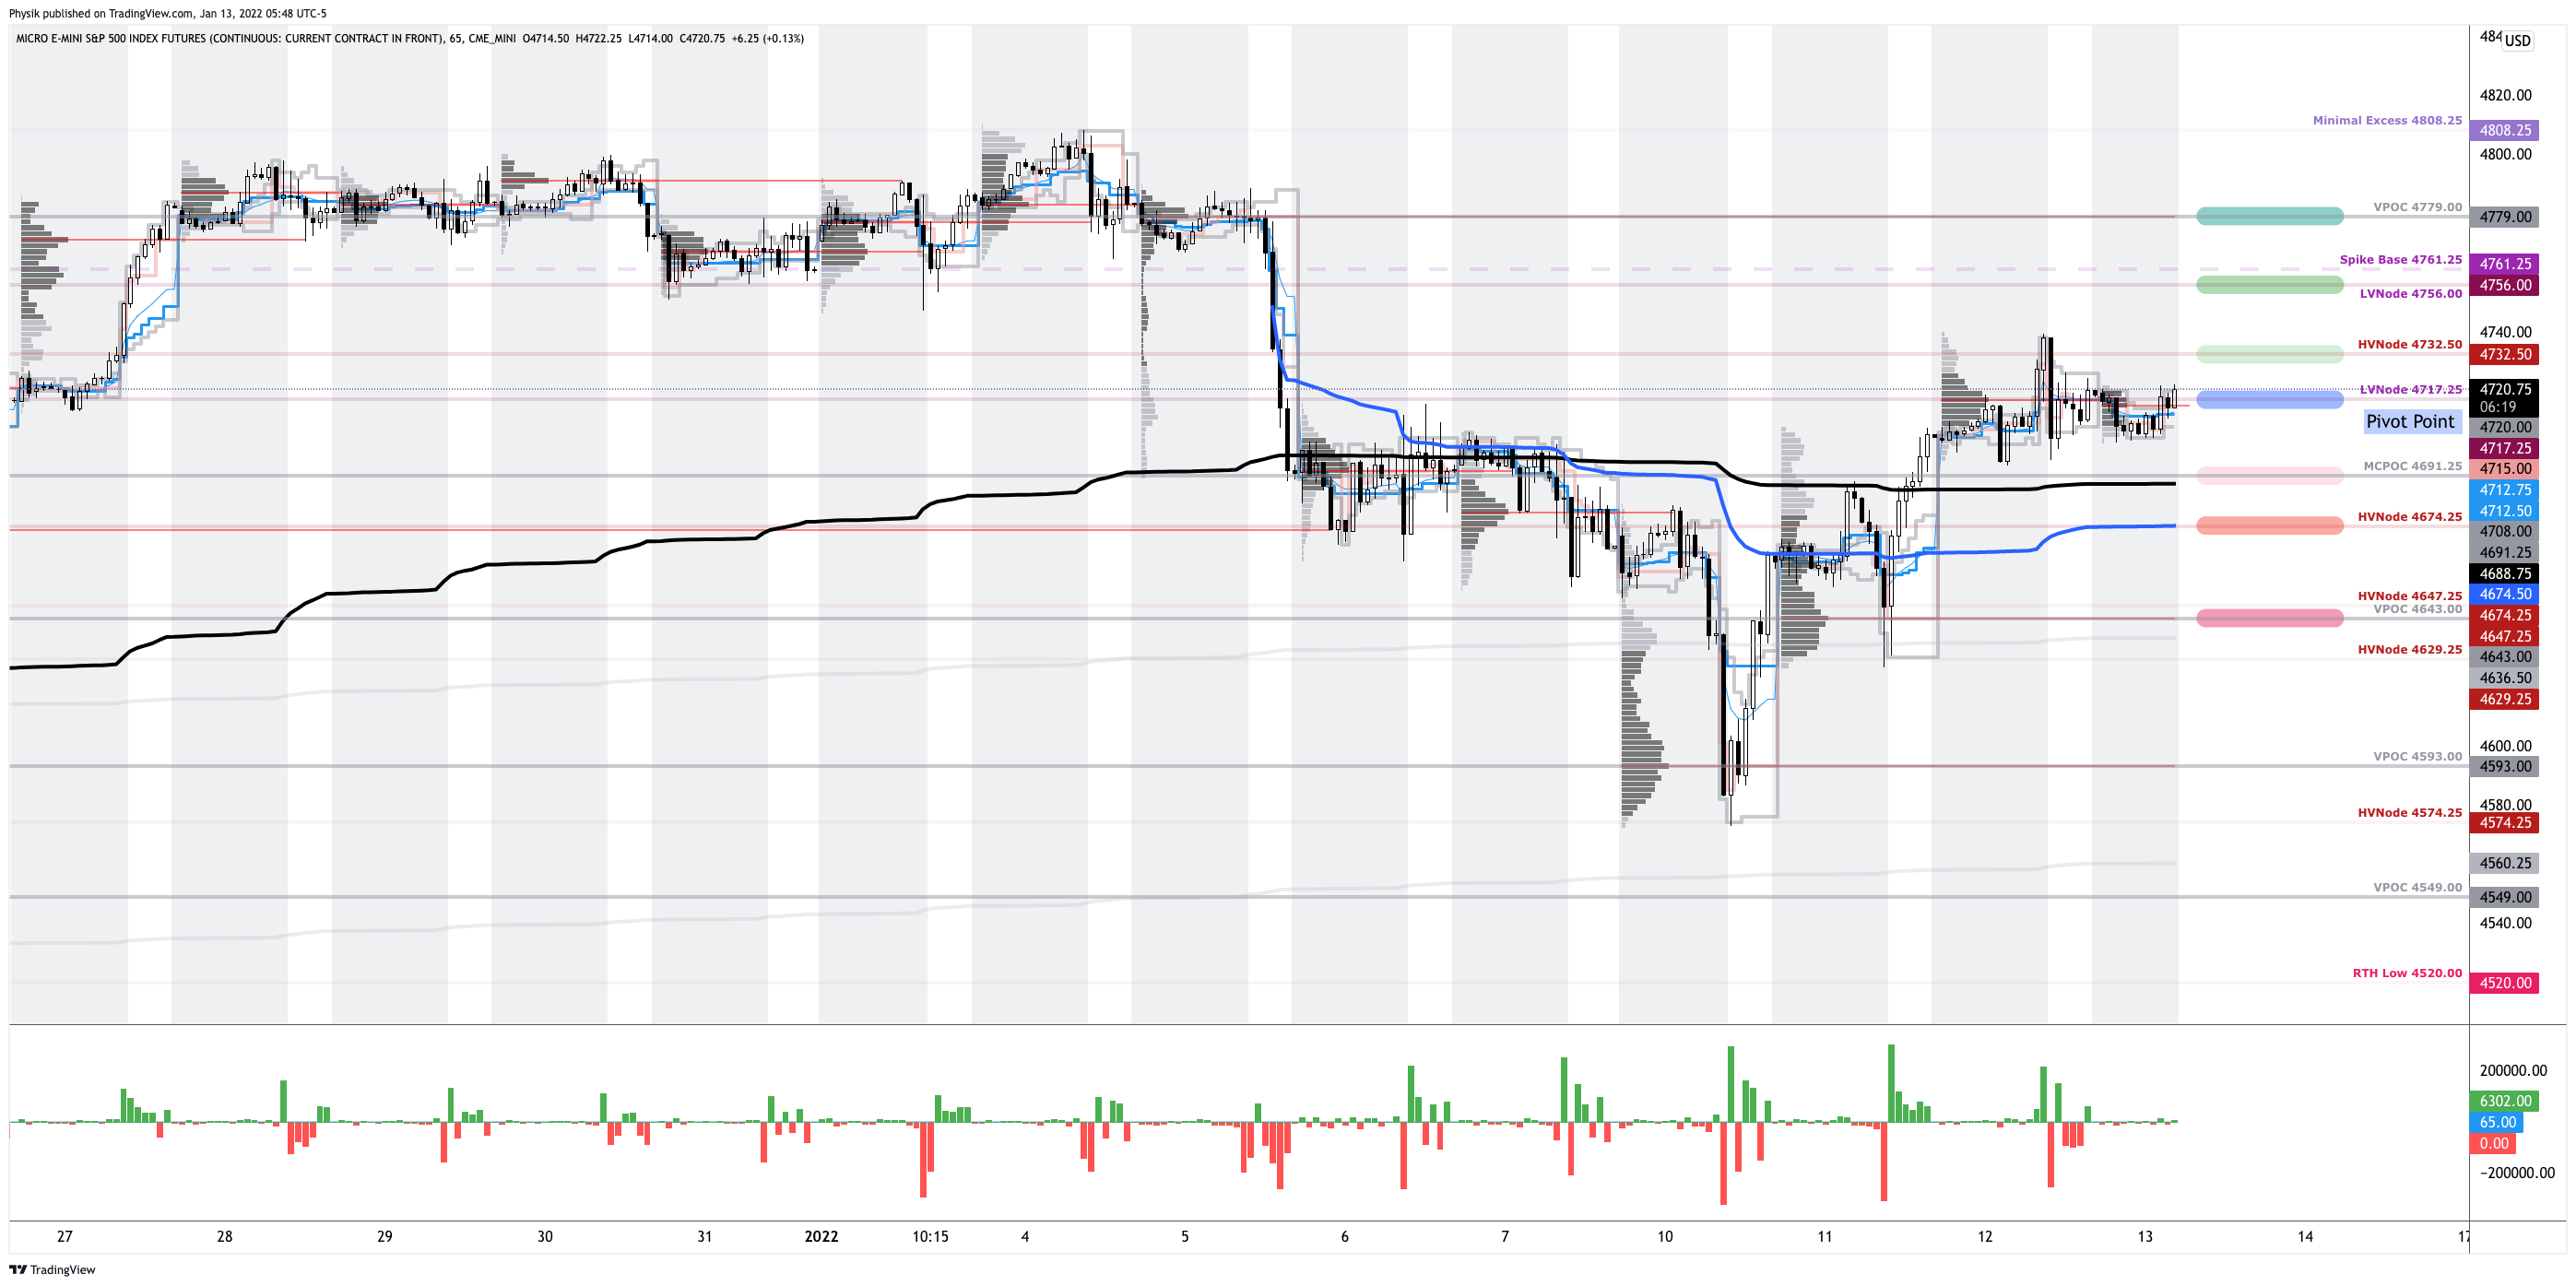
Example: The below 65-minute S&P 500 chart with volume profiles was included in the July 8, 2022 edition of the newsletter. Prices were near an inflection (micro-composite point of control and two key volume-weighted average price levels). From thereon, selling surfaced.

This is what is meant by responsiveness near key-technical areas.

Definitions
Volume Areas: A structurally sound market will build on areas of high volume (HVNodes). Should the market trend for long periods of time, it will lack sound structure, identified as low volume areas (LVNodes). LVNodes denote directional conviction and ought to offer support on any test.
If participants were to auction and find acceptance into areas of prior low volume (LVNodes), then future discovery ought to be volatile and quick as participants look to HVNodes for favorable entry or exit.
POCs: POCs are valuable as they denote areas where two-sided trade was most prevalent in a prior day session. Participants will respond to future tests of value as they offer favorable entry and exit.
MCPOCs: POCs are valuable as they denote areas where two-sided trade was most prevalent over numerous day sessions. Participants will respond to future tests of value as they offer favorable entry and exit.
Volume-Weighted Average Prices (VWAPs): A metric highly regarded by chief investment officers, among other participants, for quality of trade. Additionally, liquidity algorithms are benchmarked and programmed to buy and sell around VWAPs.
About
After years of self-education, strategy development, mentorship, and trial-and-error, Renato Leonard Capelj began trading full-time and founded Physik Invest to detail his methods, research, and performance in the markets.
Capelj also develops insights around impactful options market dynamics at SpotGamma and is a Benzinga reporter.
Some of his works include conversations with ARK Invest’s Catherine Wood, investors Kevin O’Leary and John Chambers, FTX’s Sam Bankman-Fried, former Bridgewater Associate Andy Constan, Kai Volatility’s Cem Karsan, The Ambrus Group’s Kris Sidial, among many others.
Disclaimer
In no way should the materials herein be construed as advice. Derivatives carry a substantial risk of loss. All content is for informational purposes only.