The daily brief is a free glimpse into the prevailing fundamental and technical drivers of U.S. equity market products. Join the 950+ that read this report daily, below!
Fundamental
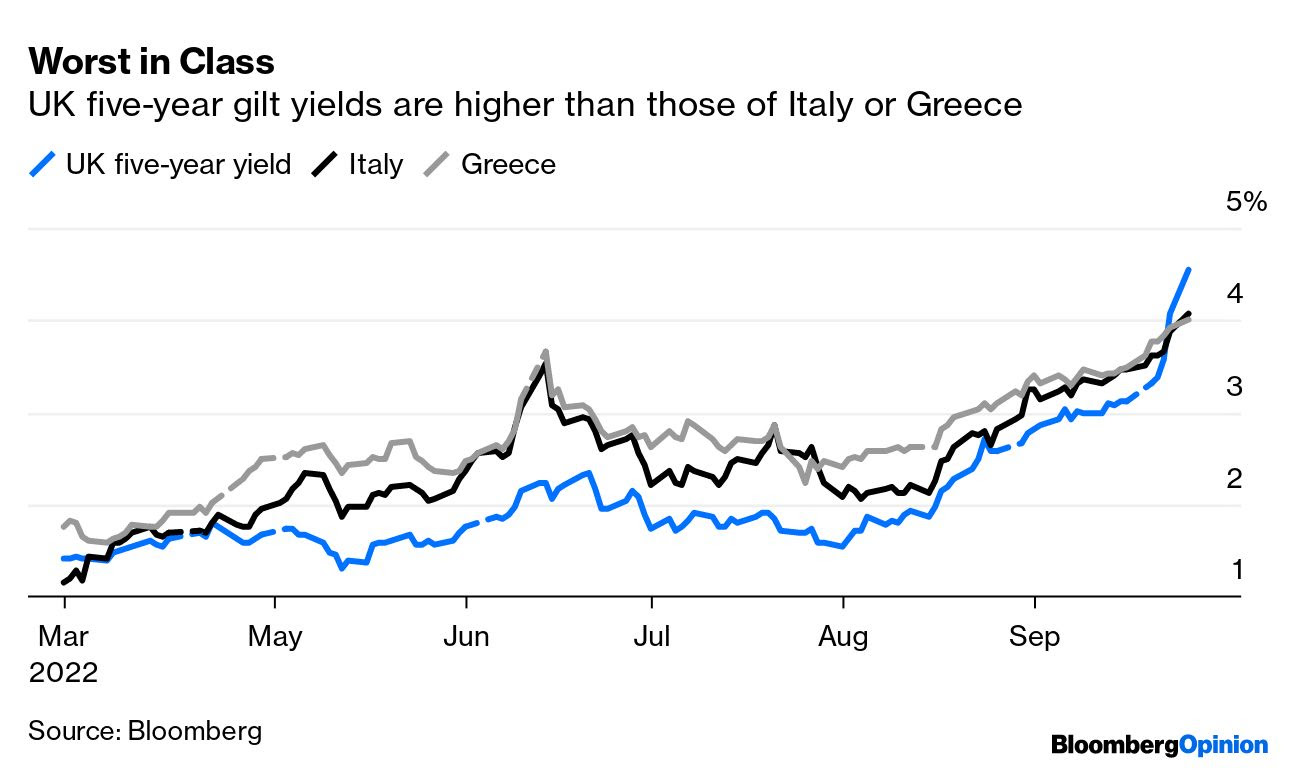
Top of mind, yesterday, was the drop in Britain’s currency (GBP) and a surge in bond yields on the back of new fiscal plans and pledged tax cuts, alongside a more easy pace of interest rate hikes by the Bank of England (BoE). See the Daily Brief for September 26, 2022, for context.

Knowing that the fiscal stimulus and an easy-moving BoE would add to inflation that is already high and sticky, traders began pricing emergency rate hikes, all the while conversation around the impacts of the UK’s rising rates on mortgage lending and the “dollar doom loop” surfaced.
In response, the BoE’s Governor Andrew Bailey said they were “monitoring developments in financial markets,” and at the “next scheduled meeting of the impact on demand and inflation from the Government’s announcement, and the fall in sterling, … [t]he MPC [won’t] hesitate to change interest rates by as much as needed to return inflation to the 2% target.”
Per Citigroup Inc (NYSE: C), however, “[m]onetary policy will struggle to save FX when fiscal policy is the culprit.”
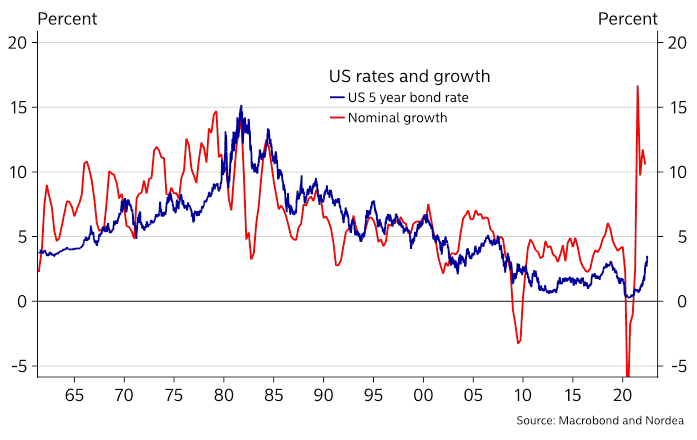
Lawrence Henry Summers, a former US Secretary of the Treasury, also commented that he “would not be amazed if British short rates more than triple in the next two years and reach levels above 7 percent.”
That’s “because US rates are now projected to approach 5 percent and Britain, [which] has much more serious inflation, is pursuing more aggressive fiscal expansion and has larger financing challenges.”
On the topic of rising yields and lenders’ disinterest to issue mortgages, among other things, it is the case that bond buying, via tools such as quantitative easing (QE), left room for confidence to eventually run out and the bond market to revolt.
Read our monetary policy explainers published on September 19 and 20.
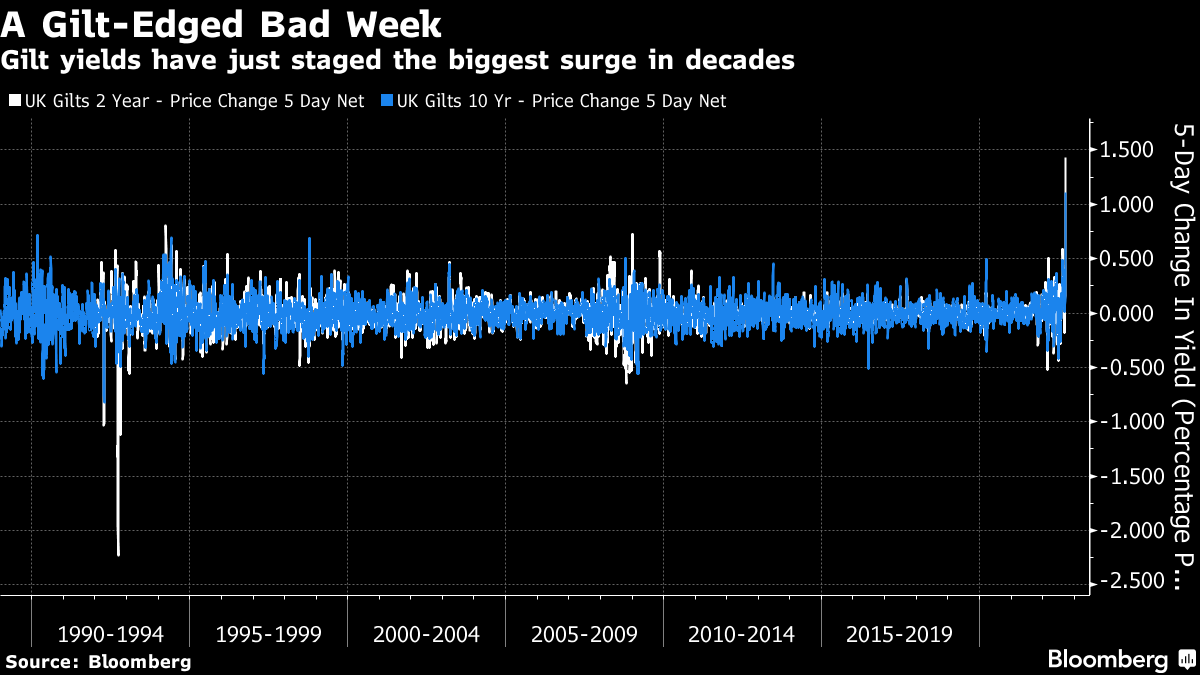
Per statements authored by Bloomberg’s John Authers, the “UK appears to be the first case of a true disorderly bond selloff, where the moves are so swift that they affect the functioning of the financial system. It’s been triggered by a combination of inflation and rash fiscal policy.”
Accordingly, the actions by policymakers abroad serve to reinforce the earlier discussed “dollar doom loop”; the rising USD, though reducing the impact of inflation in the US, ultimately hurts most dollar-denominated debt servicing (see Latin America in the 1980s).
Positioning
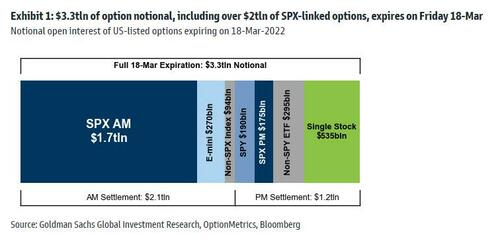
Seasonally speaking, the week after September options expiry (OPEX) is one of the worst on record. The weakness often persists into October.
To quote Kai Volatility’s Cem Karsan:
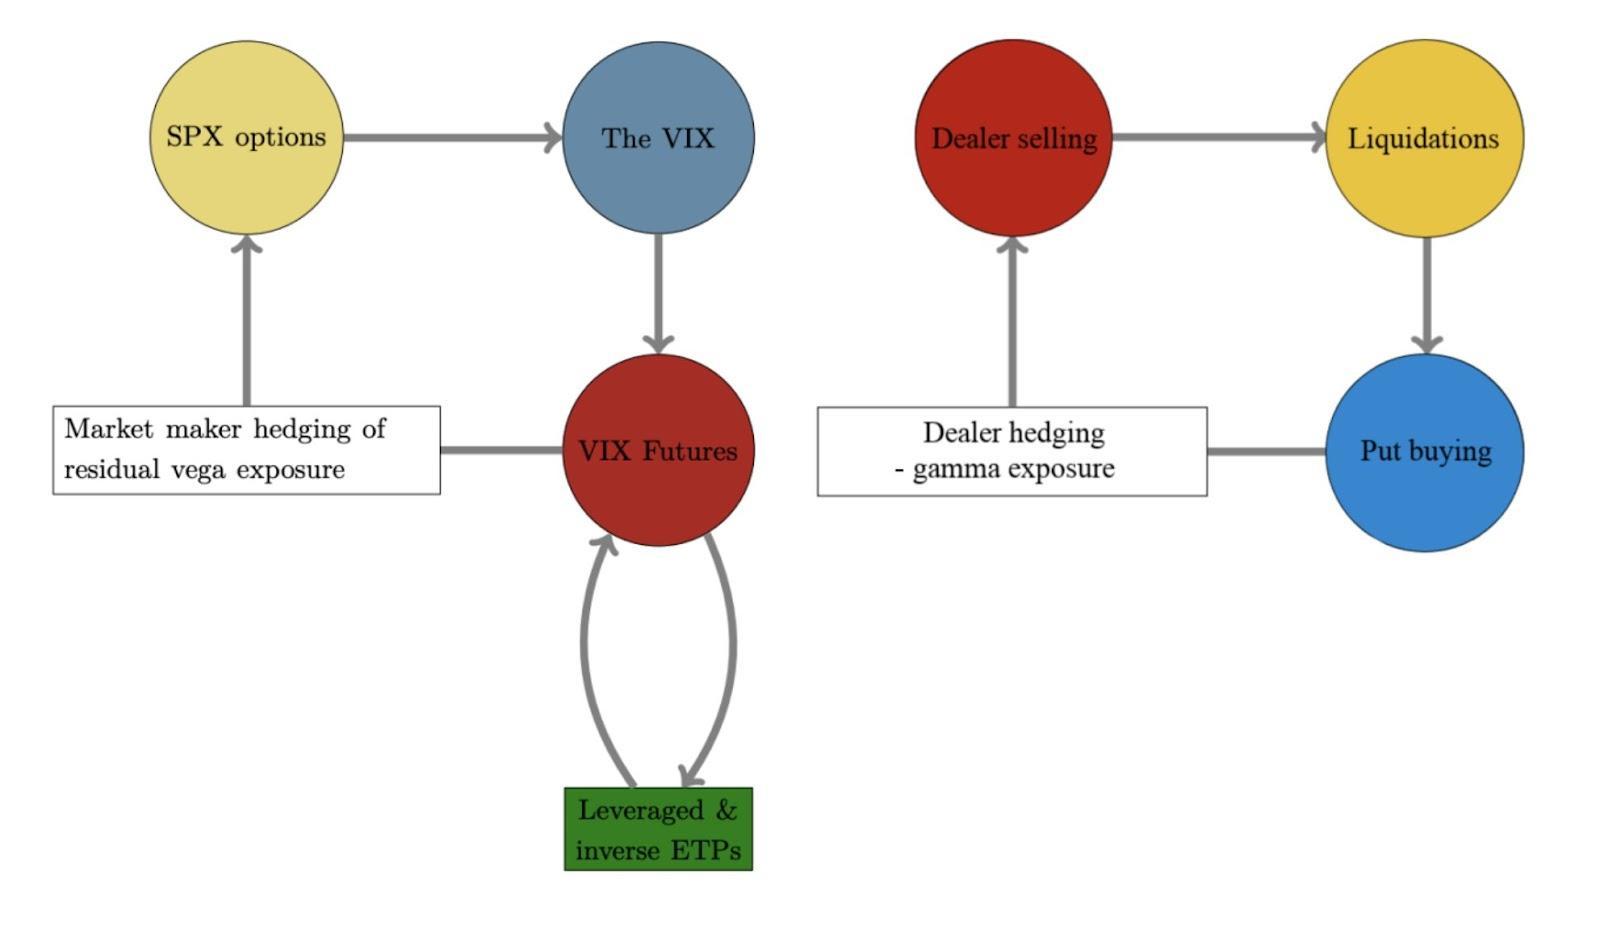
So, “less support from Vanna and Charm, less support through QT, and less buyback,” presents a “fragile moment” with the next week representing the most “dangerous period” on record.
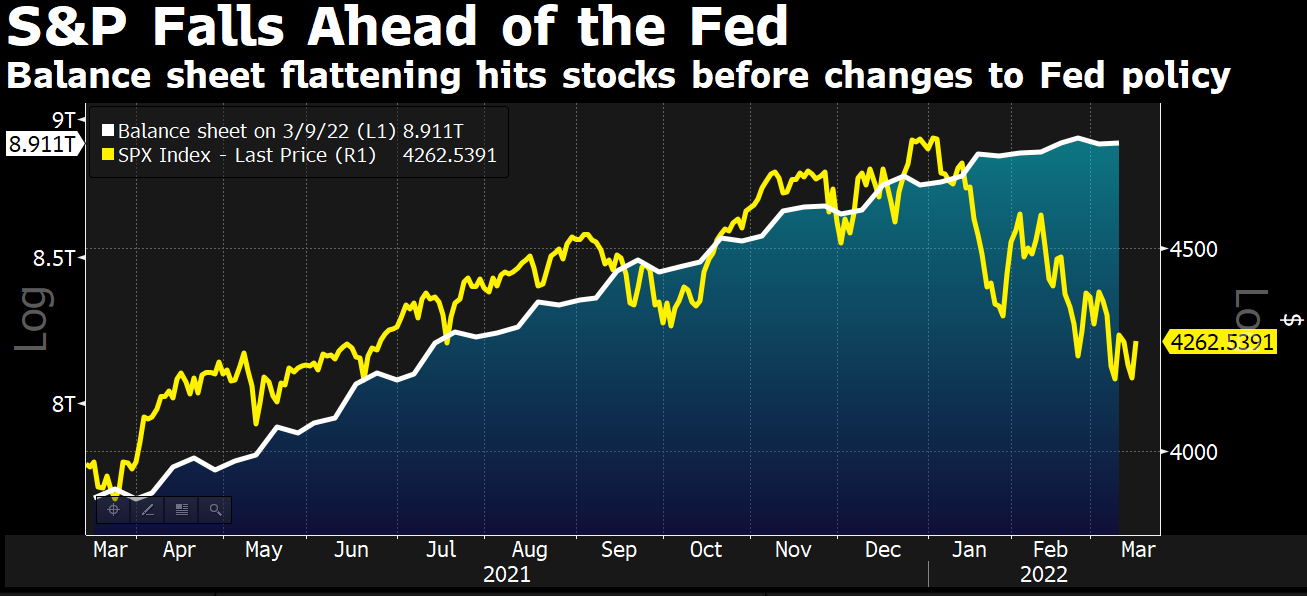
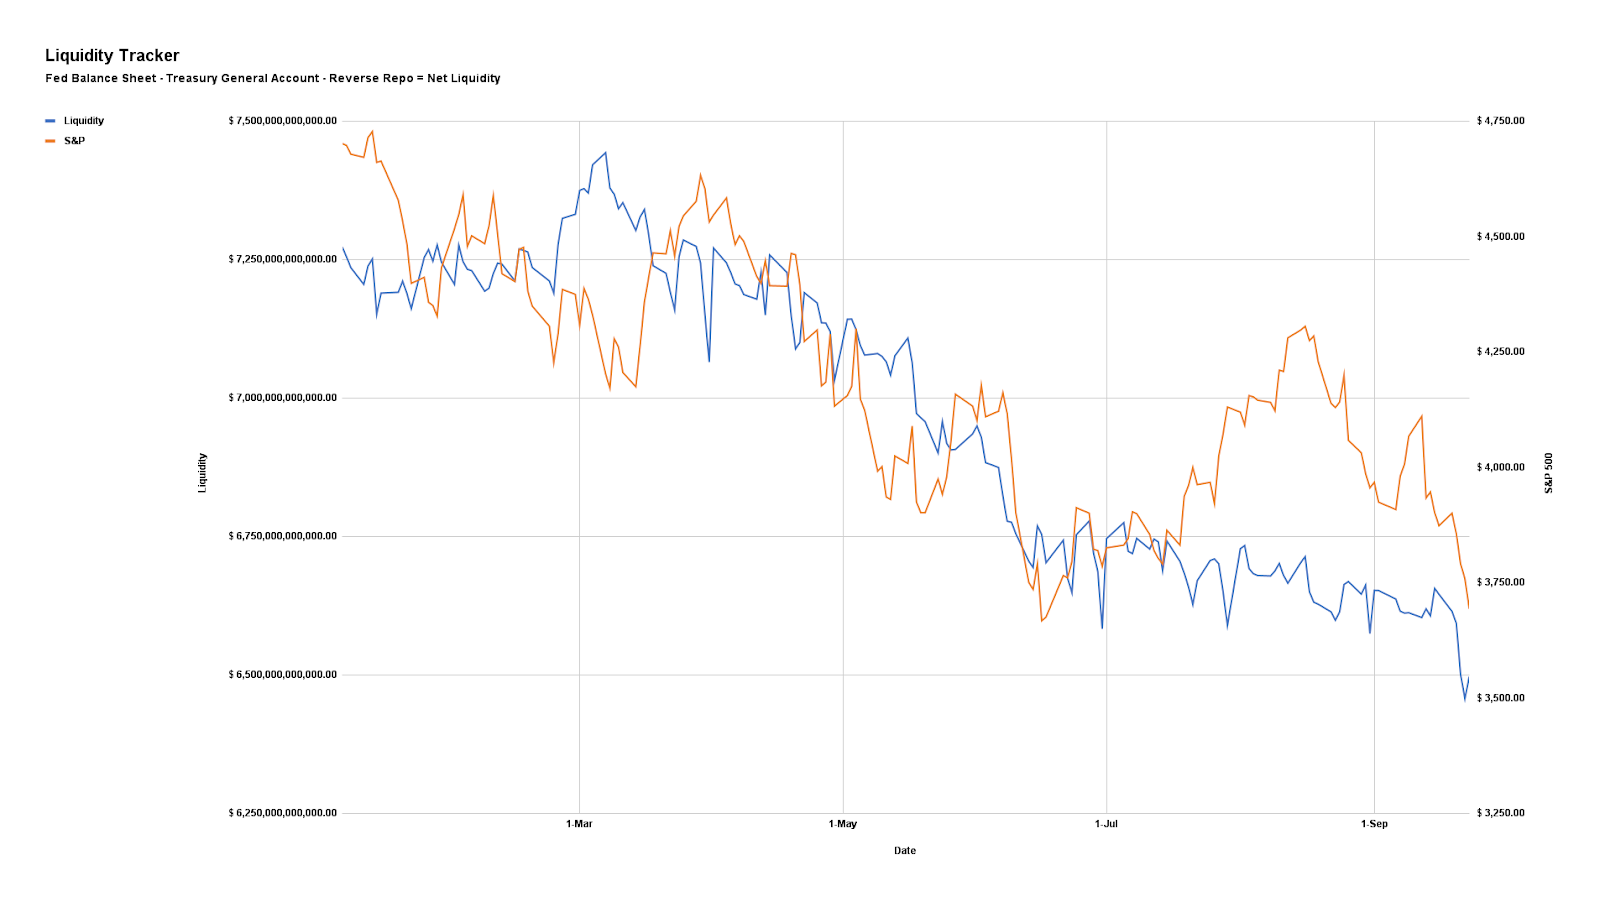
For context, it is the impacts of quantitative tightening (QT) which is manifesting itself as “$4.5 billion less in demand for assets per day,” as well as the blackout period for buybacks (which were consistently “supporting the market”) and options repositioning bolstering the weakness.
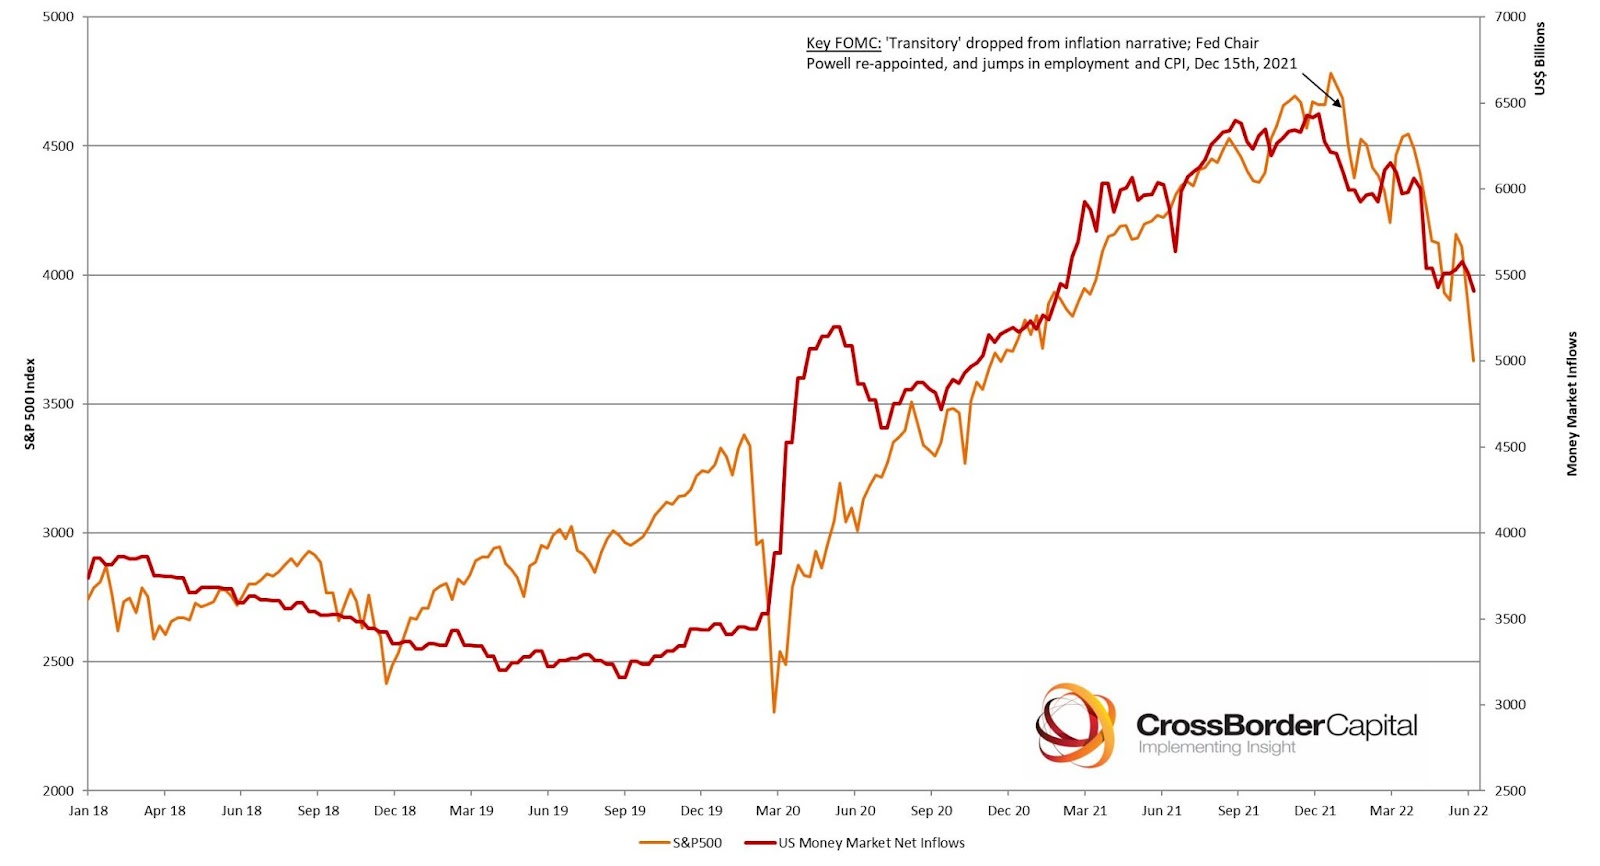
Separately, a hot topic concerns the money that is piling into money funds where “the vast bulk now earns upwards of 2%, with pockets paying 3%, 4% or more.”
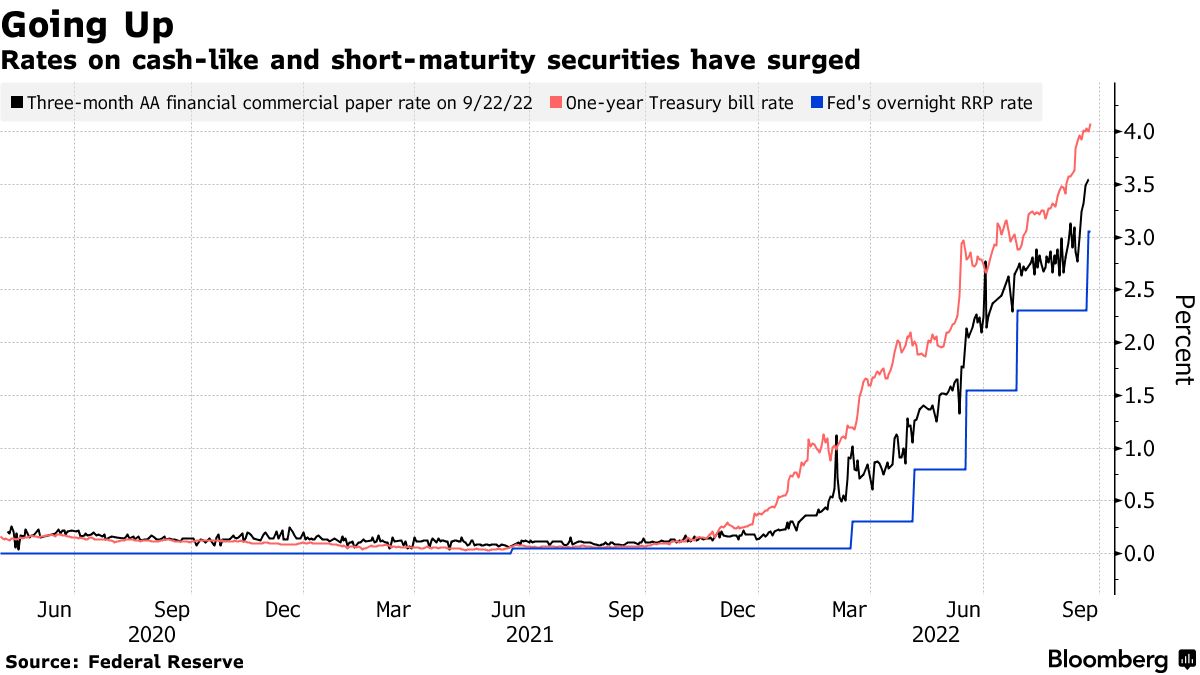
The theory is as follows: if “cash is yielding 4%, why not just sit in cash while the macro environment clarifies a little bit?”
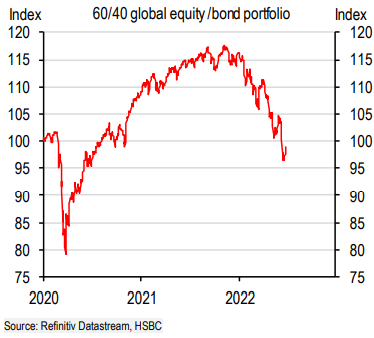
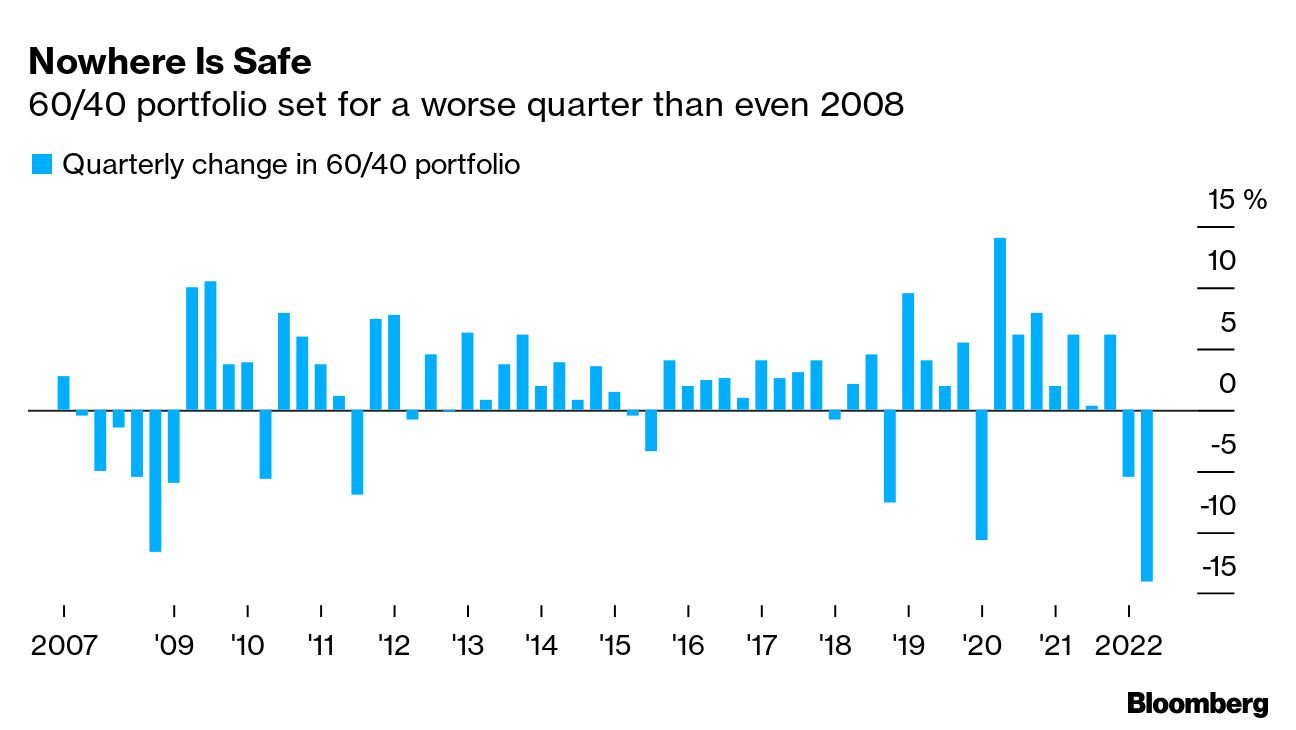
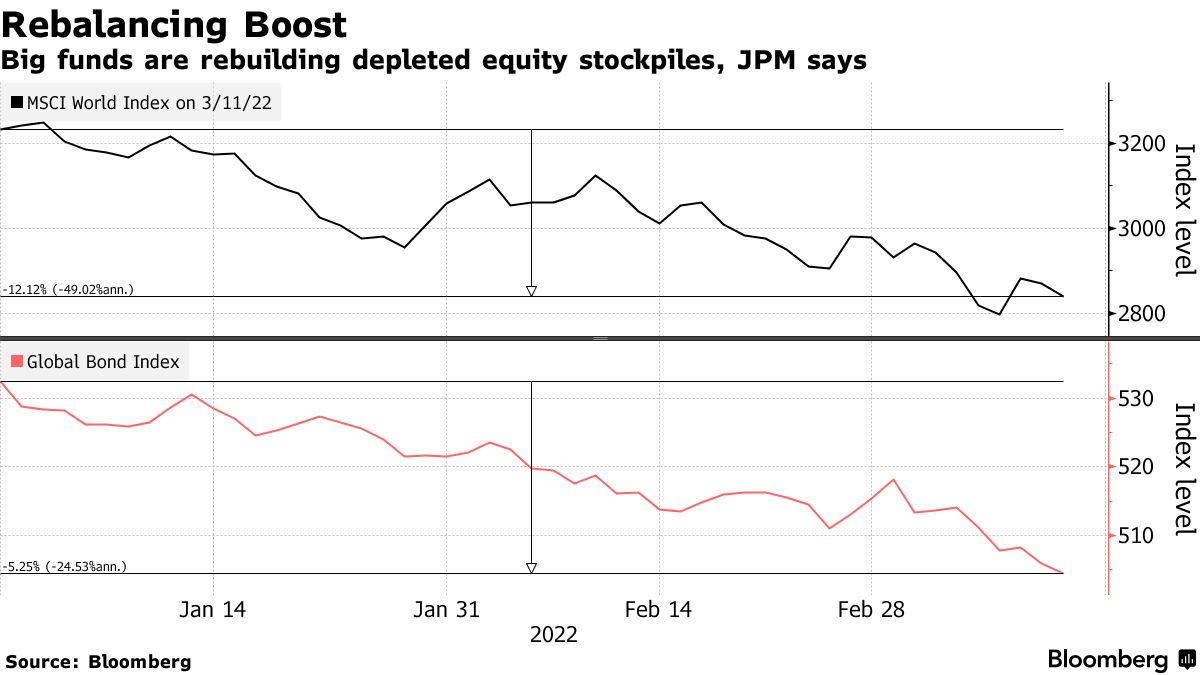
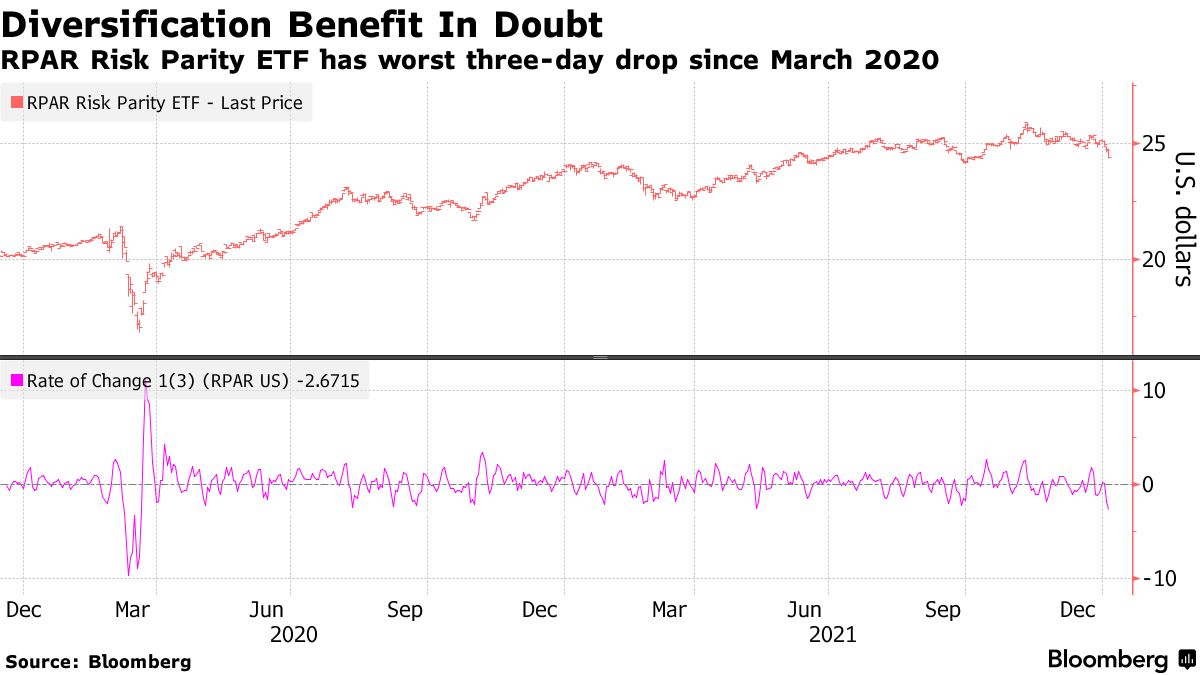
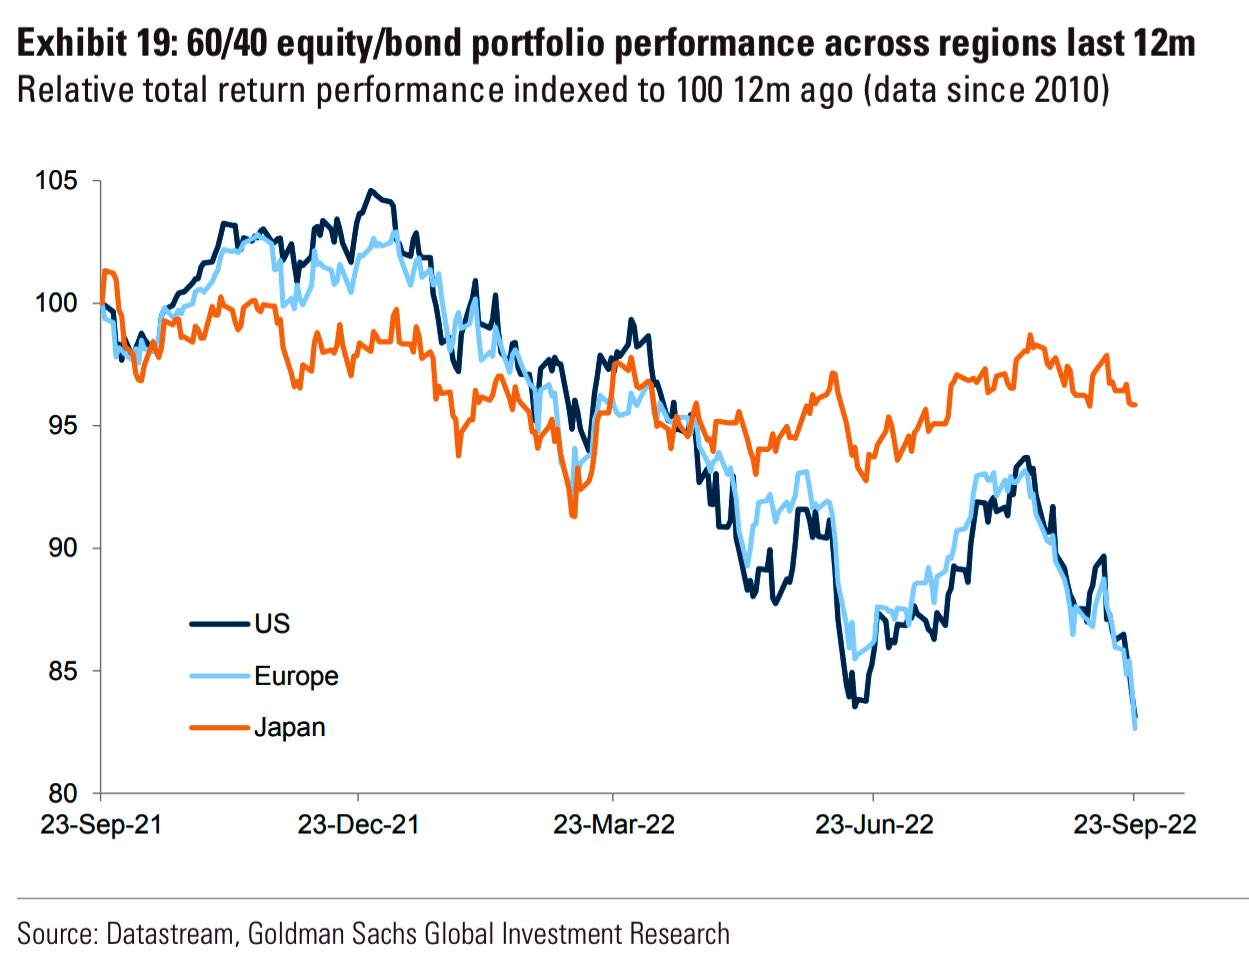
With traditional 60/40 upended, and the gap “between what banks are paying on deposits and what money-market funds are offering” widening, “money funds are likely to attract more inflows going forward as a result, pushing [the] usage of the RRP facility even higher.”
This is all, however, money that is waiting to be deployed, “should market sentiment improve, or asset prices tumble to levels too attractive to pass up.”
Should you, too, desire to pursue guaranteed rates of return, last week Box Spreads were put forth as a solution. These trades “allow market participants to create a loan structure similar to a Treasury bill.” Upon maturity, the Box Spread earns a competitive interest rate.
Price some trades at boxtrades.com.
Technical
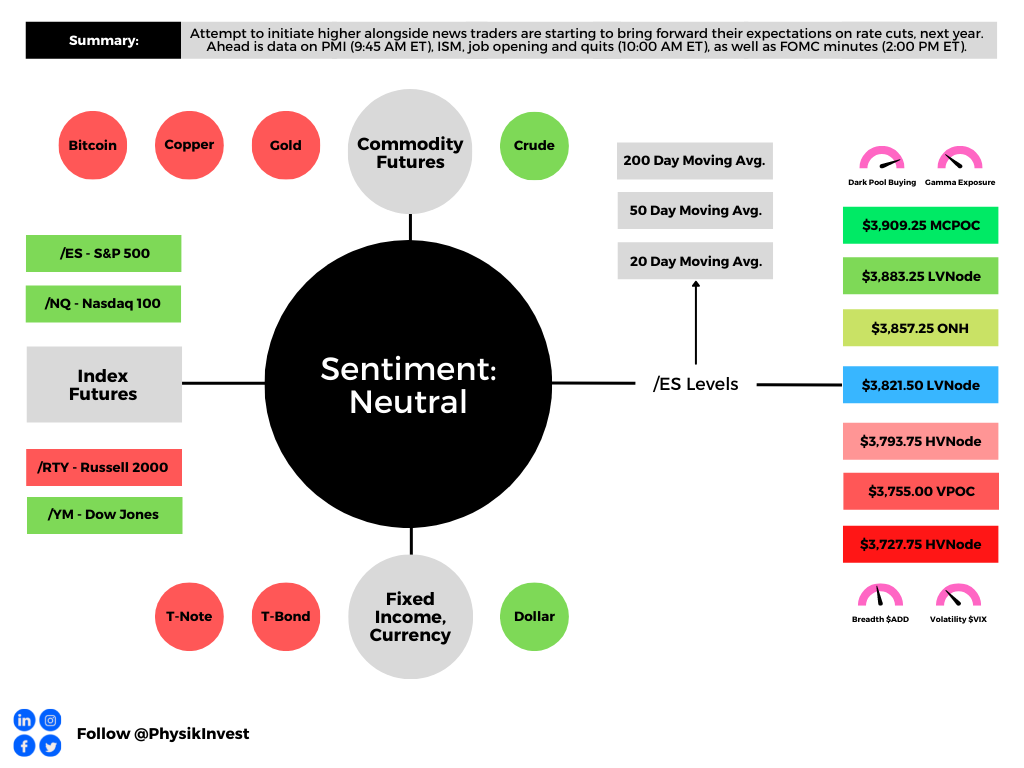
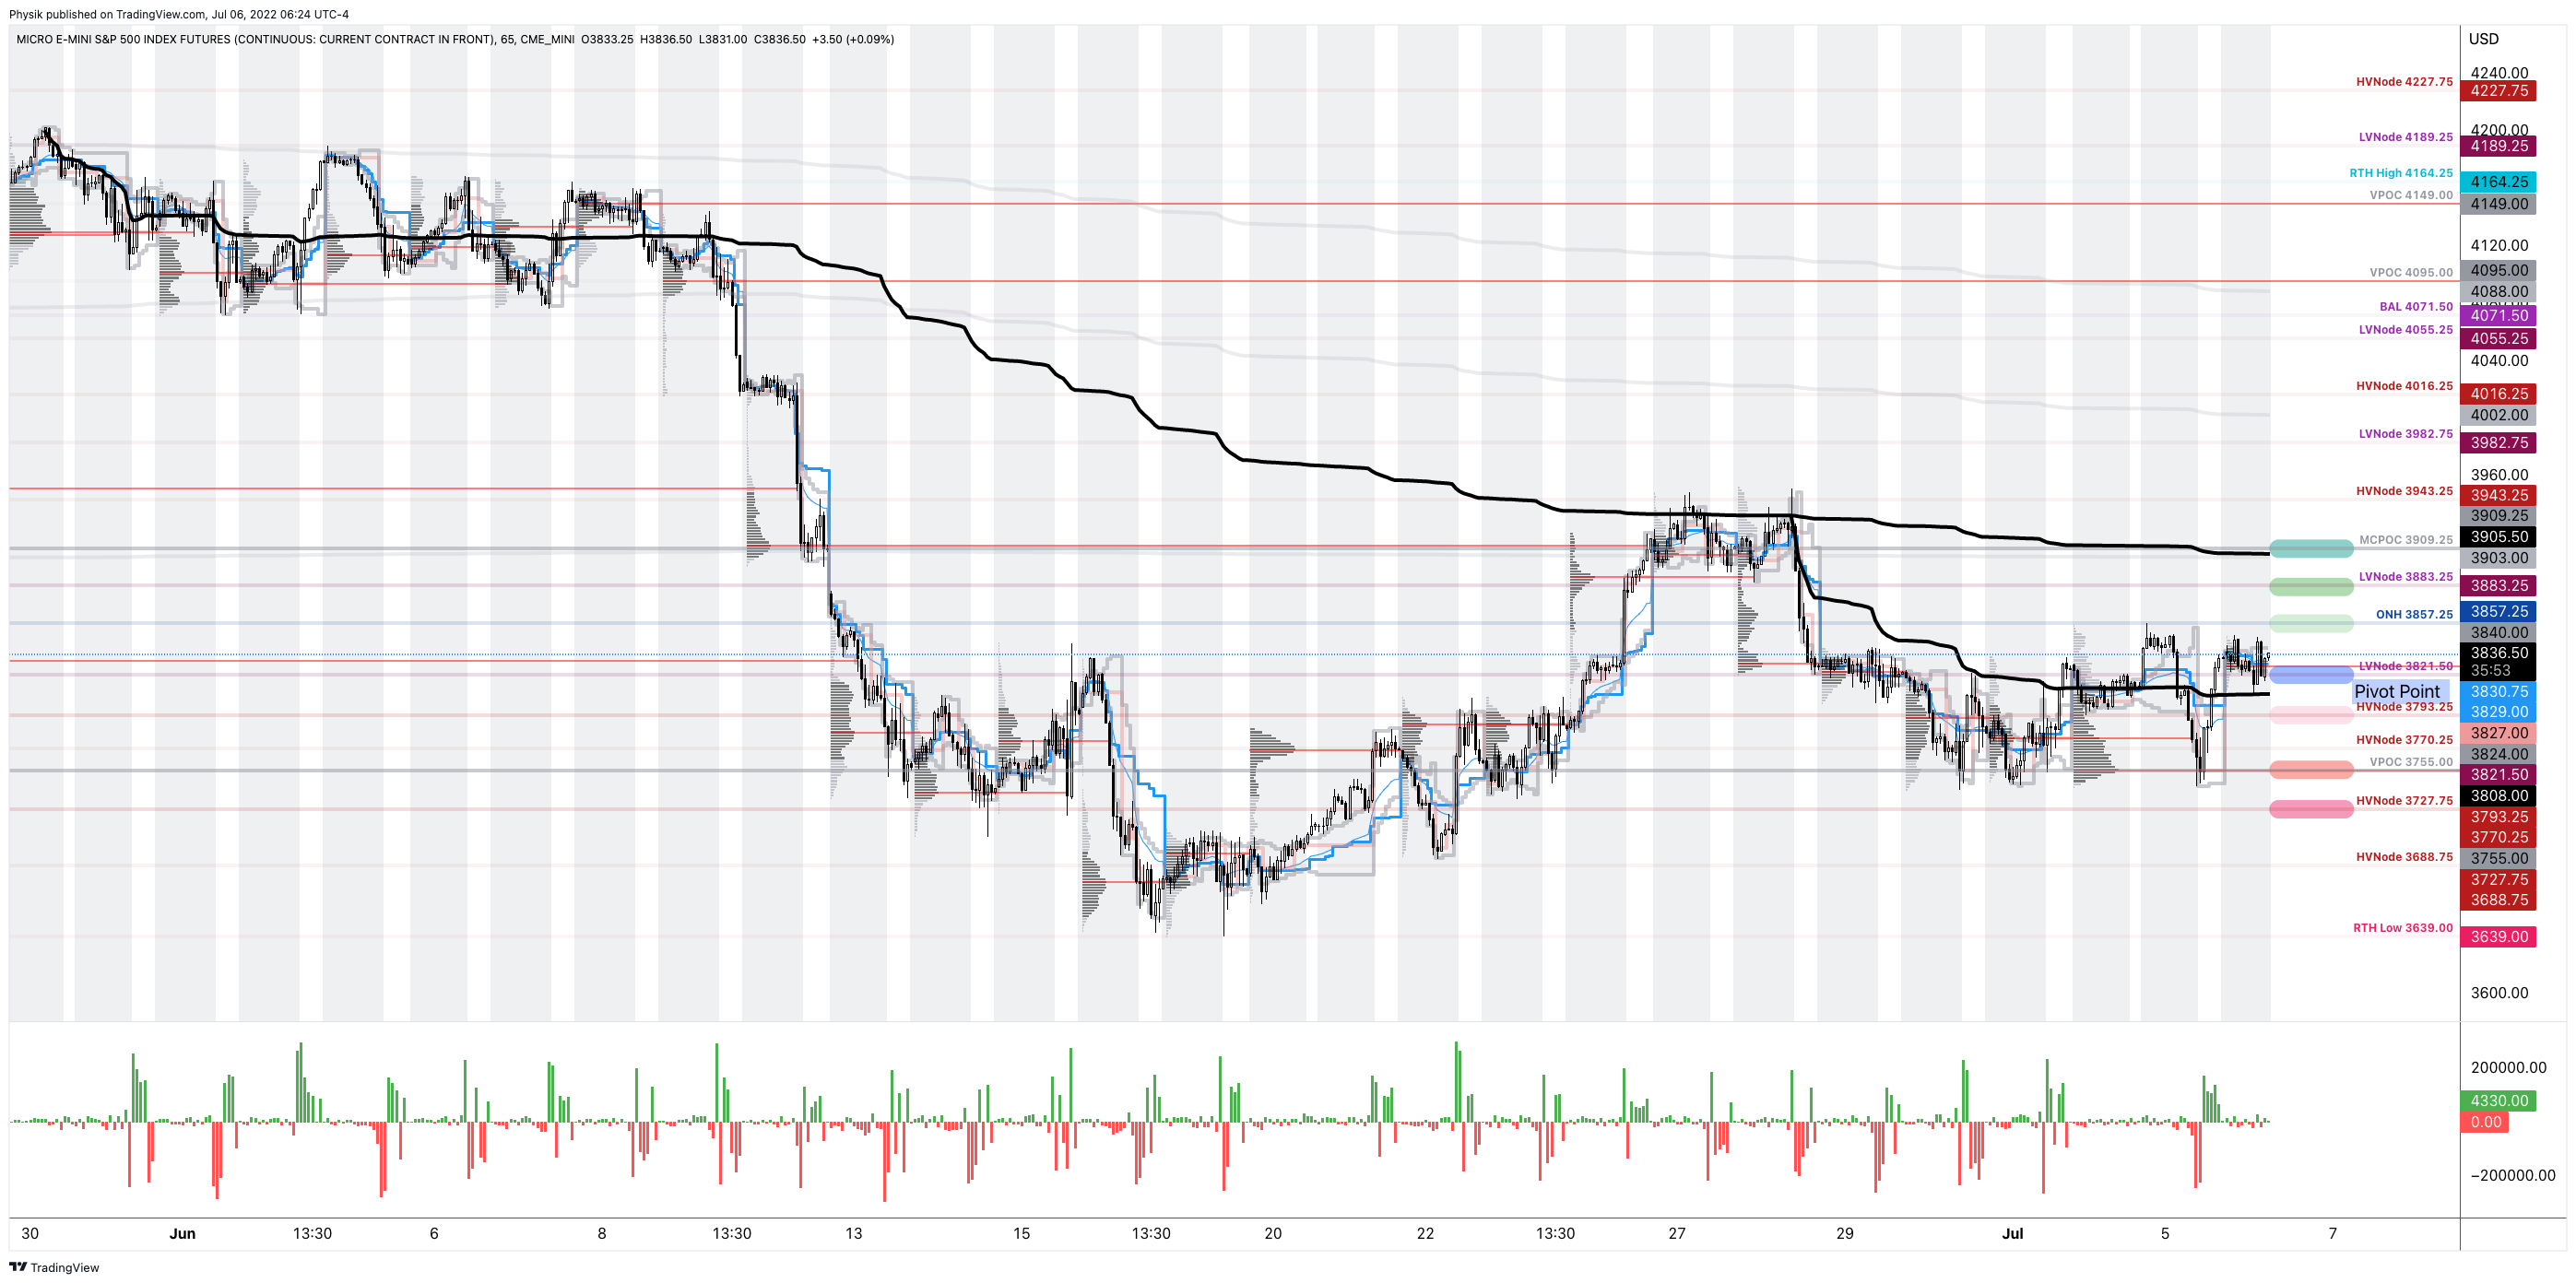
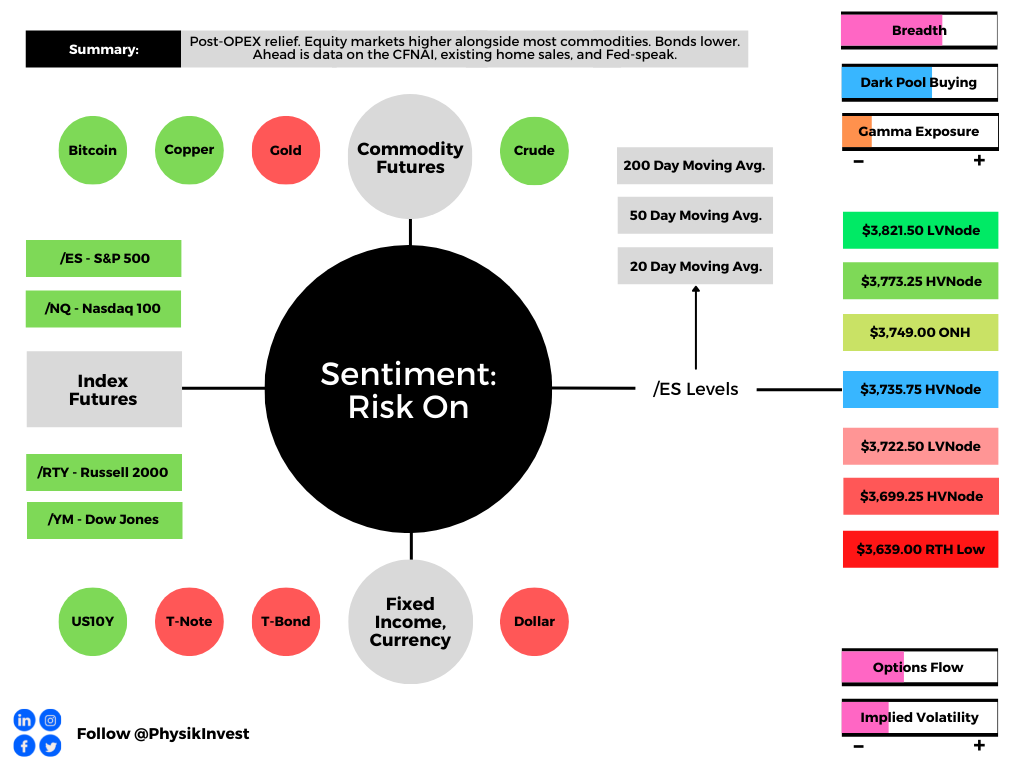
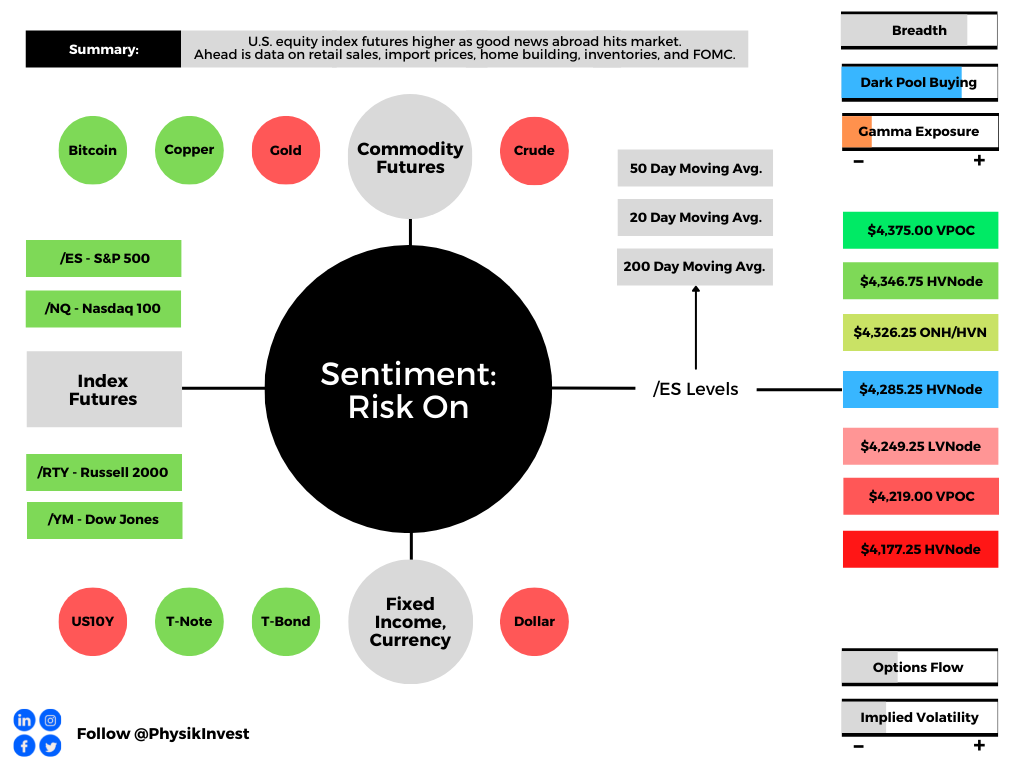
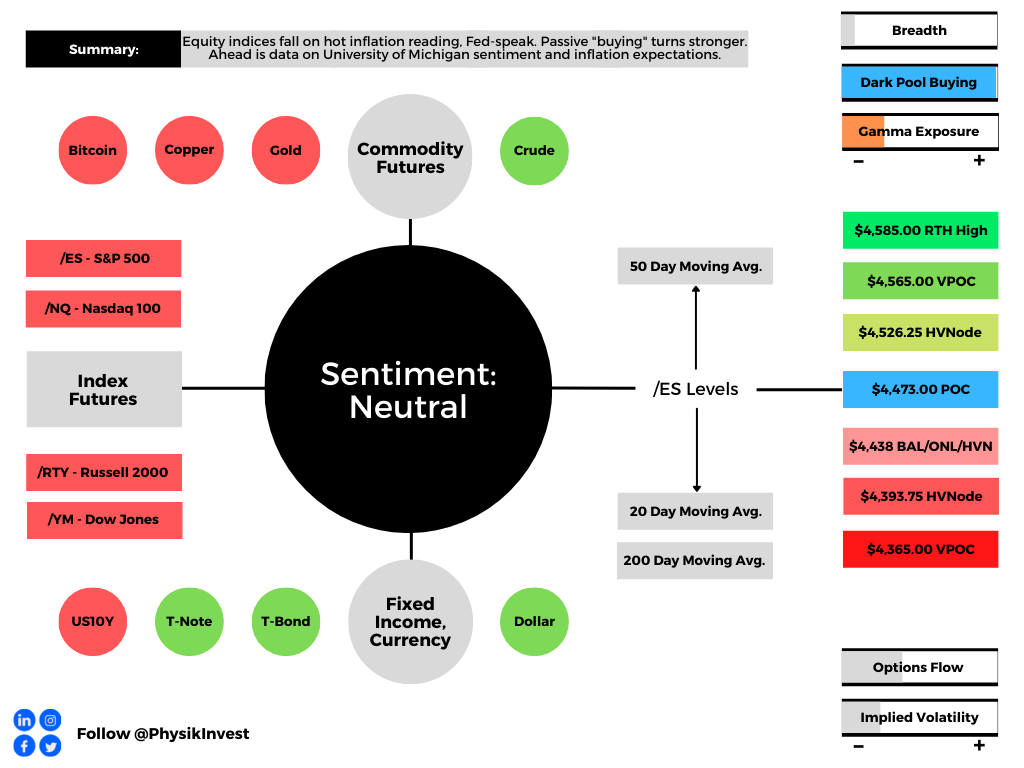
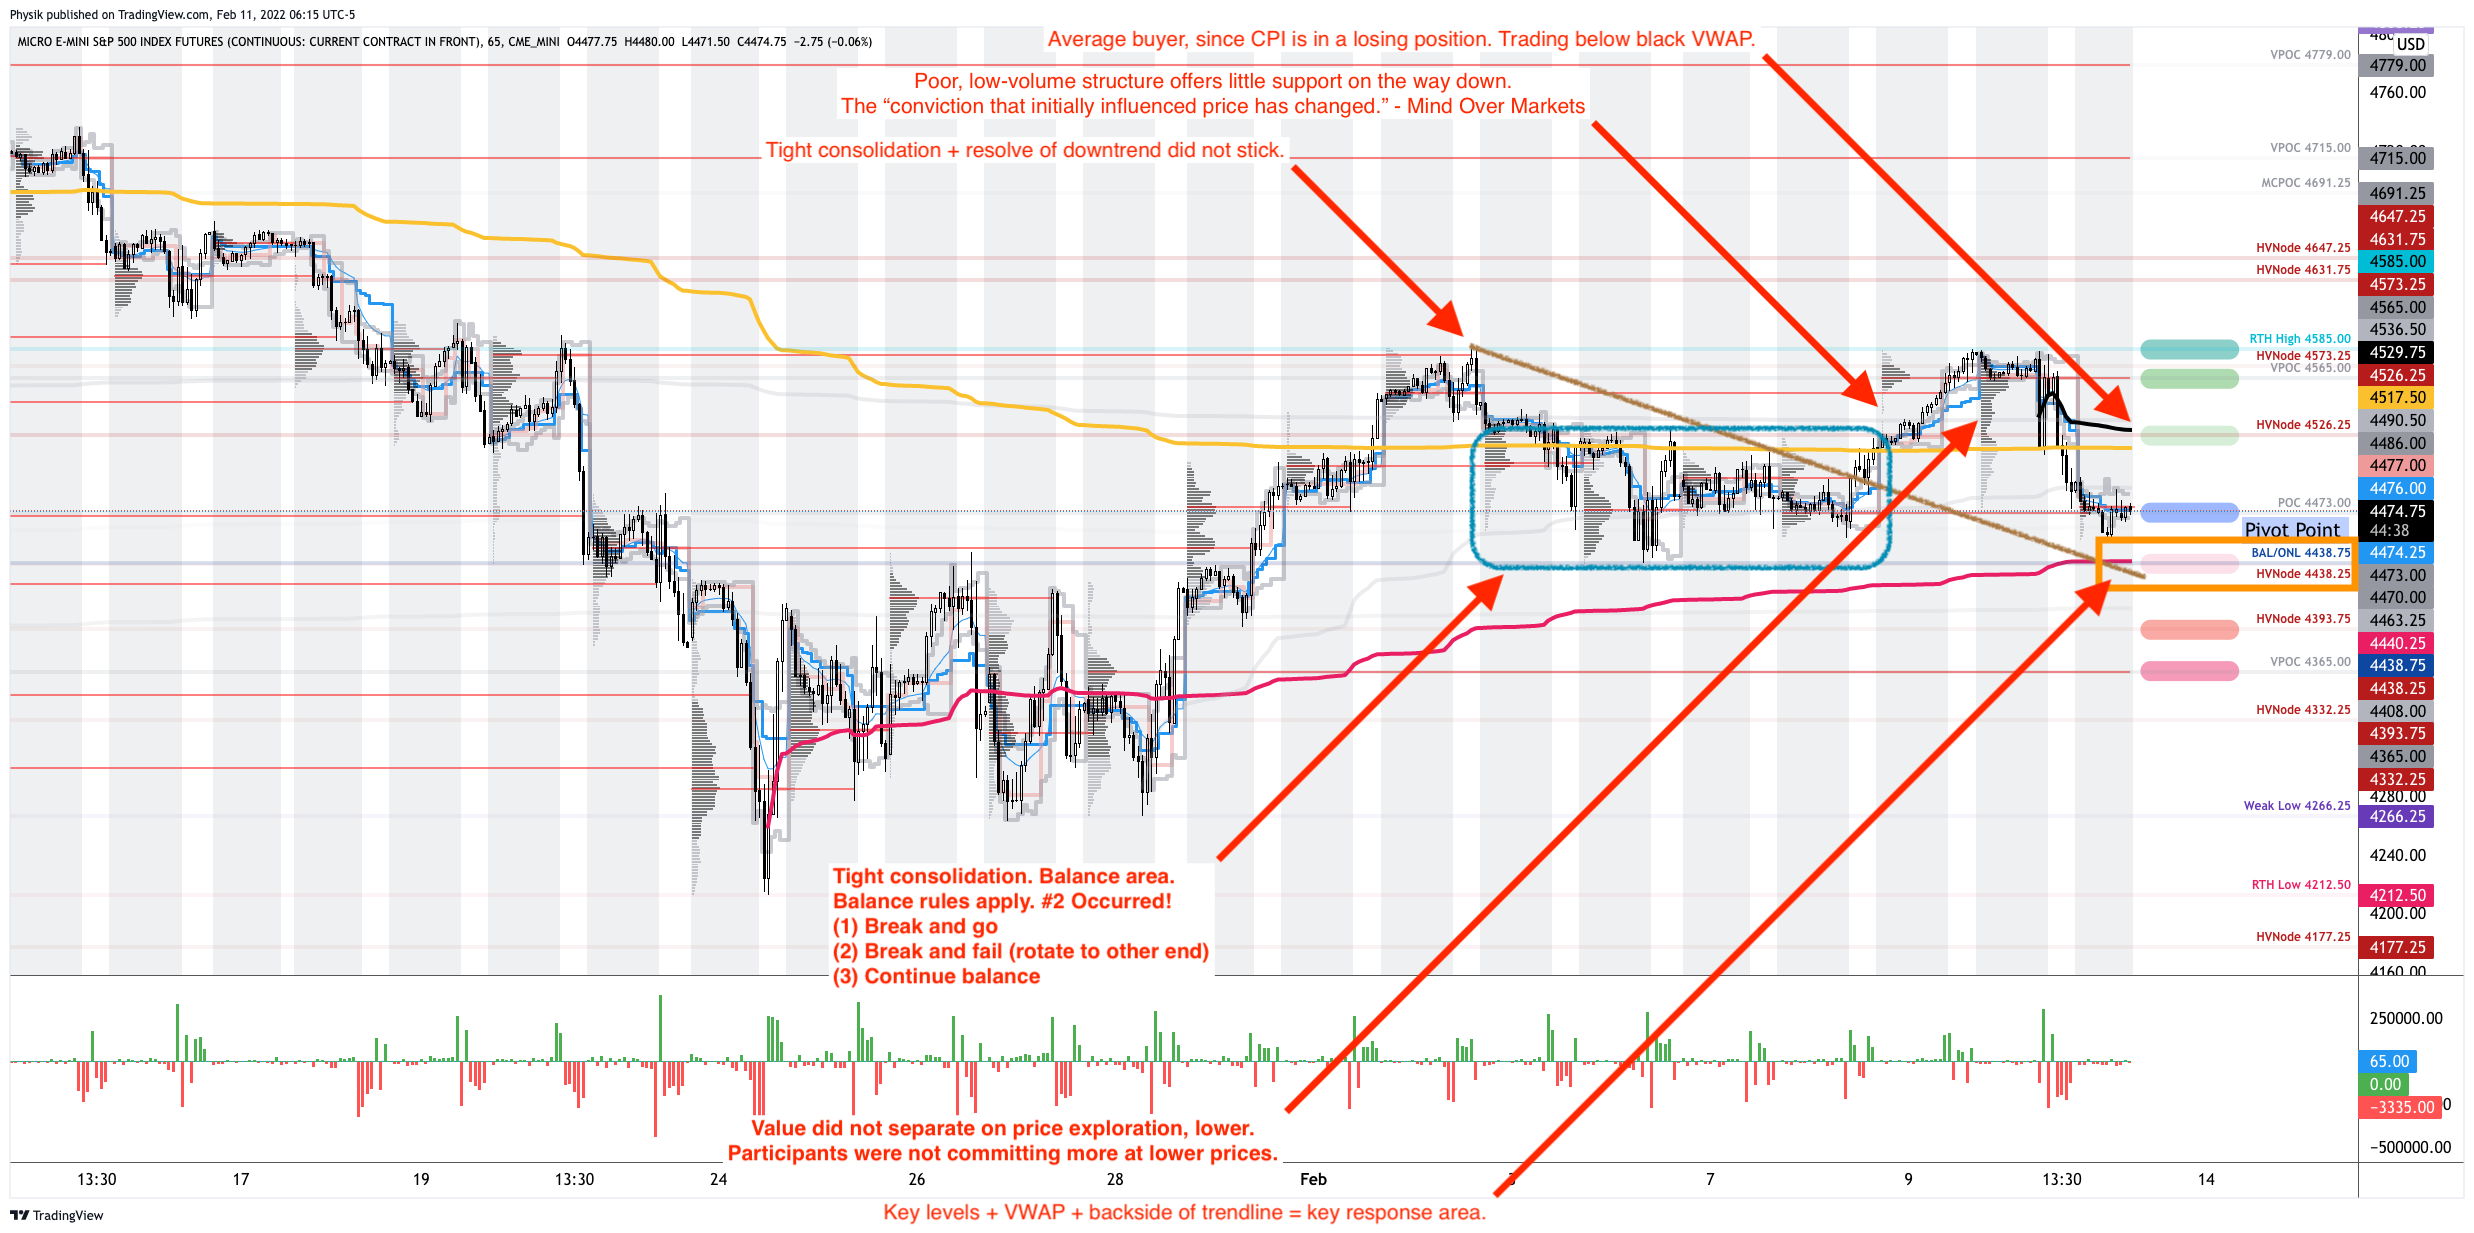
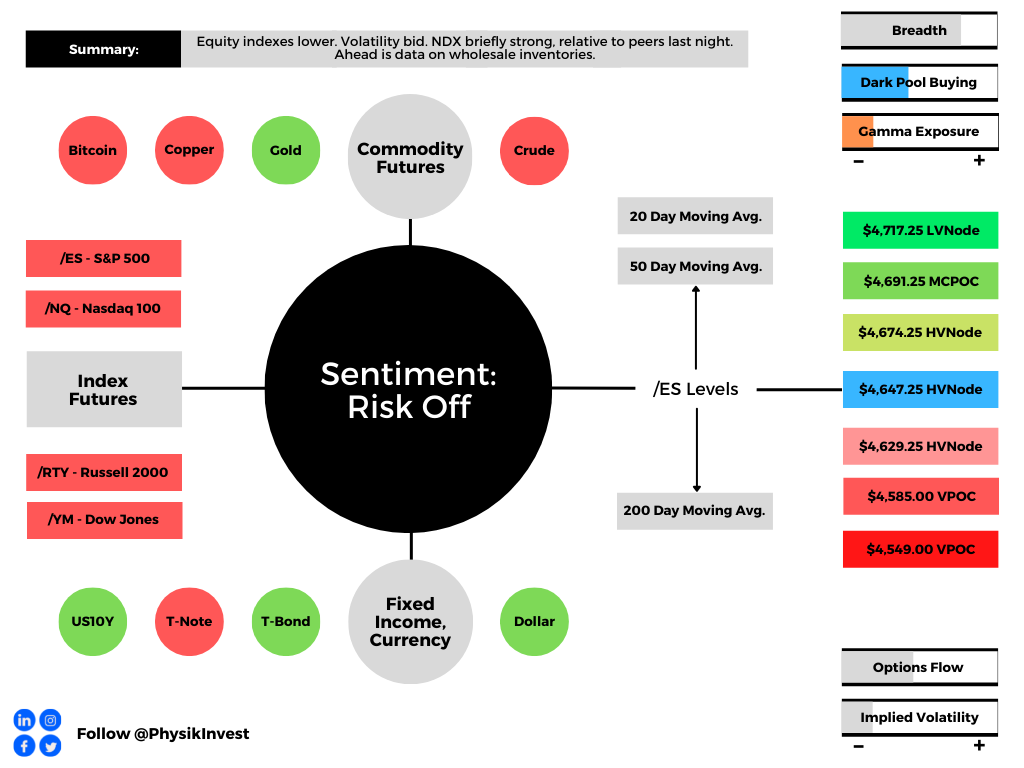
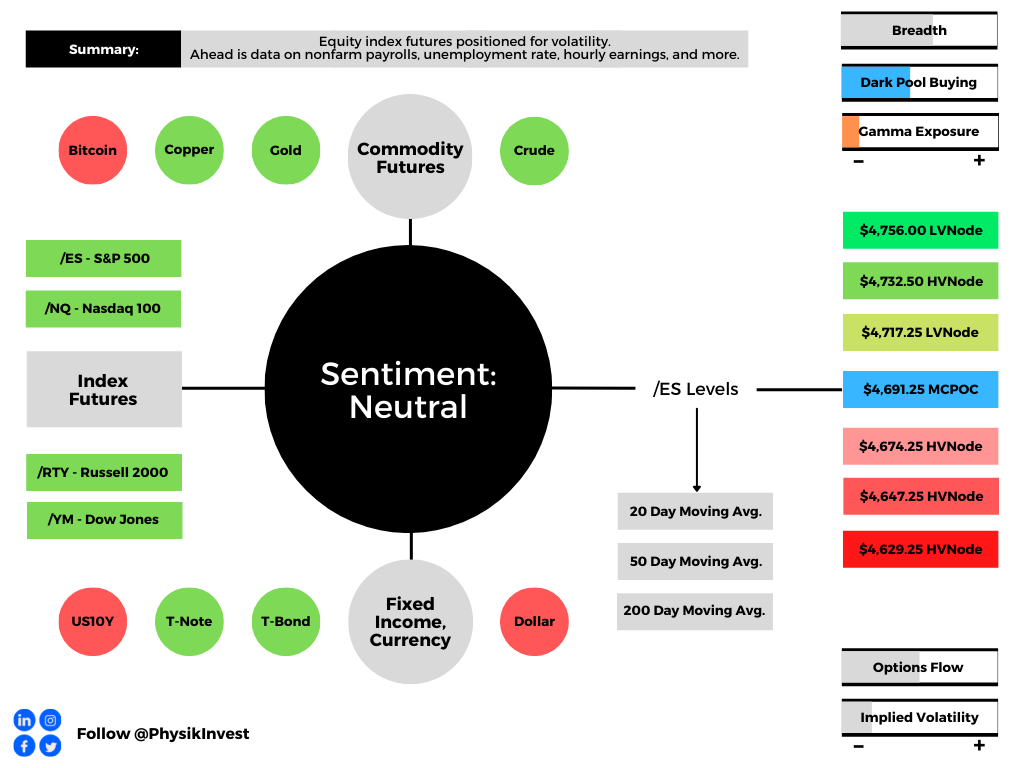
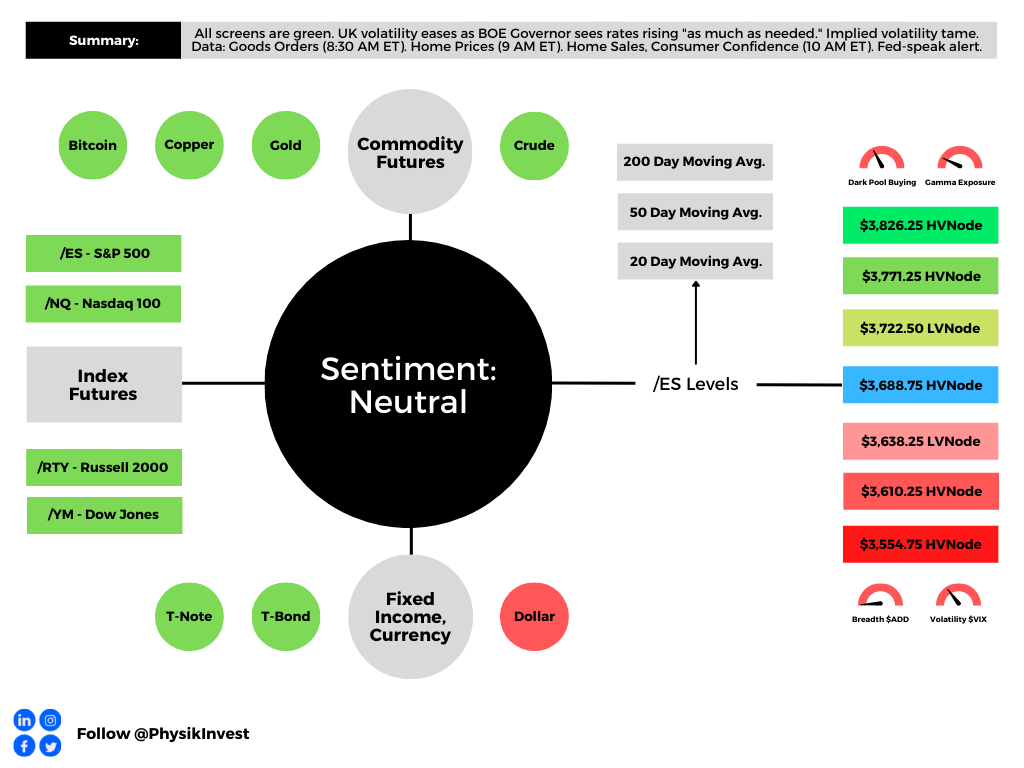
As of 6:30 AM ET, Tuesday’s regular session (9:30 AM – 4:00 PM ET), in the S&P 500, is likely to open in the middle part of a positively skewed overnight inventory, inside of prior-range and -value, suggesting a limited potential for immediate directional opportunity.
In the best case, the S&P 500 trades higher.
Any activity above the $3,688.75 HVNode puts into play the $3,722.50 LVNode. Initiative trade beyond the LVNode could reach as high as the $3,771.25 and $3,826.25 HVNode, or higher.
In the worst case, the S&P 500 trades lower.
Any activity below the $3,688.75 HVNode puts into play the $3,638.25 LVNode. Initiative trade beyond the LVNode could reach as low as the $3,610.75 and $3,554.75 HVNode, or lower.
Click here to load today’s key levels into the web-based TradingView charting platform. Note that all levels are derived using the 65-minute timeframe. New links are produced, daily.

Definitions
Volume Areas: A structurally sound market will build on areas of high volume (HVNodes). Should the market trend for long periods of time, it will lack sound structure, identified as low volume areas (LVNodes). LVNodes denote directional conviction and ought to offer support on any test.
If participants were to auction and find acceptance into areas of prior low volume (LVNodes), then future discovery ought to be volatile and quick as participants look to HVNodes for favorable entry or exit.
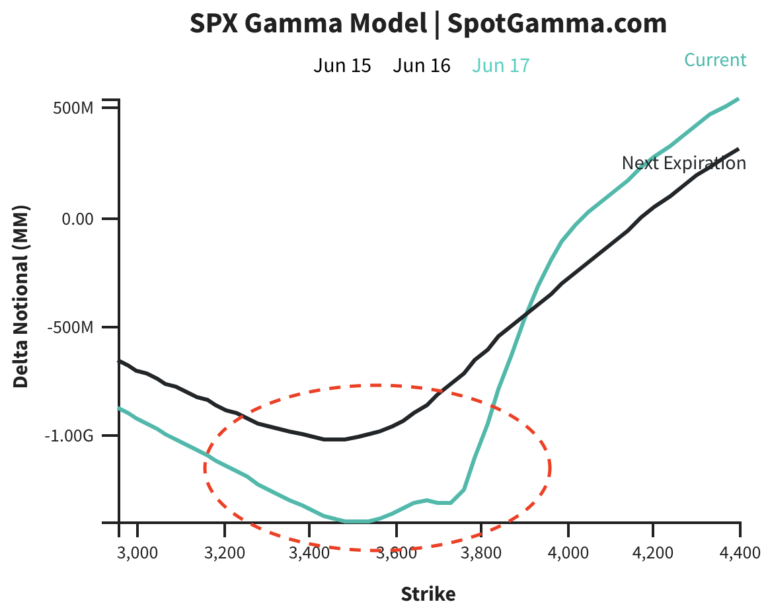
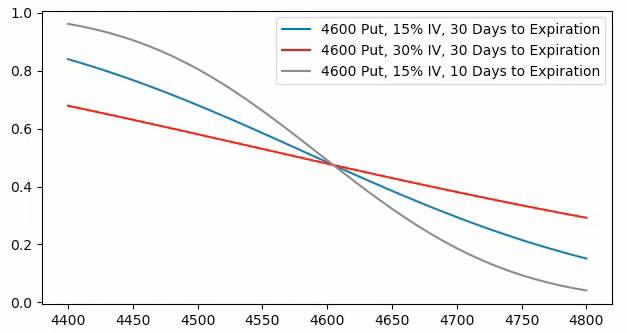
Vanna: The rate at which the delta of an option changes with respect to volatility.
Charm: The rate at which the delta of an option changes with respect to time.
About
After years of self-education, strategy development, mentorship, and trial-and-error, Renato Leonard Capelj began trading full-time and founded Physik Invest to detail his methods, research, and performance in the markets.
Capelj also develops insights around impactful options market dynamics at SpotGamma and is a Benzinga reporter.
Some of his works include conversations with ARK Invest’s Catherine Wood, investors Kevin O’Leary and John Chambers, FTX’s Sam Bankman-Fried, ex-Bridgewater Associate Andy Constan, Kai Volatility’s Cem Karsan, The Ambrus Group’s Kris Sidial, among many others.
Disclaimer
In no way should the materials herein be construed as advice. Derivatives carry a substantial risk of loss. All content is for informational purposes only.