Categories
Commentary

Daily Brief For July 29, 2021

Market Commentary

Equity index futures are sideways and divergent.

  • FOMC started the clock on tapering.
  • Ahead: Claims and U.S. GDP data.
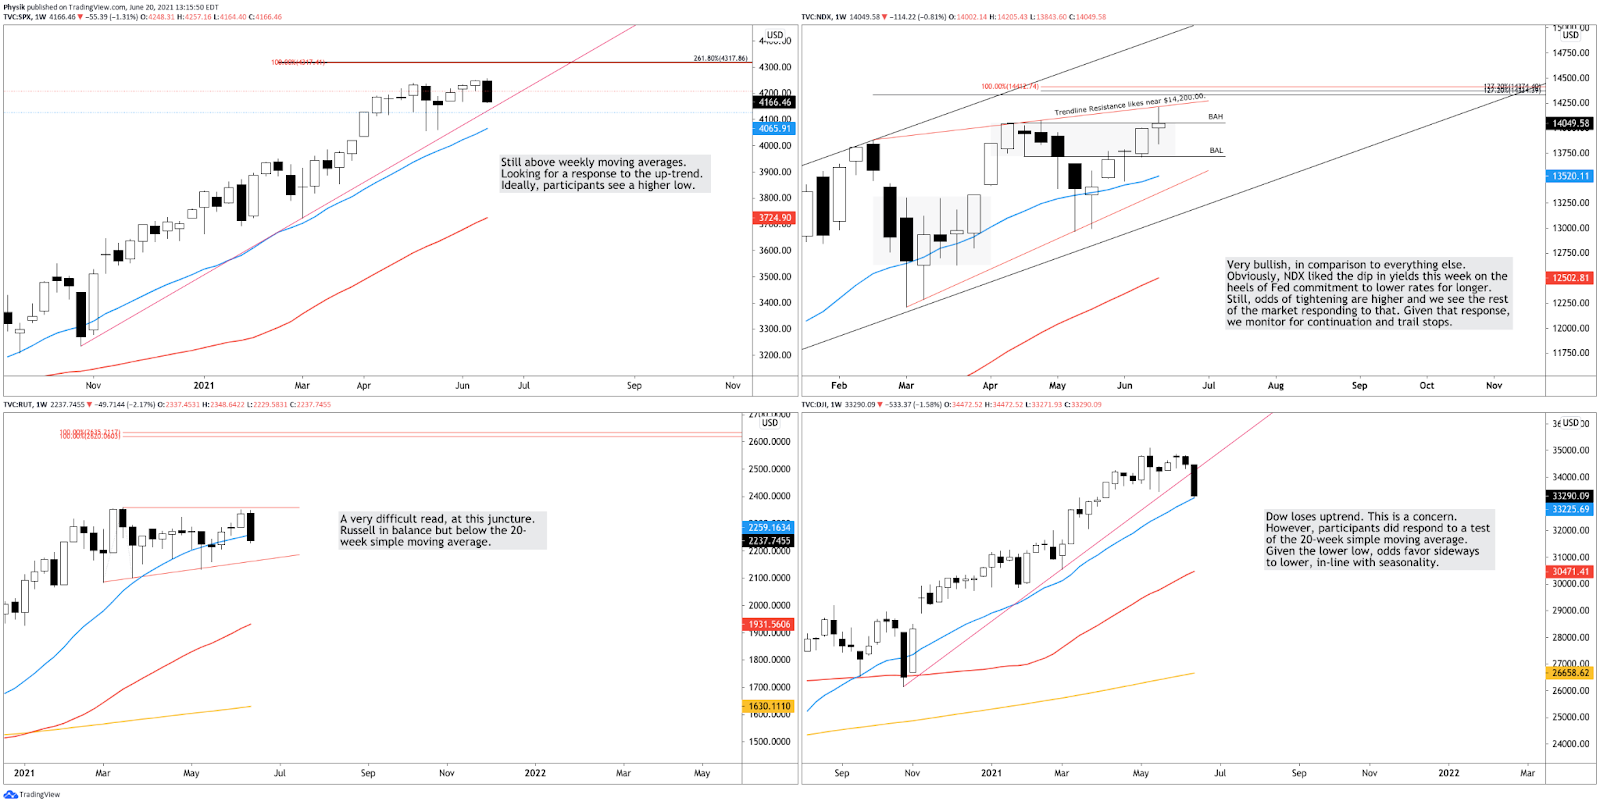
  • NDX weak relative to RUT and SPX.

What Happened: U.S. stock index futures auctioned within prior range alongside positive earnings reports, infrastructure progress, China liquidity injections, and optimism that the Federal Reserve would not taper stimulus.

Adding, in a statement, Neil Dutta, head of U.S. economics at Renaissance Macro Research, explained: “The Fed is starting the clock on tapering. It is not happening now or even in September, but expect the pace of asset buying to slowdown late this year or early next.”

Moreover, participants should keep an eye out for data on initial and continuing jobless claims, U.S. GDP, as well as pending home sales and earnings.

Graphic updated 6:30 AM ET. Sentiment Neutral if expected /ES open is inside of the prior day’s range. See here for more on the Dark Pool Index and Gamma. A positive Dark Pool Index reading is bullish. At the same time, the higher (lower) the gamma, the less (more) volatility. SHIFT Search data used for options activity. Note that options flow is sorted by the call premium spent; if green and more (less) positive then more (less) was spent on call options. Breadth reflects a reading of the prior day’s Advance/Decline indicator.

What To Expect: As of 6:30 AM ET, Thursday’s regular session (9:30 AM – 4:00 PM EST) in the S&P 500 will likely open inside of prior-range and -value, suggesting a limited potential for immediate directional opportunity.

Adding, during the prior day’s regular trade, the best case outcome occurred, evidenced by resolve above the Volume Weighted Average Price (blue in color on the below profile graphic) anchored from the 2:00 PM ET Federal Open Market Committee (FOMC) announcement. 

This is significant because this metric paints the picture of who is winning, so to speak; simply put, since FOMC, the average buyer is in a better position.

Moreover, as evidenced by the developing 5-day balance area in the profile graphic below, participants are finding higher prices valuable as they position themselves for a directional move, given increased clarity over earnings, taper, and more. 

Balance (Two-Timeframe Or Bracket): Rotational trade that denotes current prices offer favorable entry and exit. Balance-areas make it easy to spot a change in the market (i.e., the transition from two-time frame trade, or balance, to one-time frame trade, or trend).

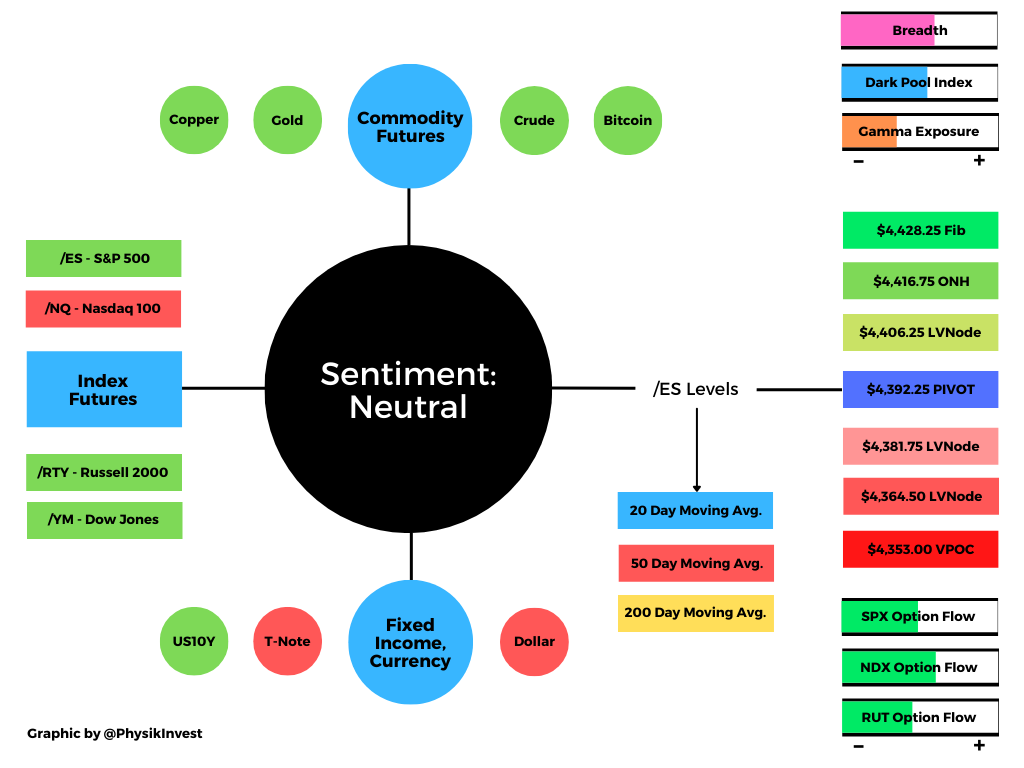
The modus operandi, in light of the above, is responsive trade. Auctioning beyond the $4,416.75 overnight high (ONH) or $4,364.50 opens the window for follow-through. In such a case, participants ought to abandon their focus on responsive trade. 

Overnight Rally Highs (Lows): Typically, there is a low historical probability associated with overnight rally-highs (lows) ending the upside (downside) discovery process.

Initiative Buying (Selling): Buying (selling) within or above (below) the previous day’s value area.

Responsive Buying (Selling): Buying (selling) in response to prices below (above) an area of recent price acceptance.

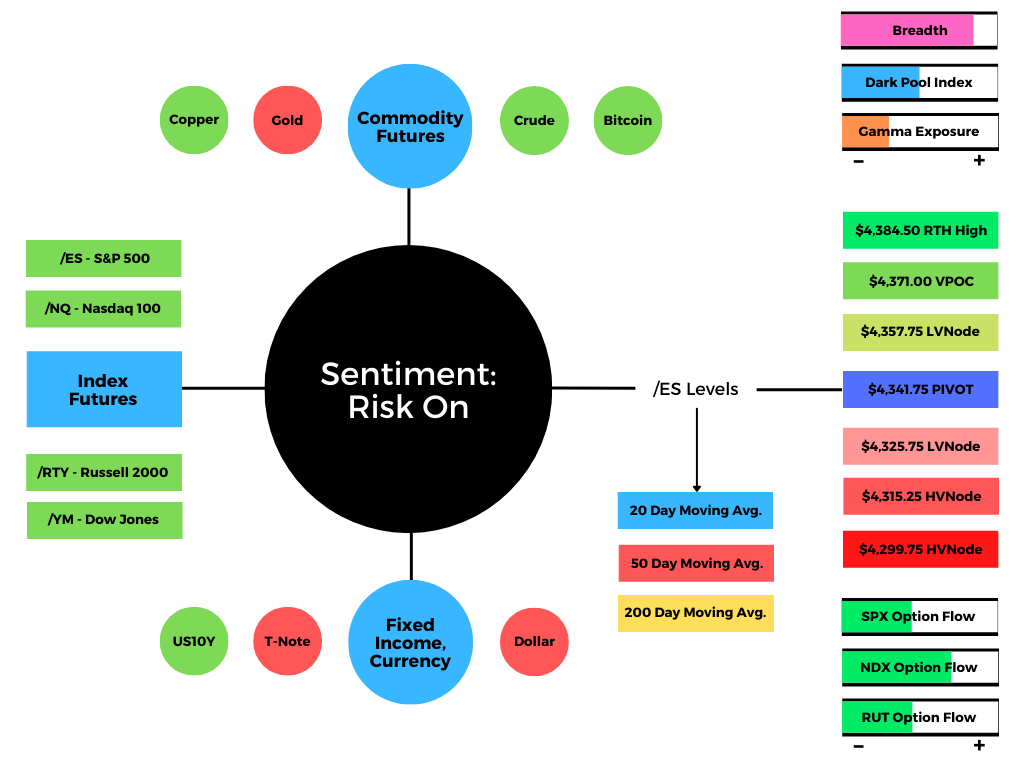
Internally speaking, after the Russell 2000 and Nasdaq 100 weakness in days prior, conditions improved markedly. Breadth, at the exchange level, was positive with a steady inflow into the stocks that were up, versus those that were down. However, though, weakness in the Nasdaq 100 returned this morning, a potential drag on any initiative activity in the coming session(s). 

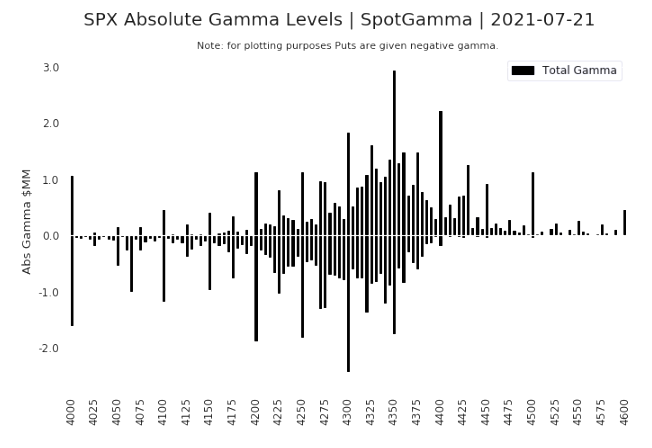
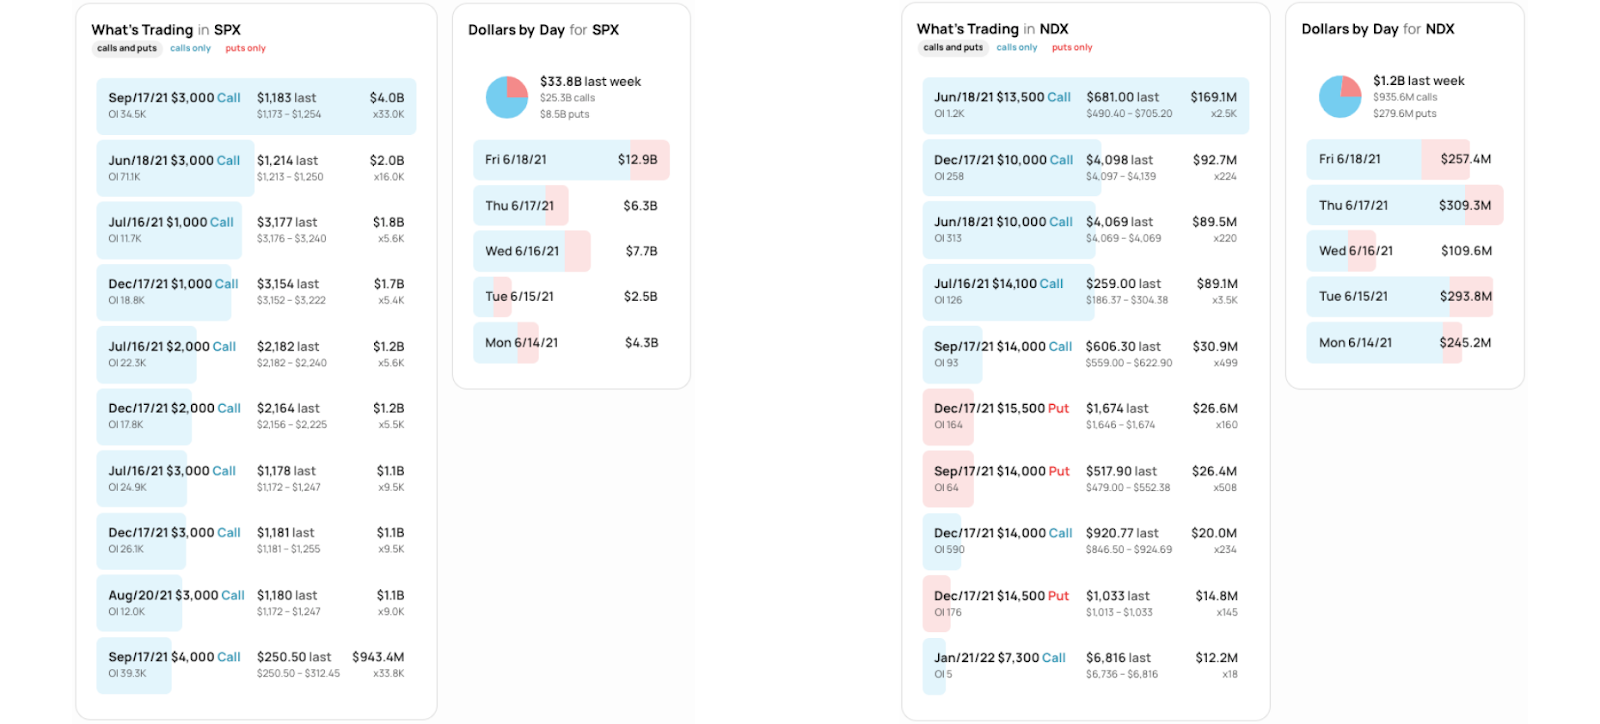
To note, quickly, we remember that as time passes, alongside the ebbing of post-FOMC volatility, there will be positive flows with respect to the unwind of options hedges.

Further, for today, participants can trade from the following frameworks. 

In the best case, the S&P 500 trades sideways or higher; activity above the $4,393.75 high volume area (HVNode) pivot puts in play the $4,406.25 low volume area (LVNode). Initiative trade beyond the $4,406.25 LVNode puts in play the $4,416.75 ONH and $4,428.25 Fibonacci extension.

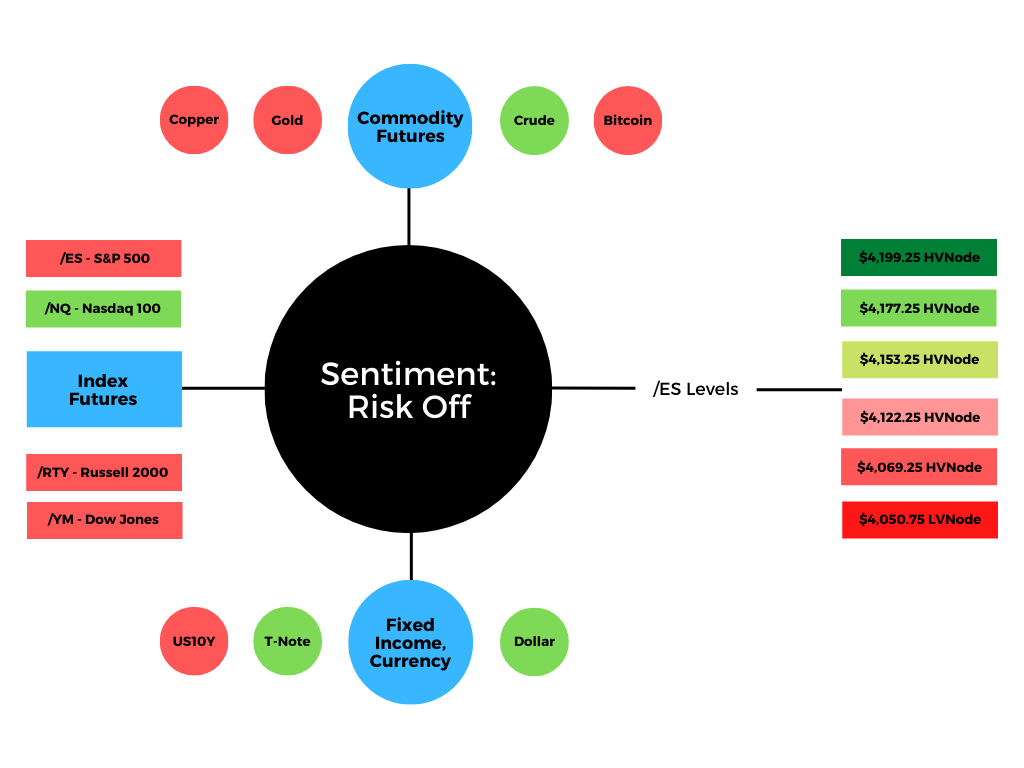
In the worst case, the S&P 500 trades lower; activity below the $4,393.75 HVNode puts in play the $4,381.75 LVNode. Initiative trade beyond the $4,381.75 LVNode could reach as low as the $4,364.50 LVNode and $4,341.75 micro-composite point of control (MCPOC).

Volume Areas: A structurally sound market will build on past areas of high volume. Should the market trend for long periods of time, it will lack sound structure (identified as a low volume area which denotes directional conviction and ought to offer support on any test). 

If participants were to auction and find acceptance into areas of prior low volume, then future discovery ought to be volatile and quick as participants look to areas of high volume for favorable entry or exit.

POCs: POCs are valuable as they denote areas where two-sided trade was most prevalent. Participants will respond to future tests of value as they offer favorable entry and exit.
Graphic: 65-minute profile chart of the Micro E-mini S&P 500 Futures. Graphic updated 6:30 AM ET.

News And Analysis

Gold demand has yet to recover fully from COVID-19, says WGC. 

MBS Recap: Fed hinted at a tapering, but bonds don’t really care.

The four biggest ways that the Robinhood app changed investing.

Biden’s two-front economic agenda made headway in the Senate.

China stocks rally as Beijing intensifies efforts to calm the market.

S&P Data: Growth is still on track despite rising COVID-19 cases.

U.S. corporate bond market near record pace as Fed taper looms.

Oversight of China payment companies likely boosts compliance.

What People Are Saying

About

After years of self-education, strategy development, and trial-and-error, Renato Leonard Capelj began trading full-time and founded Physik Invest to detail his methods, research, and performance in the markets. Additionally, Capelj is a finance and technology reporter. Some of his biggest works include interviews with leaders such as John Chambers, founder and CEO, JC2 Ventures, Kevin O’Leary, businessman and Shark Tank host, Catherine Wood, CEO and CIO, ARK Invest, among others.

Disclaimer

At this time, Physik Invest does not manage outside capital and is not licensed. In no way should the materials herein be construed as advice. Derivatives carry a substantial risk of loss. All content is for informational purposes only.

Categories
Commentary

Daily Brief For July 22, 2021

Market Commentary

Equity index futures trade higher as volatility implodes. Yields, commodities are higher, too. 

  • President Biden played down inflation.
  • Ahead: Claims, home sales, earnings.
  • Equity indices up on fantastic breadth.

What Happened: U.S. stock index futures auctioned higher alongside comments against inflation by President Joe Biden, yesterday. Virus fears ebbed as infections accelerated. 

Bitcoin extended its advance after Elon Musk, Catherine Wood, and Jack Dorsey talked cryptocurrency at a virtual event.

Ahead is data on weekly jobless claims, existing home sales, and corporate earnings. 

Graphic updated 6:30 AM ET. Sentiment Risk-On if expected /ES open is above the prior day’s range. See here for more on the Dark Pool Index and Gamma. A positive Dark Pool Index reading is bullish. At the same time, the higher (lower) the gamma, the less (more) volatility. SHIFT Search data used for options activity. Note that options flow is sorted by the call premium spent; if green and more (less) positive then more (less) was spent on call options. Breadth reflects a reading of the prior day’s Advance/Decline indicator.

What To Expect: As of 6:30 AM ET, Thursday’s regular session (9:30 AM – 4:00 PM EST) in the S&P 500 will likely open on a small gap, just outside of prior-range and -value, suggesting a potential for immediate directional opportunity.

Balance-Break and/or Gap Scenarios: Monitor for acceptance (i.e., more than 1-hour of trade) outside of the balance area.

Gaps ought to fill quickly. Should they not, that’s a signal of strength; do not fade. Leaving value behind on a gap-fill or failing to fill a gap (i.e., remaining outside of the prior session’s range) is a go-with indicator.

Auctioning and spending at least 1-hour of trade back in the prior range suggests a lack of conviction; in such a case, do not follow the direction of the most recent initiative activity.

Adding, during the prior day’s regular trade, the best case outcome occurred, evidenced by trade above the $4,334.25 spike base. As that happened, participants found increased acceptance at higher prices, moving the micro-composite Point of Control (MCPOC) up to $4,341.75, a pivot point (i.e., above = bullish, below = bearish) for today’s trade. This is noteworthy since it suggests the fairest price to do business, on a larger timeframe, is higher. 

At the same time, in support of the price rise was fantastic breadth and dynamics with respect to the derivatives market; amidst a crash in volatility, associated hedging activities bolster the rally. 

Coming into the balance-area sellers initiated from the weak prior, however, certain mechanics may quell the upside volatility, potentially leading to a stall or slower advance. 

Graphic: SpotGamma data suggests the S&P 500 is back in so-called “long-gamma” territory. Gamma is the sensitivity of an option to changes in the underlying price. Dealers that take the other side of options trades hedge their exposure to risk by buying and selling the underlying. When dealers are short-gamma, they hedge by buying into strength and selling into weakness. When dealers are long-gamma, they hedge by selling into strength and buying into weakness. The former exacerbates volatility. The latter calms volatility.

Moreover, for today, participants can trade from the following frameworks. 

In the best case, the S&P 500 trades sideways or higher; activity above the $4,341.75 MCPOC puts participants just short of entry into a prior balance area, near the $4,357.75 low volume area (LVNode). Initiative trade beyond the $4,357.75 LVNode could reach as high as the $4,371.00 POC and $4,384.50 minimal excess regular trade high (RTH), the typical scenario on re-entry into balance. 

In the worst case, the S&P 500 trades lower; activity below the $4,341.75 MCPOC puts in play the $4,325.75 LVNode. Initiative trade beyond the $4,325.75 LVNode could reach as low as the $4,315.25 and $4,299.75 high volume areas (HVNodes). 

It is important to note also that the prior two HVNodes correspond with key Volume Weighted Average Price (VWAP) levels, a metric highly regarded by chief investment officers, among other participants, for quality of trade. Additionally, liquidity algorithms are benchmarked and programmed to buy and sell around VWAPs.

Balance (Two-Timeframe Or Bracket): Rotational trade that denotes current prices offer favorable entry and exit. Balance-areas make it easy to spot a change in the market (i.e., the transition from two-time frame trade, or balance, to one-time frame trade, or trend).

POCs: POCs are valuable as they denote areas where two-sided trade was most prevalent. Participants will respond to future tests of value as they offer favorable entry and exit.

Volume Areas: A structurally sound market will build on past areas of high volume. Should the market trend for long periods of time, it will lack sound structure (identified as a low volume area which denotes directional conviction and ought to offer support on any test). 

If participants were to auction and find acceptance into areas of prior low volume, then future discovery ought to be volatile and quick as participants look to areas of high volume for favorable entry or exit.

Excess: A proper end to price discovery; the market travels too far while advertising prices. Responsive, other-timeframe (OTF) participants aggressively enter the market, leaving tails or gaps which denote unfair prices.
Graphic: 65-minute profile chart of the Micro E-mini S&P 500 Futures. Updated 6:30 AM ET.

News And Analysis

Strong job and real estate markets support credit. (Moody’s)

Federal Reserve ramps up debate on taper timing. (WSJ)

China offers oil reserves in a move to cool oil rally. (BBG)

Biden dismisses inflation worries, warns on hiring. (BBG)

U.S.-China goods trade booms amid virus, tariffs. (BBG)

Powell has broad support among top Biden aides. (BBG)

PG&E plans to bury power lines in fire-risk areas. (WSJ)

EMEA economies recovering faster than thought. (S&P)

Structured finance sees issuances rising to $1.4T. (S&P)

What People Are Saying

About

After years of self-education, strategy development, and trial-and-error, Renato Leonard Capelj began trading full-time and founded Physik Invest to detail his methods, research, and performance in the markets. Additionally, Capelj is a finance and technology reporter. Some of his biggest works include interviews with leaders such as John Chambers, founder and CEO, JC2 Ventures, Kevin O’Leary, businessman and Shark Tank host, Catherine Wood, CEO and CIO, ARK Invest, among others.

Disclaimer

At this time, Physik Invest does not manage outside capital and is not licensed. In no way should the materials herein be construed as advice. Derivatives carry a substantial risk of loss. All content is for informational purposes only.

Categories
Commentary

Weekly Brief For June 20, 2021

Too Lazy; Didn’t Read: As the market enters into a seasonally weak period, participants have noticed a divergence appear across the broader market. A breakdown in individual sectors – financials and transportation, for instance – and breadth, policy tightening concerns, outflows, elevated skew, put/call ratios, and degrossing on risk-taking (e.g., speculative activity in so-called meme stocks), in conjunction with the passage of Quadruple Witching, may portend increased volatility.

Market Commentary

Key Takeaways: Index futures diverge. Risk-off sentiment returns.

  • Fears over inflation and taper sparking movements.
  • Ahead: GDP, Home sales, PMI, Claims, Fed speak.
  • Indices sideways to lower; growth, tech stay strong.
Weekly price action graphic updated Sunday, June 20, 2021, at 12:00 PM ET.

What Happened: Last week, U.S. stock index futures diverged.

The Nasdaq 100 traded relatively strong, in comparison to the weaker S&P 500, Russell 2000, and Dow Jones Industrial Average. This action comes as the Federal Reserve signaled a faster-than-expected pace of policy tightening (learn more about the impact of policy tightening, here).

At the same time, in conjunction with the divergence in major indexes, participants saw sectoral breakdowns, a concern that may portend increased volatility after ‘Quadruple Witching’ Friday, or the rebalancing of benchmarks, as well as the expiration of stock index futures, stock index options, stock options, and single stock futures.

In light of the event, participants found it very difficult to discover prices. That’s according to Matt Tuttle, the CEO at Tuttle Capital Managment LLC. 

“When you get one of these events, you get noises around share movements,” Tuttle said by phone. “It messes up the information that we’re seeing.”

Adding, this Quadruple Witching Friday may throw a wrench into the recent bullishness.

Much of the advance, since the election, came in light of a historically bullish period for markets, amid increased mobility and reflation, supportive structural flows, as well as the pricing in of positive earnings expectations.

Now that the reaction to earnings was lackluster, in addition to the passage of a large derivative expiration and move into a seasonally weak period, the odds of volatility are substantially higher. 

Why? Most funds are committed to holding long positions. In the interest of lower volatility returns, these funds will collar off their positions, selling calls to finance the purchase of downside put protection. 

As a result of this activity, options dealers are long upside and short downside protection. 

This exposure must be hedged; dealers will sell into strength as their call (put) positions gain (lose) value and buy into weakness as their call (put) positions lose (gain) value. 

Now, unlike theory suggests, dealers will hedge call losses (gains) quicker (slower). This leads to “long-gamma,” a dynamic that crushes volatility and promotes momentum, observed by lengthy sprints — like the one the market is currently in — followed by rapid de-risking events as the market transitions into “short-gamma.” 

“‘Equities stable on hawkish Fed guidance’ is the wrong read here,” Nomura’s Charlie McElligott notes. “Equities are stable for the same reason they’ve been chopping for weeks: markets continue choking on an oversupply of gamma from vol sellers!”

The implications of this volatility supply can be summed up with the below graphic.

Given that OPEX will lead to a drop in gamma exposures, the market will, in the simplest way, be subject to more movement in its attempt to price in changing financial conditions.

Options Expiration (OPEX): Option expiries mark an end to pinning (i.e, the theory that market makers and institutions short options move stocks to the point where the greatest dollar value of contracts will expire worthless) and the reduction dealer gamma exposure.

“The extremely low SPX realized volatility is consistent with the possibility that 18-Jun has left ‘the street’ long index gamma, in which case realized volatility could pick up once positions are cleaner,” Rocky Fishman of Goldman Sachs said.

What To Expect: In the coming sessions, participants will want to focus their attention on where the S&P 500 trades in relation to the $4,153.25 high volume area (HVNode).

Volume Areas: A structurally sound market will build on past areas of high volume. Should the market trend for long periods of time, it will lack sound structure (identified as a low volume area which denotes directional conviction and ought to offer support on any test). 

If participants were to auction and find acceptance into areas of prior low volume, then future discovery ought to be volatile and quick as participants look to areas of high volume for favorable entry or exit.

That said, participants can trade from the following frameworks.

In the best case, the index trades sideways or higher; activity above $4,153.25 puts in play the HVNodes at $4,177.25 and $4,199.25. Initiative trade beyond $4,199.25 could reach as high as the $4,227.75 HVNode, $4,235.00 Point Of Control (POC), and $4,258.00 overnight high (ONH). 

POCs: POCs are valuable as they denote areas where two-sided trade was most prevalent. Participants will respond to future tests of value as they offer favorable entry and exit.

Overnight Highs (Lows): Typically, there is a low historical probability associated with overnight rally-highs (lows) ending the upside (downside) discovery process.

In the worst case, the index trades lower; activity below $4,153.25 puts in play the $4,122.25 HVNode. Thereafter, if lower, participants should look for responses at the $4,069.25 HVNode and $4,050.75 low volume area (LVNode).

Graphic: 4-hour profile chart of the Micro E-mini S&P 500 Futures.
Graphic: Weekly candlestick charts of the S&P 500 (top left), Nasdaq 100 (top right), Russell 2000 (bottom left), and Dow Jones Industrial Average (bottom right).
Graphic: SHIFT search suggests participants, based on dollars committed, were most interested in call strikes at and below current prices in the cash-settled S&P 500 Index (INDEX: SPX) and Nasdaq 100 (INDEX: NDX), last week. This activity may denote (1) stock replacement, (2) hedges for underlying short positions, or (3) speculation on the upside.

News And Analysis

Economy | Big shift in the so-called “dot-plot” that tracks rate projections. (Moody’s)

Economy | Housing boom moderates on lower building permit authorizations. (S&P)

Economy | Capital gains – a century-old tax break gets a rush of attention. (WSJ)

Economy | Supply crunch risks are extending into 2022, stocking inflation. (WSJ)

Economy | New Chinese regulation requires recovery, resolution plans. (Moody’s)

Markets | Troubled companies take pages from AMC playbook, selling stock. (WSJ)

Markets | Brace for huge oil volatility one U.S. trading group suggests. (REU)

Economy | U.S. bank loan-to-deposit ratios fall and pressure margins. (S&P)

Economy | U.S. economic recovery doesn’t have to follow herd immunity. (Moody’s)

Economy | The U.S. distress ratio continued its downward trend last month. (S&P)

Economy | Global structured finance – charting the recovery from COVID-19. (S&P)

Economy | The MBA is predicting another decline in new home sales. (MND)

Markets | Bond market in midst of repricing, but not the kind we’re used to. (MND)

What People Are Saying

Innovation And Emerging Trends

FinTech | Owning the paycheck is the key to financial technology success. (TC)

FinTech | Mark Cuban says ‘banks should be scared’ of crypto-based DeFi. (CNBC)

FinTech | Outlook: How the API economy is reinventing financial services. (CBI)

FinTech | Analysis: Big differences between a digital dollar and a CBDC. (BBG)

FinTech | Cryptocurrency lode of $100B stirs worries over hidden danger. (BBG)

FinTech | Axis-Z is working hard to bring virtual reality (VR) tech to trading. (BZ)

FinTech | OVTLYR’s platform helps investors take advantage of volatility. (BZ)

FinTech | Liti Capital allows investors tokenized access to litigation finance. (BZ)

Disclaimer

In no way should the materials herein be construed as advice. Derivatives carry a substantial risk of loss. All content is for informational purposes only.