
Market Commentary
Equity index futures trade sideways to lower with commodities and yields.
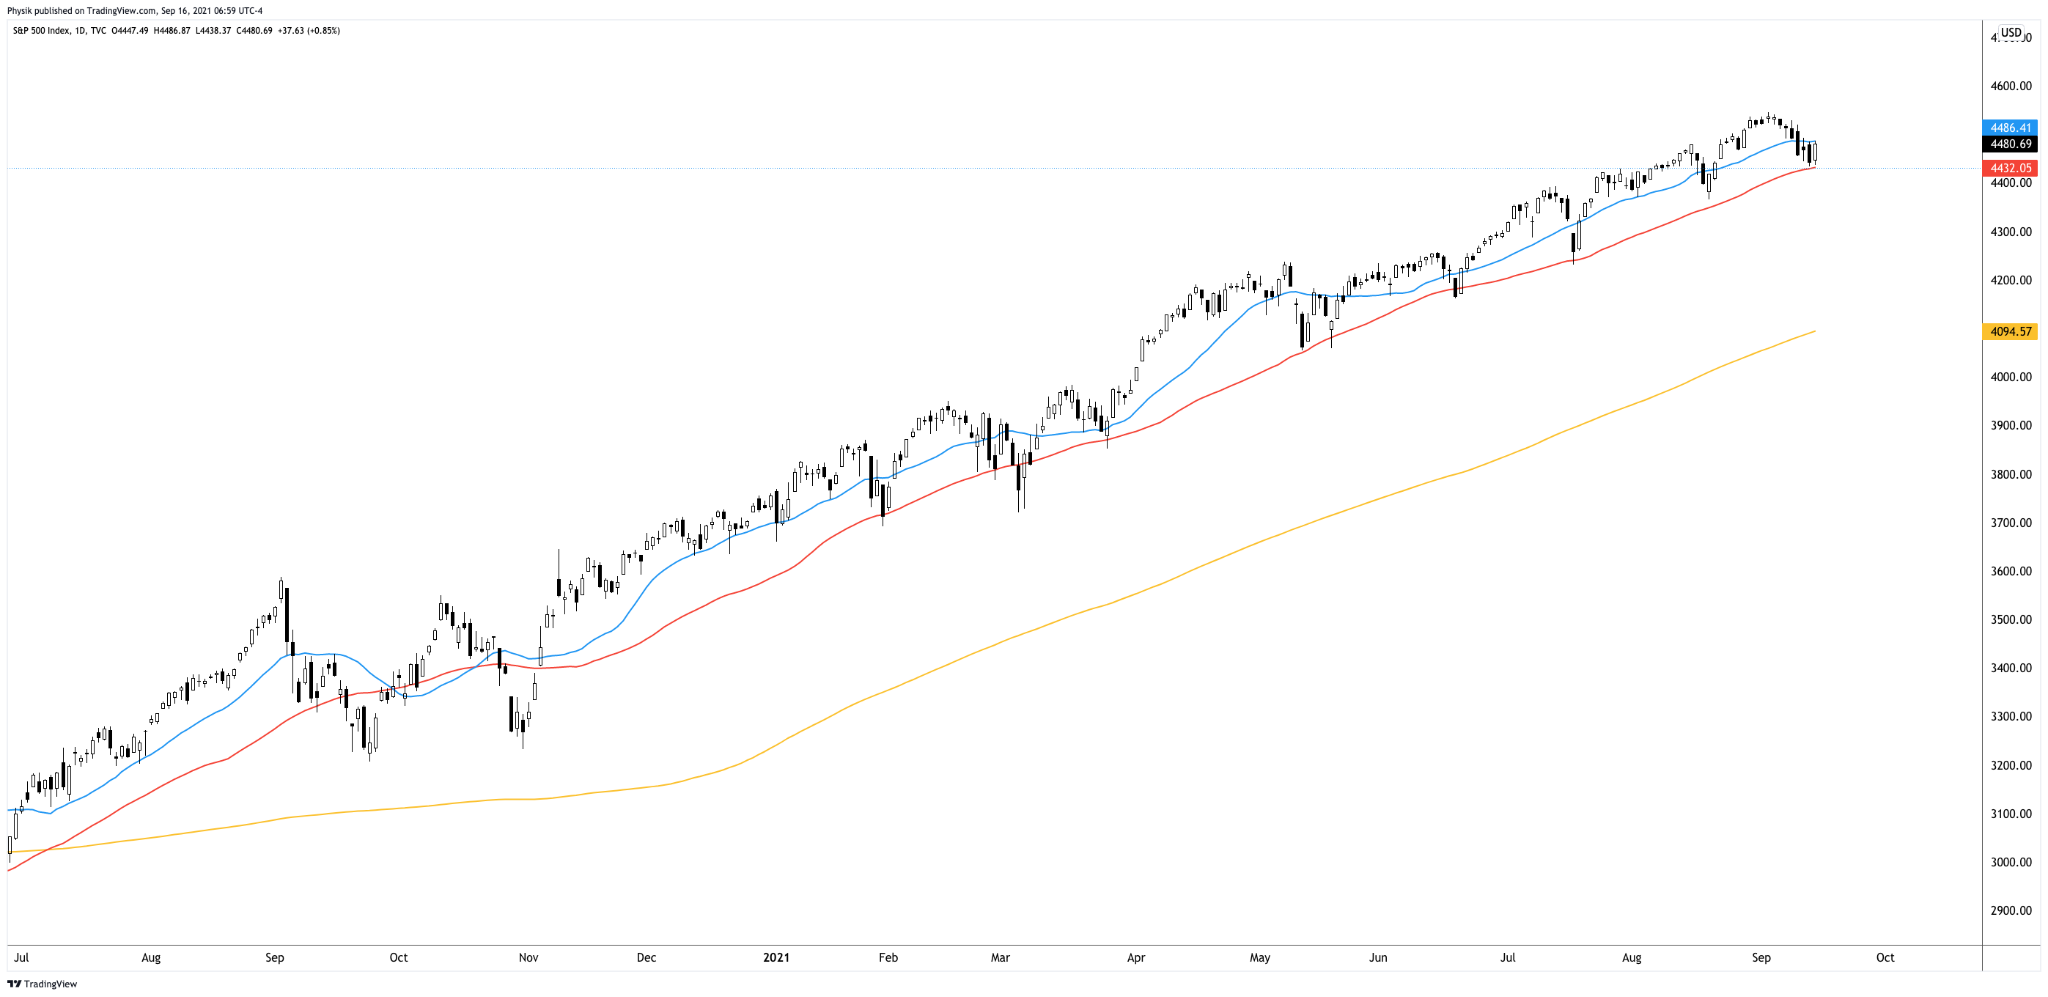
- Equity indices falling; SPX above 50-day.
- Ahead are claims, retail sales, and more.
- Positioning risks mount case for volatility.
What Happened: After a break higher, yesterday, U.S. stock index futures auctioned sideways to lower overnight as participants positioned themselves for an options expiry and upcoming data dumps.
Ahead is data on jobless claims (8:30 AM ET), retail sales (8:30 AM ET), Philadelphia Fed manufacturing survey (8:30 AM ET), and business inventories (10:00 AM ET).
What To Expect: As of 6:40 AM ET, Thursday’s regular session (9:30 AM – 4:00 PM EST) in the S&P 500 will likely open inside of prior-range and -value, suggesting a limited potential for immediate directional opportunity.
Adding, during the prior day’s regular trade, on strong intraday breadth and middling market liquidity metrics, the best case outcome occurred, evidenced by the S&P 500 closing the session on a spike higher, away from value.
Spike Rules In Play: Spike’s mark the beginning of a break from value. Spikes higher (lower) are validated by trade at or above (below) the spike base (i.e., the origin of the spike).
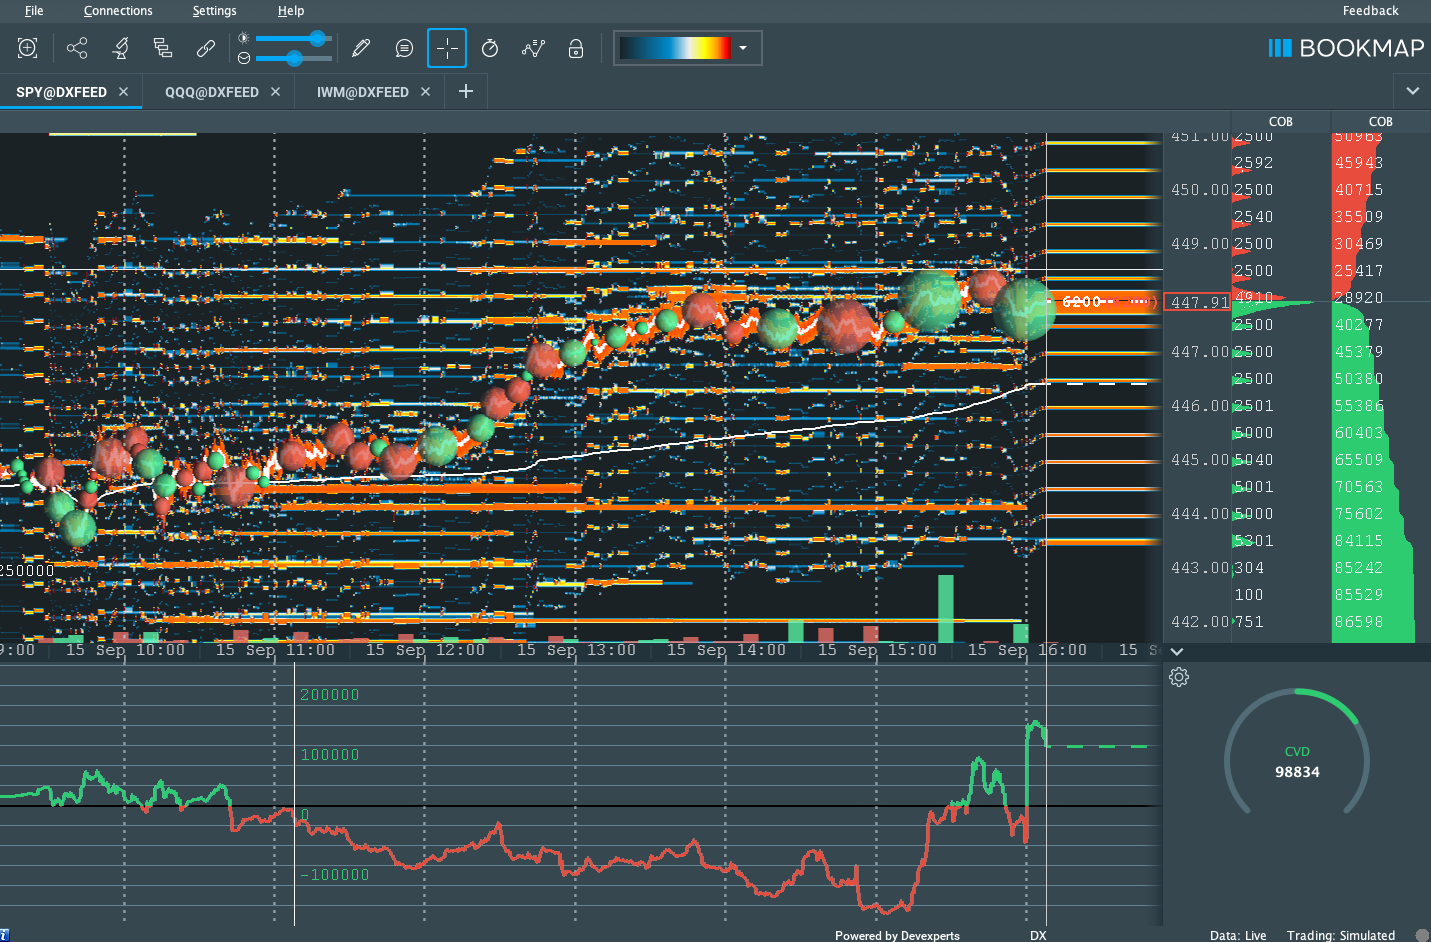
This is significant because of rejection, or a willingness not to transact at lower prices. We’re carrying forward the presence of minimal excess at Wednesday’s regular trade low (RTH Low), after a test of a prior untested point of control (VPOC) and 50-day simple moving average (i.e., two visual levels likely paid attention to by short-term, technically-driven market participants who generally are unable to defend retests).
Further, the aforementioned trade is happening in the context of peak growth and a moderation in the economic recovery, heightened valuations, the prospects of stimulus reduction, as well as non-seasonally aligned inflows, impactful options market dynamics, divergent sentiment, and fears of a mid-cycle transition.
According to SqueezeMetrics, the steepness of the GammaVol (GXV) curve suggests there is no more risk to the upside than there is to the downside; “SPX upside needs a bunch of bought puts to throw on the bonfire. It would be bullish for SPX to have people buying SPX puts,” and that hasn’t happened yet.
In other words, the graphic “means that movement from 4450 to 4500 is very easy, … [a]nd now that we’re at 4480, it’s slippery back down to 4450.”
Moreover, for today, given an increased potential for heightened volatility and responsive trade, participants may make use of the following frameworks.
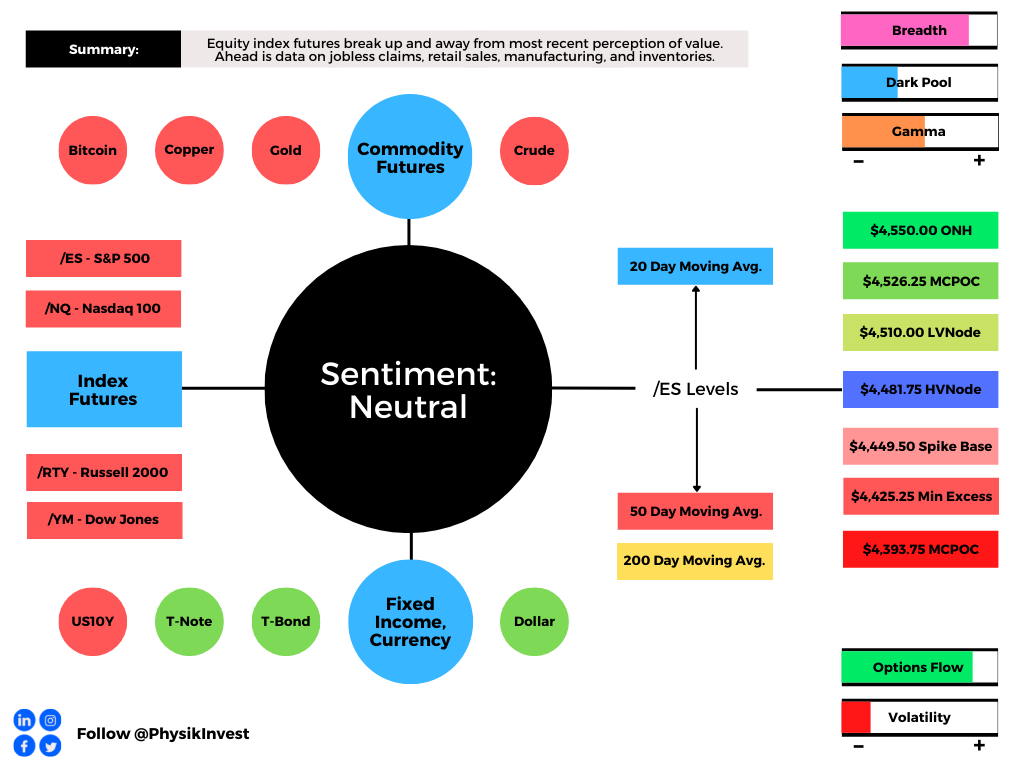
In the best case, the S&P 500 trades sideways or higher; activity above the $4,481.75 high volume area (HVNode) puts in play the $4,510.00 low volume area (LVNode). Initiative trade beyond the LVNode could reach as high as the $4,526.25 HVNode and $4,550.00 overnight high (ONH).
In the worst case, the S&P 500 trades lower; activity below the $4,481.75 HVNode puts in play the $4,449.50 spike base. Initiative trade beyond the spike base could reach as low as the $4,425.25 minimal excess low and $4,393.75 micro-composite point of control (MCPOC).
To note, the $4,481.75 HVNode corresponds with two anchored Volume Weighted Average Price (VWAP) levels, a metric highly regarded by chief investment officers, among other participants, for quality of trade. Additionally, liquidity algorithms are benchmarked and programmed to buy and sell around VWAPs.
Overnight Rally Highs (Lows): Typically, there is a low historical probability associated with overnight rally-highs (lows) ending the upside (downside) discovery process.

Volume Areas: A structurally sound market will build on past areas of high volume. Should the market trend for long periods of time, it will lack sound structure (identified as a low volume area which denotes directional conviction and ought to offer support on any test).

If participants were to auction and find acceptance into areas of prior low volume, then future discovery ought to be volatile and quick as participants look to areas of high volume for favorable entry or exit.

POCs: POCs are valuable as they denote areas where two-sided trade was most prevalent. Participants will respond to future tests of value as they offer favorable entry and exit.

Excess: A proper end to price discovery; the market travels too far while advertising prices. Responsive, other-timeframe (OTF) participants aggressively enter the market, leaving tails or gaps which denote unfair prices.

News And Analysis
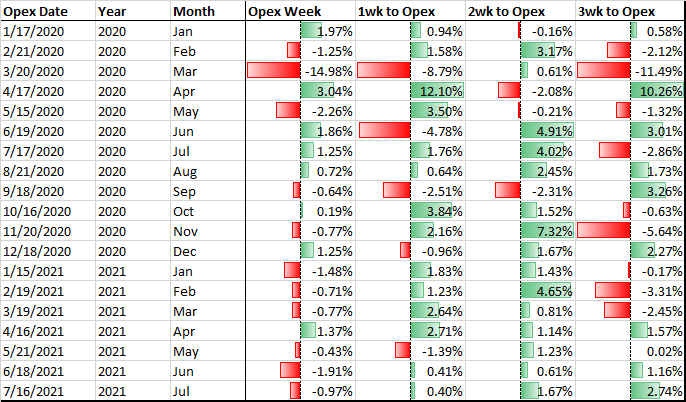
How ‘OpEx’ is shaking up the third week of the month.
U.S. political noise to intensify but have limited impact.
Though COVID cases are falling, the deaths are rising.
Biden’s economic plan at risk of delays amid squabble.
China Evergrande onshore bond trading is suspended.
The Coinbase spat with SEC ups ante in a crypto fight.
The foreclosure rate at its lowest in over two decades.
Talking Options Greeks: Everything you need to know.
What People Are Saying
About
After years of self-education, strategy development, and trial-and-error, Renato Leonard Capelj began trading full-time and founded Physik Invest to detail his methods, research, and performance in the markets.
Additionally, Capelj is a finance and technology reporter. Some of his biggest works include interviews with leaders such as John Chambers, founder and CEO, JC2 Ventures, Kevin O’Leary, businessman and Shark Tank host, Catherine Wood, CEO and CIO, ARK Invest, among others.
Disclaimer
At this time, Physik Invest does not manage outside capital and is not licensed. In no way should the materials herein be construed as advice. Derivatives carry a substantial risk of loss. All content is for informational purposes only.