Market Commentary
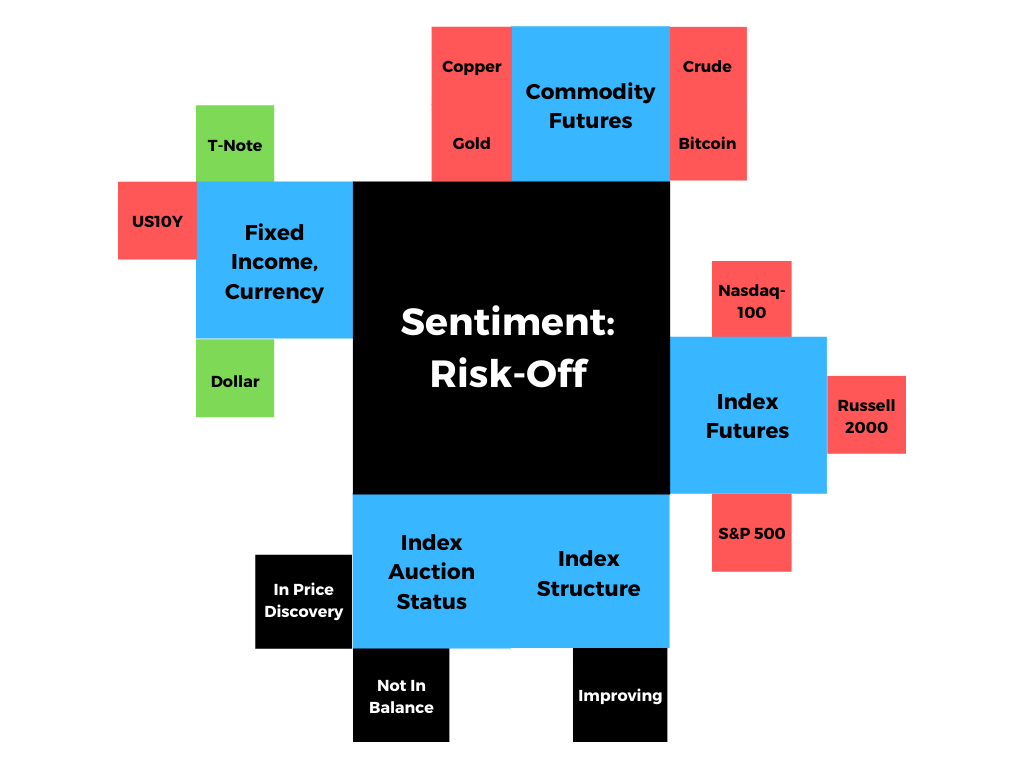
Equity index futures trade sideways to lower.
- Fed could hint at a stimulus taper.
- Ahead: UoM consumer sentiment.
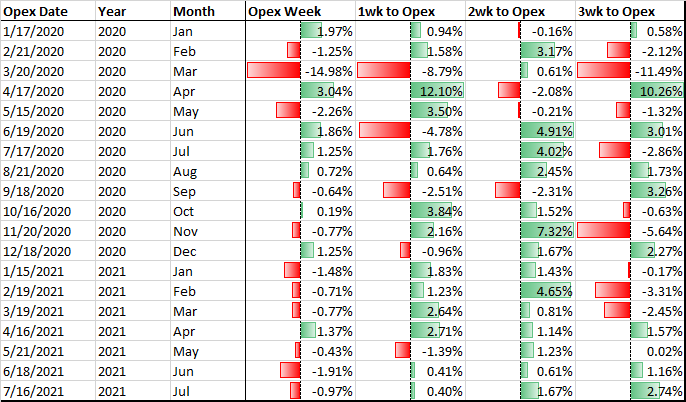
- OPEX and a potential for volatility.
What Happened: U.S. stock index futures auctioned sideways to lower ahead of quadruple witching and news the Federal Reserve may hint at scaling back asset purchases next week.
Ahead is data on University of Michigan consumer sentiment (10:00 AM ET).
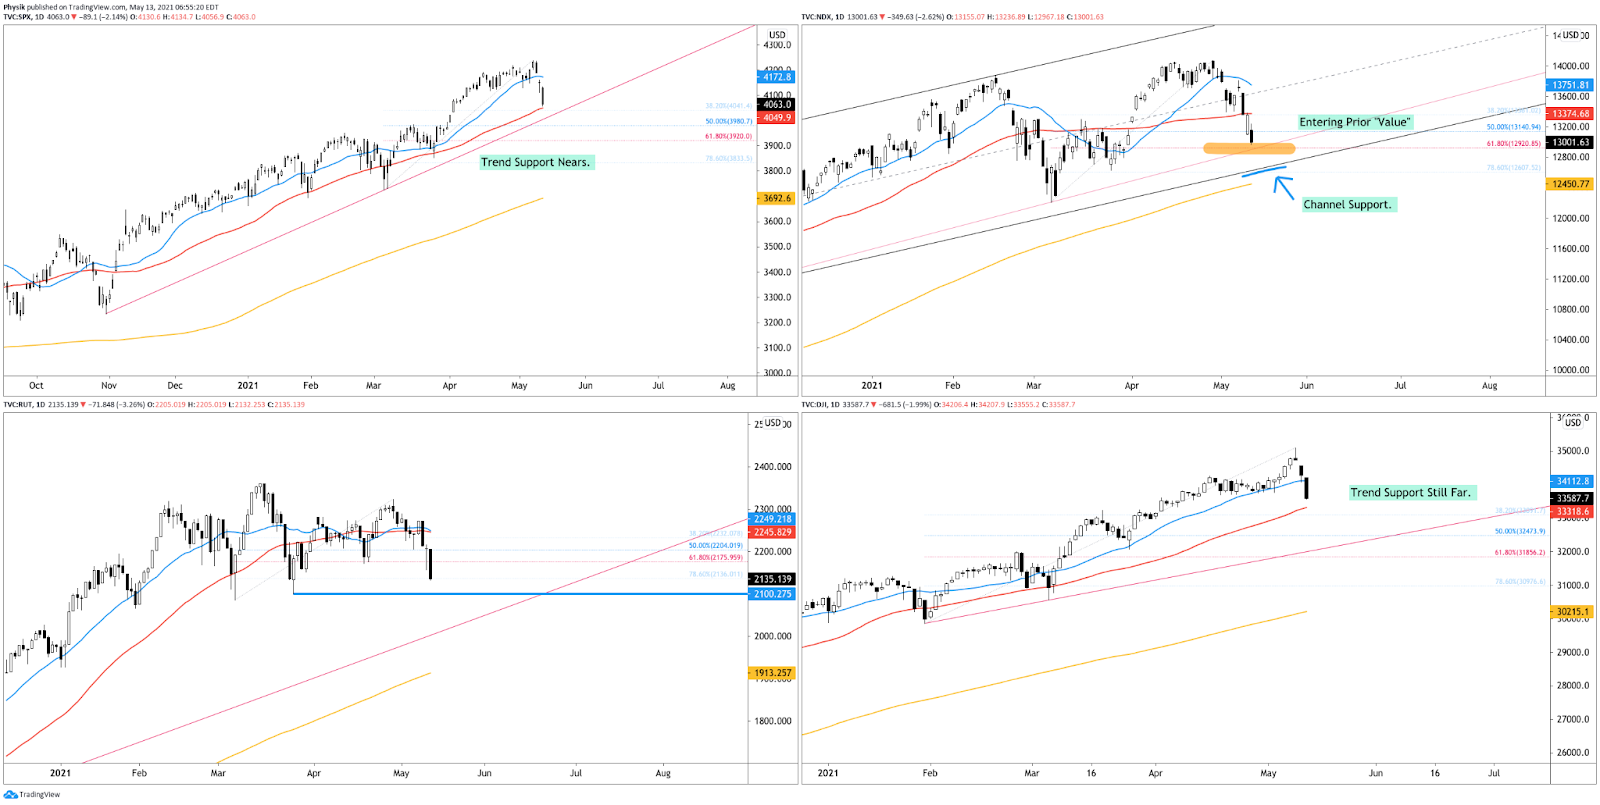
What To Expect: As of 6:30 AM ET, Friday’s regular session (9:30 AM – 4:00 PM EST) in the S&P 500 will likely open inside of prior-range and -value, suggesting a limited potential for immediate directional opportunity.
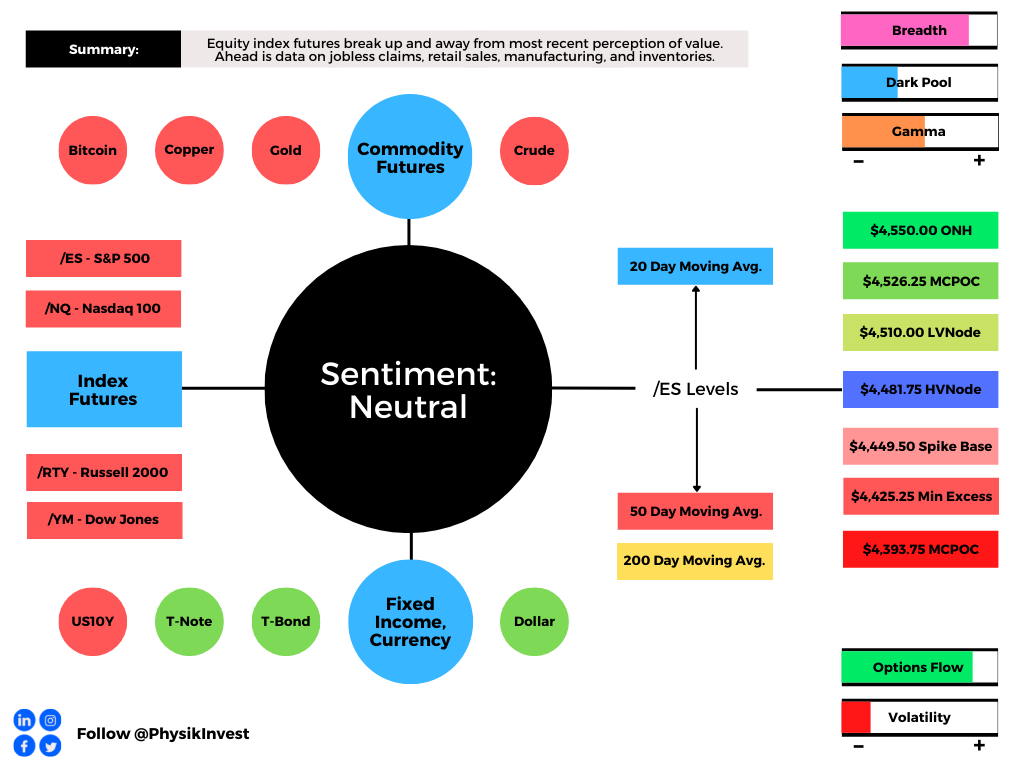
Adding, during the prior day’s regular trade, on weak intraday breadth and strong market liquidity metrics, the worst-case outcome occurred, evidenced by trade back toward the market’s most recent perception of value, the convergence of the $4,437.75 micro-composite point of control (MCPOC) and an anchored volume-weighted average price (VWAP).
POCs: POCs are valuable as they denote areas where two-sided trade was most prevalent. Participants will respond to future tests of value as they offer favorable entry and exit.

VWAP: A metric highly regarded by chief investment officers, among other participants, for quality of trade. Additionally, liquidity algorithms are benchmarked and programmed to buy and sell around VWAPs.
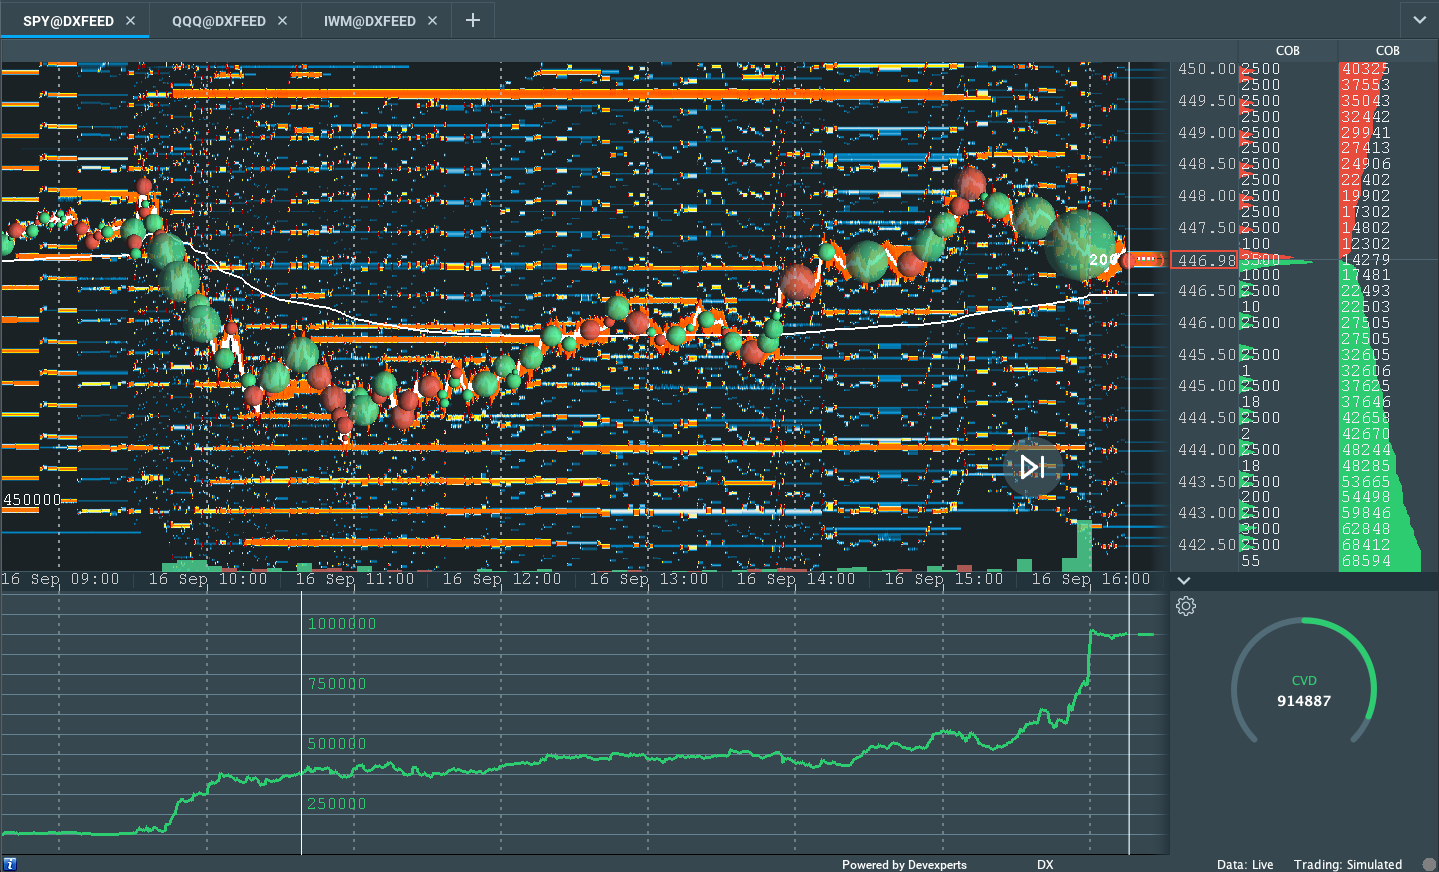
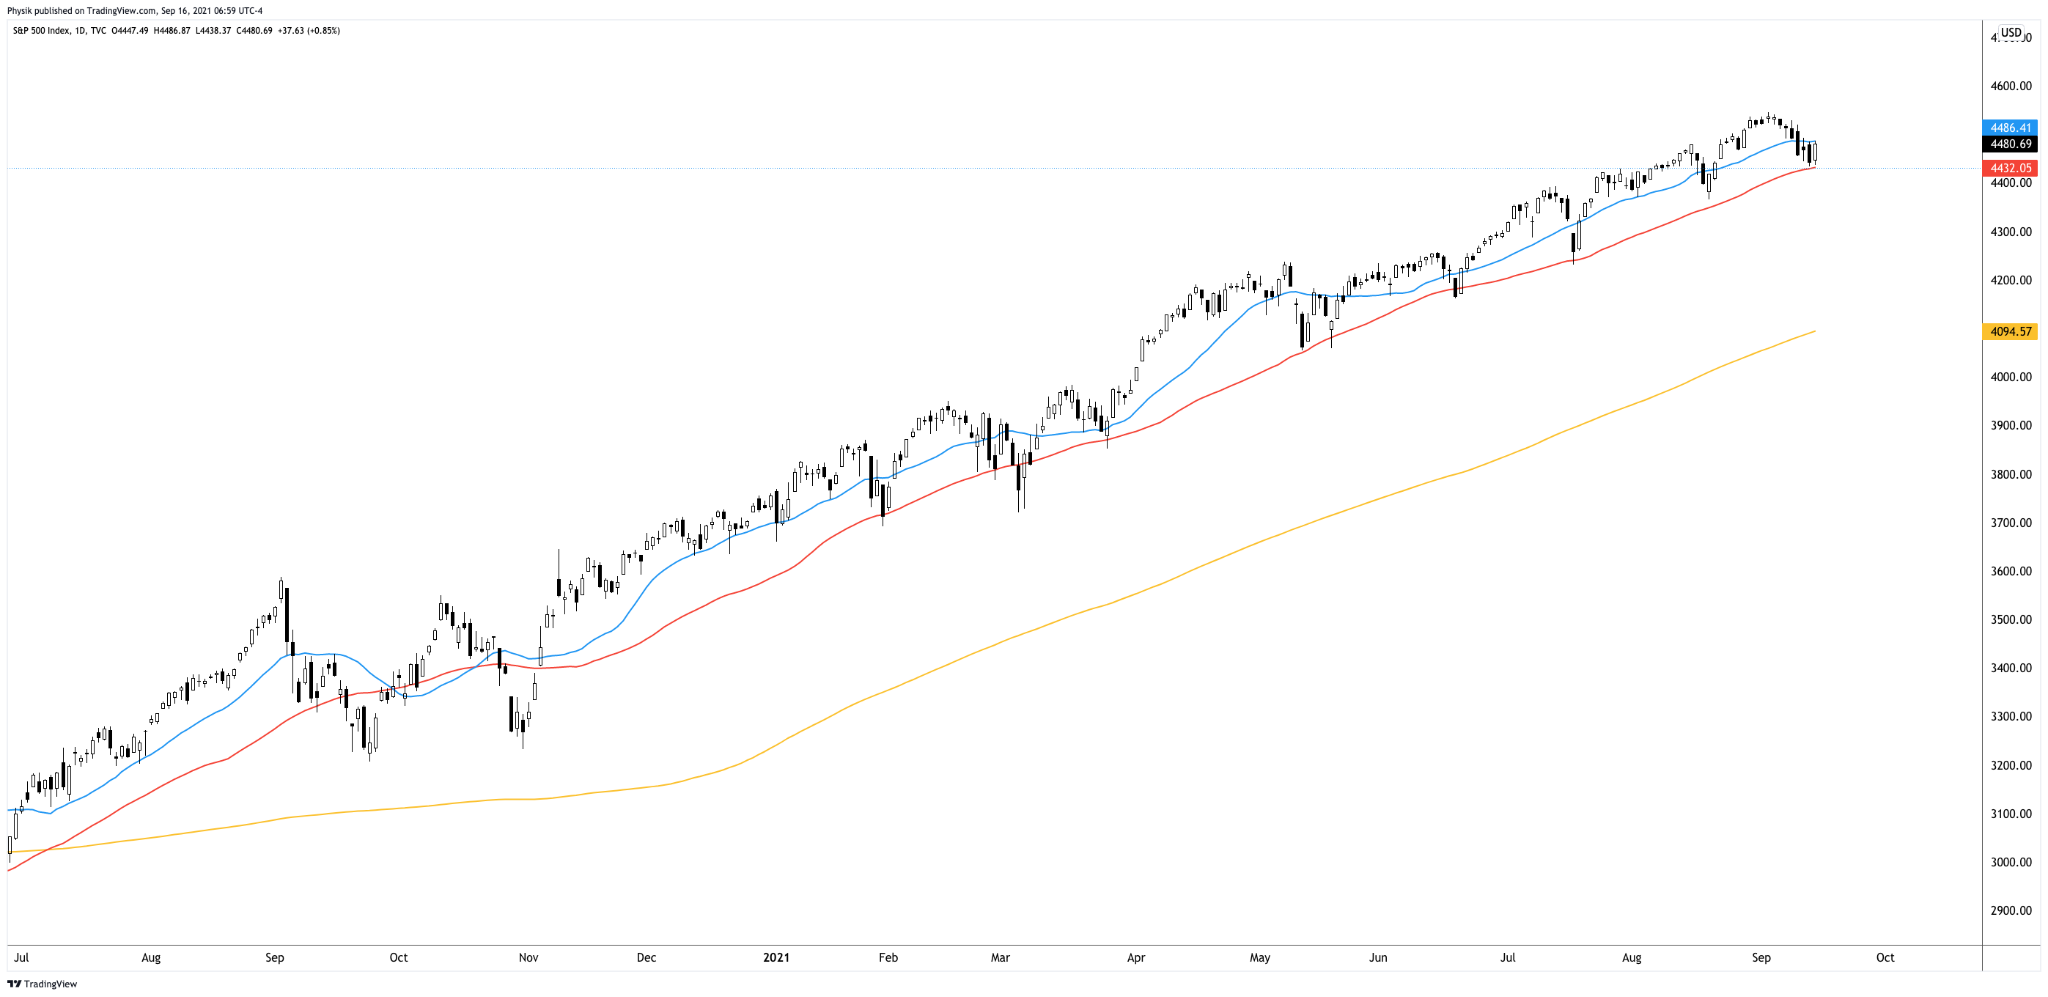
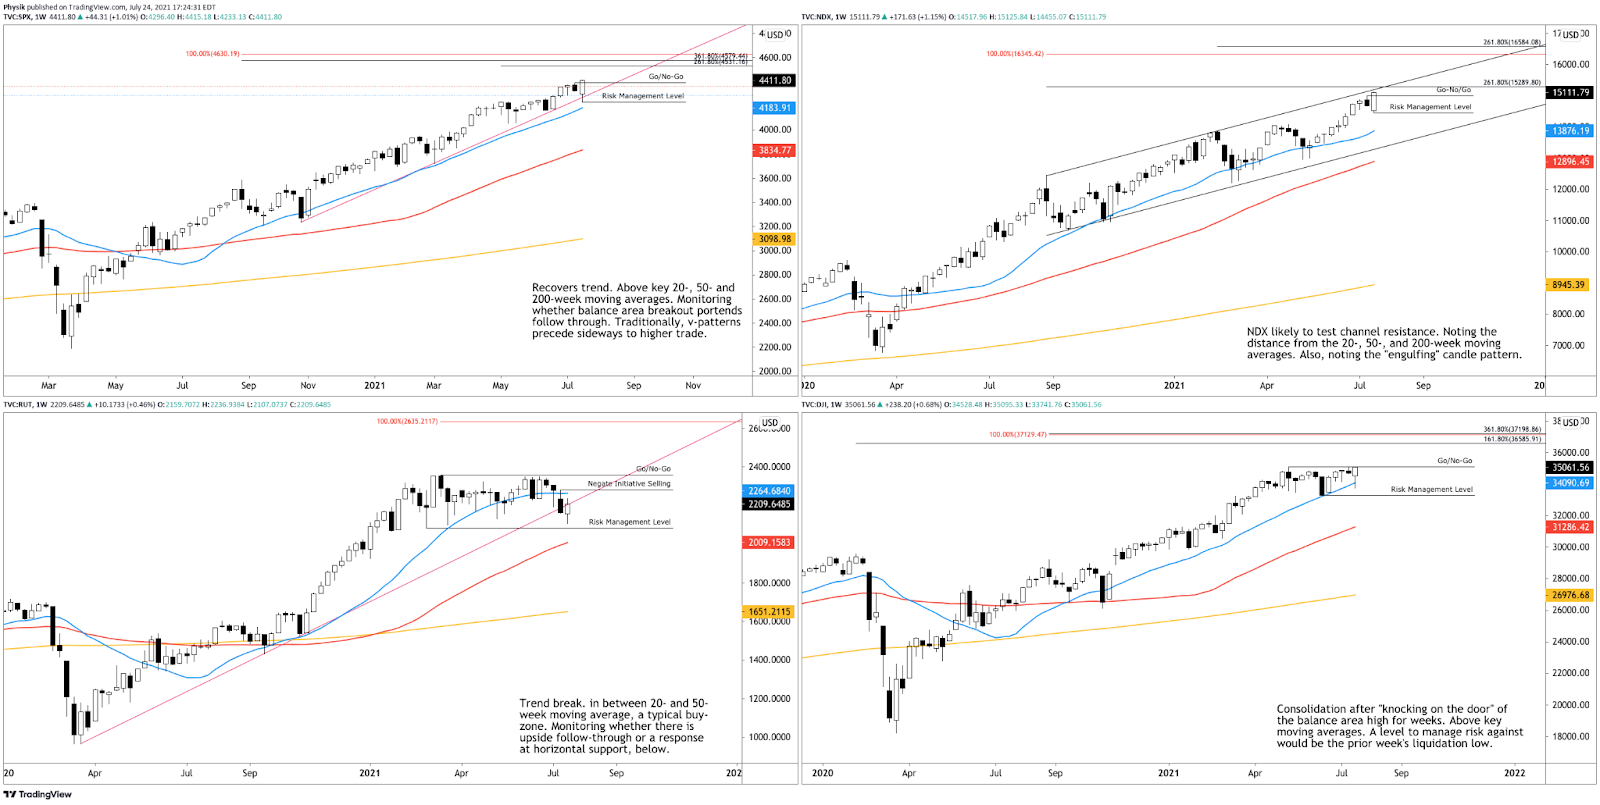
We’re carrying forward the presence of minimal excess at Wednesday’s regular trade low (RTH Low), after a test of a point of control (POC) and 50-day simple moving average (i.e., two visual levels likely paid attention to by short-term, technically-driven market participants who generally are unable to defend retests).
Balance-Break Scenarios Potentially In Play: A change in the market (i.e., the transition from two-time frame trade, or balance, to one-time frame trade, or trend) may occur.

Monitor for acceptance (i.e., more than 1-hour of trade) outside of the balance area. Rejection (i.e., return inside of balance) portends a move to the opposite end of the balance.
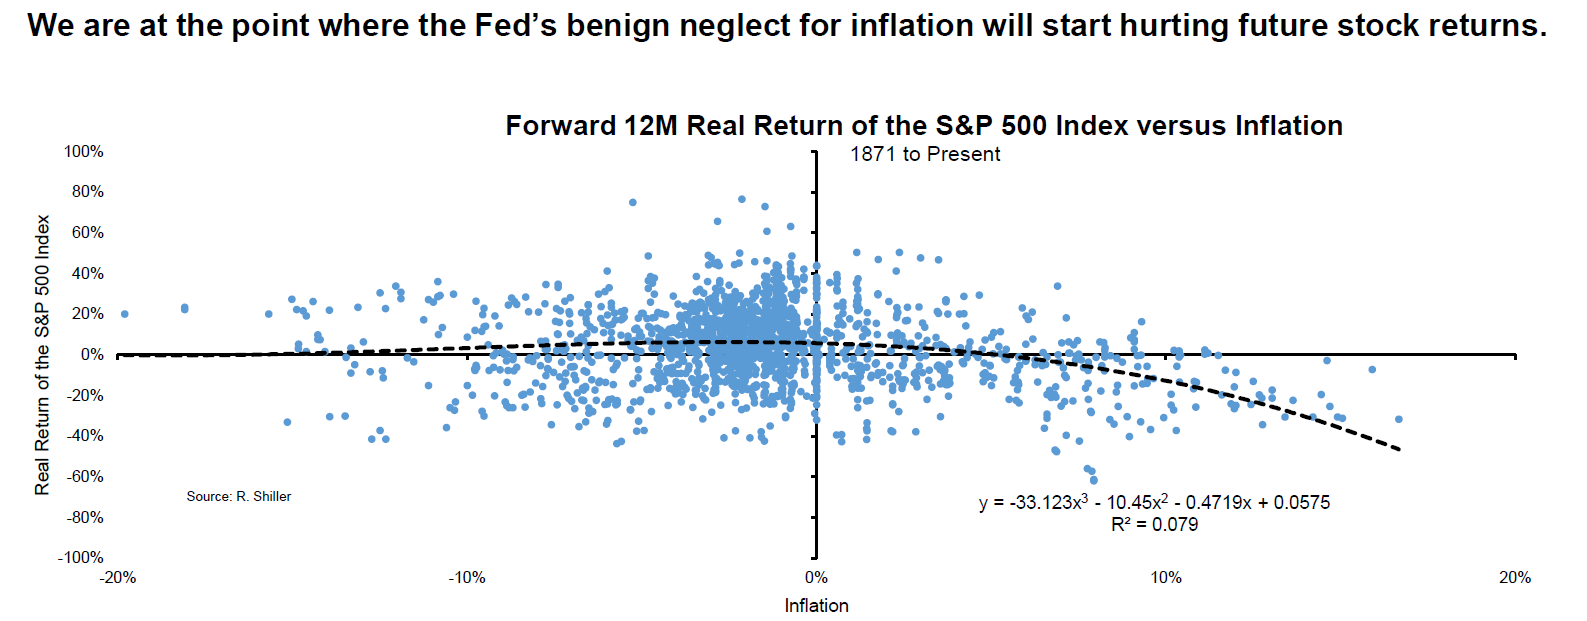
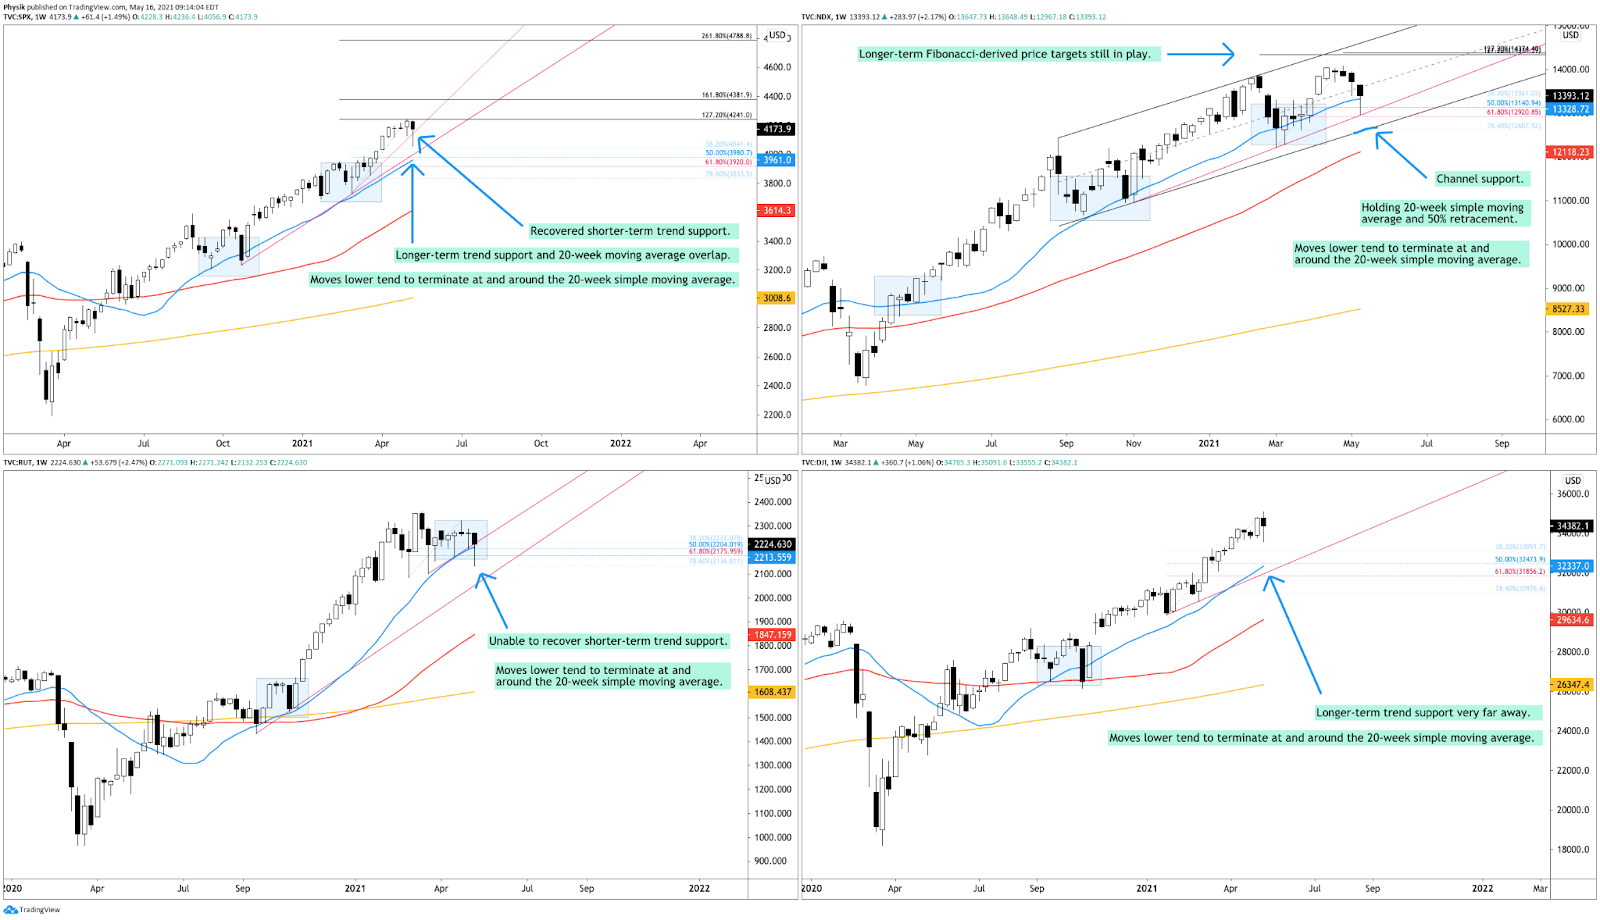
Further, the aforementioned trade is happening in the context of peak growth and a moderation in the economic recovery, heightened valuations, the prospects of stimulus reduction, as well as non-seasonally aligned flows, impactful options market dynamics, divergent sentiment, and fears of a mid-cycle transition.
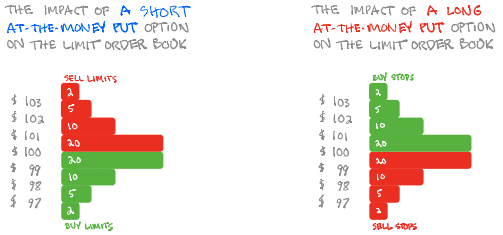
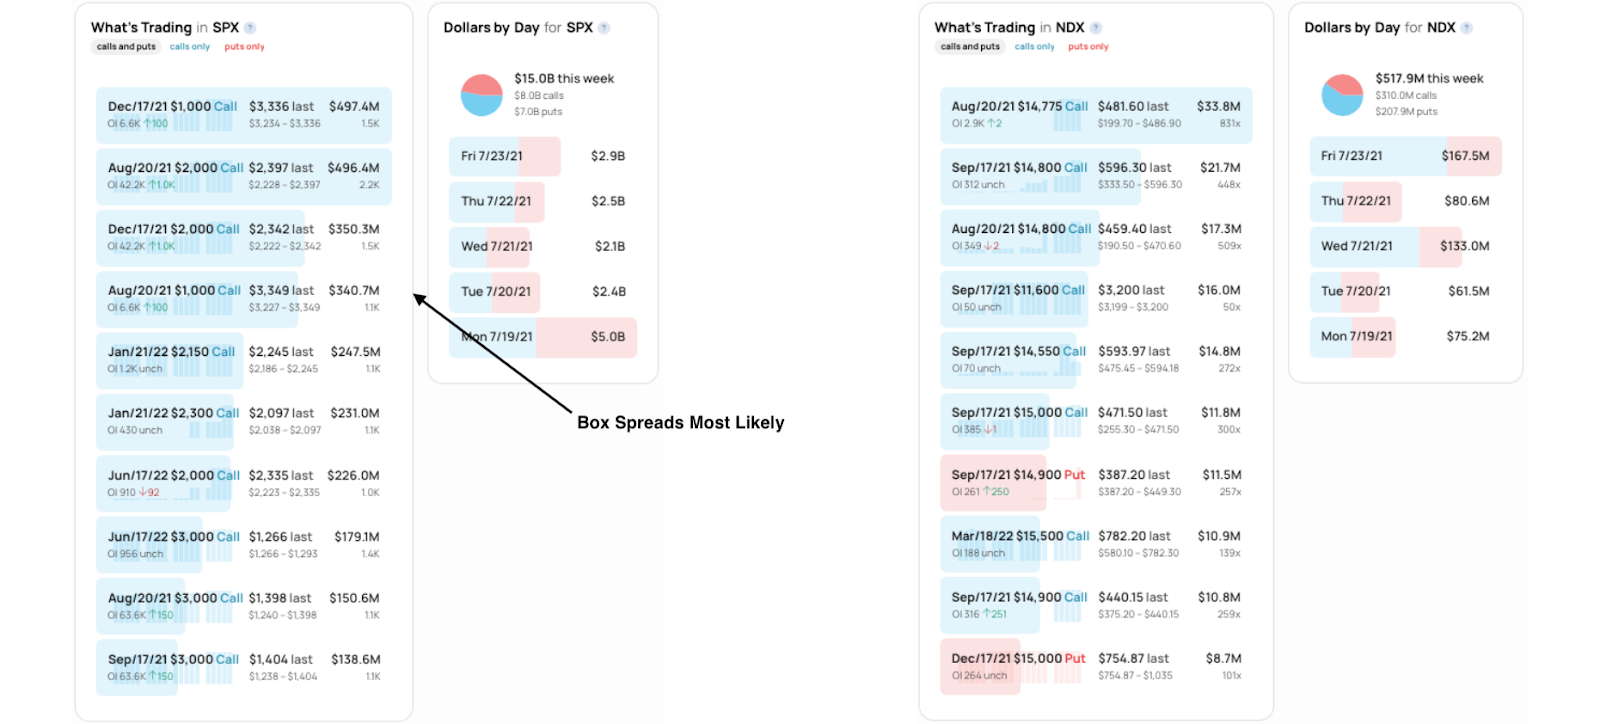
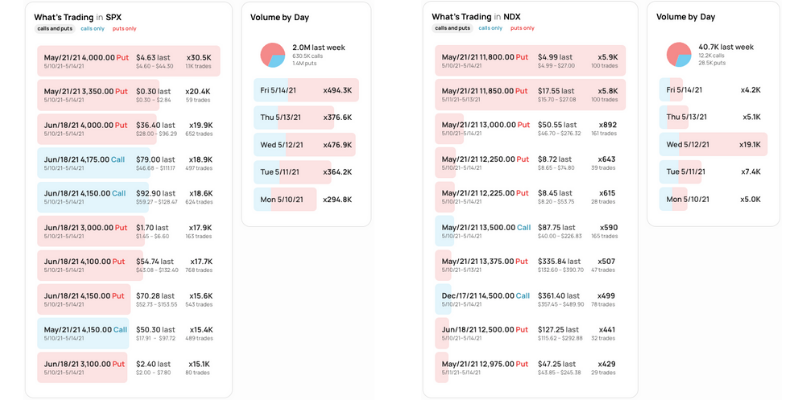
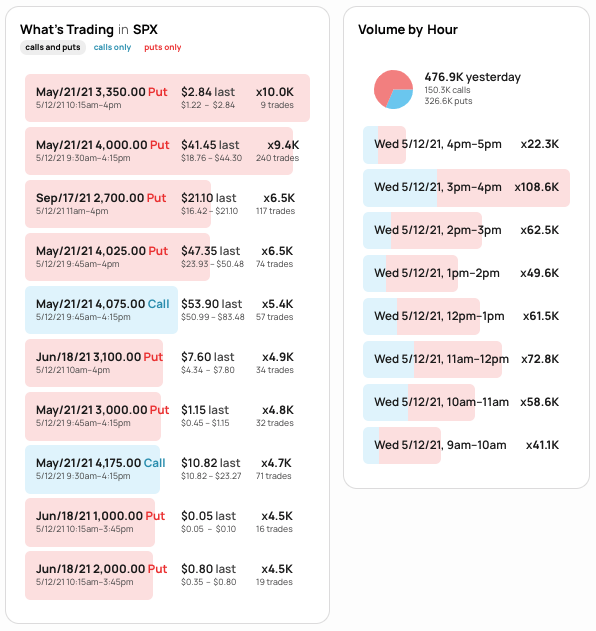
According to SqueezeMetrics, coming into Thursday’s session, the steepness of the GammaVol (GXV) curve suggested there was no more risk to the upside than there was to the downside; “SPX upside needs a bunch of bought puts to throw on the bonfire. It would be bullish for SPX to have people buying SPX puts,” and that hasn’t happened yet.
Thereafter, the index crept back into range, past $4,450.00, before responding higher, into the close ahead of quadruple witching, during which SpotGamma believes participants are likely to “see a big chunk of SPX options expire on the open, and the balance of index/etf/stocks expire on the close. This should lead to a decent amount of volatility Friday and Monday ahead of the FOMC.”
Moreover, for today, given an increased potential for heightened volatility, participants may make use of the following frameworks.
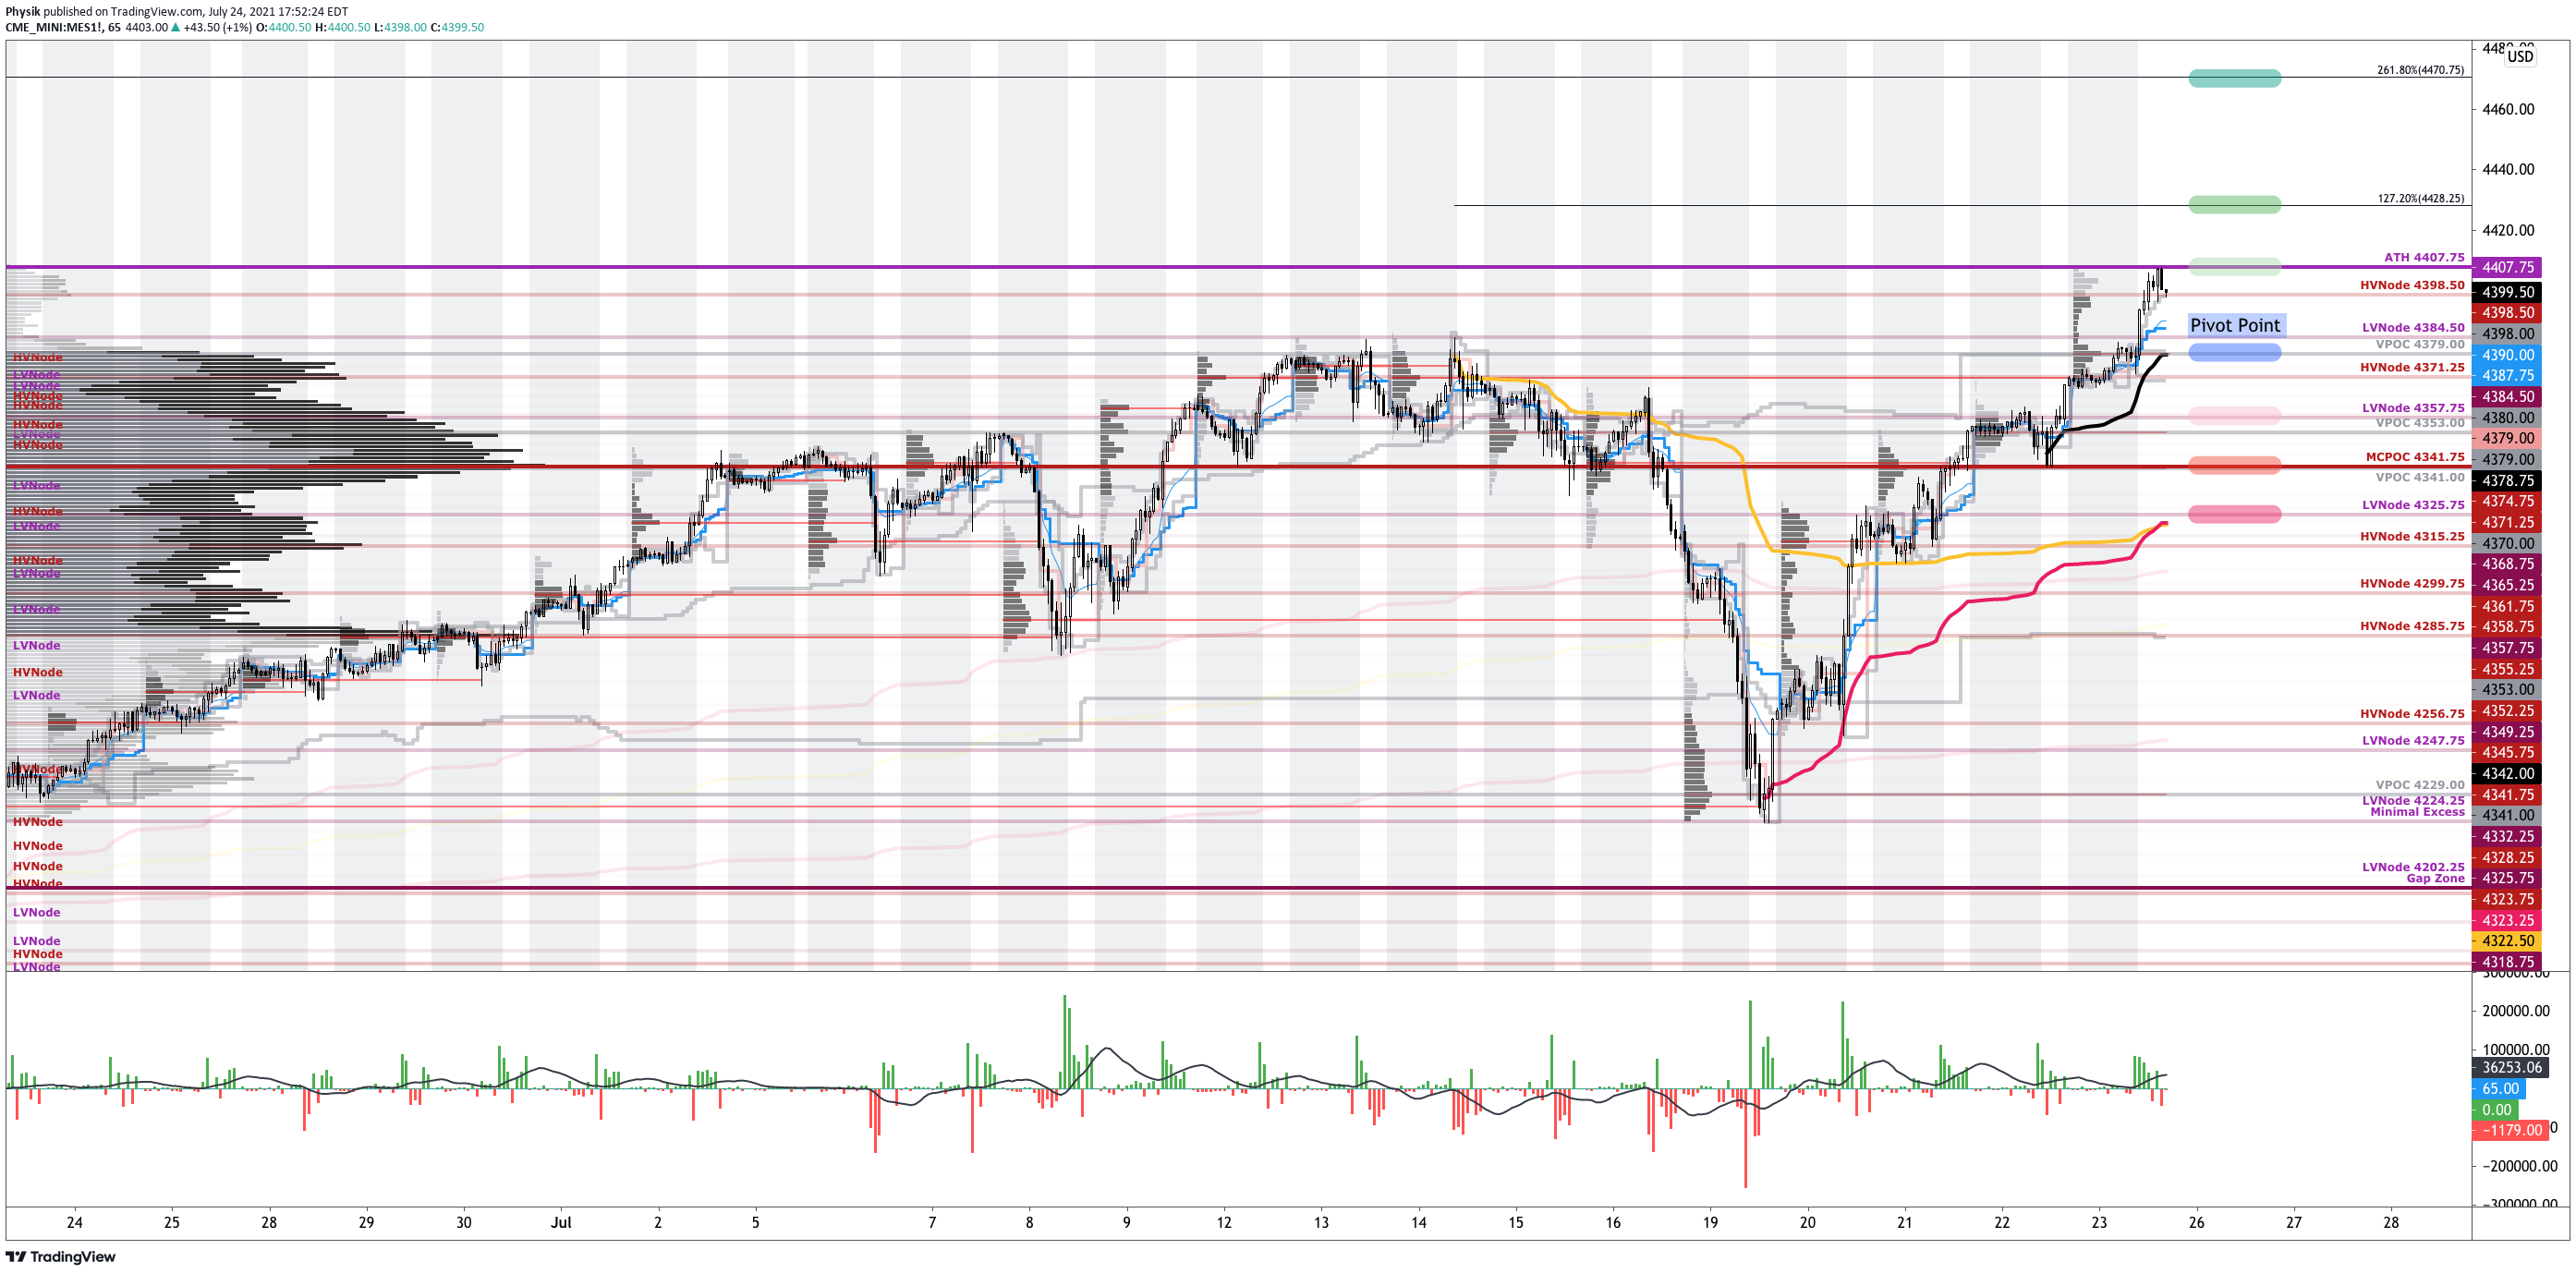
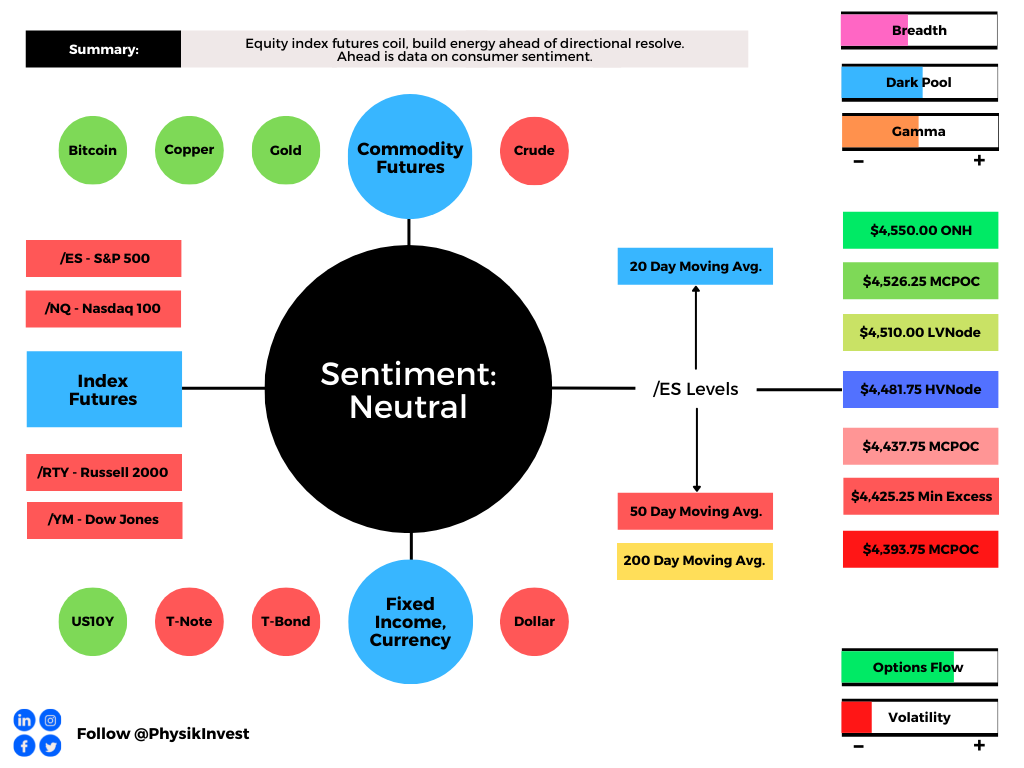
In the best case, the S&P 500 trades sideways or higher; activity above the $4,481.75 high volume area (HVNode) puts in play the $4,510.00 low volume area (LVNode). Initiative trade beyond the LVNode could reach as high as the $4,526.25 HVNode and $4,550.00 overnight high (ONH).
In the worst case, the S&P 500 trades lower; activity below the $4,481.75 HVNode puts in play the $4,437.75 MCPOC. Initiative trade beyond the MCPOC could reach as low as the $4,425.25 minimal excess low and $4,393.75, another micro-composite point of control (MCPOC).
Overnight Rally Highs (Lows): Typically, there is a low historical probability associated with overnight rally-highs (lows) ending the upside (downside) discovery process.

Volume Areas: A structurally sound market will build on past areas of high volume. Should the market trend for long periods of time, it will lack sound structure (identified as a low volume area which denotes directional conviction and ought to offer support on any test).

If participants were to auction and find acceptance into areas of prior low volume, then future discovery ought to be volatile and quick as participants look to areas of high volume for favorable entry or exit.

Excess: A proper end to price discovery; the market travels too far while advertising prices. Responsive, other-timeframe (OTF) participants aggressively enter the market, leaving tails or gaps which denote unfair prices.

News And Analysis
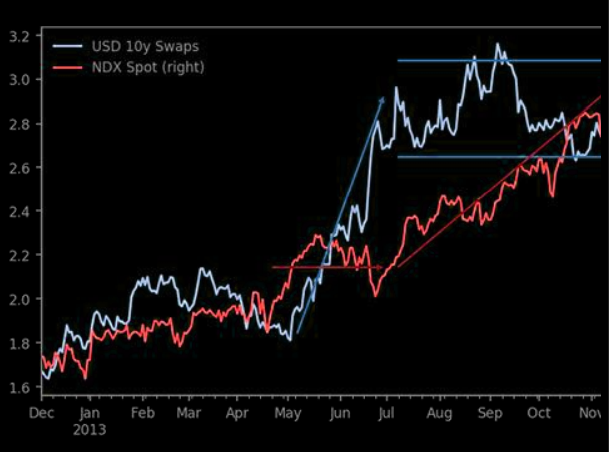
Fed seen announcing bond taper in November, rate liftoff in 2023.
Invesco could merge with a State Street asset-management unit.
Food and Drug Administration weighing COVID-19 booster shots.
S&P analysis on Canada growth prospects in the coming decade.
Rising transportation expenses are companies’ big inflation hurdle.
Wall Street influencers are making $500,000, above even bankers.
GM plans to idle factories longer amid problematic chip shortages.
What People Are Saying
About
After years of self-education, strategy development, and trial-and-error, Renato Leonard Capelj began trading full-time and founded Physik Invest to detail his methods, research, and performance in the markets.
Additionally, Capelj is a finance and technology reporter. Some of his biggest works include interviews with leaders such as John Chambers, founder and CEO, JC2 Ventures, Kevin O’Leary, businessman and Shark Tank host, Catherine Wood, CEO and CIO, ARK Invest, among others.
Disclaimer
At this time, Physik Invest does not manage outside capital and is not licensed. In no way should the materials herein be construed as advice. Derivatives carry a substantial risk of loss. All content is for informational purposes only.