Categories
Commentary

Daily Brief For October 8, 2021

Market Commentary

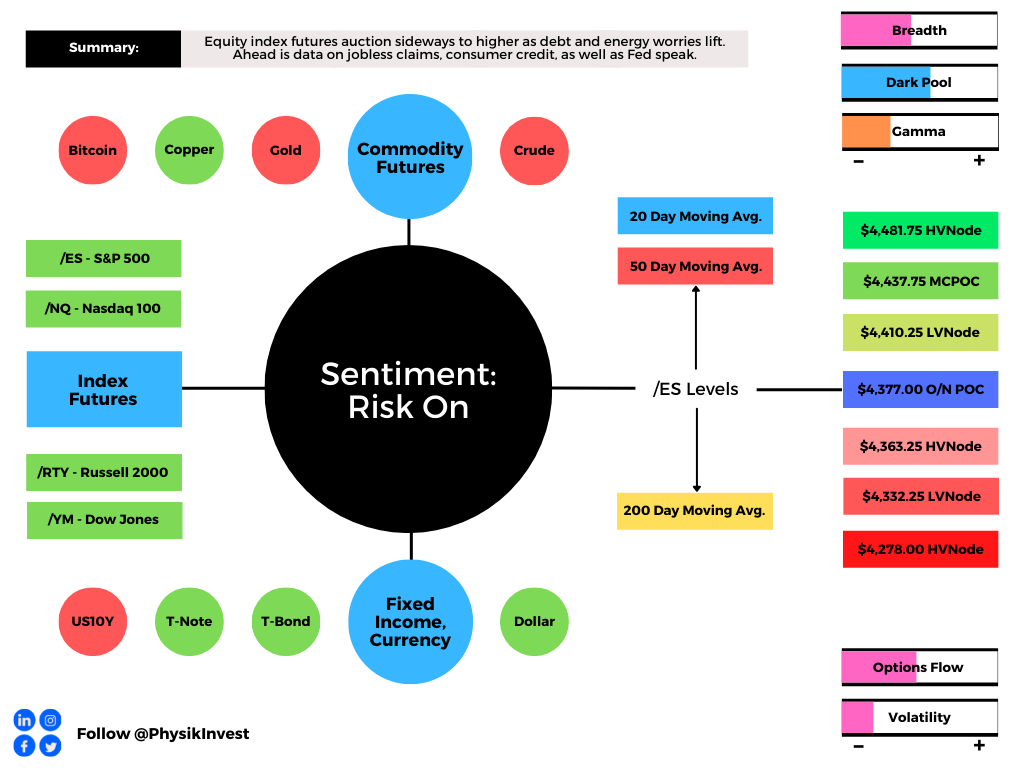
Equity index futures sideways overnight. Volatility ebbs.

  • Senate passed debt-ceiling raise.
  • Ahead: NFP, unemployment data.
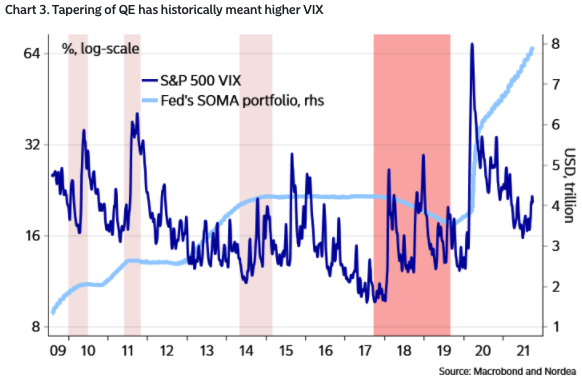
  • Clarity regarding tapering by Fed.
  • Responsive selling into RTH high.

What Happened: U.S. stock index futures auctioned sideways overnight alongside news that the Senate passed a short-term debt ceiling increase. 

Ahead is data on nonfarm payrolls, the unemployment rate, and average hourly earnings (8:30 AM ET), as well as wholesale inventories (10:00 AM ET).

Graphic updated 6:40 AM ET. Sentiment Neutral if expected /ES open is inside of the prior day’s range. /ES levels are derived from the profile graphic at the bottom of the following section. SqueezeMetrics Dark Pool Index (DIX) and Gamma (GEX) calculations are based on where the prior day’s reading falls with respect to the MAX and MIN of all occurrences available. A higher DIX is bullish. At the same time, the lower the GEX, the more (expected) volatility. SHIFT data used for S&P 500 (INDEX: SPX) options activity. Note that options flow is sorted by the call premium spent; if more positive then more was spent on call options. Breadth reflects a reading of the prior day’s NYSE Advance/Decline indicator. VIX reflects a current reading of the CBOE Volatility Index (INDEX: VIX) from 0-100.

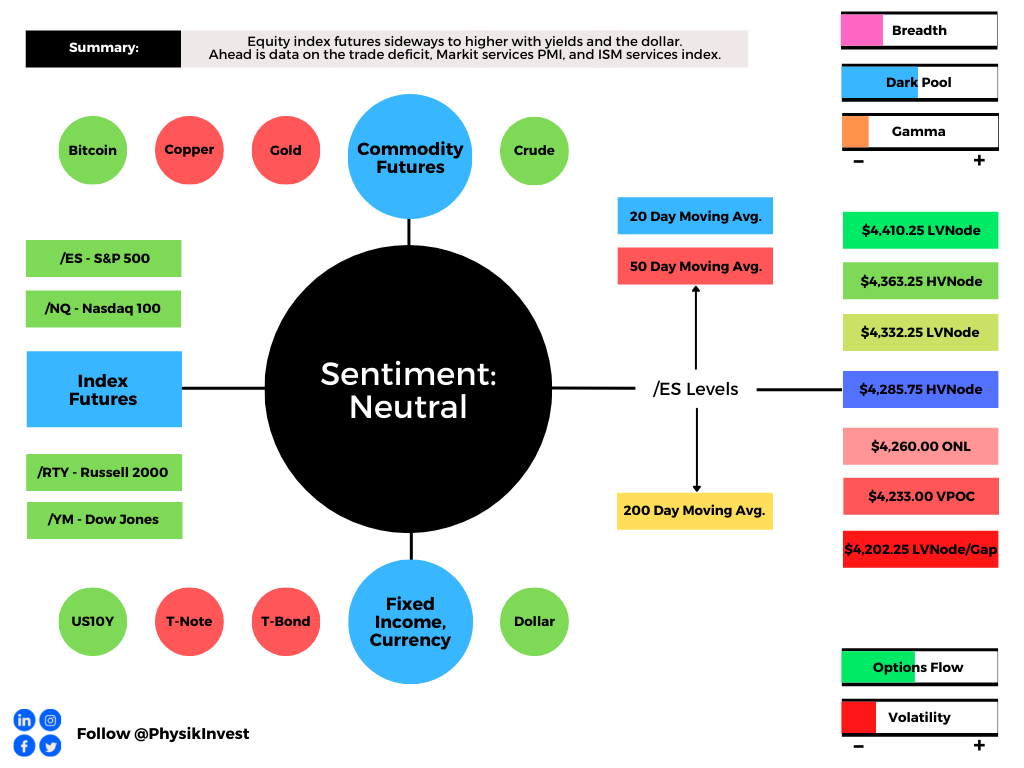
What To Expect: As of 6:40 AM ET, Friday’s regular session (9:30 AM – 4:00 PM EST) in the S&P 500 may open inside of prior-range and -value, suggesting a limited potential for immediate directional opportunity.

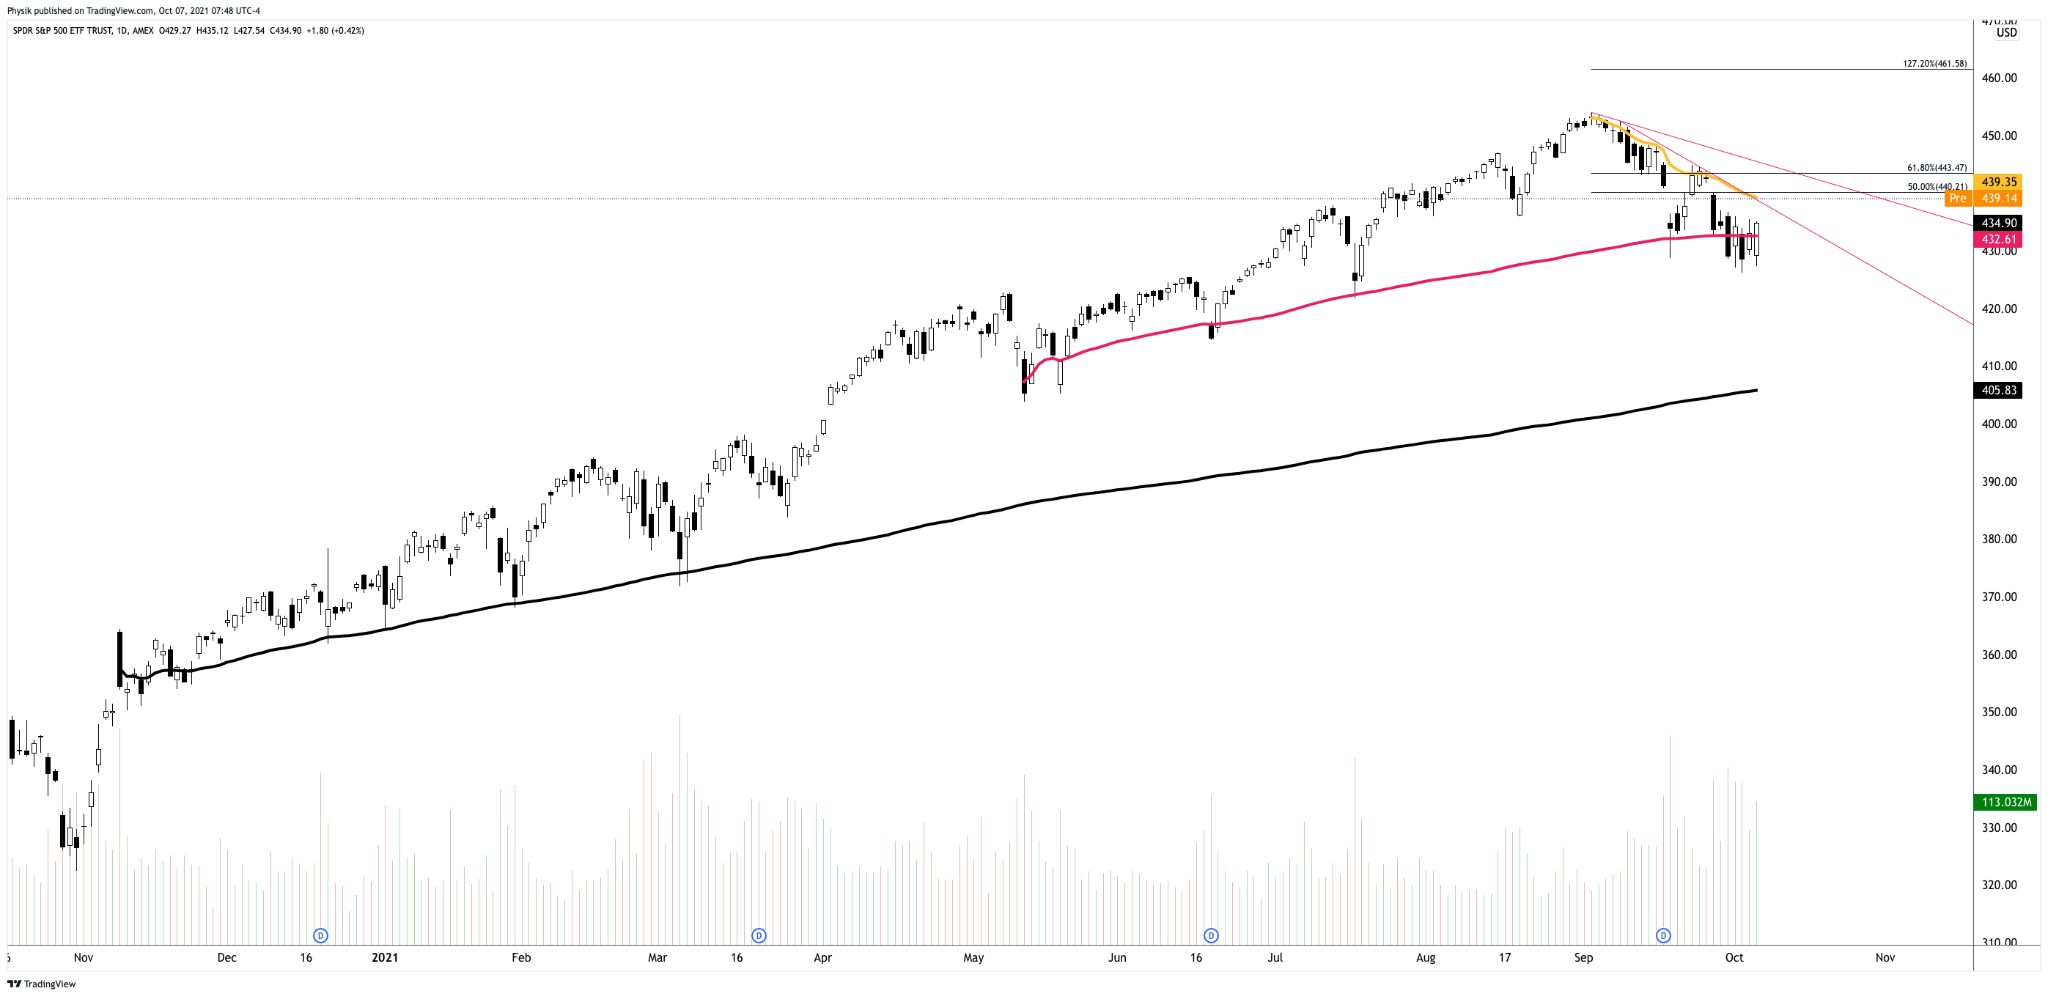
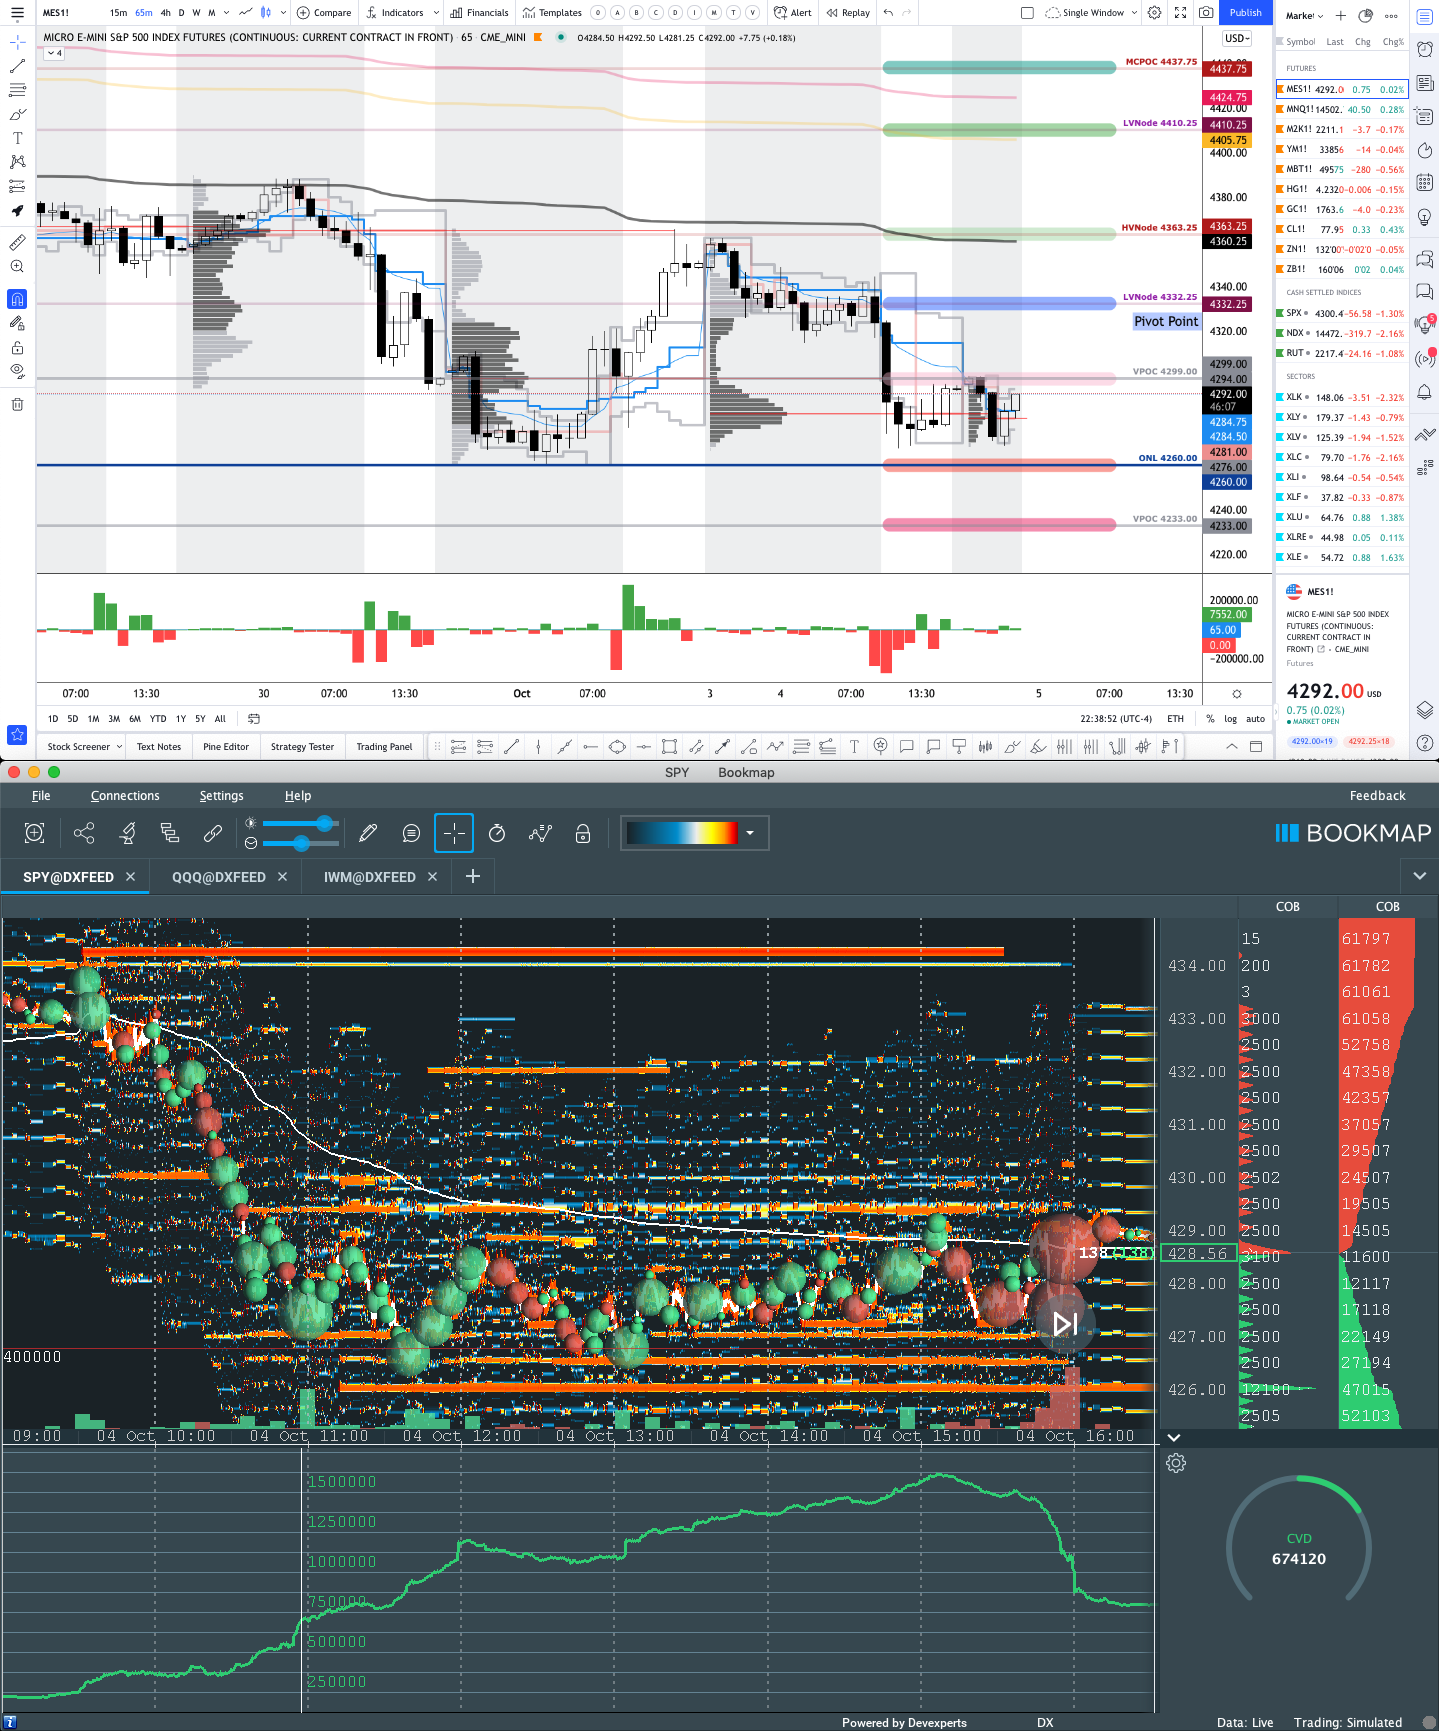
During the prior day’s regular trade, on strong intraday breadth and divergent market liquidity metrics, the best case outcome occurred, evidenced by the expansion of range and value above the $4,410.25 low volume area (LVNode), between two key anchored-volume weighted average price (AVWAP) levels.

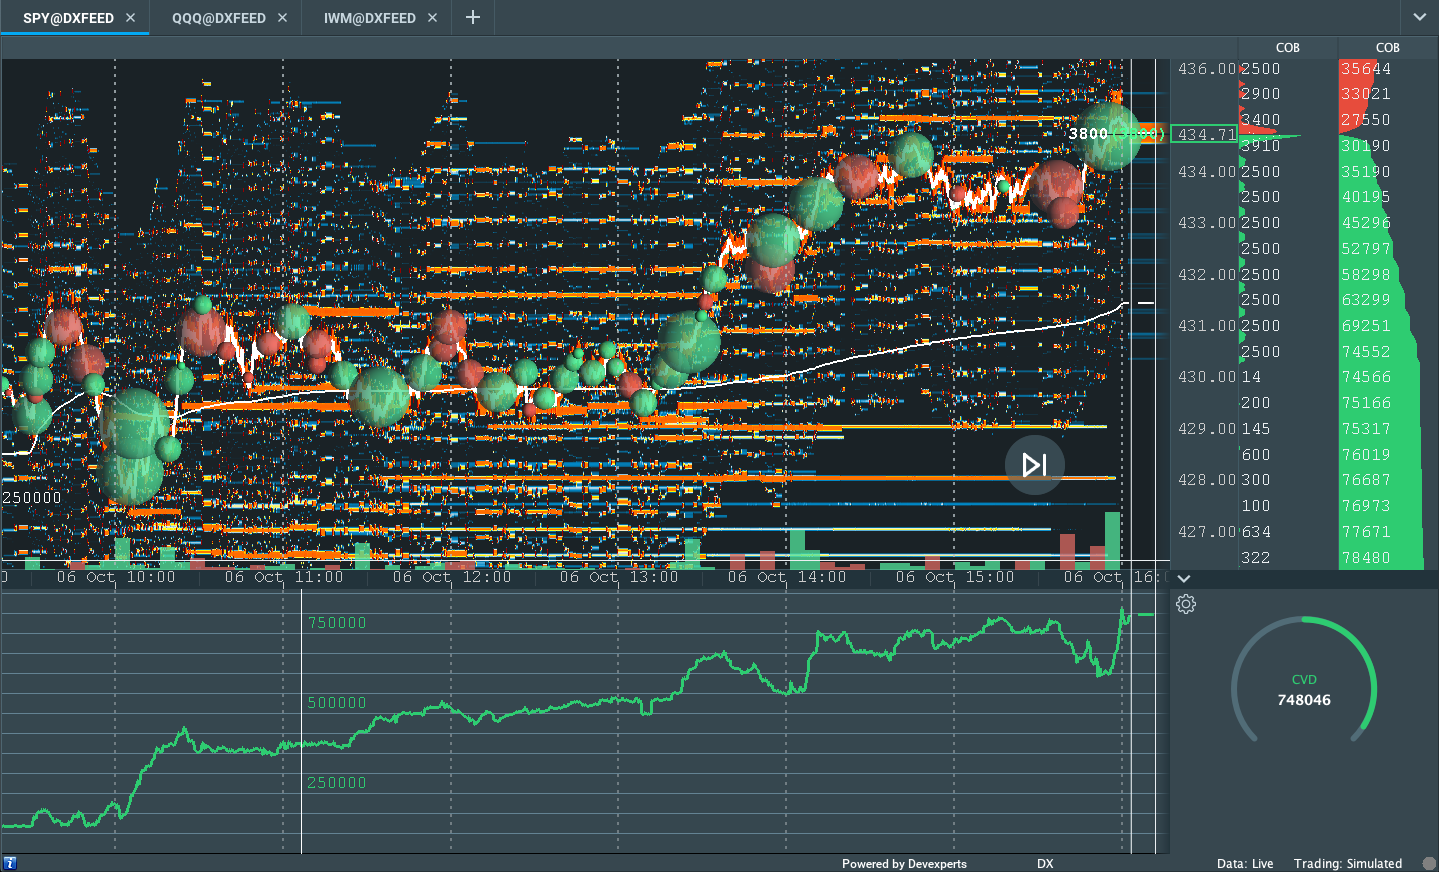
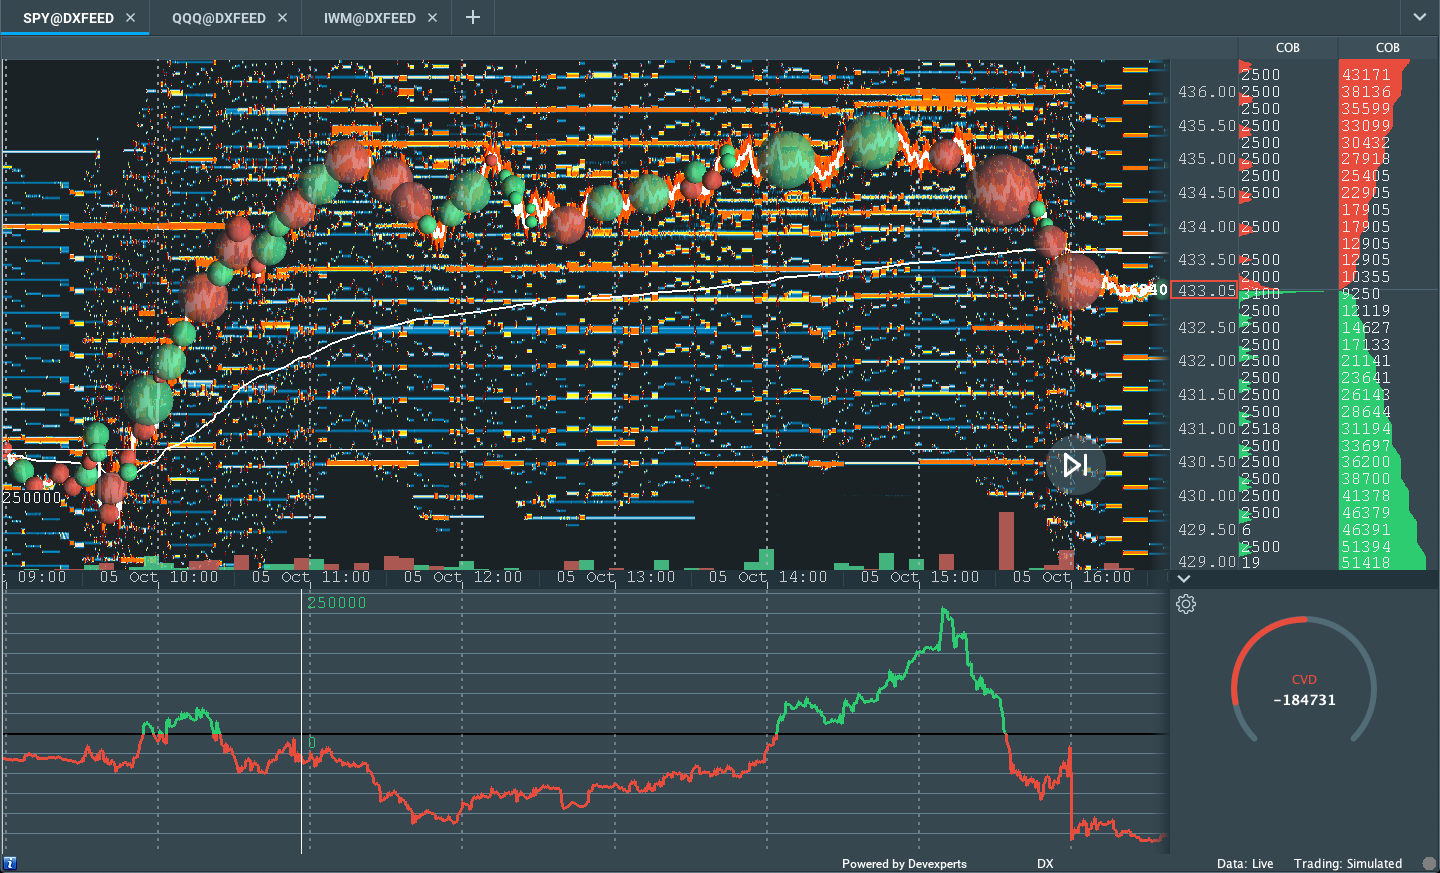
Into the price rise, however, we note that participants sold responsively (i.e., sold in response to prices printing above an area of recent acceptance or balance); as prices came into the resting liquidity (Graphic 2) – also the location of a key AVWAP in – at and around /ES $4,410.25 (SPY $441.00), buying and selling power as calculated by the difference in volume traded at the bid and offer diverged, markedly.

In other words, at the AVWAP – a metric highly regarded by chief investment officers, among other participants, for quality of trade – there were liquidity algorithms programmed to sell.

Why? Liquidity algorithms are benchmarked and programmed to buy and sell around VWAPs.
Graphic 1: SPDR S&P 500 ETF Trust (NYSE: SPY), one of the largest ETFs that track the S&P 500 index, encounters responsive selling at key volume-weighted average price levels. 
Graphic 2: Divergent delta (i.e., non-committed buying as measured by volume delta or buying and selling power as calculated by the difference in volume traded at the bid and offer) in SPDR S&P 500 ETF Trust (NYSE: SPY), one of the largest ETFs that track the S&P 500 index, via Bookmap. The readings are supportive of responsive trade or balance (i.e., rotational trade that suggests current prices offer favorable entry and exit).

This trade is significant because it suggests a willingness to slow price discovery and balance (i.e., trade sideways as participants look to establish an equilibrium in light of new information). 

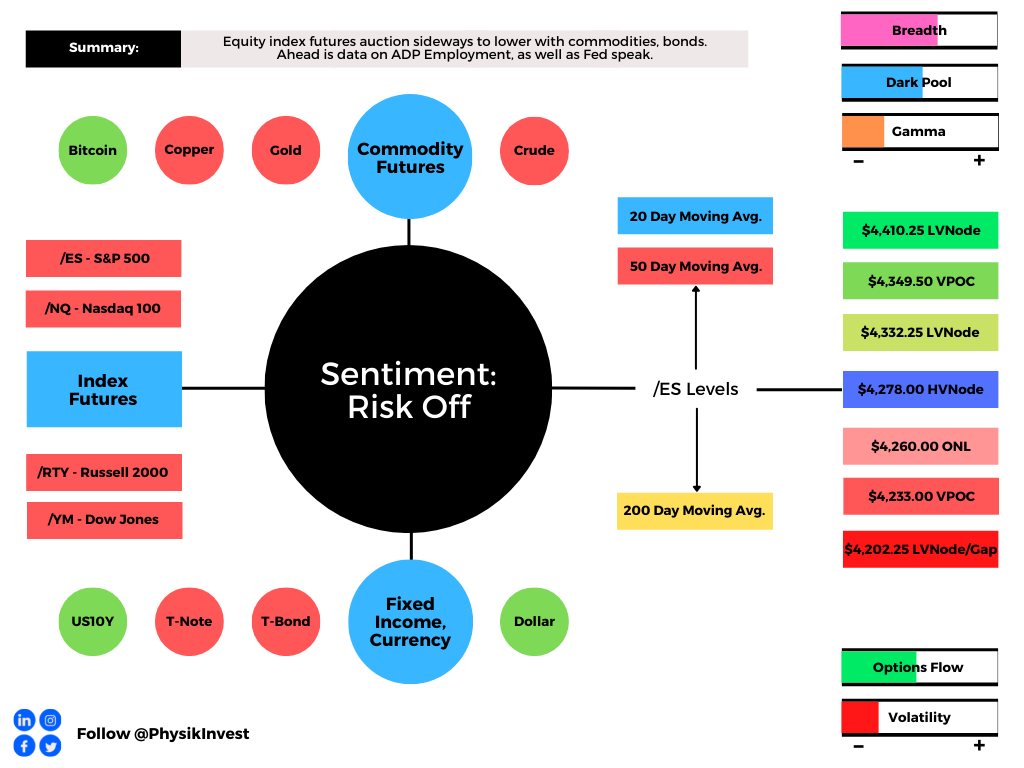
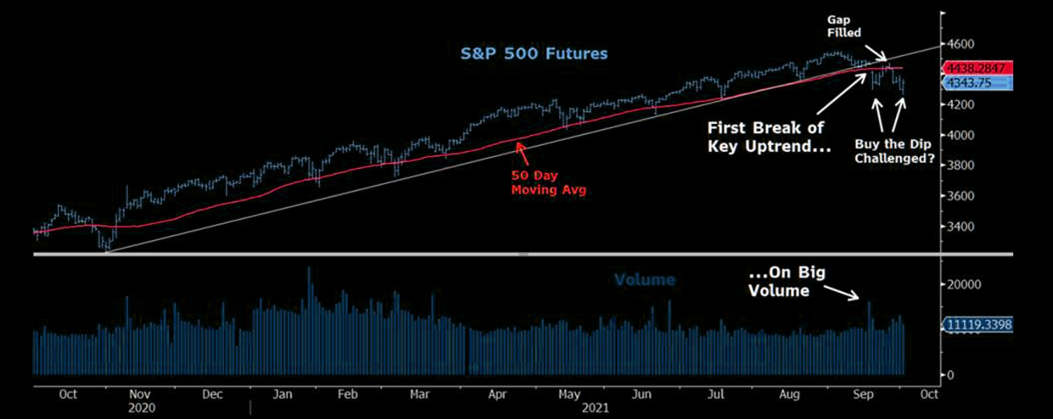
We’re carrying forward the presence of a p-shaped emotional, multiple-distribution profile structure (i.e., old-money shorts covering) left behind prior initiative trade, as well as continued trade below the 20- and 50-day simple moving averages; these dynamics induce anxiety and stress for the technical-driven, weaker-handed buy-the-dip crowd.

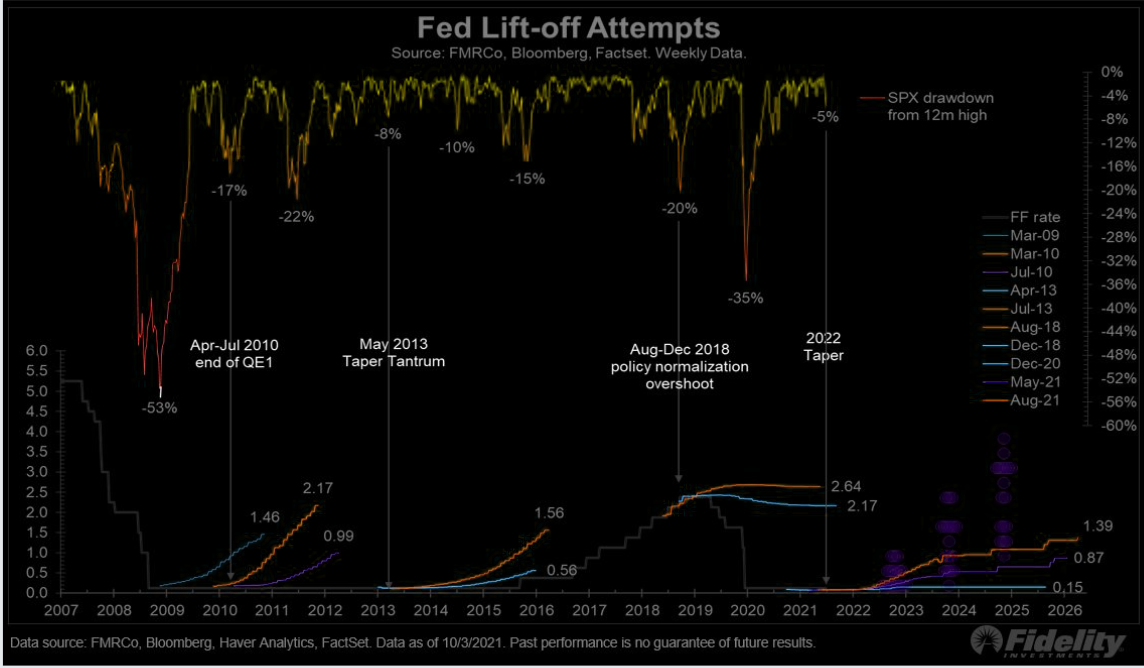
Further, the aforementioned trade is happening as investors await key employment data that will provide context on what the Federal Reserve with respect to monetary policy.

According to Bloomberg, Friday’s payroll data – which is likely to indicate strong improvement – likely emboldens tapering initiatives and improves the prospects of a rise in the Fed funds rate.

“What we see in the equity space is a lot of sensitivity to higher real yields,” Joseph Little, chief global strategist at HSBC Asset Management, said. “We are seeing policy normalization everywhere. That creates a little bit of a challenge for equity market because it does change the drivers of equity performance.”

Graphic 3: A “gentle reminder of the fact tapering matters,” via The Market Ear.

Adding, earlier this week, we noted that indices were best positioned for a vicious rebound as near-term downside discovery metrics likely reached a limit. These dynamics remain.

Graphic: ​​On October 5, 2021, according to SqueezeMetrics, “Net Put Delta (NPD) and the customer Vanna-Gamma Ratio (VGR) [] settled in a *bullish* place. Risk to the upside.”

Moreover, for today, participants may make use of the following frameworks.

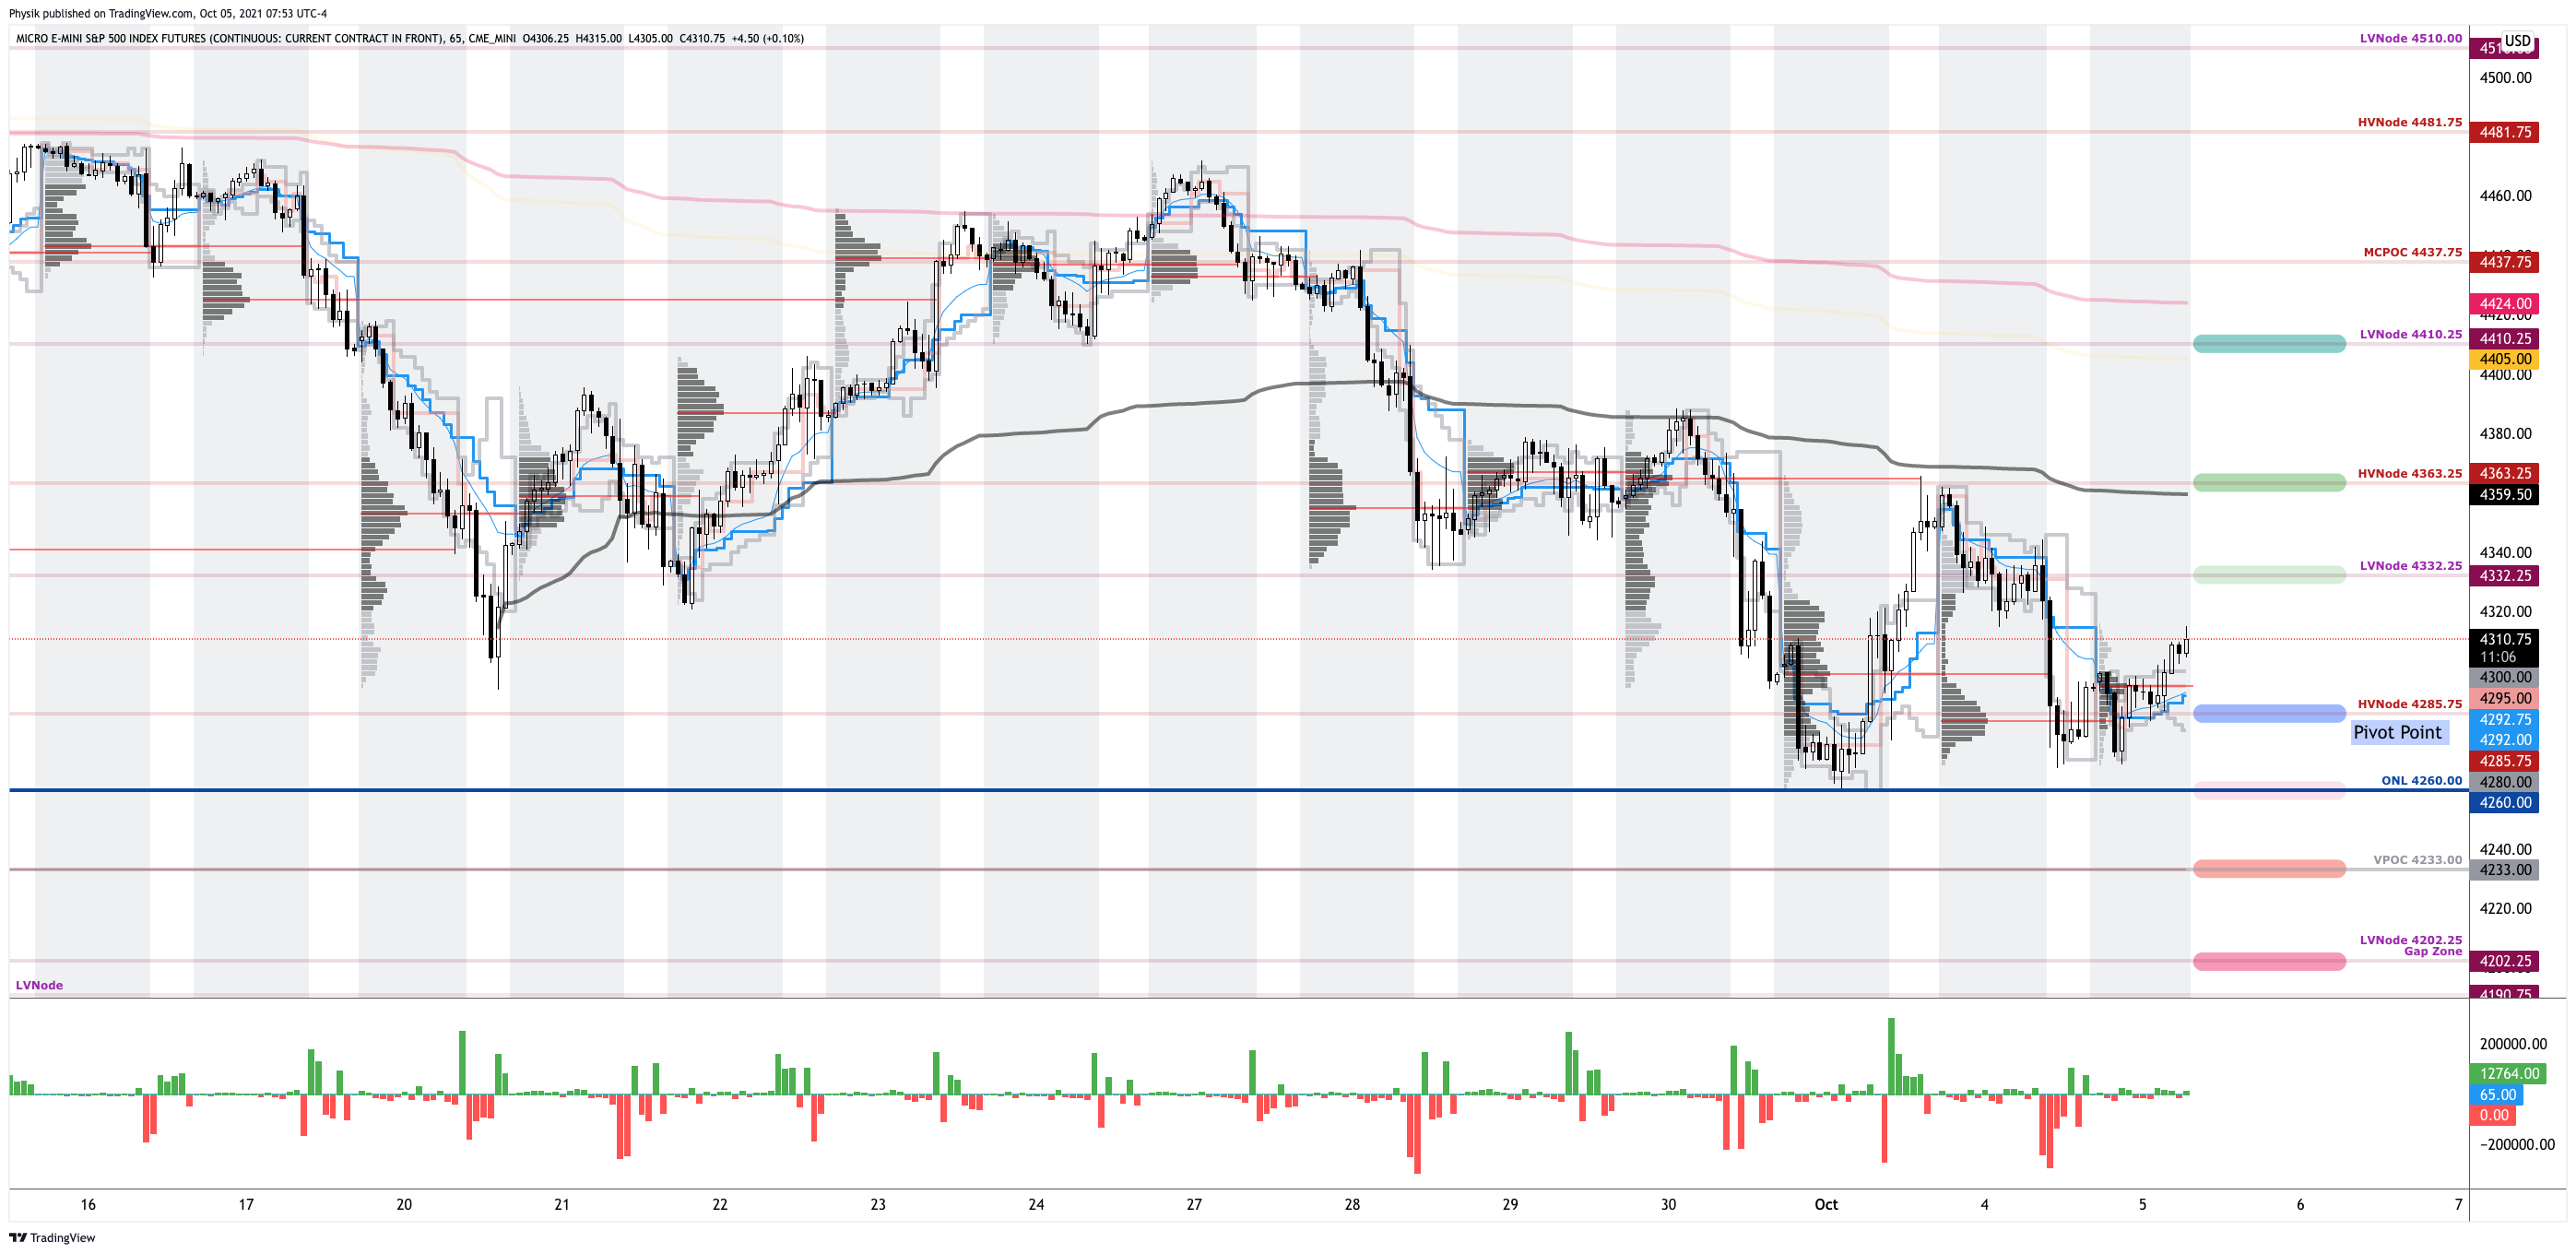
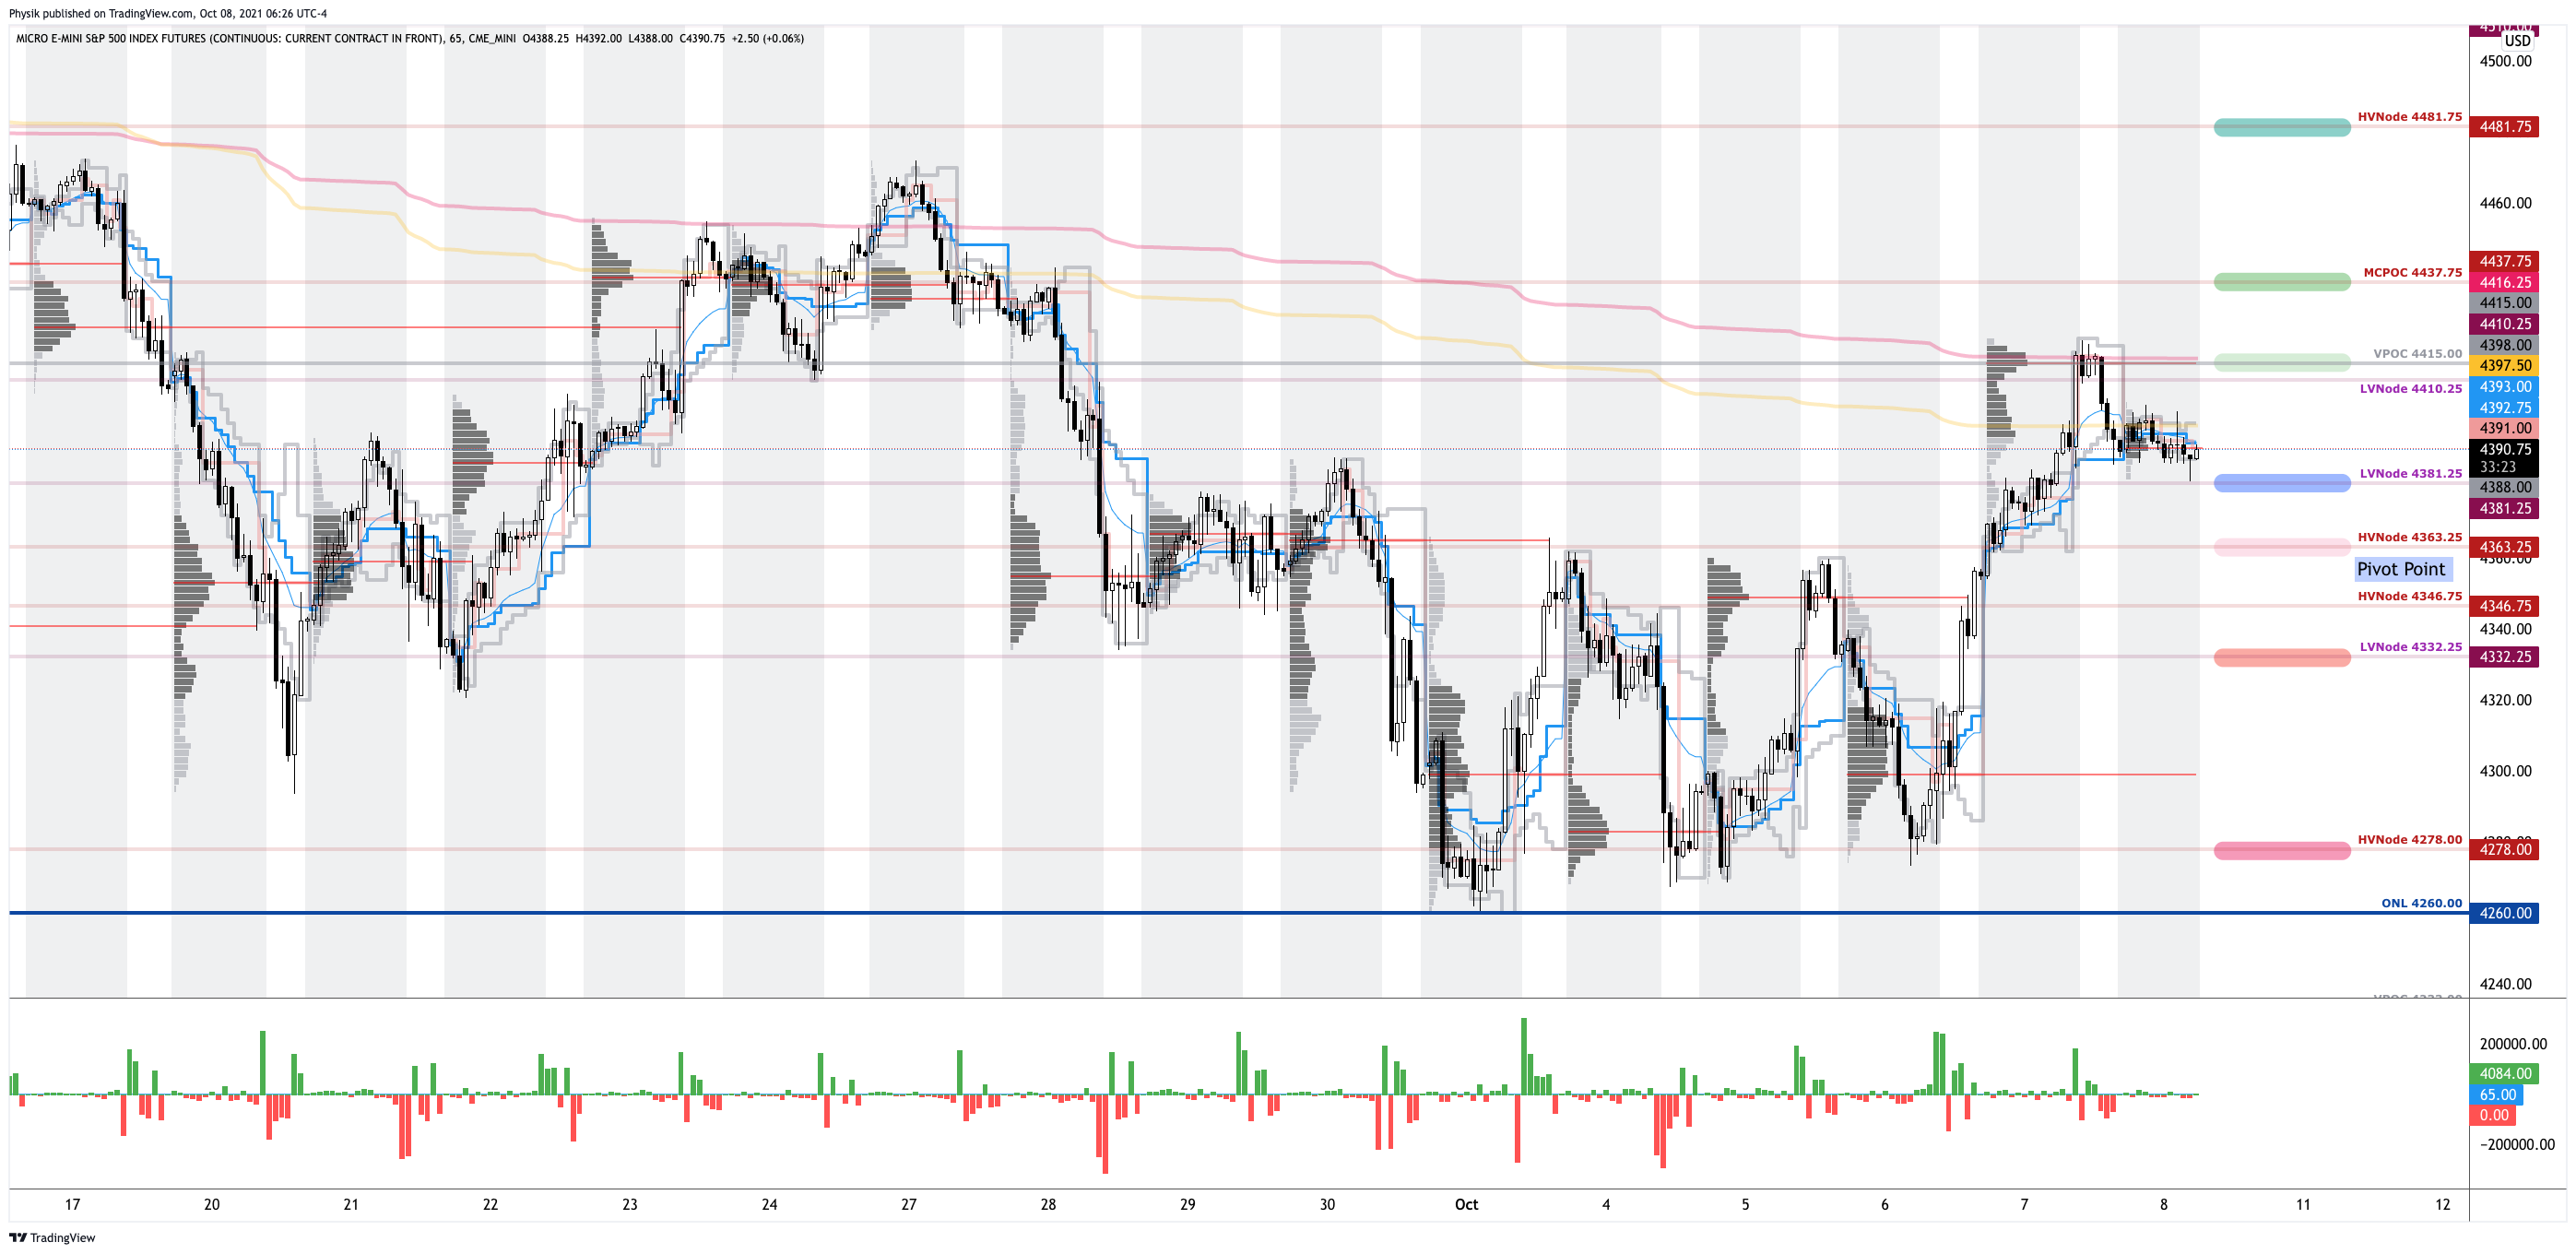
In the best case, the S&P 500 trades sideways or higher; activity above the $4,381.25 low volume area (LVNode) puts in play the $4,415.00 untested point of control (VPOC). Initiative trade beyond the VPOC could reach as high as the $4,437.75 micro-composite point of control (MCPOC) and $4,481.75 high volume area (HVNode), or higher.

In the worst case, the S&P 500 trades lower; activity below the $4,381.25 LVNode puts in play the $4,363.25 HVNode. Initiative trade beyond the HVNode could reach as low as the $4,332.25 LVNode and $4,278.00 HVNode, or lower.

Graphic: 65-minute profile chart of the Micro E-mini S&P 500 Futures updated 6:30 AM ET.

Definitions

Balance (Two-Timeframe Or Bracket): Rotational trade that denotes current prices offer favorable entry and exit. Balance-areas make it easy to spot a change in the market (i.e., the transition from two-time frame trade, or balance, to one-time frame trade, or trend). 

Modus operandi is responsive trade (i.e., fade the edges), rather than initiative trade (i.e., play the break).

MCPOCs: POCs are valuable as they denote areas where two-sided trade was most prevalent over numerous day sessions. Participants will respond to future tests of value as they offer favorable entry and exit.

More On Volume-Weighted Average Prices (VWAPs): A metric highly regarded by chief investment officers, among other participants, for quality of trade. Additionally, liquidity algorithms are benchmarked and programmed to buy and sell around VWAPs.

POCs: POCs are valuable as they denote areas where two-sided trade was most prevalent in a prior day session. Participants will respond to future tests of value as they offer favorable entry and exit.

Short Covering: The profile shape suggests participants were “too” short and had poor location.

Volume Areas: A structurally sound market will build on areas of high volume (HVNodes). Should the market trend for long periods of time, it will lack sound structure, identified as low volume areas (LVNodes). LVNodes denote directional conviction and ought to offer support on any test. 

If participants were to auction and find acceptance into areas of prior low volume (LVNodes), then future discovery ought to be volatile and quick as participants look to HVNodes for favorable entry or exit.

News And Analysis

Short-term increase in U.S. debt ceiling passes Senate.

U.S. special operations rotating into Taiwan for training.

Moody’s: Kicking [debt limits] not too far down the road.

Energy Transition: Demand destruction stalking Europe.

APAC CBDCs – pathways plenty, destination uncertain.

Vaccinations and policy decisions are key to EM growth.

Richest Americans flee Treasuries with holdings at lows.

Crypto Mystery: Where’s the $69B behind Tether’s coin.

What People Are Saying

About

After years of self-education, strategy development, and trial-and-error, Renato Leonard Capelj began trading full-time and founded Physik Invest to detail his methods, research, and performance in the markets. 

Additionally, Capelj is a finance and technology reporter. Some of his biggest works include interviews with leaders such as John Chambers, founder and CEO, JC2 Ventures, Kevin O’Leary, businessman and Shark Tank host, Catherine Wood, CEO and CIO, ARK Invest, among others.

Disclaimer

At this time, Physik Invest does not manage outside capital and is not licensed. In no way should the materials herein be construed as advice. Derivatives carry a substantial risk of loss. All content is for informational purposes only.

Categories
Commentary

Daily Brief For October 7, 2021

Market Commentary

Led by the Nasdaq 100, equity index futures were higher. Commodities and bonds were mixed.

  • Relief of worries over debt, energy.
  • Claims and credit data, Fed speak.
  • Positioning suggests risk to upside.

What Happened: U.S. stock index futures continued higher overnight alongside ease in angst over debt and energy worries.

Ahead is data on jobless claims (8:30 AM ET), Fed speak by John Williams (8:40 AM ET), Fed speak by Loretta Mester (11:45 AM ET), as well as consumer credit data (3:00 PM ET).

Graphic updated 6:20 AM ET. Sentiment Risk-On if expected /ES open is above the prior day’s range. /ES levels are derived from the profile graphic at the bottom of the following section. SqueezeMetrics Dark Pool Index (DIX) and Gamma (GEX) calculations are based on where the prior day’s reading falls with respect to the MAX and MIN of all occurrences available. A higher DIX is bullish. At the same time, the lower the GEX, the more (expected) volatility. SHIFT data used for S&P 500 (INDEX: SPX) options activity. Note that options flow is sorted by the call premium spent; if more positive then more was spent on call options. Breadth reflects a reading of the prior day’s NYSE Advance/Decline indicator. VIX reflects a current reading of the CBOE Volatility Index (INDEX: VIX) from 0-100.

What To Expect: As of 6:20 AM ET, Thursday’s regular session (9:30 AM – 4:00 PM EST) in the S&P 500 will likely open outside of prior-range and -value, suggesting a heightened potential for immediate directional opportunity.

Adding, during the prior day’s regular trade, on negative intraday breadth and supportive market liquidity metrics, the best case outcome occurred, evidenced by trade above the level of a key volume-weighted average price (VWAP).

Graphic: SPDR S&P 500 ETF Trust (NYSE: SPY), one of the largest ETFs that track the S&P 500 index, encounters responsive buying at key volume-weighted average price levels. 
Graphic: Supportive delta (i.e., committed buying as measured by volume delta or buying and selling power as calculated by the difference in volume traded at the bid and offer) in SPDR S&P 500 ETF Trust (NYSE: SPY), one of the largest ETFs that track the S&P 500 index, via Bookmap. The readings are supportive of responsive trade or balance (i.e., rotational trade that suggests current prices offer favorable entry and exit).

Thereafter, equity index futures, led by the Nasdaq 100, continued higher overnight, leaving behind a multi-session balance area (between the $4,363.25 and $4,278.00 HVNodes).

This trade is significant because it marks a rejection, or a willingness to not transact at lower prices. We’re carrying forward, though, the presence of poor structures (e.g., Wednesday’s advance away from session value on a taper of volume, and minimal excess lows which suggest a lack of commitment to take prices lower).

Gap + Balance-Break Scenarios: A change in the market (i.e., the transition from two-time frame trade, or balance, to one-time frame trade, or trend) has occurred.

At the same time, gaps ought to fill quickly. Should any gap not fill, that’s a signal of strength; do not fade. 

Therefore, the objective is to monitor for acceptance (i.e., more than 1-hour of trade) outside of the balance area. Rejection (i.e., return inside of balance) portends a move to the opposite end of the balance.

Further, the aforementioned trade is happening in the context of a traditionally volatile October, as well as narratives surrounding adjustments to monetary policy, debt ceiling complications, and energy crises.

These themes support fear and uncertainty; for instance, Nordea believes there are “4 macro reasons why 2022 should be noisier than 2021: liquidity, growth slowdown, cost/margin problems and the risk of the Fed put looking very different if inflation indicators stay elevated.”

However, the Senate is nearing a deal to raise the debt ceiling, relieving the threat of imminent default; this was a likely development given that “lawmakers [knew] that voting against raising the debt ceiling would have enormous economic costs,” Moody’s noted.

Also, on the energy crisis front, Russia offered to export record volumes of fuel to Europe as winter approaches fast.

Given these developments, Tracie McMillion, head of global asset allocation strategy at Wells Fargo & Co’s (NYSE: WFC) Investment Institute said the following on Bloomberg: “We have several things that we are watching right now – certainly the debt ceiling is one of them and that’s been contributing to the recent volatility, … but we look for these 5% corrections to add money to the equity markets.”

Adding, prior to yesterday’s advance, this newsletter noted that indices were best positioned for a vicious rebound as near-term downside discovery metrics likely reached a limit

Graphic: ​​On October 5, 2021, according to SqueezeMetrics, “Net Put Delta (NPD) and the customer Vanna-Gamma Ratio (VGR) [] settled in a *bullish* place. Risk to the upside.”

After consolidating for numerous sessions, participants resolved the developing balance area (between the $4,363.25 and $4,278.00 HVNodes) on new information that warranted a directional move. 

In other words, the overnight session confirmed the bull thesis

We note, amidst a decline in top-of-book depth, as well as back and forth entry (exit) into (from) short-gamma, we limit our expectations based on some of the recent realized volatility.

In a quote highlighted by The Market Ear, Bank of America Corporation (NYSE: BAC) explained: “last Thursday was the 24th time since 1928 that the S&P experienced two or more 3-sigma shocks in 10 trading days, … [and] only in 3 of 23 episodes (and 1 in the last 50yrs) did the S&P surpass the prior month’s peak in the month following the second shock.”

Moreover, for today, participants may make use of the following frameworks.

In the best case, the S&P 500 trades sideways or higher; activity above the $4,377.00 overnight point of control (O/N POC) puts in play the $4,410.25 low volume area (LVNode). Initiative trade beyond the LVNode could reach as high as the $4,437.75 micro-composite point of control (MCPOC) and $4,481.75 high volume area (HVNode), or higher.

In the worst case, the S&P 500 trades lower; activity below the $4,377.00 O/N POC puts in play the $4,363.25 HVNode. Initiative trade beyond the HVNode could reach as low as the $4,332.25 LVNode and $4,278.00 HVNode, or lower.

Graphic: 65-minute profile chart of the Micro E-mini S&P 500 Futures updated 7:10 AM ET.

Definitions

Volume Areas: A structurally sound market will build on areas of high volume (HVNodes). Should the market trend for long periods of time, it will lack sound structure, identified as low volume areas (LVNodes). LVNodes denote directional conviction and ought to offer support on any test. 

If participants were to auction and find acceptance into areas of prior low volume (LVNodes), then future discovery ought to be volatile and quick as participants look to HVNodes for favorable entry or exit.

POCs: POCs are valuable as they denote areas where two-sided trade was most prevalent in a prior day session. Participants will respond to future tests of value as they offer favorable entry and exit.

MCPOCs: POCs are valuable as they denote areas where two-sided trade was most prevalent over numerous day sessions. Participants will respond to future tests of value as they offer favorable entry and exit.

More On Volume-Weighted Average Prices (VWAPs): A metric highly regarded by chief investment officers, among other participants, for quality of trade. Additionally, liquidity algorithms are benchmarked and programmed to buy and sell around VWAPs.

Gamma: Gamma is the sensitivity of an option to changes in the underlying price. Dealers that take the other side of options trades hedge their exposure to risk by buying and selling the underlying. When dealers are short-gamma, they hedge by buying into strength and selling into weakness. When dealers are long-gamma, they hedge by selling into strength and buying into weakness. The former exacerbates volatility. The latter calms volatility.

News And Analysis

NFT game wants you to spend real money buying fake shares.

Senate is poised to pull nation back from default brink, for now.

Global banks retain competitive advantage amid big obstacles.

Russia offers to ease Europe’s gas crisis with strings attached.

Digitalization of markets: how digital bonds can disrupt market.

U.S. utilities and regulators gear up for electric vehicle outlook.

ECB studies a new bond-buying plan for when crisis tool ends.

S&P on navigating a pathway to a low-carbon global economy. 

Rivian’s electric truck gets all attention but fate tied to Amazon.

What People Are Saying

About

After years of self-education, strategy development, and trial-and-error, Renato Leonard Capelj began trading full-time and founded Physik Invest to detail his methods, research, and performance in the markets. 

Additionally, Capelj is a finance and technology reporter. Some of his biggest works include interviews with leaders such as John Chambers, founder and CEO, JC2 Ventures, Kevin O’Leary, businessman and Shark Tank host, Catherine Wood, CEO and CIO, ARK Invest, among others.

Disclaimer

At this time, Physik Invest does not manage outside capital and is not licensed. In no way should the materials herein be construed as advice. Derivatives carry a substantial risk of loss. All content is for informational purposes only.

Categories
Commentary

Daily Brief For October 6, 2021

Market Commentary

Equity index futures, commodities, and bonds trade sideways to lower.

  • Fed action, debt ceiling fear mounting.
  • Ahead: ADP Employment, Fed speak.
  • Indices position for directional resolve.

What Happened: U.S. stock index futures auctioned sideways to lower overnight alongside narratives surrounding adjustments to monetary policy and debt ceiling complications.

Ahead is data on ADP employment (8:15 AM ET) and Fed speak (9:00 and 11:30 AM ET).

Graphic updated 6:30 AM ET. Sentiment Risk-Off if expected /ES open is below the prior day’s range. /ES levels are derived from the profile graphic at the bottom of the following section. SqueezeMetrics Dark Pool Index (DIX) and Gamma (GEX) calculations are based on where the prior day’s reading falls with respect to the MAX and MIN of all occurrences available. A higher DIX is bullish. At the same time, the lower the GEX, the more (expected) volatility. SHIFT data used for S&P 500 (INDEX: SPX) options activity. Note that options flow is sorted by the call premium spent; if more positive then more was spent on call options. Breadth reflects a reading of the prior day’s NYSE Advance/Decline indicator. VIX reflects a current reading of the CBOE Volatility Index (INDEX: VIX) from 0-100.

What To Expect: As of 6:30 AM ET, Wednesday’s regular session (9:30 AM – 4:00 PM EST) in the S&P 500 will likely open outside of prior-range and -value, suggesting an increased potential for immediate directional opportunity.

Adding, during the prior day’s regular trade, on positive albeit weak intraday breadth and divergent market liquidity metrics, the best case outcome occurred, evidenced by trade up to $4,358.00, the level of a key anchored volume-weighted average price (VWAP).

Graphic: Divergent delta (i.e., non-committed buying as measured by volume delta or buying and selling power as calculated by the difference in volume traded at the bid and offer) in SPDR S&P 500 ETF Trust (NYSE: SPY), one of the largest ETFs that track the S&P 500 index, via Bookmap. The readings are supportive of responsive trade or balance (i.e., rotational trade that suggests current prices offer favorable entry and exit).

Thereafter, equity index futures, led by the Nasdaq 100 and Russell 2000, liquidated overnight, leaving behind Tuesday’s prominent point of control (POC) before finding responsive buyers at a key high volume area (HVNode) for this most recent developing balance area (between the $4,363.25 and $4,278.00 HVNodes).

This trade is significant because it marks acceptance, or a willingness to transact at lower prices. We’re carrying forward, though, the presence of poor structures (e.g., Friday’s advance away from session value on a taper of volume, and a minimal excess low, suggests a lack of commitment to take prices lower).

Given the overnight gap inside of balance, the following scenarios apply.

Balance-Break Scenarios: A change in the market (i.e., the transition from two-time frame trade, or balance, to one-time frame trade, or trend) may occur.

Monitor for acceptance (i.e., more than 1-hour of trade) outside of the balance area. Rejection (i.e., return inside of balance) portends a move to the opposite end of the balance.

Further, the aforementioned trade is happening in the context of a traditionally volatile October, as well as narratives surrounding adjustments to monetary policy and debt ceiling complications.

Despite these themes supporting fear and uncertainty, Marko Kolanovic, JPMorgan’s chief global markets strategist, said the following in a note Monday: “We do not believe the recent bout of de-risking will lead to sustained falls, and maintain the stance to keep buying into any weakness.”

On the other hand, in support of continued volatility, Nordea believes there are “4 macro reasons why 2022 should be noisier than 2021: liquidity, growth slowdown, cost/margin problems and the risk of the Fed put looking very different if inflation indicators stay elevated.”

Graphic: According to Nordea, “The Fed is also quickly moving closer to a tapering decision, which now sounds almost as a done deal for November. The previous three episodes of QE tapering have all gone hand in hand with rising volatility. Our scenario with Fed rate hikes in the second half of 2022 would add to those volatility risks.”

Prior to yesterday’s advance, this newsletter noted that indices were best positioned for a vicious rebound as near-term downside discovery metrics likely reached a limit

Graphic: ​​On October 5, 2021, according to SqueezeMetrics, “Net Put Delta (NPD) and the customer Vanna-Gamma Ratio (VGR) [] settled in a *bullish* place. Risk to the upside.”

The overnight liquidation challenges that thesis, putting indexes in a peculiar position; it’s likely that participants are seeking more information to base a directional move.

Moreover, for today, participants may make use of the following frameworks.

In the best case, the S&P 500 trades sideways or higher; activity above the $4,278.00 HVNode puts in play the $4,332.25 low volume area (LVNode). Initiative trade beyond the LVNode could reach as high as $4,349.00 untested POC (VPOC) and $4,410.25 LVNode, or higher.

In the worst case, the S&P 500 trades lower; activity below the $4,278.00 HVNode puts in play the $4,260.00 overnight low (ONL). Initiative trade beyond the ONL could reach as low as $4,233.00 VPOC and $4,202.25 LVNode, or lower.

Graphic: 65-minute profile chart of the Micro E-mini S&P 500 Futures updated 6:30 AM ET.

Definitions

Overnight Rally Highs (Lows): Typically, there is a low historical probability associated with overnight rally-highs (lows) ending the upside (downside) discovery process.

Volume Areas: A structurally sound market will build on areas of high volume (HVNodes). Should the market trend for long periods of time, it will lack sound structure, identified as low volume areas (LVNodes). LVNodes denote directional conviction and ought to offer support on any test. 

If participants were to auction and find acceptance into areas of prior low volume (LVNodes), then future discovery ought to be volatile and quick as participants look to HVNodes for favorable entry or exit.

POCs: POCs are valuable as they denote areas where two-sided trade was most prevalent in a prior day session. Participants will respond to future tests of value as they offer favorable entry and exit.

Balance (Two-Timeframe Or Bracket): Rotational trade that denotes current prices offer favorable entry and exit. Balance-areas make it easy to spot a change in the market (i.e., the transition from two-time frame trade, or balance, to one-time frame trade, or trend). 

Modus operandi is responsive trade (i.e., fade the edges), rather than initiative trade (i.e., play the break).

Excess: A proper end to price discovery; the market travels too far while advertising prices. Responsive, other-timeframe (OTF) participants aggressively enter the market, leaving tails or gaps which denote unfair prices.

More On Volume-Weighted Average Prices (VWAPs): A metric highly regarded by chief investment officers, among other participants, for quality of trade. Additionally, liquidity algorithms are benchmarked and programmed to buy and sell around VWAPs.

Rates: Low rates have to potential to increase the present value of future earnings making stocks, especially those that are high growth, more attractive. To note, inflation and rates move inversely to each other. Low rates stimulate demand for loans (i.e., borrowing money is more attractive). In conjunction with the rapid recovery, lower rates solicit hawkish commentary as policymakers look to inhibit inflation.

News And Analysis

‘Volmageddon’ history as SEC greenlights leveraged VIX ETFs.

World trade rebounds at a faster clip than was initially expected.

Treasuries’ pain deepened amid the grimmest year since 2013.

European gas surges 60% in two days as EU sounds the alarm.

Unrelenting political brinkmanship edging U.S. closer to default.

What People Are Saying

About

After years of self-education, strategy development, and trial-and-error, Renato Leonard Capelj began trading full-time and founded Physik Invest to detail his methods, research, and performance in the markets. 

Additionally, Capelj is a finance and technology reporter. Some of his biggest works include interviews with leaders such as John Chambers, founder and CEO, JC2 Ventures, Kevin O’Leary, businessman and Shark Tank host, Catherine Wood, CEO and CIO, ARK Invest, among others.

Disclaimer

At this time, Physik Invest does not manage outside capital and is not licensed. In no way should the materials herein be construed as advice. Derivatives carry a substantial risk of loss. All content is for informational purposes only.

Categories
Commentary

Daily Brief For October 5, 2021

Editor’s Note: Sorry for the delay, everyone. I’m back in action, today, after traveling!

Market Commentary

Equity index futures trade higher with yields and the dollar. Commodities were mixed.

  • Positioning: Some risks weigh to the upside.
  • Ahead is data on the trade deficit, PMI, ISM.
  • Fundamental narratives are reducing clarity.

What Happened: U.S. stock index futures sideways to higher overnight alongside narratives surrounding a taper to Federal Reserve asset purchases and debt ceiling complications.

Ahead is data on the trade deficit (8:30 AM ET), Markit services PMI (9:45 AM ET), and ISM services index (10:00 AM ET).

Graphic updated 7:50 AM ET. Sentiment Neutral if expected /ES open is inside of the prior day’s range. /ES levels are derived from the profile graphic at the bottom of the following section. SqueezeMetrics Dark Pool Index (DIX) and Gamma (GEX) calculations are based on where the prior day’s reading falls with respect to the MAX and MIN of all occurrences available. A higher DIX is bullish. At the same time, the lower the GEX, the more (expected) volatility. SHIFT data used for S&P 500 (INDEX: SPX) options activity. Note that options flow is sorted by the call premium spent; if more positive then more was spent on call options. Breadth reflects a reading of the prior day’s NYSE Advance/Decline indicator. VIX reflects a current reading of the CBOE Volatility Index (INDEX: VIX) from 0-100.

What To Expect: As of 7:50 AM ET, Tuesday’s regular session (9:30 AM – 4:00 PM EST) in the S&P 500 will likely open inside of prior-range and -value, suggesting a limited potential for immediate directional opportunity.

Adding, during the prior day’s regular trade, on weak intraday breadth and divergent market liquidity metrics, the worst-case outcome occurred, evidenced by a liquidation into the bulk of last Friday’s value, the area where about 70% of the volume took place. 

In the process, participants left a letter b-shaped profile which suggests participants were “too” long and had poor location; Friday’s advance away from the value area, on a taper of volume, left poor structure – lacking commitment – that gave during Monday’s move lower alongside fundamental drivers, putting in play the S&P 500’s October 1 $4,260.00 overnight low (ONL).

Graphic: Divergent delta (i.e., non-committed selling as measured by volume delta or buying and selling power as calculated by the difference in volume traded at the bid and offer) in SPDR S&P 500 ETF Trust (NYSE: SPY), one of the largest ETFs that track the S&P 500 index, via Bookmap. The readings are supportive of responsive trade or balance (i.e., rotational trade that suggests current prices offer favorable entry and exit).

Further, the aforementioned trade is happening in the context of a traditionally volatile October, as well as narratives surrounding a taper to Federal Reserve asset purchases and debt ceiling complications.

These themes are supportive of fear and uncertainty.

To elaborate, on one hand, according to Bloomberg, “the bond market thinks the Fed is going to make a hawkish mistake, and stamp out the life in the economy when previously there had been a belief that the Fed would be easy and let inflation move higher.”

On the other hand, in reference to default on a failure to raise or suspend the debt limit, “The consensus (from clients to whom we speak) is that it just will not happen,” Barclays Plc (NYCE: BCS) analysts explained. “But political schisms in Congress are stronger than they have been in a long time and battle lines more hardened.”

In addition, according to The Market Ear, Morgan Stanley’s (NYSE: MS) Mike Wilson sees the inability of companies to pass on pricing, margin risk related to higher wages, and a reversion to trend in goods consumption, coupled with near term risks on supply chain issues, weighing earnings into early next year.

“In short, higher real rates should mean lower equity prices. Secondarily, they may also mean value over growth even as the overall equity market goes lower. This makes for a doubly difficult investment environment given how most investors are positioned,” Wilson said in a discussion that also touched on a fraying in the buy-the-dip psychology

In opposition, JPMorgan Chase & Co (NYSE: JPM) sales believe liquidity will remain ample while a capital return and consumer balance sheet health make the recent dip a buy.

Graphic: Morgan Stanley unpacks fraying of buy-the-dip psychology, visually, via The Market Ear.

In terms of positioning, there is more risk to the upside than the downside; indices are best positioned for a vicious rebound as near-term downside discovery has likely reached a limit.

Moreover, for today, participants may make use of the following frameworks.

In the best case, the S&P 500 trades sideways or higher; activity above the $4,285.75 high volume area (HVNode) puts in play the $4,332.25 low volume area (LVNode). Initiative trade beyond the LVNode could reach as high as the $4,363.25 HVNode and $4,410.25 LVNode, or higher.

In the worst case, the S&P 500 trades lower; activity below the $4,285.75 HVNode puts in play the $4,260.00 overnight low (ONL). Initiative trade beyond the ONL could reach as low as the $4,233.00 VPOC and $4,202.25 gap zone, or lower.

Graphic: 65-minute profile chart of the Micro E-mini S&P 500 Futures updated 7:50 AM ET.

Definitions

Overnight Rally Highs (Lows): Typically, there is a low historical probability associated with overnight rally-highs (lows) ending the upside (downside) discovery process.

Volume Areas: A structurally sound market will build on areas of high volume (HVNodes). Should the market trend for long periods of time, it will lack sound structure, identified as low volume areas (LVNodes). LVNodes denote directional conviction and ought to offer support on any test. 

If participants were to auction and find acceptance into areas of prior low volume (LVNodes), then future discovery ought to be volatile and quick as participants look to HVNodes for favorable entry or exit.

POCs: POCs are valuable as they denote areas where two-sided trade was most prevalent in a prior day session. Participants will respond to future tests of value as they offer favorable entry and exit.

News And Analysis

Stagflation fear is having a British renaissance.

Global energy crisis is first of many in transition.

Buy the dip has failed. Here’s what you do next.

What People Are Saying

About

After years of self-education, strategy development, and trial-and-error, Renato Leonard Capelj began trading full-time and founded Physik Invest to detail his methods, research, and performance in the markets. 

Additionally, Capelj is a finance and technology reporter. Some of his biggest works include interviews with leaders such as John Chambers, founder and CEO, JC2 Ventures, Kevin O’Leary, businessman and Shark Tank host, Catherine Wood, CEO and CIO, ARK Invest, among others.

Disclaimer

At this time, Physik Invest does not manage outside capital and is not licensed. In no way should the materials herein be construed as advice. Derivatives carry a substantial risk of loss. All content is for informational purposes only.