Categories
Commentary

Daily Brief For March 28, 2022

The Daily Brief is a free glimpse into the prevailing fundamental and technical drivers of U.S. equity market products. Join the 200+ that read this report daily, below!

What Happened

Overnight, equity index futures diverged during participants’ attempt to discover higher prices.

Commodities were mixed while bonds extended their slump; central bank authorities, in an effort to rein in inflation amid rising prices, are focused on implementing tighter monetary policies.

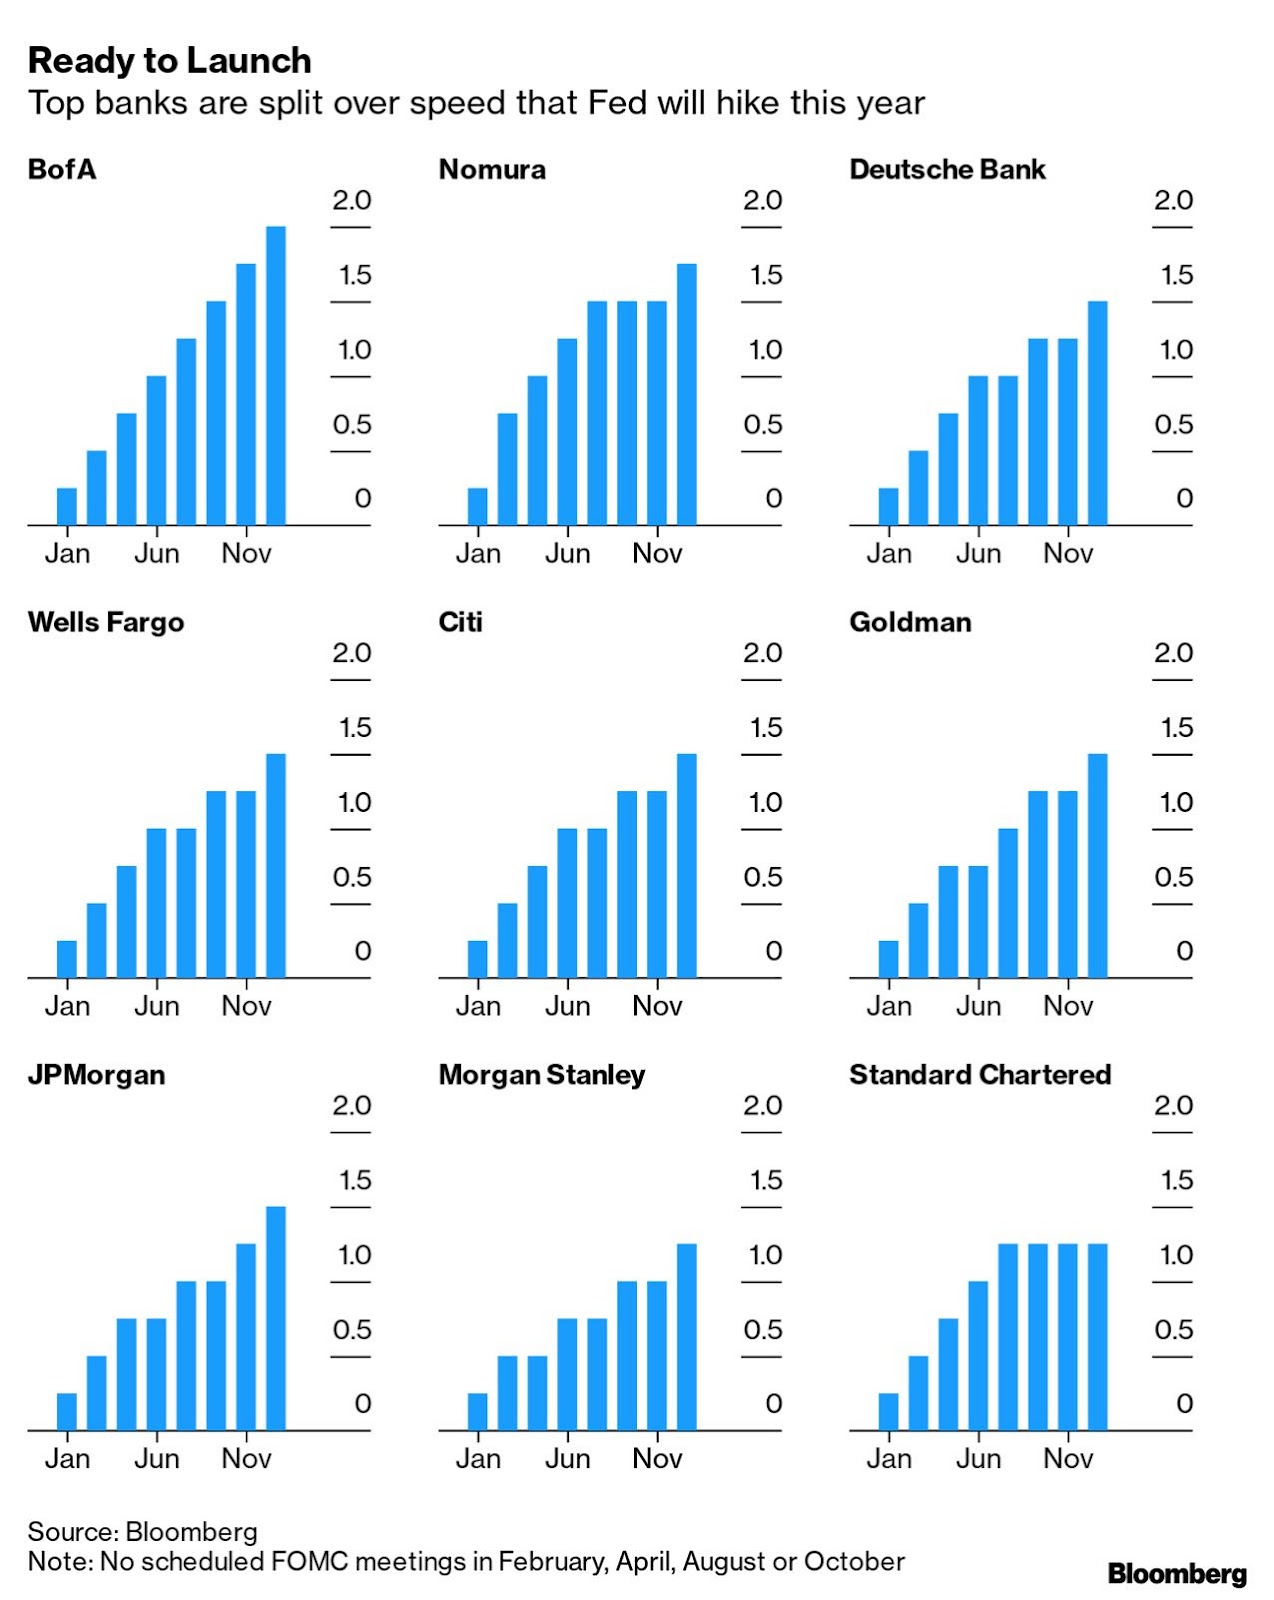
For a moment, the (5-30) Treasury curve dropped below zero for the first time since 2006. This is after the Federal Reserve’s (Fed) Jerome Powell said last week the central bank was committed to upping borrowing costs and would hike by 50 basis points if needed.
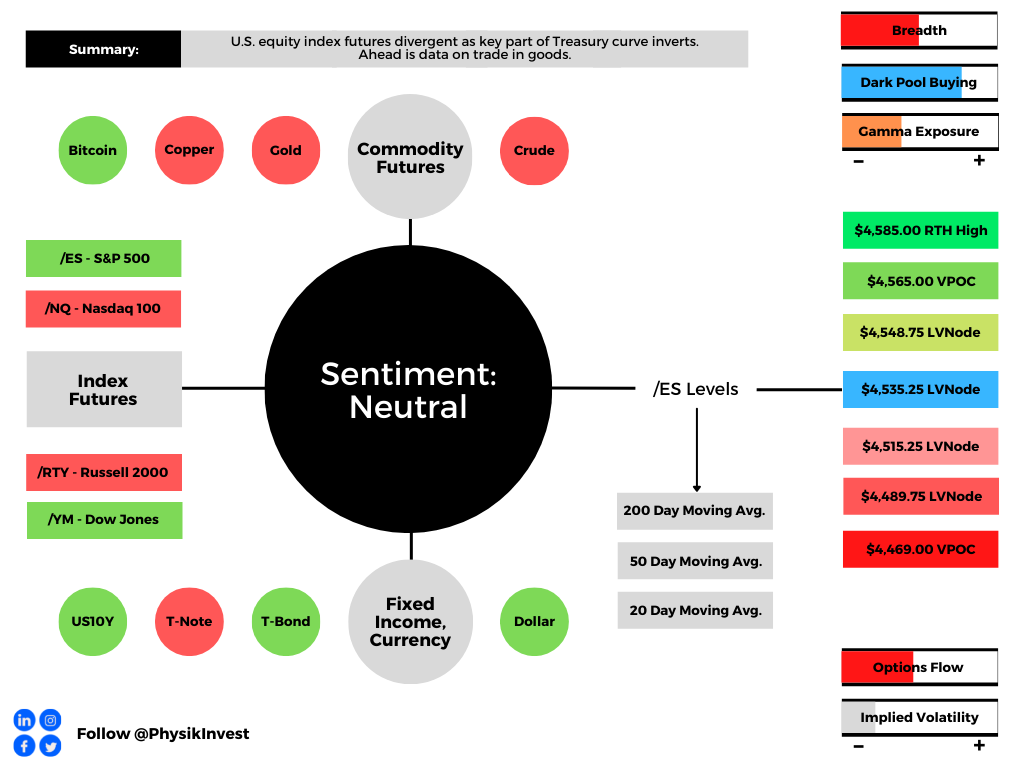
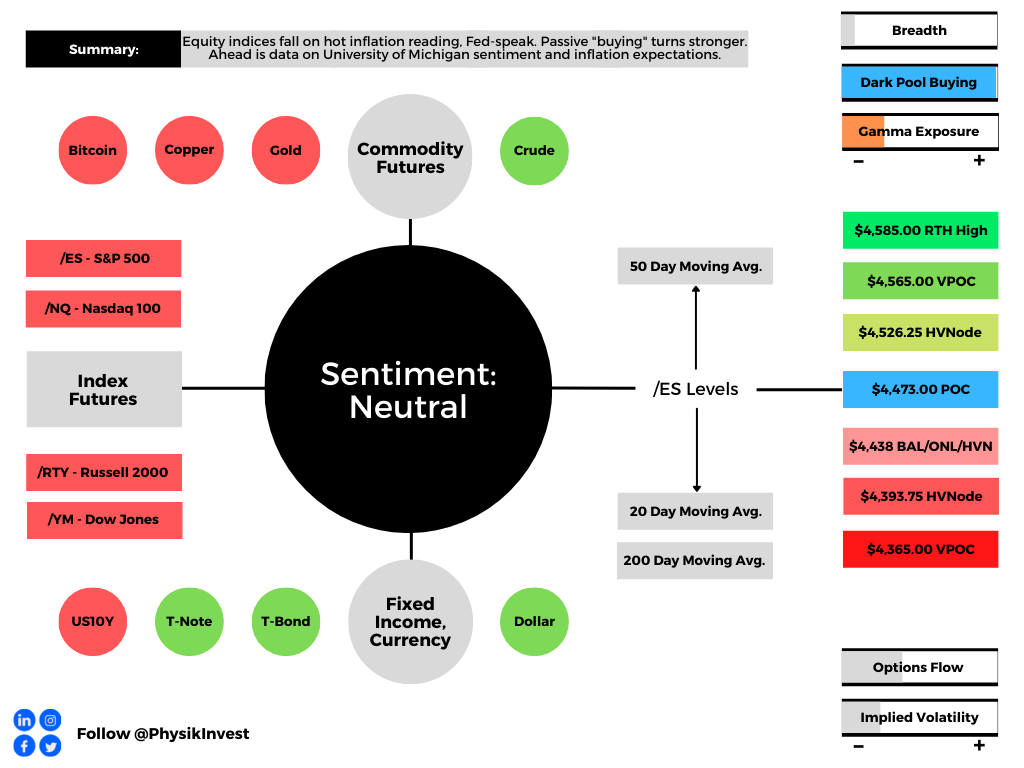
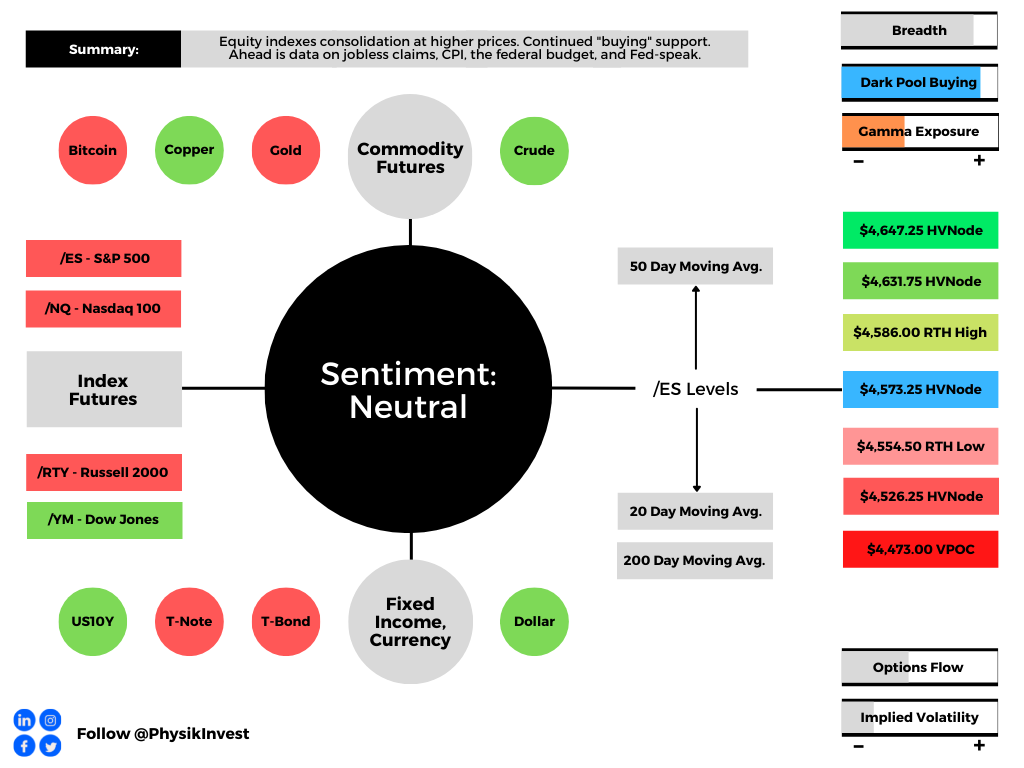
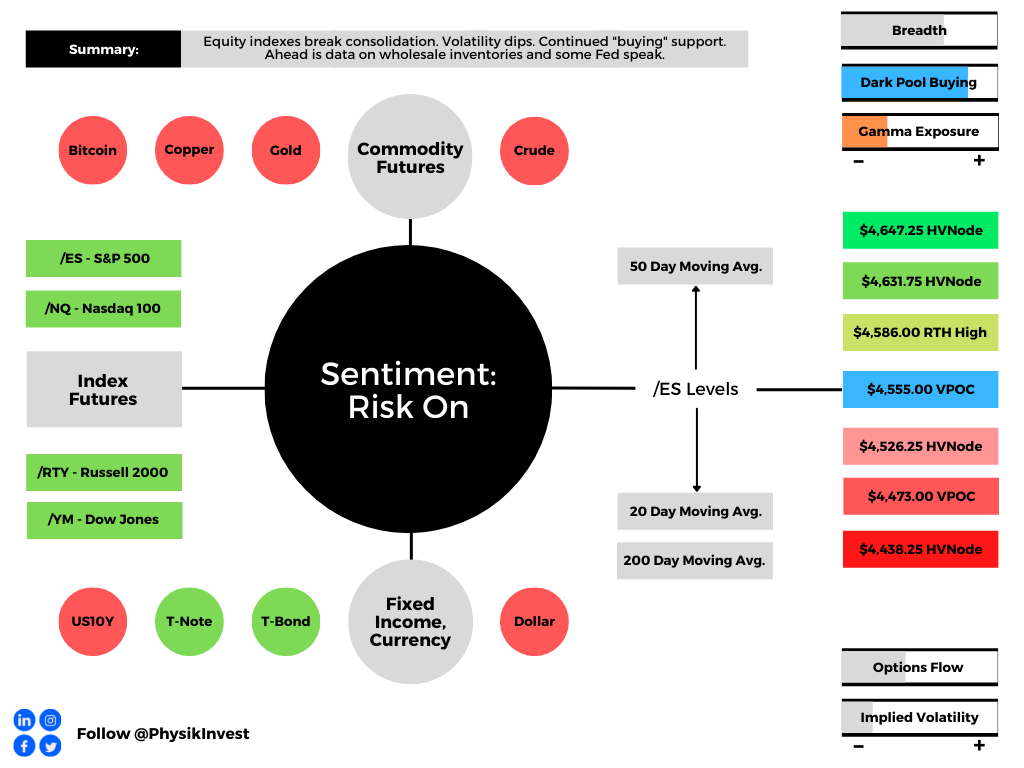
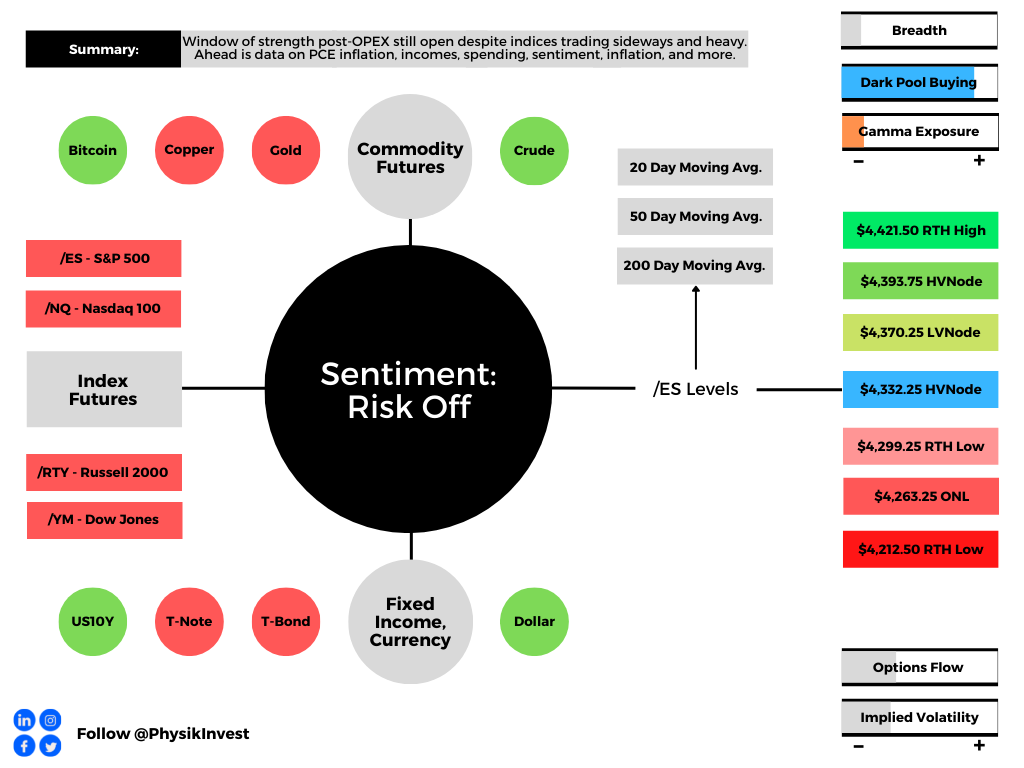
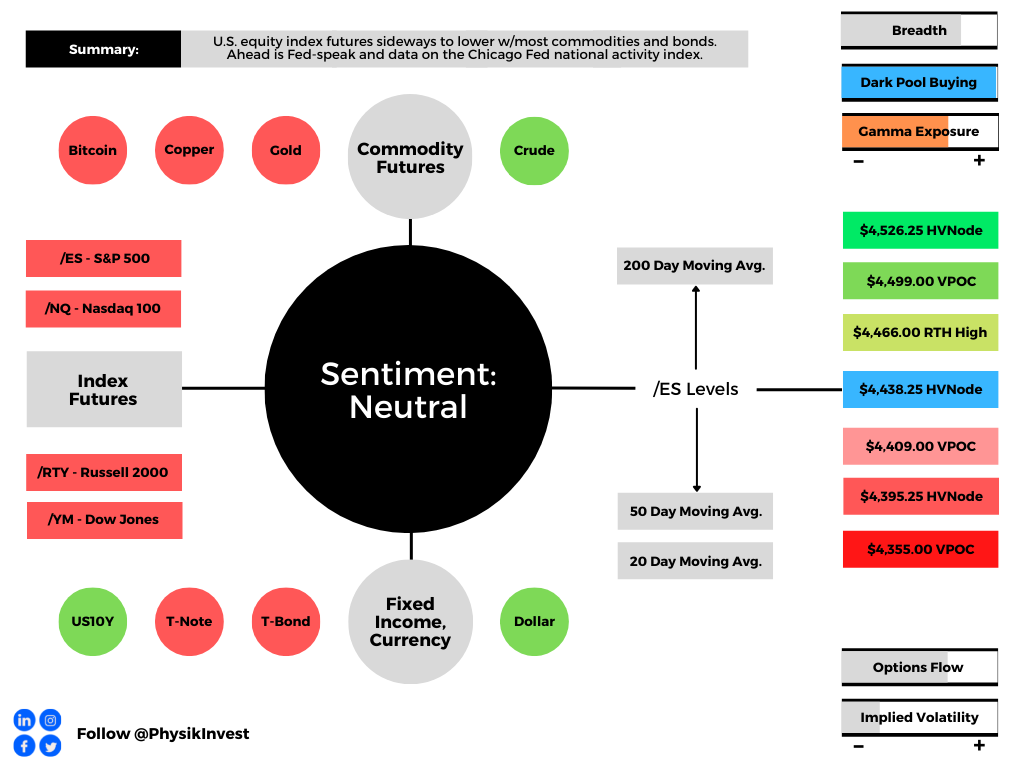
Graphic updated 6:40 AM ET. Sentiment Neutral if expected /ES open is inside of the prior day’s range. /ES levels are derived from the profile graphic at the bottom of the following section. Levels may have changed since initially quoted; click here for the latest levels. SqueezeMetrics Dark Pool Index (DIX) and Gamma (GEX) calculations are based on where the prior day’s reading falls with respect to the MAX and MIN of all occurrences available. A higher DIX is bullish. At the same time, the lower the GEX, the more (expected) volatility. Learn the implications of volatility, direction, and moneyness. SHIFT data used for S&P 500 (INDEX: SPX) options activity. Note that options flow is sorted by the call premium spent; if more positive, then more was spent on call options. Breadth reflects a reading of the prior day’s NYSE Advance/Decline indicator. VIX reflects a current reading of the CBOE Volatility Index (INDEX: VIX) from 0-100.

What To Expect

Fundamental: Keeping it short, today. 

Last week, we discussed monetary policy and the impact of quantitative tightening (QT) in the face of revisions in global growth expectations. You can check that out, here.
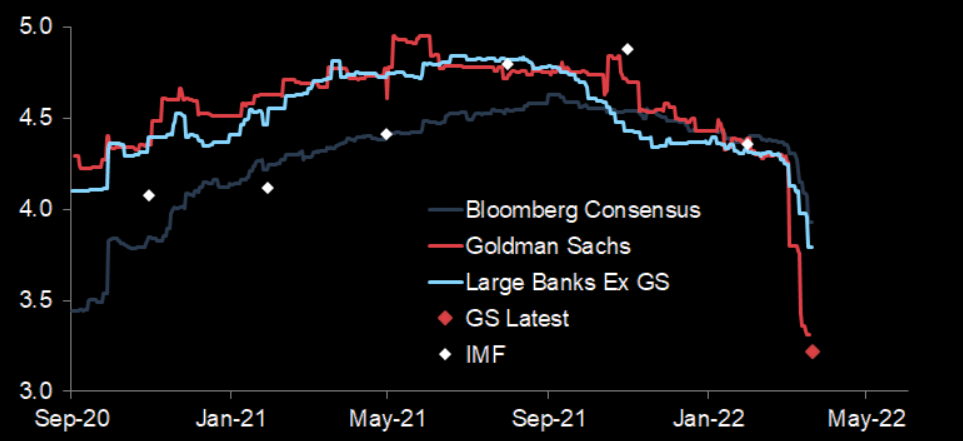
Graphic: Via Goldman Sachs Group Inc (NYSE: GS). Taken from The Market Ear. “GS has significantly lowered our 2022 global growth forecast in recent weeks. The chart shows global 2022 real GDP growth, % change.”

On the belief that the “Fed hiking cycle and balance sheet drain are now priced” as the market enters a seasonally favorable period, strategists like JPMorgan Chase & Co’s (NYSE: JPM) Marko Kolanovic favor risk in high-beta.

“While the commodity supercycle will persist,” Kolanovic said, “the correction in bubble sectors is now likely finished, and geopolitical risk will likely start abating in a few weeks’ time (while a comprehensive resolution may take a few months).”
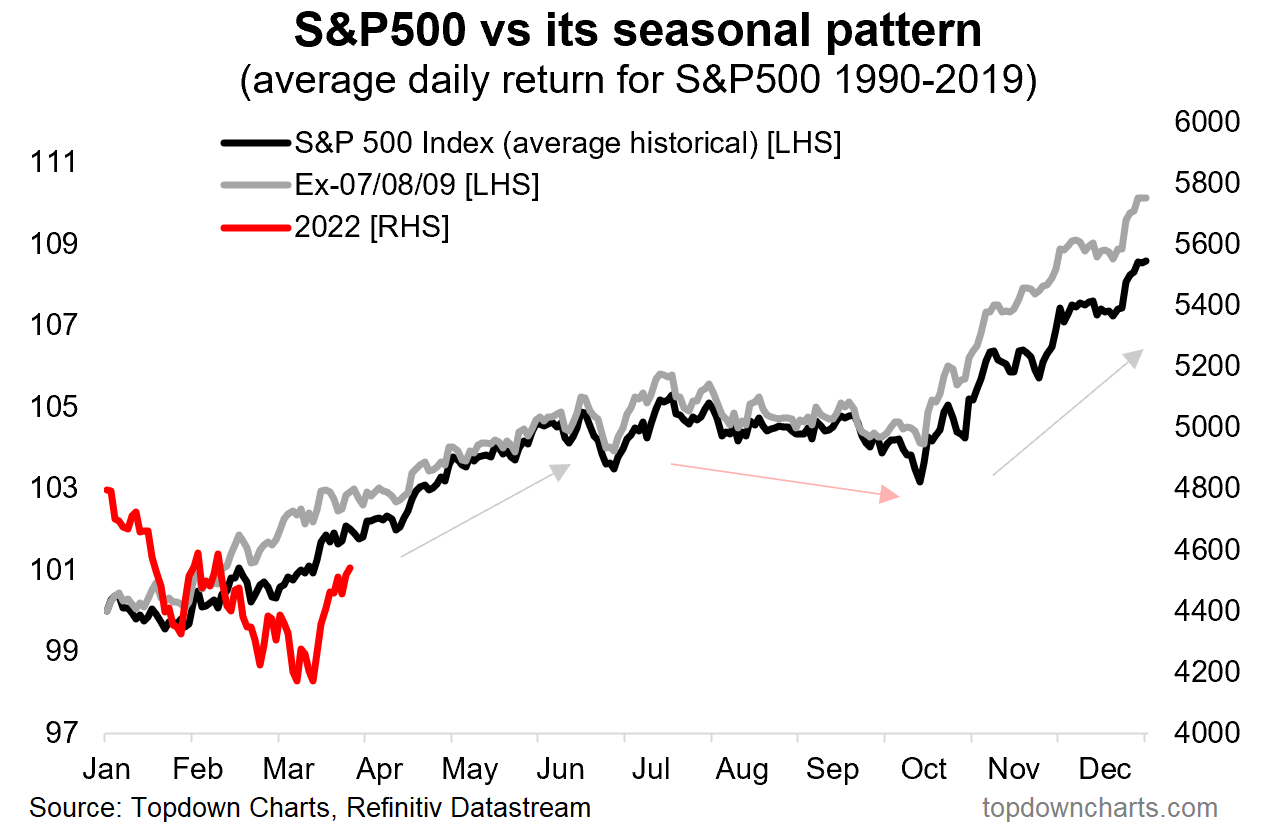
Graphic: Via Callum Thomas. “April is historically the best month (highest average monthly gain and 74% of all Aprils in history were positive).”

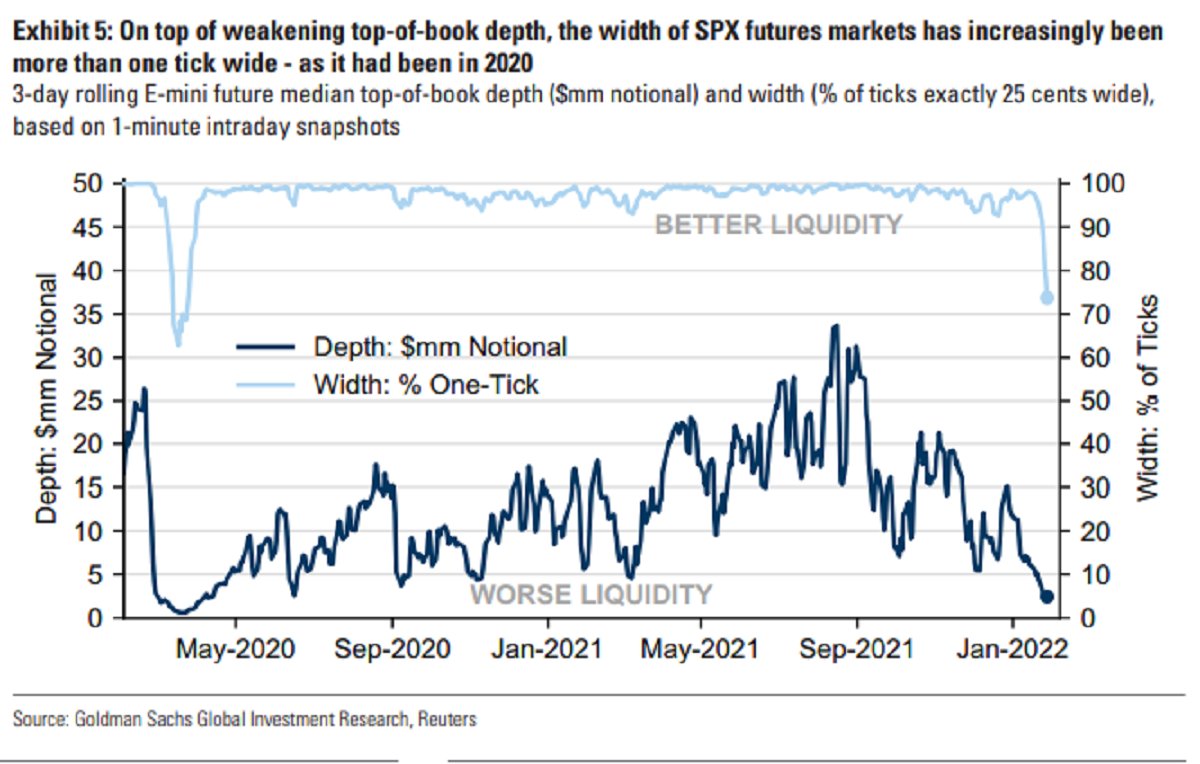
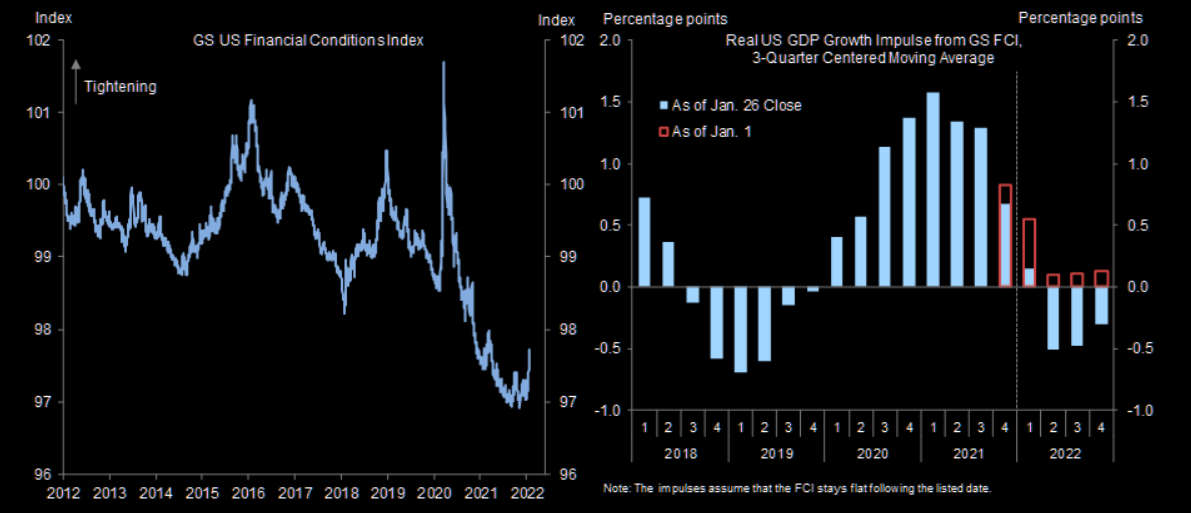
Complicating Kolanovic’s outlook is uncertainty with respect to the Fed’s decision to hike and pare asset holdings as financial conditions tighten.
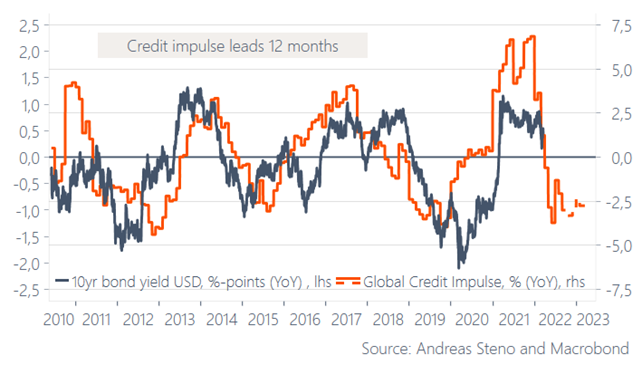
Graphic: Via Stenos Signals. “On top of already tight financial conditions, the spill-overs from a weakening credit cycle remain mostly unseen. If usual correlations hold, then a contracting credit cycle will lead long bond yields LOWER and not higher during H2-2022.”

In the coming weeks, the thesis that a de-rate (or pricing in of uncertainties) has played out will be put to the test as the Fed reveals its template for QT. Final plans are likely to be unveiled in an announcement at the beginning of May.

Damped Spring Advisors’ Andy Constan explains well his perspectives on what comes next in the below video. Check it out.

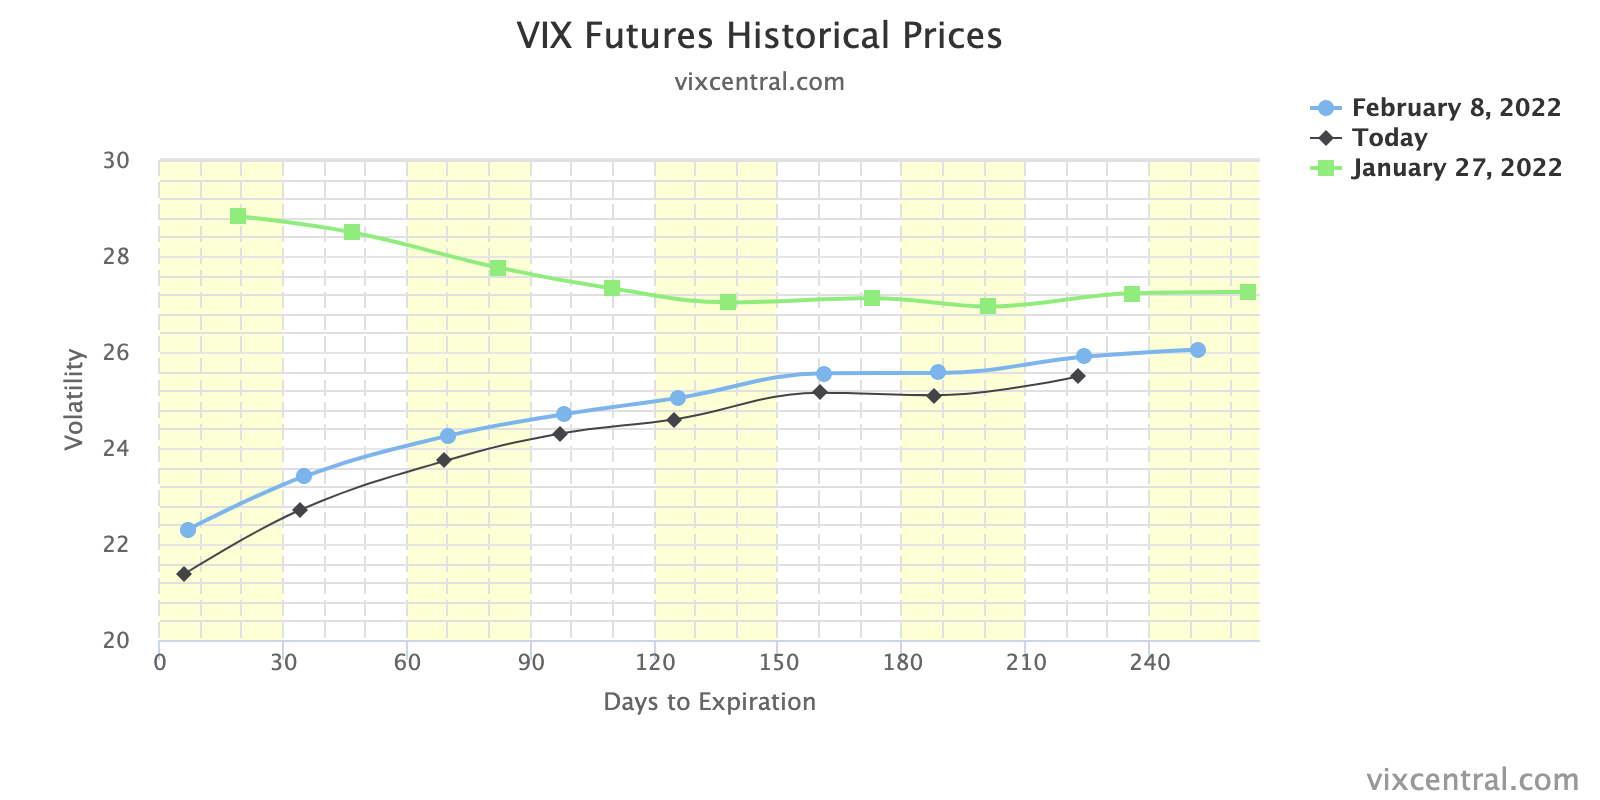
Positioning: The CBOE Volatility Index (INDEX: VIX), a measure of participants’ demand for protection, so to speak, appears to have hit a lower bound around 20.00. This is as the VIX term structure steepened, dramatically, over the last weeks, particularly at the front end of the curve.
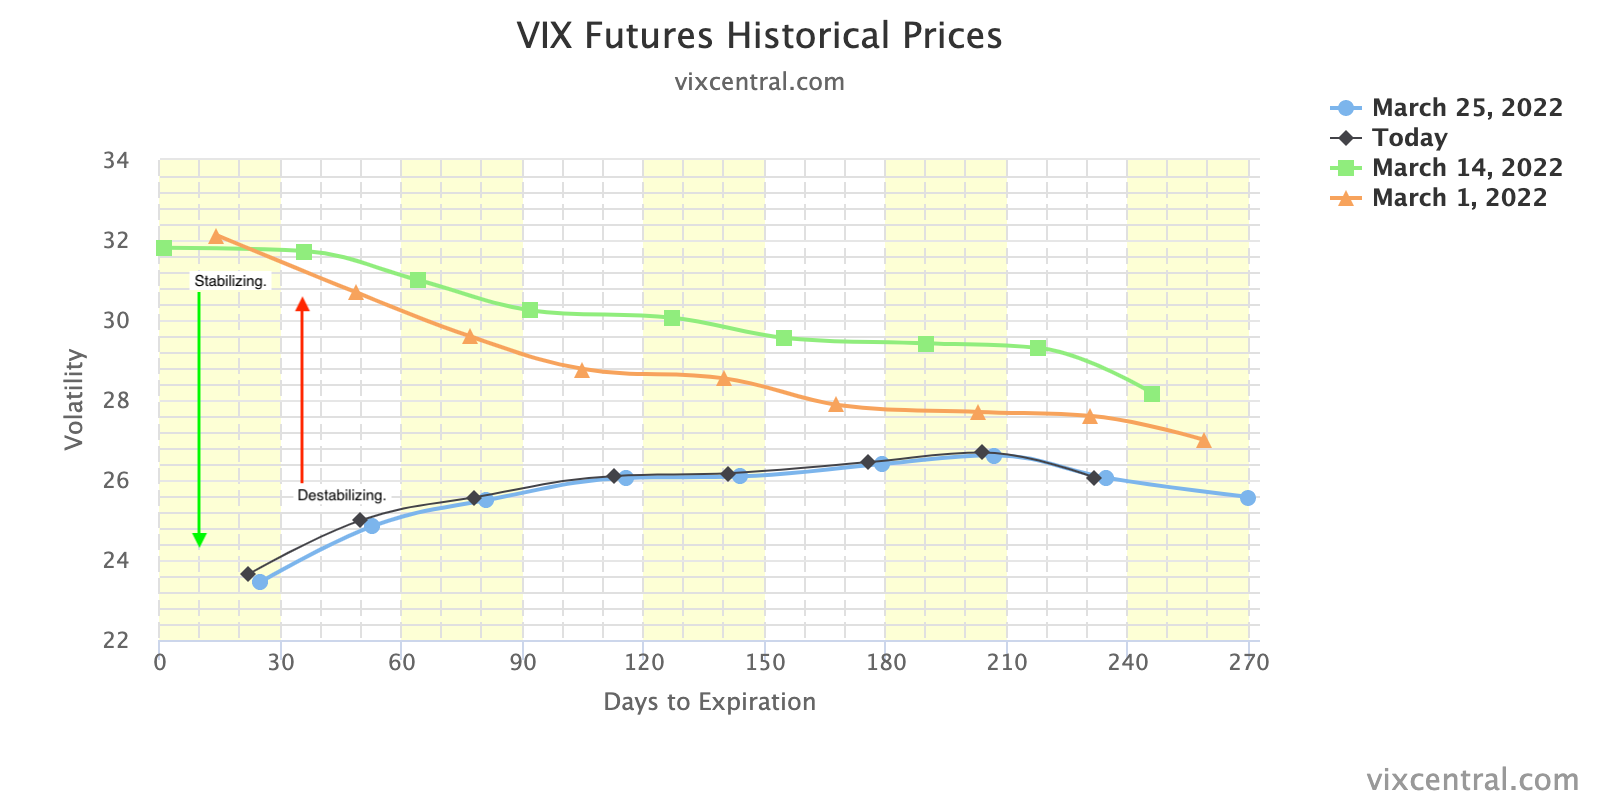
Graphic: Via Vix Central.

After a long period during which options market participants concentrated their activity on bets on lower prices (negative delta trades that payout in case of movement lower), markets jolted higher as that protection was monetized (and decay ensued).

Alongside this collapse in implied volatility was speculative demand in index heavy-weights like Tesla Inc (NASDAQ: TSLA). Participants bought stock while selling puts (bets on the downside) and buying calls (bets on the upside).
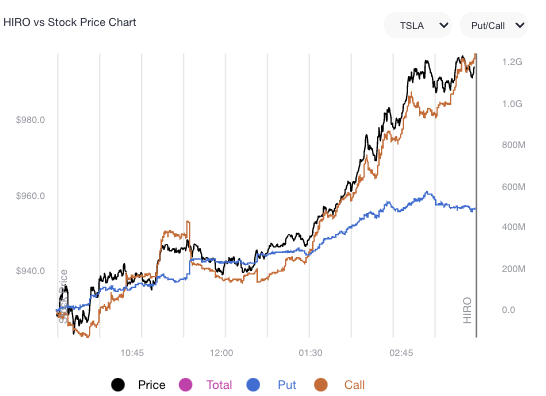
Graphic: SpotGamma’s Hedging Impact of Real-Time Options (HIRO) indicator for TSLA as shown in our March 23, 2022 newsletter. The rising orange line denotes call buying. The rising blue line denotes put selling.

As this speculative demand cools, counterparties to these levered bets on the upside unwind their hedges and this has the effect of pressuring attempts higher.

According to SpotGamma, this is as, heading into this week’s expiration of quarterly options, there’s a “potential for more ‘pinning’ action as close-to-the-money bets concentrated in that expiry near the end of their lifecycle.” You can learn more about this, here.

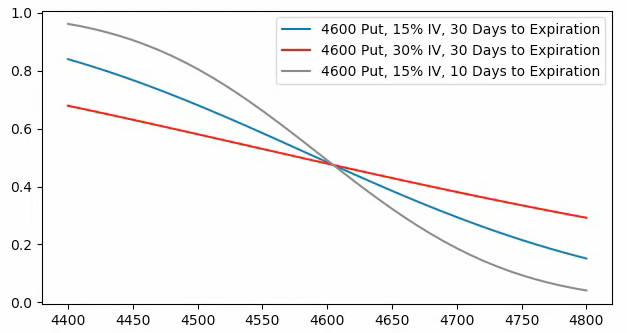
Why? As time and volatility trend toward zero, the rate of change of options delta (gamma) of near-the-money options increases.

“This happens because the range of spot prices across which option deltas shift from near-zero to near-100% becomes very narrow as options approach maturity (and at maturity, options on one side of the settlement value have zero delta and the other side have 100% delta).”

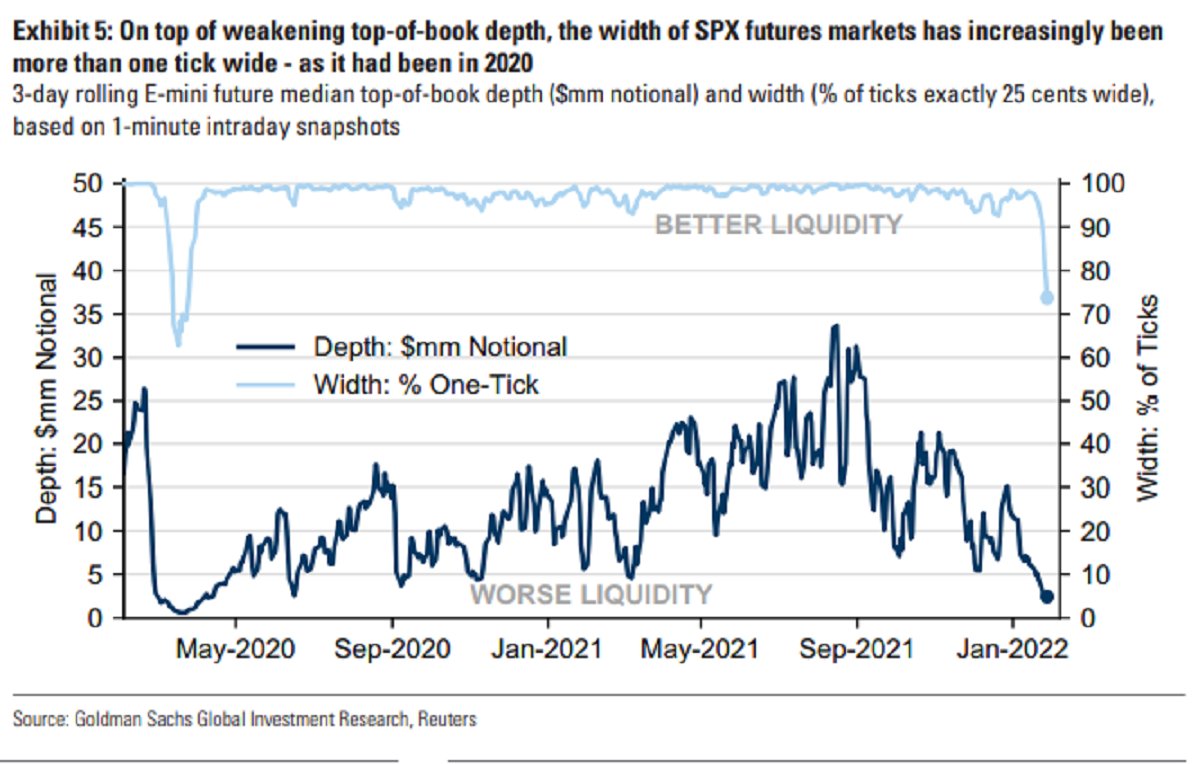
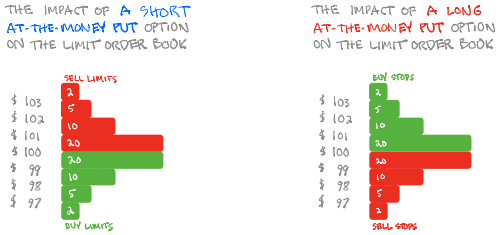
With, at least at the index level, bets on lower volatility dominating (put and call selling), as the gamma of these near-the-money options increases, counterparties add liquidity, buying (selling) into weakness (strength) as positive delta exposure falls (rises).
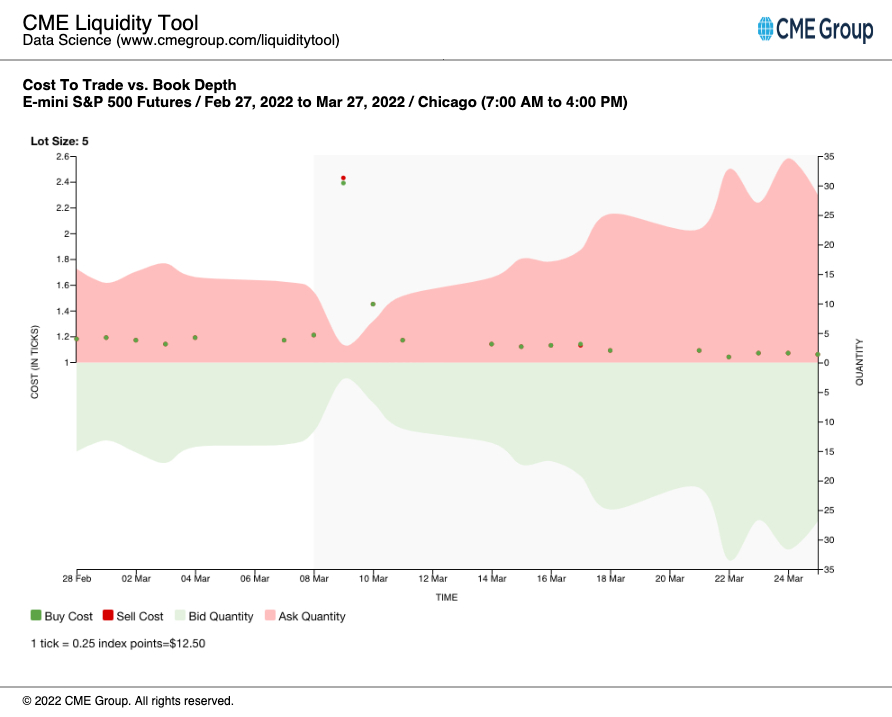
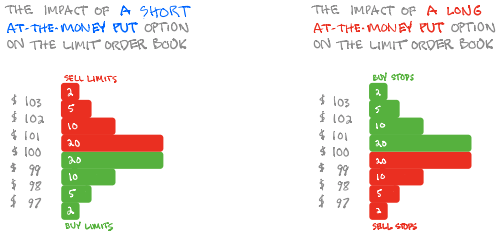
Graphic: Analysis of book depth for the E-mini S&P 500 futures contract, via CME Group Inc’s (NASDAQ: CME) Liquidity Tool. For more on the implications of participants’ options positioning and dealer hedging, read here.

Moreover, the odds point to sideways trade, rather than a fast move higher or lower. 

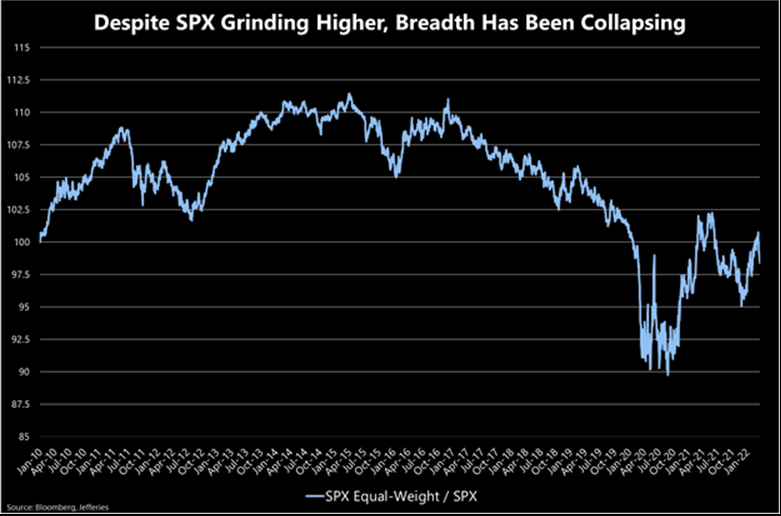
However, after this expiry, it’s likely that the market succumbs to underlying forces. At present, despite the S&P 500 and its peers trading higher, underlying breadth is collapsing.
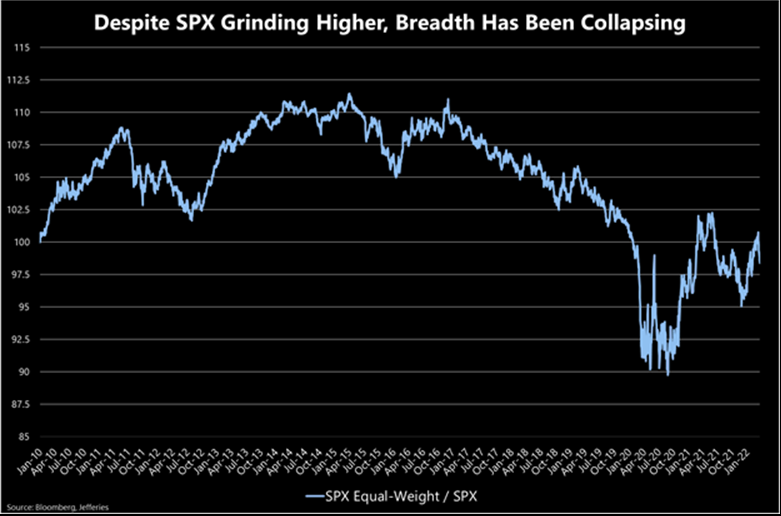
Graphic: Via Jefferies Financial Group Inc (NYSE: JEF). Taken from The Market Ear. “While the SPX is up over 8% since the lows, the equal-weight version of the index is down nearly 3% relative, its steepest relative decline so far this year. Typically, this would make us uneasy too, but the market narrowed considerably from June to Dec last year, so this might be attributable to a tech bounce from lows.”

Technical: As of 6:40 AM ET, Monday’s regular session (9:30 AM – 4:00 PM ET), in the S&P 500, will likely open in the upper part of a balanced overnight inventory, inside of prior-range and -value, suggesting a limited potential for immediate directional opportunity.

In the best case, the S&P 500 trades higher; activity above the $4,535.25 low volume area (LVNode) puts in play the $4,548.75 LVNode. Initiative trade beyond the $4,548.75 LVNode could reach as high as the $4,565.00 untested point of control (VPOC) and $4,585.00 regular trade high (RTH High), or higher.

In the worst case, the S&P 500 trades lower; activity below the $4,535.25 LVNode puts in play the $4,515.25 LVNode. Initiative trade beyond the $4,515.25 LVNode could reach as low as the $4,489.75 LVNode and $4,469.00 VPOC, or lower.

Click here to load today’s key levels into the web-based TradingView charting platform. Note that all levels are derived using the 65-minute timeframe. New links are produced, daily.
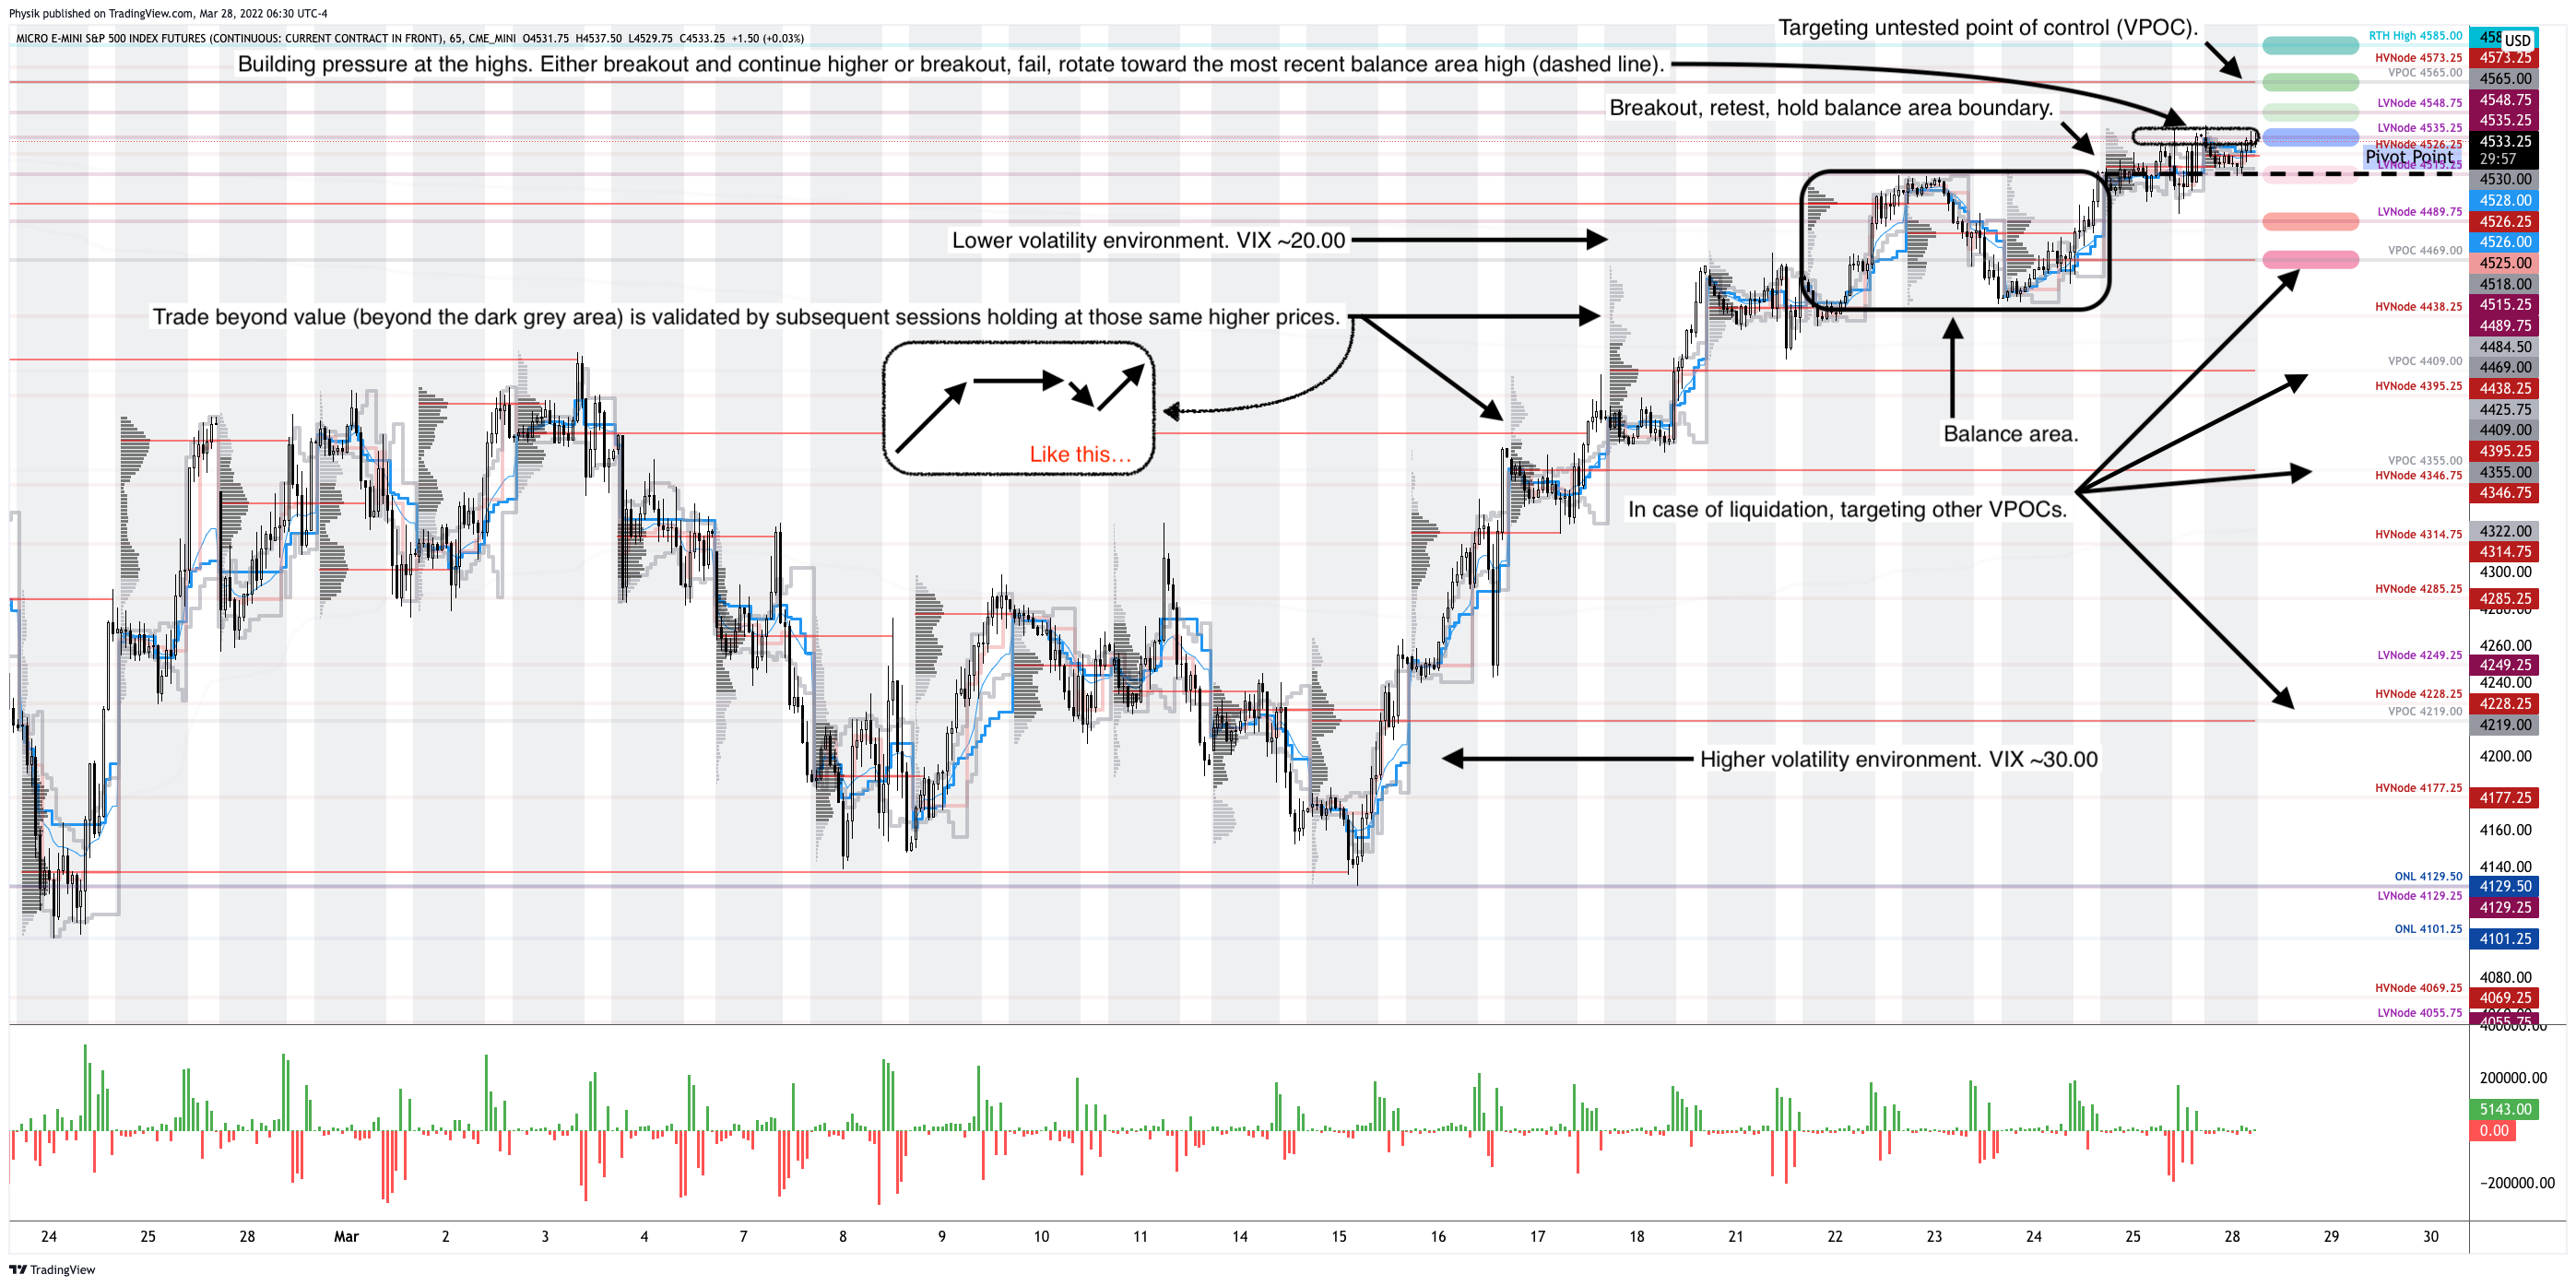
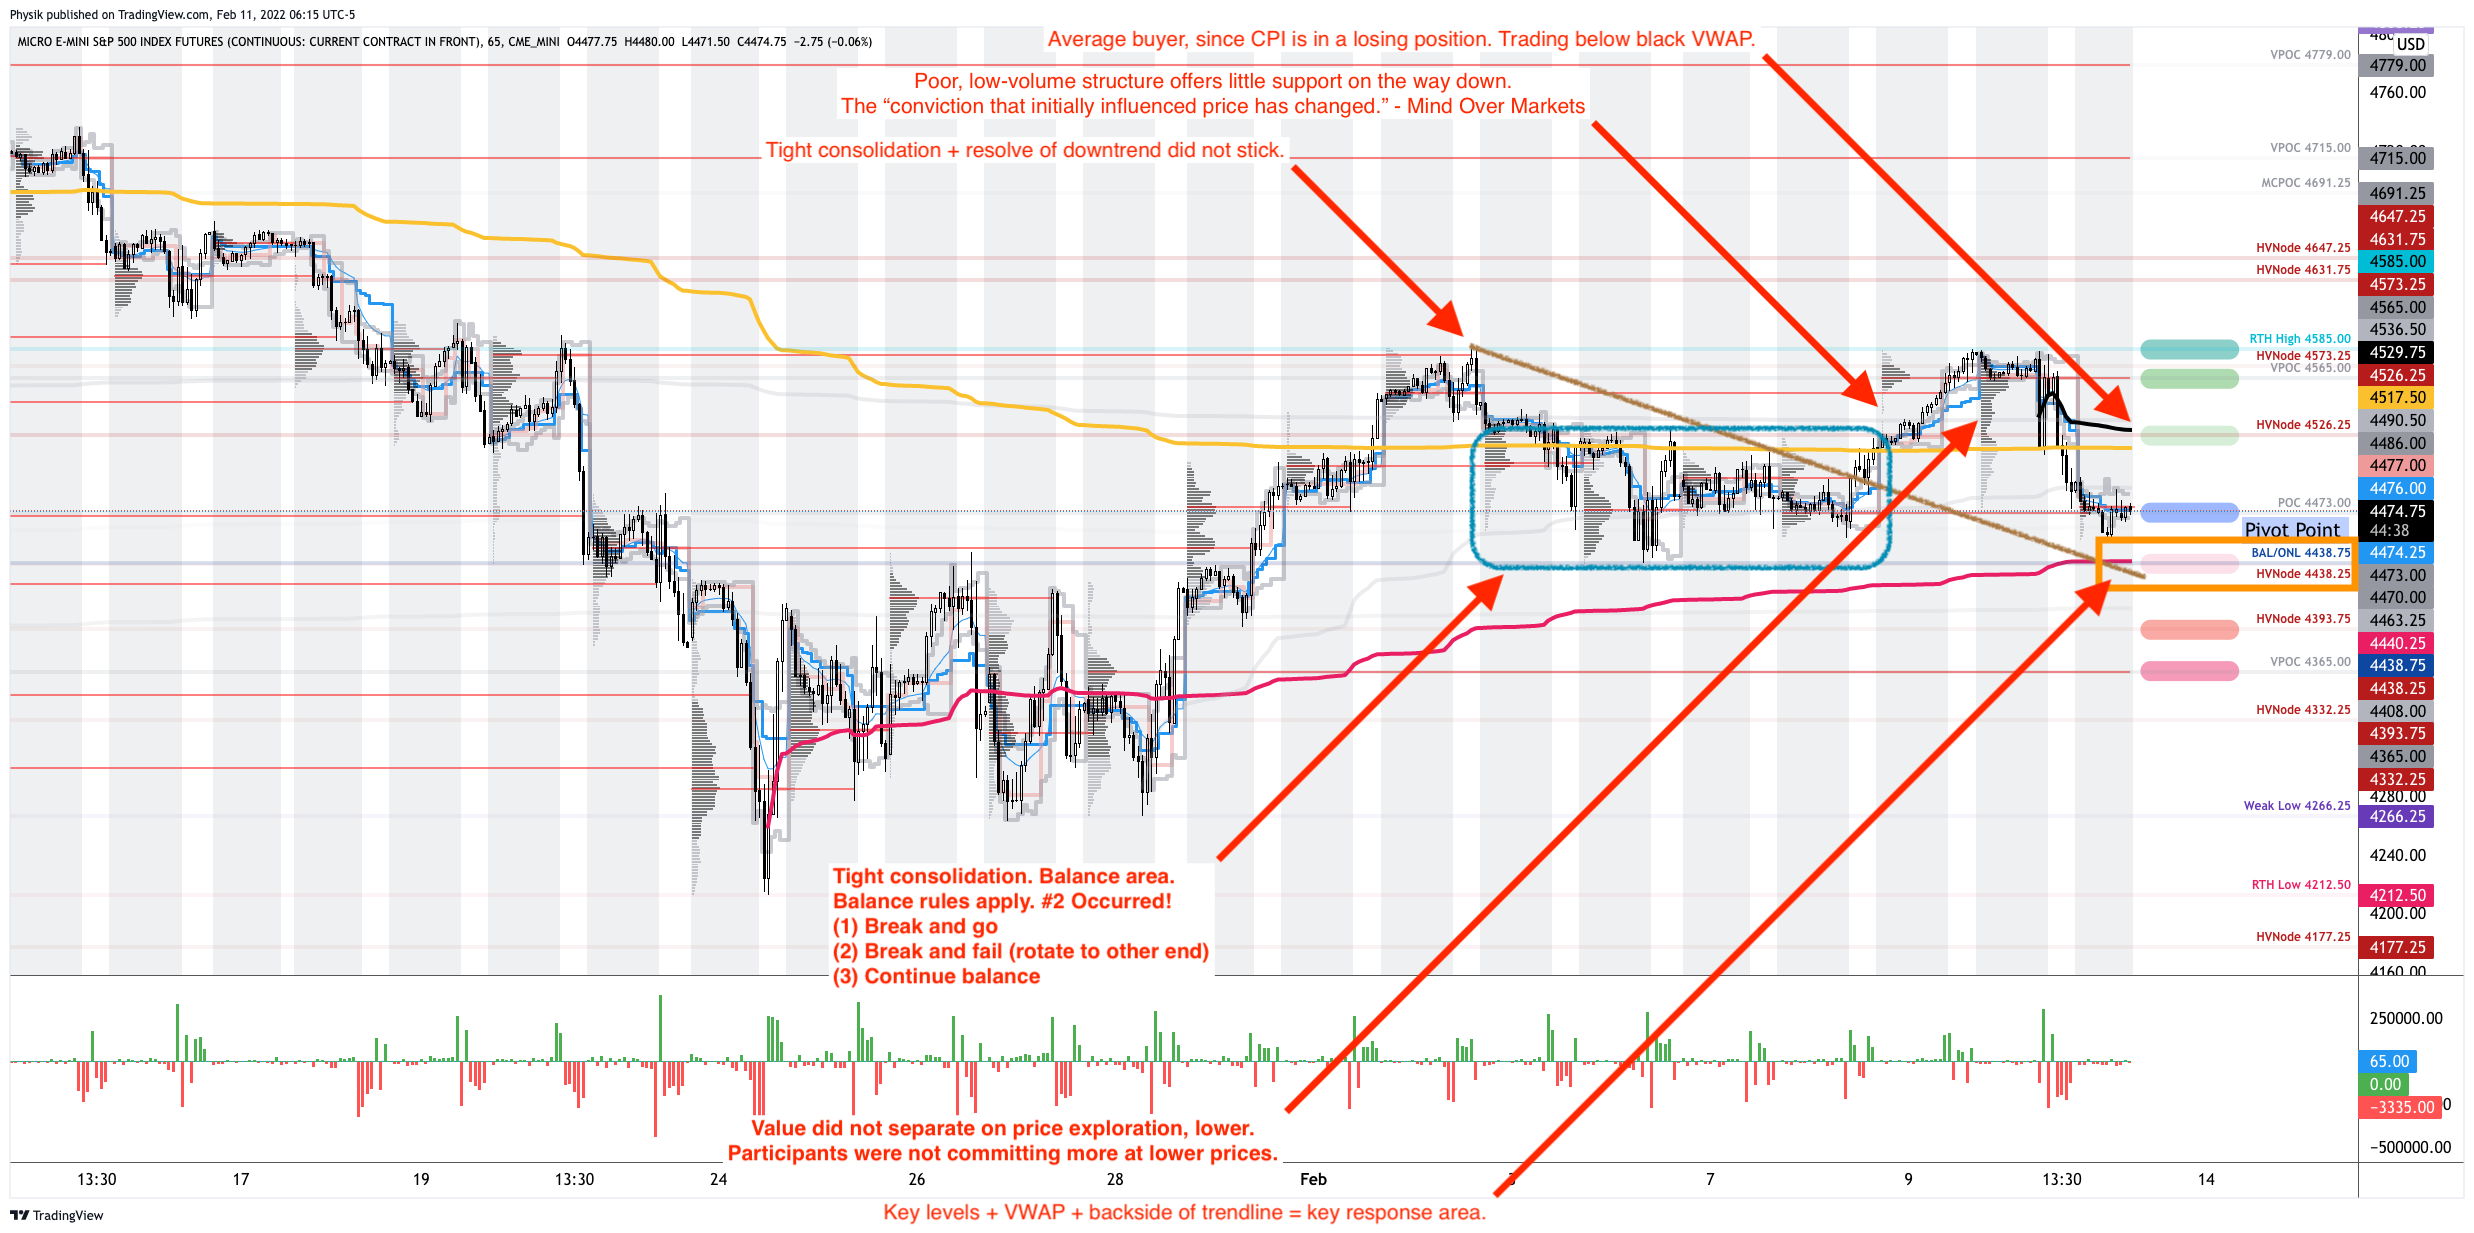
Graphic: 65-minute profile chart of the Micro E-mini S&P 500 Futures.

What People Are Saying

Definitions

Volume Areas: A structurally sound market will build on areas of high volume (HVNodes). Should the market trend for long periods of time, it will lack sound structure, identified as low volume areas (LVNodes). LVNodes denote directional conviction and ought to offer support on any test. 

If participants were to auction and find acceptance into areas of prior low volume (LVNodes), then future discovery ought to be volatile and quick as participants look to HVNodes for favorable entry or exit.

POCs: POCs are valuable as they denote areas where two-sided trade was most prevalent in a prior day session. Participants will respond to future tests of value as they offer favorable entry and exit.

Balance (Two-Timeframe Or Bracket): Rotational trade that denotes current prices offer favorable entry and exit. Balance areas make it easy to spot a change in the market (i.e., the transition from two-time frame trade, or balance, to one-time frame trade, or trend). 

About

After years of self-education, strategy development, mentorship, and trial-and-error, Renato Leonard Capelj began trading full-time and founded Physik Invest to detail his methods, research, and performance in the markets.

Capelj also develops insights around impactful options market dynamics at SpotGamma and is a Benzinga reporter.

Some of his works include conversations with ARK Invest’s Catherine Wood, investors Kevin O’Leary and John Chambers, FTX’s Sam Bankman-Fried, Kai Volatility’s Cem Karsan, The Ambrus Group’s Kris Sidial, among many others.

Disclaimer

In no way should the materials herein be construed as advice. Derivatives carry a substantial risk of loss. All content is for informational purposes only.

Categories
Commentary

Daily Brief For March 21, 2022

Editor’s Note: The Daily Brief is a free glimpse into the prevailing fundamental and technical drivers of U.S. equity market products. Join the 200+ that read this report daily, below!

What Happened

Overnight, equity index futures auctioned sideways to lower with commodities and bonds.

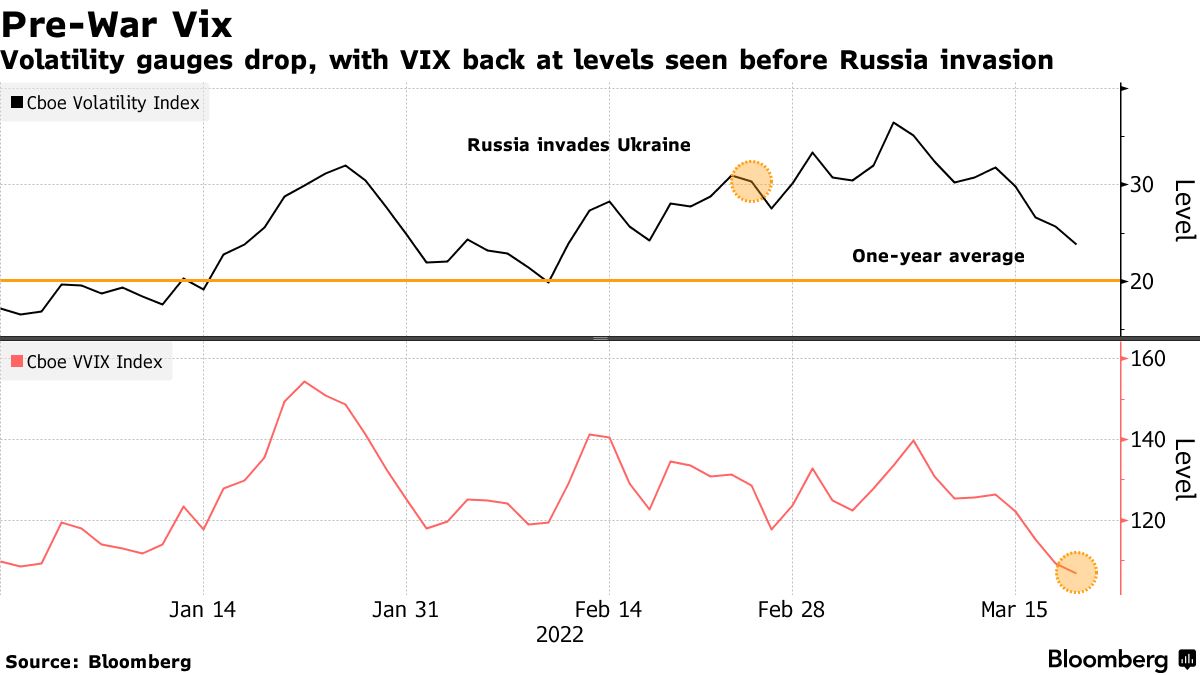
There are no overnight fundamental catalysts to make note of. However, it bears mentioning that implied volatility metrics – via the Cboe Volatility Index (INDEX: VIX) – are back to levels seen before Russia’s invasion of Ukraine. One may conclude that concerns are easing.

Ahead is data on the Chicago Fed national activity index (8:30 AM ET) and Fed-speak by Chair Jerome Powell (12:00 PM ET).

Graphic updated 6:30 AM ET. Sentiment Neutral if expected /ES open is inside of the prior day’s range. /ES levels are derived from the profile graphic at the bottom of the following section. Levels may have changed since initially quoted; click here for the latest levels. SqueezeMetrics Dark Pool Index (DIX) and Gamma (GEX) calculations are based on where the prior day’s reading falls with respect to the MAX and MIN of all occurrences available. A higher DIX is bullish. At the same time, the lower the GEX, the more (expected) volatility. Learn the implications of volatility, direction, and moneyness. SHIFT data used for S&P 500 (INDEX: SPX) options activity. Note that options flow is sorted by the call premium spent; if more positive, then more was spent on call options. Breadth reflects a reading of the prior day’s NYSE Advance/Decline indicator. VIX reflects a current reading of the CBOE Volatility Index (INDEX: VIX) from 0-100.

What To Expect

Fundamental: In spite of uncertainties with respect to economic growth and the implications of tighter monetary policy to rein in inflation, as well as geopolitical conflicts abroad, the pricing of equity market risk – via the VIX – is back at levels before Russia’s invasion of Ukraine.

Graphic: Via Bloomberg.

That leads us to question whether the de-rate (or pricing in of uncertainties) has played out? 

Potentially. With greater clarity on the Federal Reserve’s commitment to raising borrowing costs (as discussed March 17 in detail), strategists like JPMorgan Chase & Co’s (NYSE: JPM) Marko Kolanovic suggest it is time to add risk in beaten-down, high-beta positions

“While the commodity supercycle will persist,” Kolanovic said, “the correction in bubble sectors is now likely finished, and geopolitical risk will likely start abating in a few weeks’ time (while a comprehensive resolution may take a few months).”

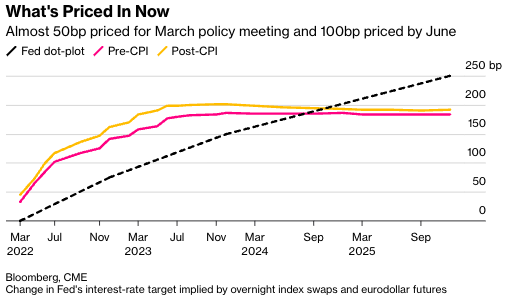
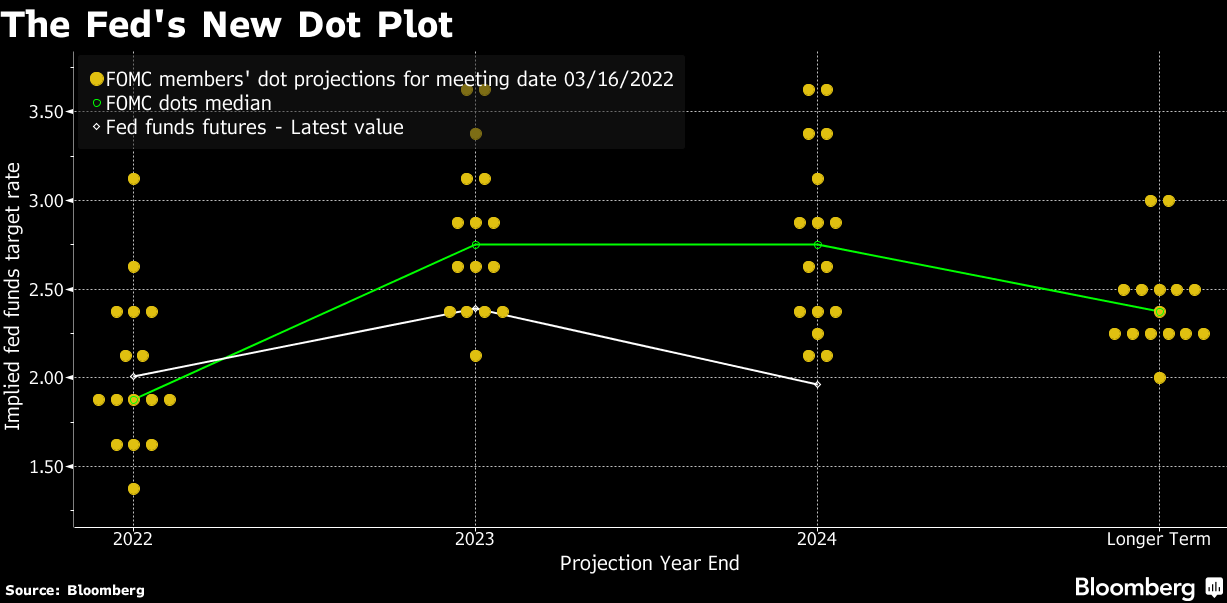
Graphic: Via Bloomberg. “Officials on the Federal Open Market Committee voted 8-1 [] to lift the target range for their main policy rate to 0.25%-0.5% and forecast a sequence of increases that would raise it to 1.75%-2% by year-end. The projections, known as the dot plot, also showed that almost half of the 16 current policymakers wanted to move faster.”

Complicating Kolanovic’s outlook is uncertainty with respect to the Fed’s decision to hike and taper asset purchases faster, as some Fed members say they are “very open to.”

At a high level, higher rates make borrowing more costly (i.e., higher rates on mortgages and business loans, as well as credit cards, among other things, disincentivize borrowing, and this funnels into less growth and inflation).

These higher rates compound the challenges of limited supply, for instance, in housing.

Graphic: Via Bloomberg. “The slide in sales reflects a market still constrained by a lack of inventory, which in February was the second-lowest on record. Buyers are bidding up prices on the few homes available. Meantime, affordability is showing signs of worsening, especially among first-time buyers … [which] accounted for 29% of sales last month, down from 31% a year earlier. [A]t current rates, monthly mortgage payments are up 28% from February last year.”

There’s also the topic of using quantitative tightening (QT) to fight inflation, too. 

Recall that quantitative easing (QE) is a policy to expand the Federal Reserve’s balance sheet “to provide monetary accommodation, typically when interest rates are at a zero-lower bound (when nominal interest rates are at, or near, zero),” as JH Investment Management explains.

With QT, central banks remove assets (e.g., government bonds they bought from the private sector) from their balance sheet “either through the sale of assets they had purchased or deciding against reinvesting the principal sum of maturing securities.”

With that, we note that when bonds rise in value, their yields decline; “when the Fed embarks on bond-buying program[s] to support the U.S. economy, … [it nudges] the prices of these assets higher while pushing yields lower, which also has the effect of driving yield-hungry investors into relatively riskier asset categories that promise high returns.”

As a result, participants’ demand for risk assets prompts their divergence from fundamentals. As liquidity is removed and funding costs increase, this may prompt risk assets to converge with fundamentals.

This is as, for investors to take on additional risk for return, they must receive in excess of the risk-free rate (as provided by the Treasury). This excess is the risk premium.

At present, according to commentary by Damped Spring’s Andy Constan, “Additional risk premium expansion pressures from these levels is not likely from news emanating from” Fed meetings.

“However, if, in the unlikely event, details of QT do emerge suggesting a start of QT before June and at a greater size than expected, we would no longer be willing to hold [risk] assets as that would cause an end to any risk premium contraction possibilities.”

Positioning: According to Morgan Stanley’s (NYSE: MS) trade desk, institutions (e.g., volatility targeting funds and trend following commodity-trading advisers) dumped nearly $200 billion in global equities over the first two months of 2022. 

Hedge funds’ net leverage, too, “fell 7.5 percentage points over the two weeks through March 11, the largest decrease over any comparable period since at least January 2016,” according to Goldman Sachs Group Inc (NYSE: GS). 

“Institutional traders, major money managers, asset managers, and hedge funds, their moves have to do with the current market conditions — a lot of volatility, a lot of uncertainty, inflation concerns, geopolitical concerns,” says Bloomberg’s Jackson Gutenplan. 

“As the market continues to downtrend, institutions selling out of positions are overwhelming any retail buying pressure.”

Given this, as mentioned in the prior fundamentals section, strategists like JPM’s Kolanovic suggest these are some of the reasons to boost risk. 

“Current risk positioning is very light. This is a result of high and persistent volatility, and risk aversion caused by global geopolitical developments,” Kolanovic says. “And for this reason, risks are skewed to the upside.”

And so, alongside the buying of futures and stock to offset the decay of counterparty positive delta (post-FOMC and through OPEX), retail investor buying remained undeterred last week.

But, as Zephyr’s Ryan Nauman says, “even though retail has gained a lot of momentum over the past two years, institutional money still outweighs the retail money, and it’s still going to move markets.”

Graphic: Via TD Ameritrade. Taken from Bloomberg. “There’s a little bit of what I think is a retrenchment going on, where they weren’t just buying everything across the board,” Shawn Cruz, senior market strategist at TD Ameritrade Inc said. “As much as there is some pulling back, and there’s a lot of volatility going on, you’re seeing some selling in the more highly valued areas and the buying is very targeted.”

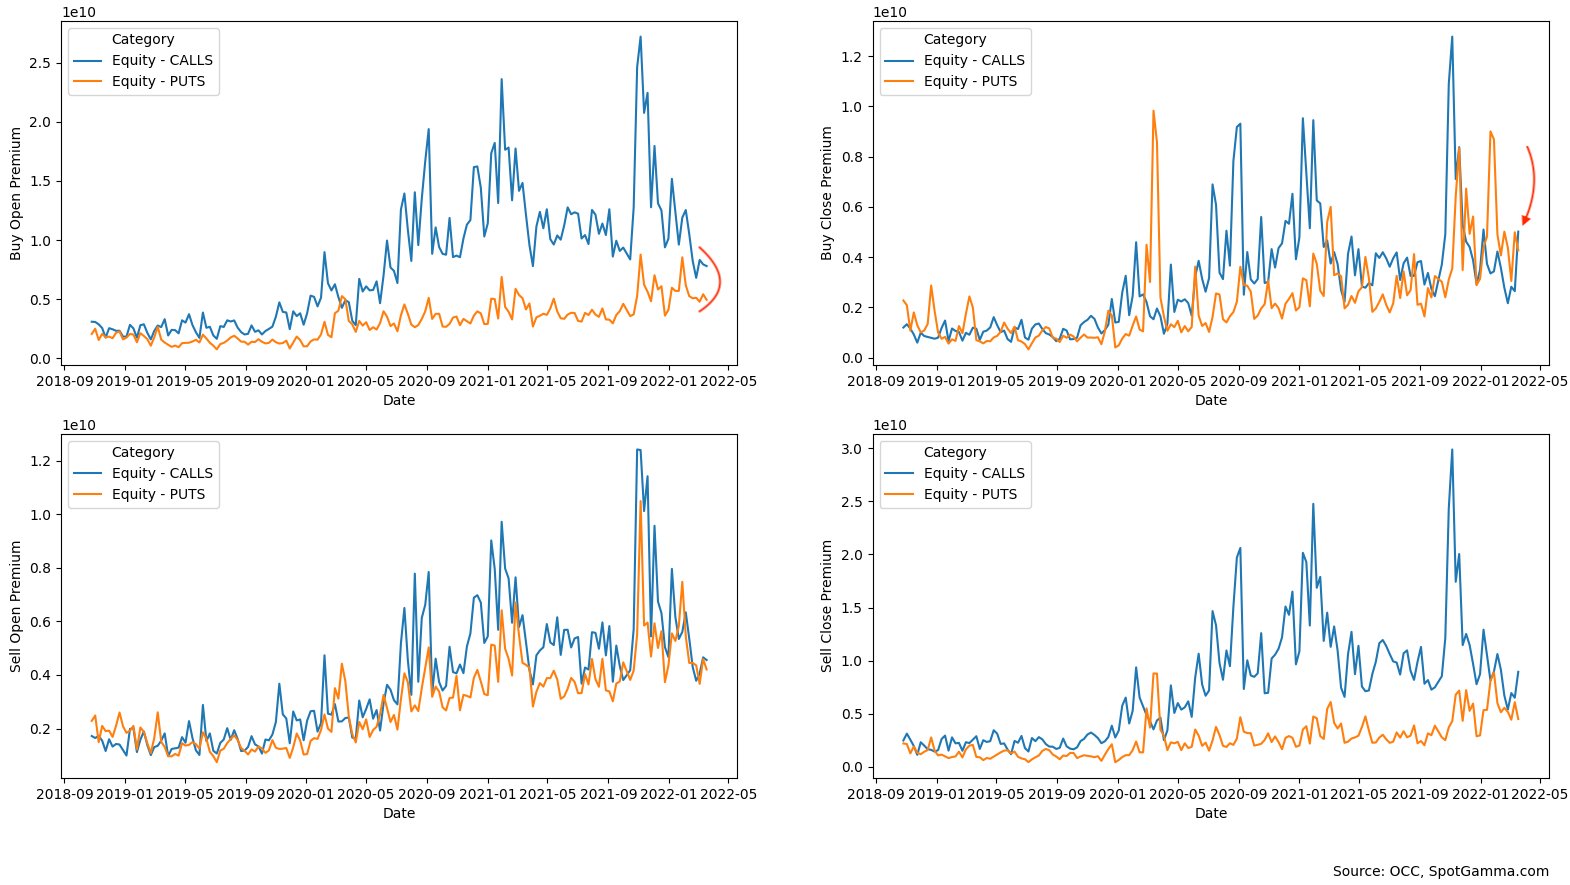
That is in the face of lackluster options activity. According to SpotGamma, call-buying, a feature of sustained bull markets “was at lows going back to 2020,” last week. 

Graphic: Via SpotGamma. “Here’s options data from the OCC. These plots show the premium per trade aggregated each week, with calls in blue and puts in orange. This is only customer flow (i.e. retail, hedge funds). Starting with equities, call buying this past week was at LOWS going back to ’20 (top right).”

Maybe you get to an extreme bearishness, and that’s usually where you bottom out,” adds Liz Young of SoFi Technologies Inc (NASDAQ: SOFI) in a statement on mom-and-pop investors eventually following institutional selling trends.

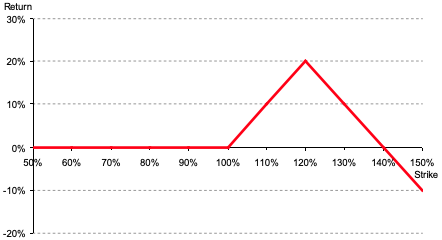
As this commentary has said before, a way to participate in the upside (while lowering debit risk) is through complex options structures, such as the ratio spread. Note, ratio spreads may carry margin risk, depending on the structure, resulting in undefined losses, potentially.

Graphic: Via Banco Santander SA (NYSE: SAN) research, the return profile, at expiry, of a classic 1×2 (long 1, short 2 further away) ratio spread.

Technical: As of 6:30 AM ET, Monday’s regular session (9:30 AM – 4:00 PM ET), in the S&P 500, will likely open in the middle part of a negatively skewed overnight inventory, inside of prior-range and -value, suggesting a limited potential for immediate directional opportunity.

In the best case, the S&P 500 trades higher; activity above the $4,438.25 high volume area (HVNode) puts in play the $4,466.00 regular trade high (RTH High). Initiative trade beyond the RTH High could reach as high as the $4,499.00 untested point of control (VPOC) and $4,526.25 HVNode, or higher.

In the worst case, the S&P 500 trades lower; activity below the $4,438.25 HVNode puts in play the $4,409.00 VPOC. Initiative trade beyond the VPOC could reach as low as the $4,395.25 HVNode and $4,355.00 VPOC, or lower.

Considerations: Push-and-pull, as well as responsiveness near key-technical areas (that are discernable visually on a chart), suggests technically-driven traders with short time horizons are very active. 

Such traders often lack the wherewithal to defend retests and, additionally, the type of trade may be indicative of the other time frame participants waiting for more information to initiate trades.

Click here to load today’s key levels into the web-based TradingView charting platform. Note that all levels are derived using the 65-minute timeframe. New links are produced, daily.
Graphic: 65-minute profile chart of the Micro E-mini S&P 500 Futures.

Definitions

Volume Areas: A structurally sound market will build on areas of high volume (HVNodes). Should the market trend for long periods of time, it will lack sound structure, identified as low volume areas (LVNodes). LVNodes denote directional conviction and ought to offer support on any test. 

If participants were to auction and find acceptance into areas of prior low volume (LVNodes), then future discovery ought to be volatile and quick as participants look to HVNodes for favorable entry or exit.

POCs: POCs are valuable as they denote areas where two-sided trade was most prevalent in a prior day session. Participants will respond to future tests of value as they offer favorable entry and exit.

About

After years of self-education, strategy development, mentorship, and trial-and-error, Renato Leonard Capelj began trading full-time and founded Physik Invest to detail his methods, research, and performance in the markets.

Capelj also develops insights around impactful options market dynamics at SpotGamma and is a Benzinga reporter.

Some of his works include conversations with ARK Invest’s Catherine Wood, investors Kevin O’Leary and John Chambers, FTX’s Sam Bankman-Fried, Kai Volatility’s Cem Karsan, The Ambrus Group’s Kris Sidial, among many others.

Disclaimer

In no way should the materials herein be construed as advice. Derivatives carry a substantial risk of loss. All content is for informational purposes only.

Categories
Commentary

Daily Brief For February 25, 2022

Editor’s Note: The Daily Brief is a free glimpse into the prevailing fundamental and technical drivers of U.S. equity market products. Join the 200+ that read this report daily, below!

What Happened

Overnight, equity index futures auctioned sideways, providing some more validation to Thursday morning’s reversal fueled by aggressive short-covering.

Geopolitical tensions and monetary tightening are the two major narratives news outlets are assigning to the volatility. 

The U.S. and its allies applied more sanctions on Russia for its invasion of Ukraine and markets are still pricing around six quarter-point rate hikes by the Fed.

Ahead is data on personal income, consumer spending PCE inflation, core inflation, disposable income, durable goods orders, and core capital equipment orders (8:30 AM ET), University of Michigan sentiment, inflation expectations, and pending home sales (10:00 AM ET).

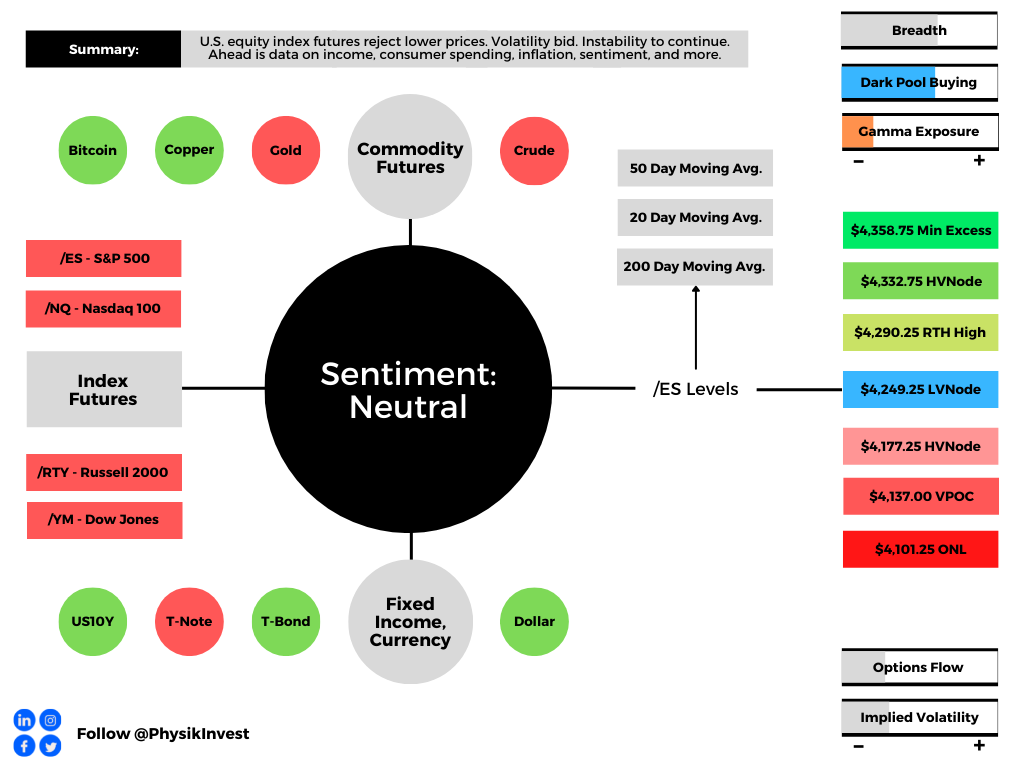
Graphic updated 6:35 AM ET. Sentiment Neutral if expected /ES open is inside of the prior day’s range. /ES levels are derived from the profile graphic at the bottom of the following section. Levels may have changed since initially quoted; click here for the latest levels. SqueezeMetrics Dark Pool Index (DIX) and Gamma (GEX) calculations are based on where the prior day’s reading falls with respect to the MAX and MIN of all occurrences available. A higher DIX is bullish. At the same time, the lower the GEX, the more (expected) volatility. Learn the implications of volatility, direction, and moneyness. SHIFT data used for S&P 500 (INDEX: SPX) options activity. Note that options flow is sorted by the call premium spent; if more positive, then more was spent on call options. Breadth reflects a reading of the prior day’s NYSE Advance/Decline indicator. VIX reflects a current reading of the CBOE Volatility Index (INDEX: VIX) from 0-100.

What To Expect

Fundamental: Must keep it short, today.

Per JPMorgan Chase & Co’s (NYSE: JPM) Marko Kolanovic, “While Equities are down year-to-date due to rising rates, we note that historically the initial volatility around rate liftoff didn’t last and equities made new all-time highs 2-4 quarters out.”

“The start of policy tightening is usually a confirmation that the cycle has legs, rather than the signal of its end. As we don’t see the yield curve inverting or real yields reaching problematic levels this year, it is premature to talk about end-of-cycle worries.”

Graphic: Via Haver. Retrieved from The Market Ear. Macro conditions are more supportive than during the Global Financial Crisis.

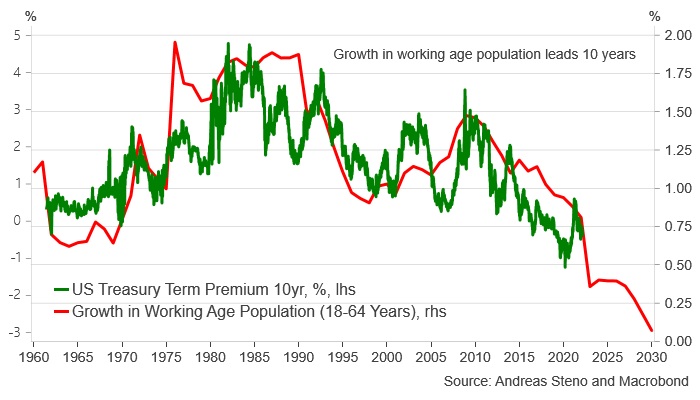
Pursuant to Kolanovic’s remarks, Andreas Steno Larsen of Heimstaden explains that bond yields remain governed by demographics, and this is good news for tech.

“I still think that inflation and bond markets will be governed by other structural trends over the medium term,” he said. “Just look at the growth rate of the working-age population (10 years forward) versus the term premium of US Treasury bonds. The current bond bear market is not standing on structural pillars.”

Graphic: Via Andreas Steno Larsen, “Bond yields remain governed by demographics over the medium-term. Low(er) for longer.”

Positioning: Based on a variety of metrics, some of which were pointed to in yesterday’s commentary, there were no clear signs of capitulation

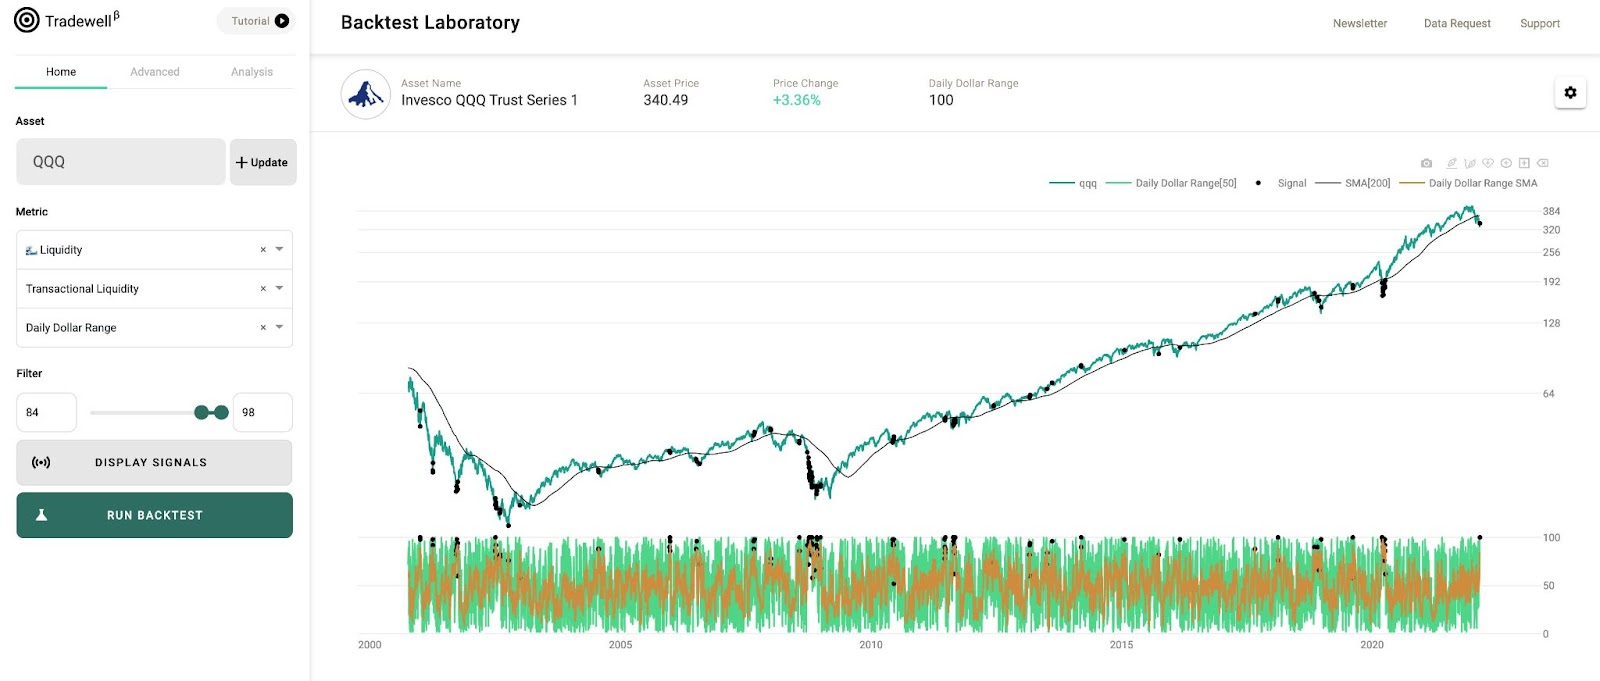
For instance, one of the largest ETF products that track the Nasdaq 100 (QQQ) “has seen persistently illiquidity (daily range / $ volume). There was not much volume (participation) behind the move in price. The 1-week return distribution gets pretty wild.”

Graphic: Via @HalftersPower.

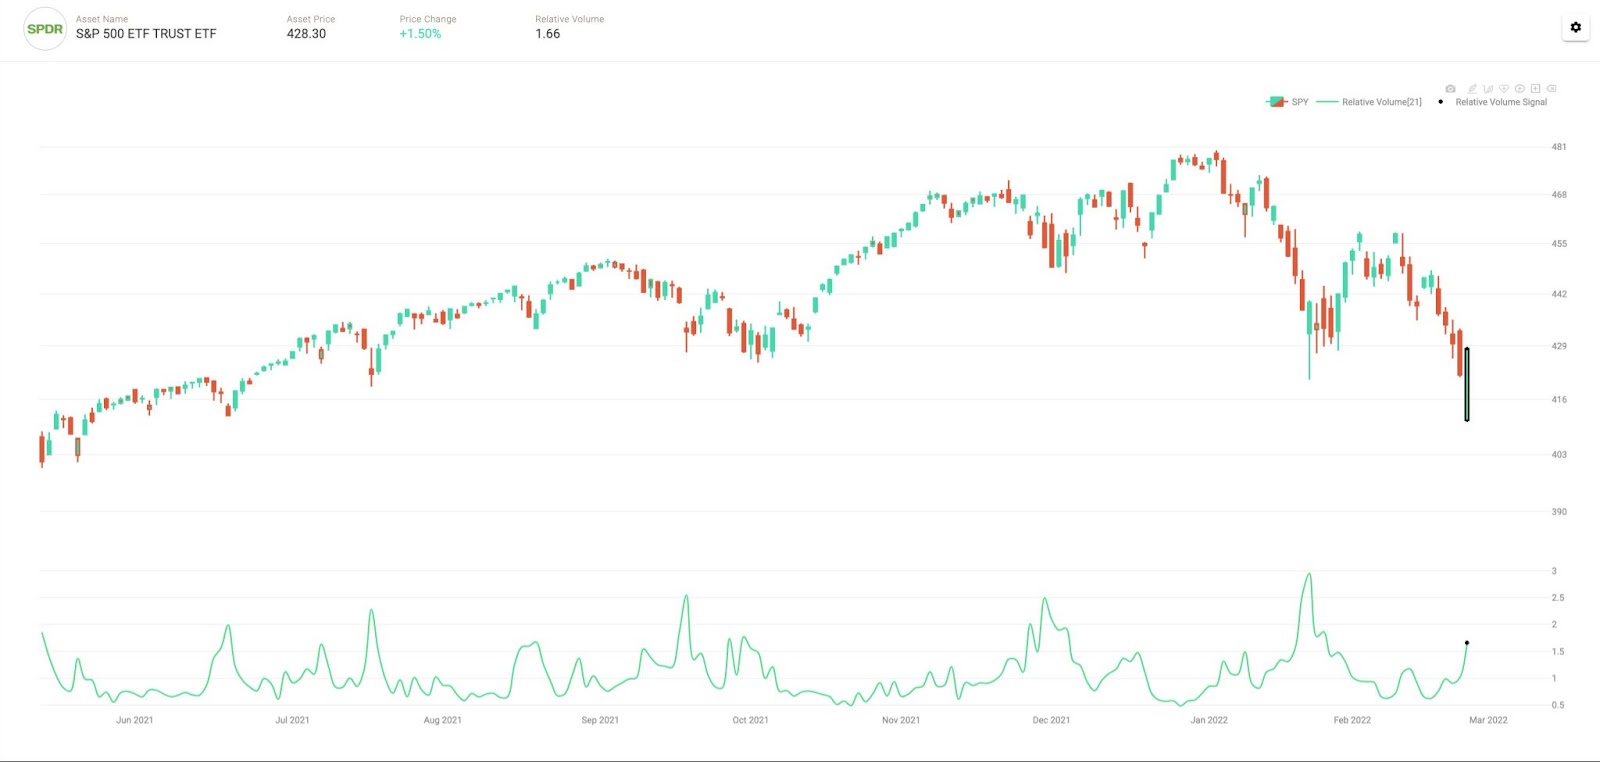
Similarly, “1 Month relative volume (today’s volume / 1-month average) on SPY today (1.66) doesn’t have a capitulatory look to it. Bottoms in the past year occurred at 2+.”

Graphic: Via @HalfersPower.

There was, however, a massive covering of short (negative delta) exposures. The gap lower presented participants a “gift” and many took it as an opportunity to monetize downside bets.

Despite metrics pointing to continued accumulation, and buying support, equity products are in negative gamma wherein the hedging of put-heavy exposures results in whip-saw action (i.e., options counterparties hedge in a manner that exacerbates moves to upside and downside).

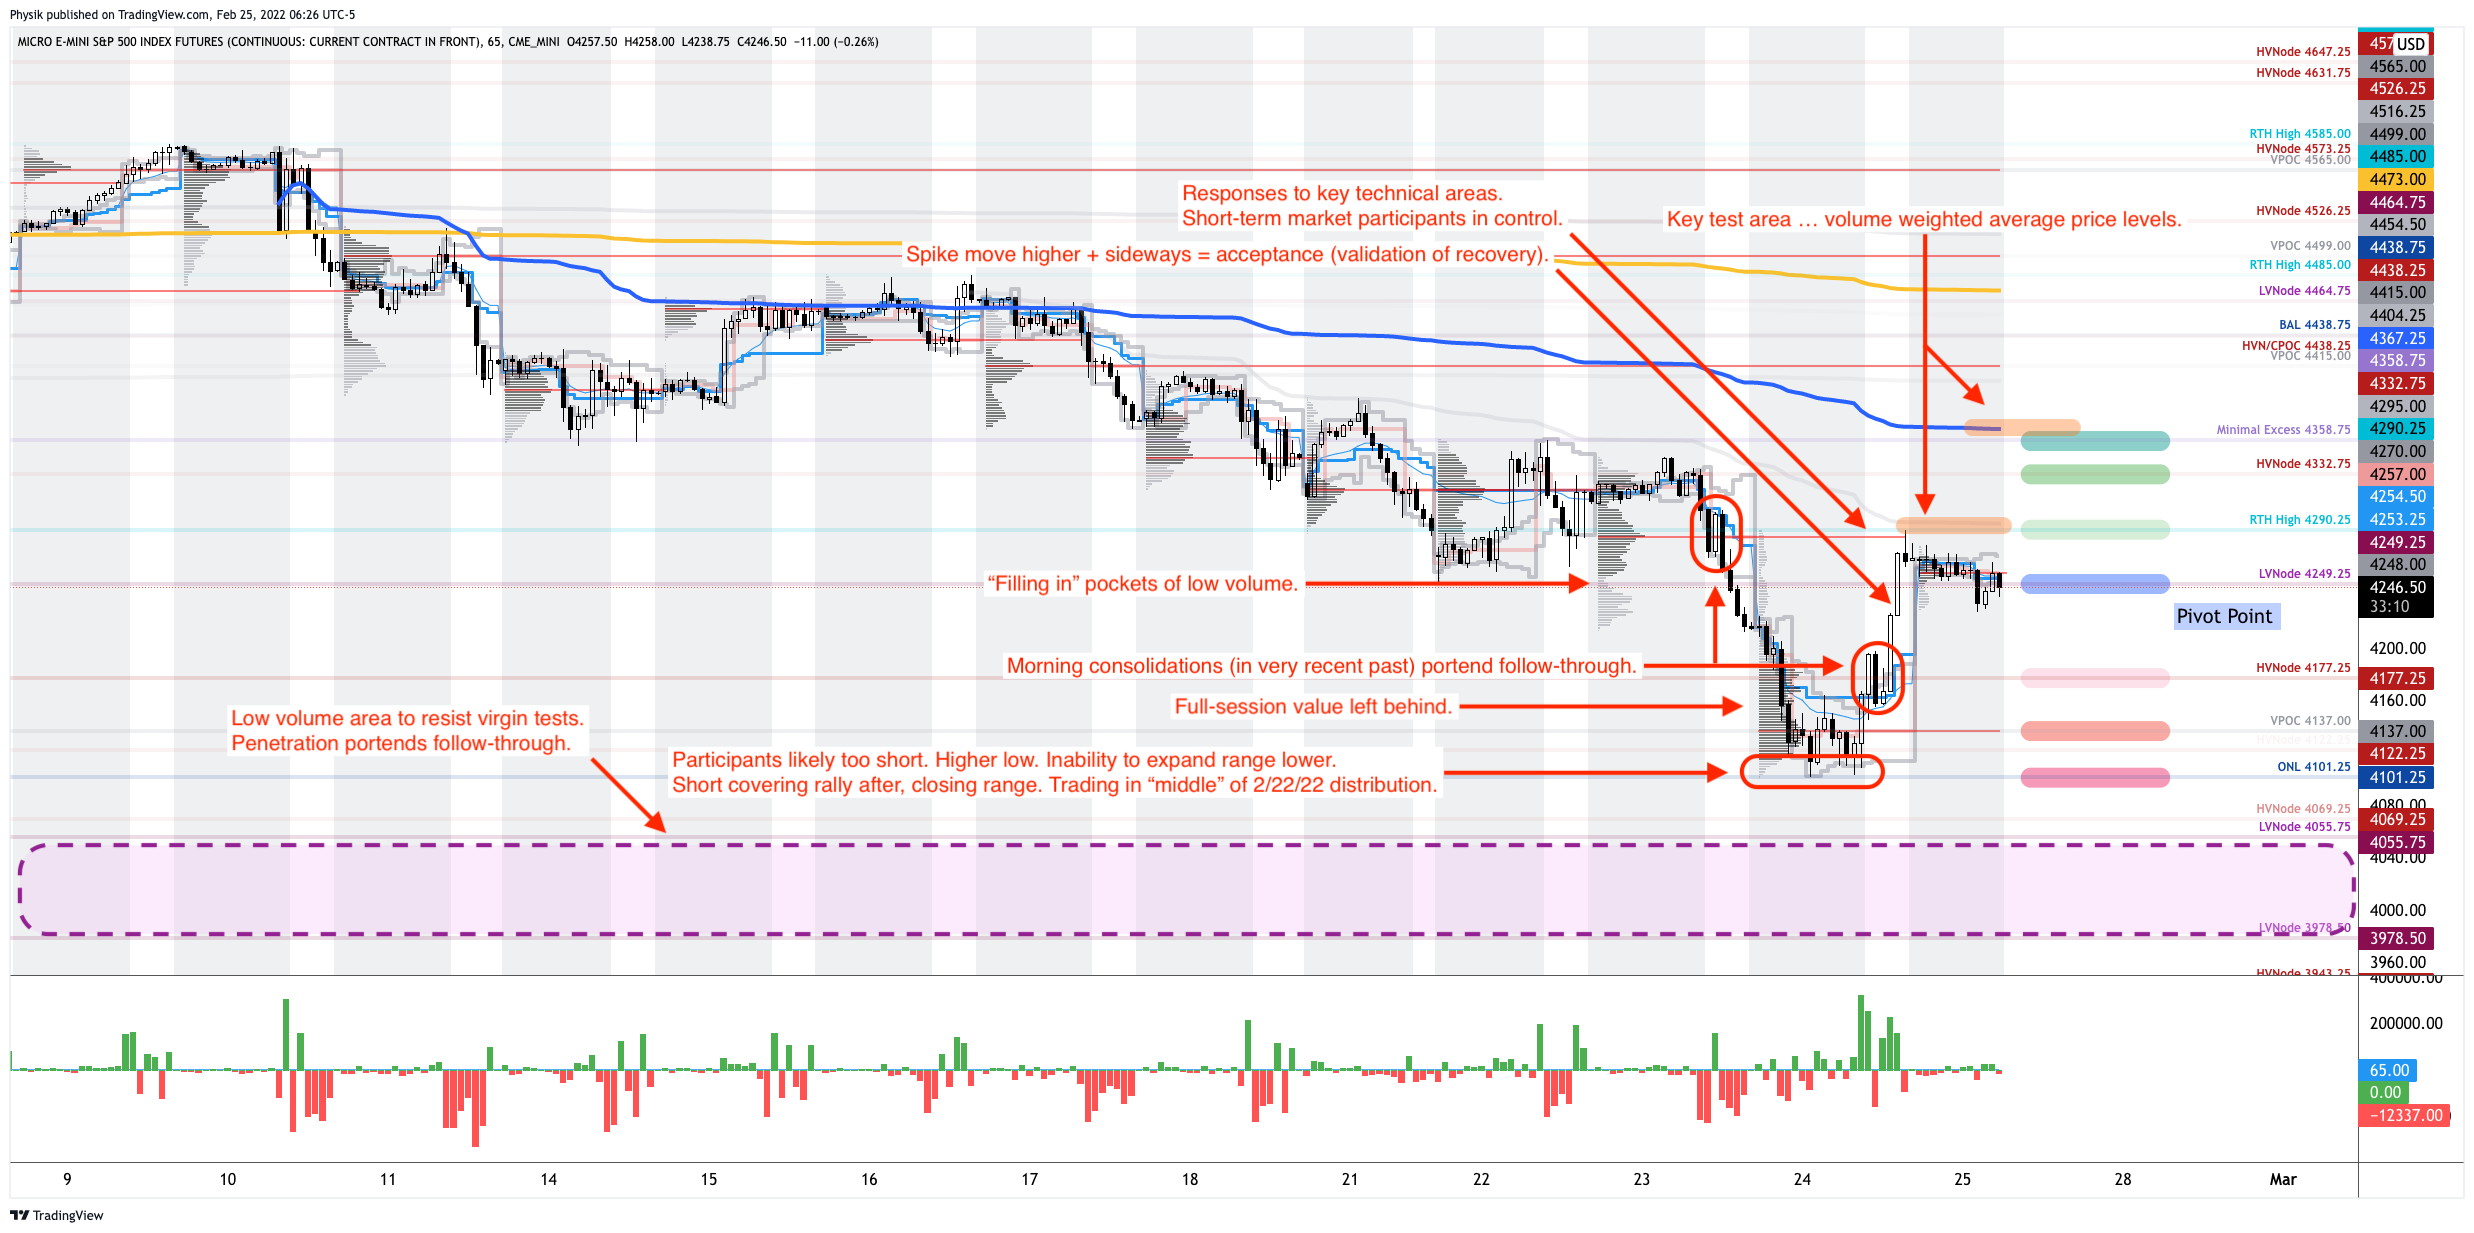
Technical: As of 6:30 AM ET, Friday’s regular session (9:30 AM – 4:00 PM ET), in the S&P 500, will likely open in the upper part of a balanced skewed overnight inventory, inside of prior-range and -value, suggesting a limited potential for immediate directional opportunity.

In the best case, the S&P 500 trades higher; activity above the $4,249.25 low volume area (LVNode) puts in play the $4,290.25 regular trade high (RTH High). Initiative trade beyond the RTH High could reach as high as the $4,332.75 high volume area (HVNode) and $4,358.75 minimal excess high, or higher.

In the worst case, the S&P 500 trades lower; activity below the $4,249.25 LVNode puts in play the $4,177.25 HVNode. Initiative trade beyond the HVNode could reach as low as the $4,137.00 untested point of control (VPOC) and $4,101.25 overnight low (ONL), or lower.

Click here to load today’s key levels into the web-based TradingView charting platform. Note that all levels are derived using the 65-minute timeframe. New links are produced, daily.
Graphic: 65-minute profile chart of the Micro E-mini S&P 500 Futures.

Definitions

Overnight Rally Highs (Lows): Typically, there is a low historical probability associated with overnight rally-highs (lows) ending the upside (downside) discovery process.

Volume Areas: A structurally sound market will build on areas of high volume (HVNodes). Should the market trend for long periods of time, it will lack sound structure, identified as low volume areas (LVNodes). LVNodes denote directional conviction and ought to offer support on any test. 

If participants were to auction and find acceptance into areas of prior low volume (LVNodes), then future discovery ought to be volatile and quick as participants look to HVNodes for favorable entry or exit.

POCs: POCs are valuable as they denote areas where two-sided trade was most prevalent in a prior day session. Participants will respond to future tests of value as they offer favorable entry and exit.

Excess: A proper end to price discovery; the market travels too far while advertising prices. Responsive, other-timeframe (OTF) participants aggressively enter the market, leaving tails or gaps which denote unfair prices.

About

After years of self-education, strategy development, mentorship, and trial-and-error, Renato Leonard Capelj began trading full-time and founded Physik Invest to detail his methods, research, and performance in the markets.

Capelj is also a Benzinga finance and technology reporter interviewing the likes of Shark Tank’s Kevin O’Leary, JC2 Ventures’ John Chambers, FTX’s Sam Bankman-Fried, and ARK Invest’s Catherine Wood, as well as a SpotGamma contributor developing insights around impactful options market dynamics.

Disclaimer

Physik Invest does not carry the right to provide advice.

In no way should the materials herein be construed as advice. Derivatives carry a substantial risk of loss. All content is for informational purposes only.

Categories
Commentary

Daily Brief For February 18, 2022

Editor’s Note: The Daily Brief is a free glimpse into the prevailing fundamental and technical drivers of U.S. equity market products. Join the 200+ that read this report daily, below!

What Happened

Overnight, equity index futures auctioned back up into range after a spike lower from multi-day balance. The overnight response, higher, happened after Russian Foreign Minister Sergei Lavrov agreed to meet U.S. Secretary of State Antony Blinken for talks in Europe next week.

Ahead is data on existing home sales and leading economic indicators (10:00 AM ET), as well as Fed-speak by Christopher Waller (10:15 AM ET), John Williams (11:00 AM ET), and Lael Brainard (1:30 PM ET).

In observance of Washington’s Birthday, markets are closed Monday, February 21, 2022.

Graphic updated 6:45 AM ET. Sentiment Neutral if expected /ES open is inside of the prior day’s range. /ES levels are derived from the profile graphic at the bottom of the following section. Levels may have changed since initially quoted; click here for the latest levels. SqueezeMetrics Dark Pool Index (DIX) and Gamma (GEX) calculations are based on where the prior day’s reading falls with respect to the MAX and MIN of all occurrences available. A higher DIX is bullish. At the same time, the lower the GEX, the more (expected) volatility. Learn the implications of volatility, direction, and moneyness. SHIFT data used for S&P 500 (INDEX: SPX) options activity. Note that options flow is sorted by the call premium spent; if more positive, then more was spent on call options. Breadth reflects a reading of the prior day’s NYSE Advance/Decline indicator. VIX reflects a current reading of the CBOE Volatility Index (INDEX: VIX) from 0-100.

What To Expect

Fundamental: Given the persistence of mechanical responses to key levels, visually-driven, weaker-handed participants (which seldom bear the wherewithal to defend retests) carry a heavier hand in recent price discovery.

The takeaway is that the larger, other time frame (OTF) participants are waiting for more information before committing to substantial expansion of range via large sales or buys.

Information the OTFs are seeking to process and position themselves in accordance with are (but not limited to) geopolitical tensions and contractionary monetary policy.

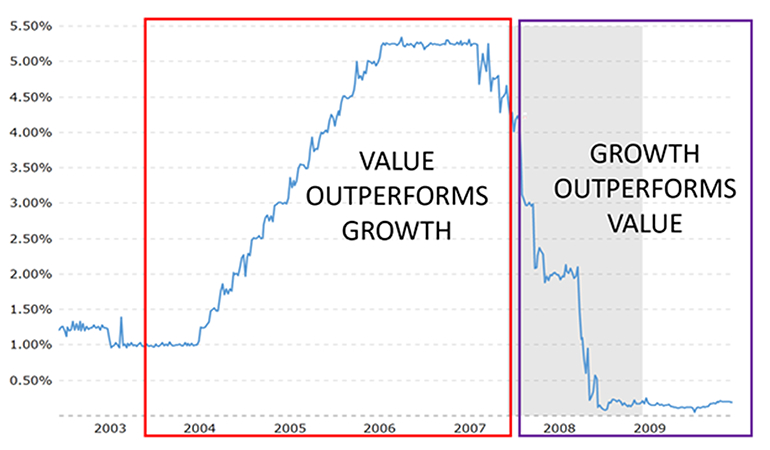
Thursday’s commentary went in-depth on the implications of more severe Fed-action. Mainly, to slow inflation and rid the market of excesses, “a Volcker moment” is needed a strategist said.

Graphic: Via MacroTrends & Cboe Options Institute. “Value stocks started to outperform when the Federal Reserve (under Greenspan) communicated their intent to tighten policy. Value fell out of favor in the middle of 2007 following a UST yield curve inversion and looser monetary policy (under Bernanke).”

The Ambrus Group’s Kris Sidial, and others, expressed their differing sentiments on the issue, given that equities are so intertwined with consumer savings.

“There is no way the fed looks to use additional volatility as a policeman,” he explained. “It’s one of those things that sounds ok in theory but will not work in real-world applications.”

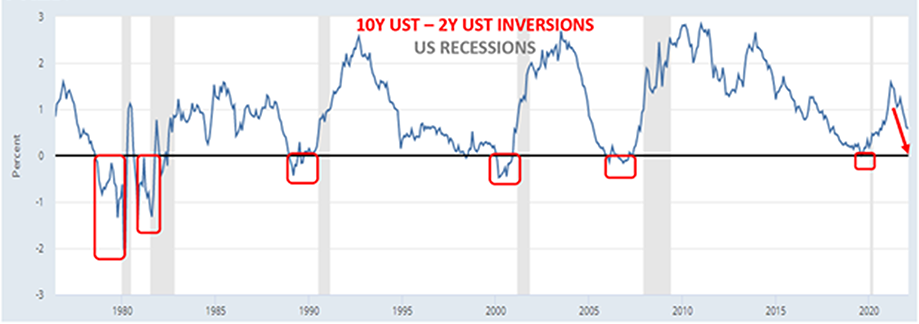
As Moody’s Corporation (NYSE: MCO) puts well, “This cycle is unlike any recent one and, while there are a ton of reasons to be optimistic about the U.S. economy’s near-term prospects, there are also reasons to worry that a recession isn’t far off on the horizon.”

Graphic: Via St. Louis Fed. Taken from Cboe Global Markets Inc (BATS: CBOE). “In fact, a dynamic where short-dated bond yields are higher than longer-dated bonds can reinforce an economic slowdown. The cost of capital is perhaps the most important component for evaluating so many other market relationships. Any investment that involves borrowed money becomes more expensive when the cost of capital increases. More is spent on interest payments. Higher rates incentivize saving (as opposed to consumption) which impacts businesses and the economy as a whole.”

“If the Fed is forced to raise the fed funds rate above its neutral rate to tame inflation, the stage will be set for recession. Also, some Fed officials believe they are falling further behind the curve, which could lead to a more aggressive tightening cycle, a recipe for an economic downturn in 2023 or 2024.”

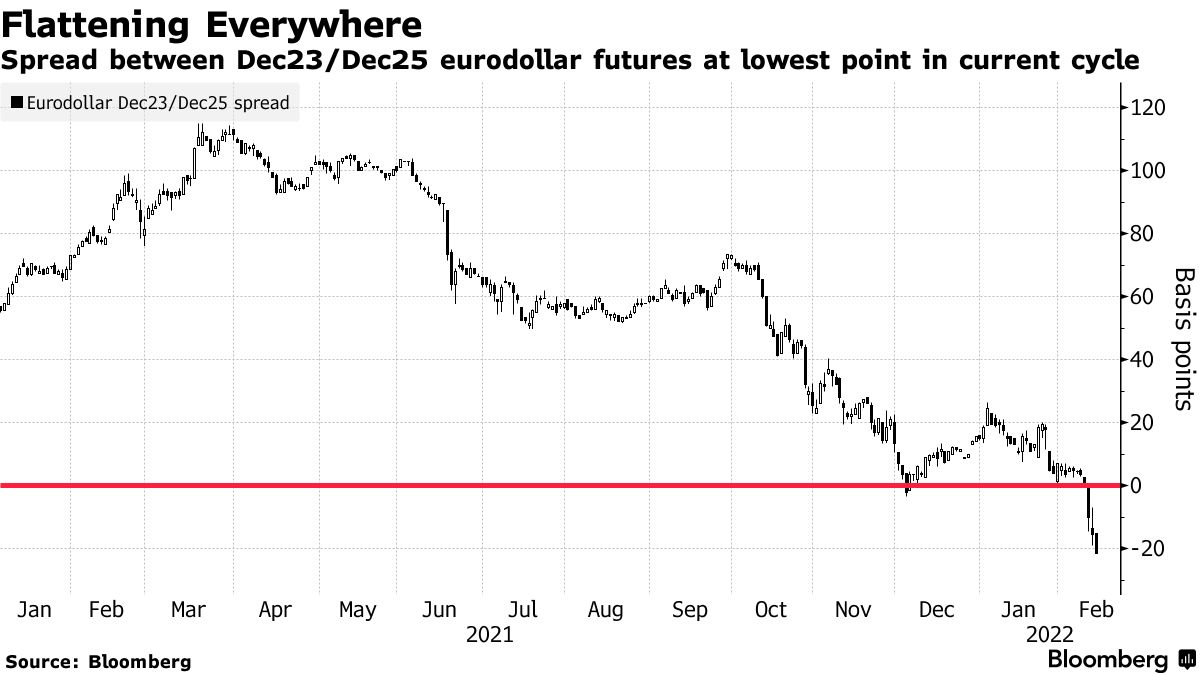
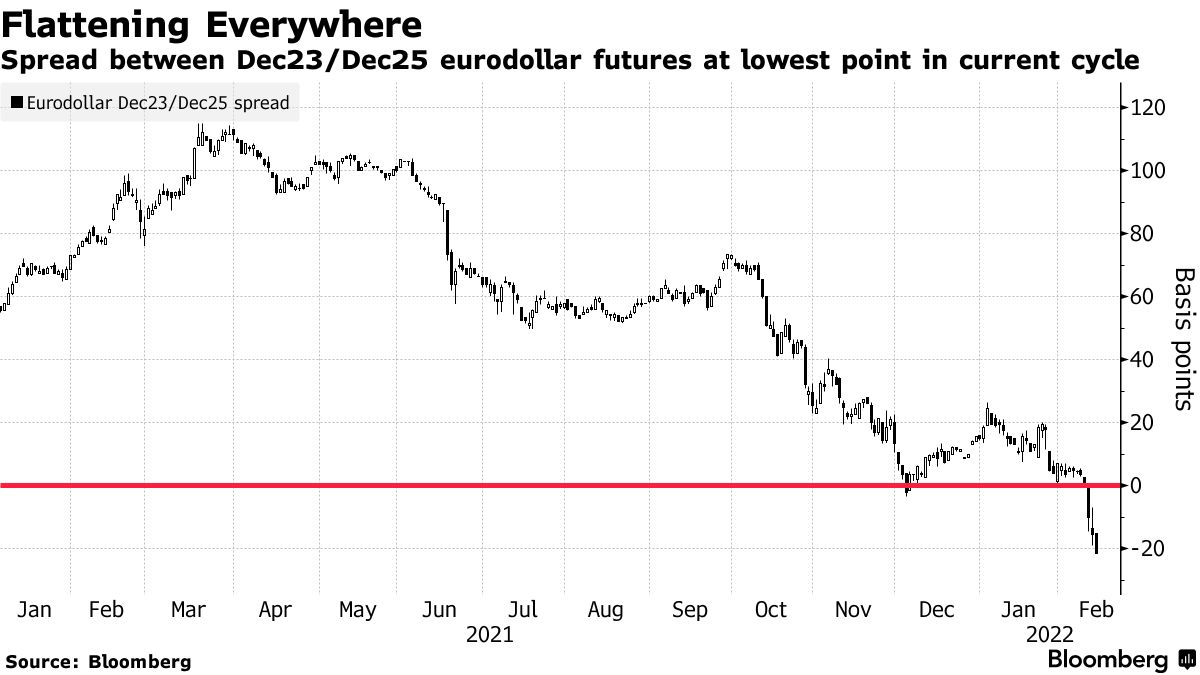
Based on this sentiment, investors have already bet – via the eurodollar futures contract – on the Fed reversing its tightening course in late 2023. The current baseline calls for four 25-basis point rate hikes this year.

Graphic: Via Bloomberg. “In the eurodollar futures markets, the spread between the December 2023 and December 2025 contracts has dropped further into negative territory on Monday — implying a near-25 basis point cut in the federal funds benchmark over this 24-month timeframe.”

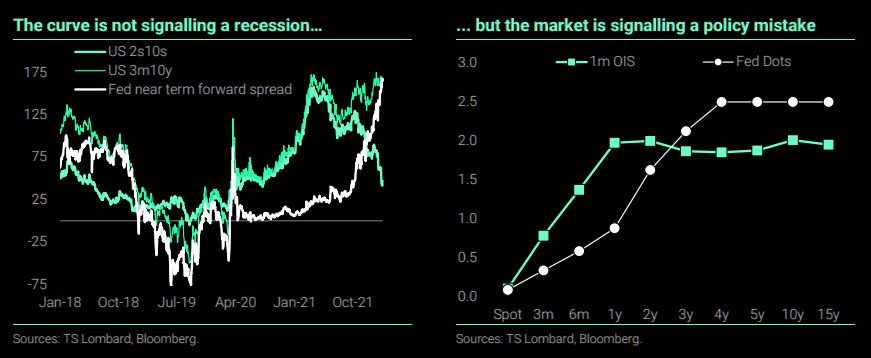
“We, therefore, think that the more likely path is a longer series of 25-basis point increases in the target range for the fed funds rate and we may need to add an additional rate hike to our baseline forecast in March,” Moody’s says in response to more hawkish pricings as a result of market focus on comments by hawkish regional Fed presidents.

Graphic: Via TS Lombard. Taken from The Market Ear. “Flattening is normal when the Fed is tightening. Looking at the past eight hiking cycles, almost every segment of the curve has flattened on average without immediately triggering a recession.”

On that note, Mark Haefele, chief investment officer at UBS Group AG’s (NYSE: UBS) Global Wealth Management arm says that “Despite the recent volatility, it’s important to remember that we are still in an environment of robust economic and earnings growth.”

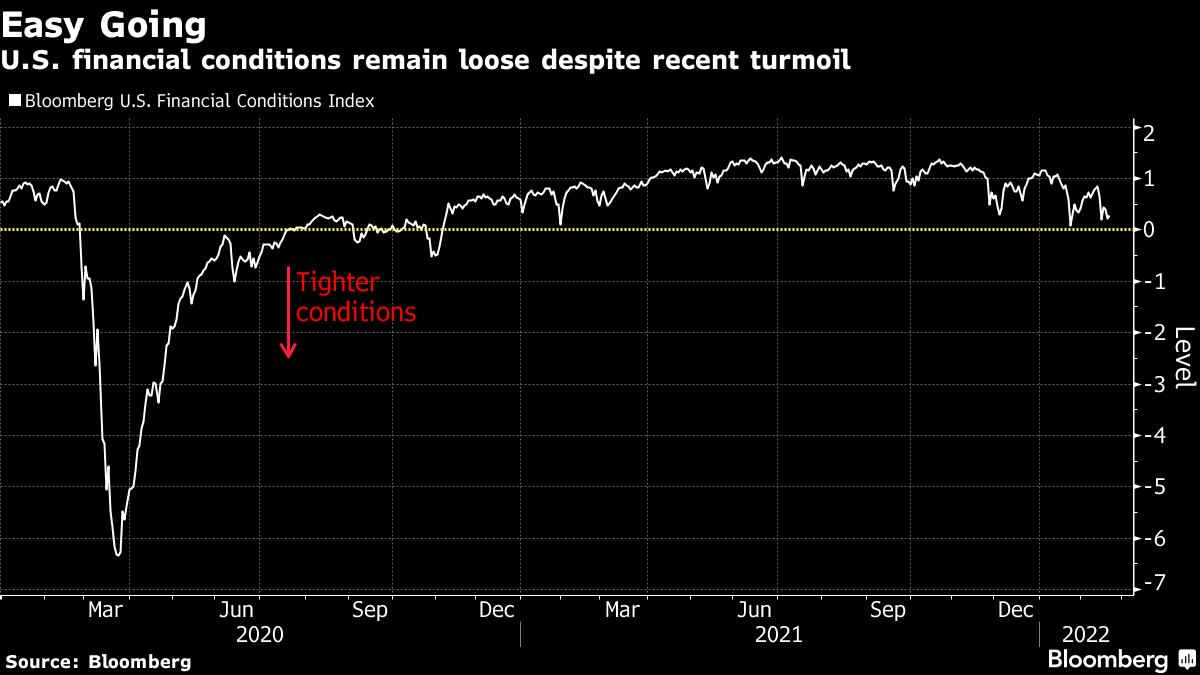
Graphic: Via Bloomberg. “If market dysfunction is reflected in tighter conditions, then this chart shows we’re nowhere near stressed levels — after all, central bank policy globally is historically loose.”

“Our base case we expect upside for equity markets over the balance of the year.”

Positioning: Passive buying flows persist alongside a drop in bearish sentiment readings.

Graphic: Via EPFR, Barclays PLC (NYSE: BCS), and Bloomberg. Taken from The Market Ear

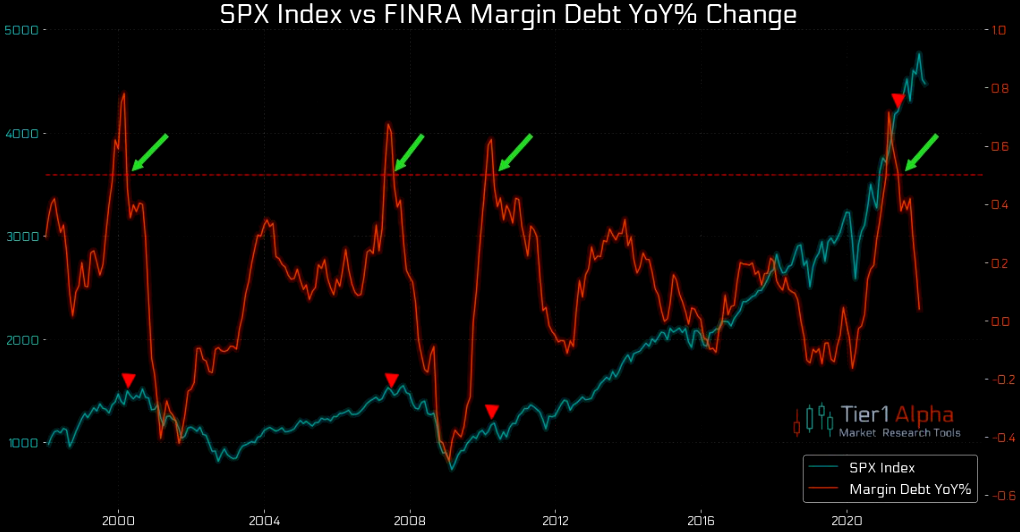
This action is in the face of a collapse in margin debt.

Graphic: Via Tier1Alpha. Taken from The Market Ear. “Margin debt is a big part of the puzzle, but even more important is the “delta” of the margin debt. The YoY % change of FINRA margin debt looks slightly scary.”

In the credit markets, investment-grade spreads are at some of their widest levels since 2020. Per Bloomberg, put option (bets on the downside) open interest in corporate bond ETFs is at an all-time high.

“Rotate into credit now,” Chris Sheldon, the co-head of credit and markets at KKR, explained, taking a contrarian view. “As the rate volatility plays through the market segment, we think high yield could become more attractive very quickly.”

On the single-stock and index-level, options positioning suggests participants should continue to brace for volatility. Participants’ demand for protection (negative delta exposure) has left counterparties (dealers taking the other side and warehousing risk) adding negative delta exposure linearly (via stock and futures sales) to hedge.

To note, owning an option offers someone positive exposure to gamma or convexity (to have profits multiplied if the direction is correct, all else equal). On the other side, though, participants who are short gamma or convexity may have their losses multiplied if incorrect.

Making some naive assumptions on the build-in interest in options strikes at lower prices, we may surmise that dealers are exposed to increased negative gamma exposure. 

To hedge this, if volatility were to remain unchanged, dealers must sell (buy) into weakness (strength) to hedge increasing (decreasing) negative gamma exposure. If volatility rises (drops), then more stock and futures must be sold (bought/covered).

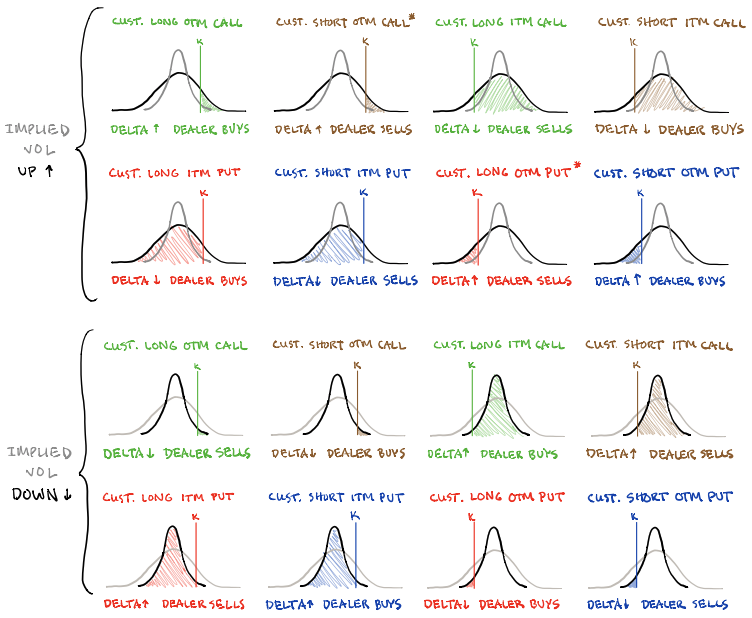
Pictured: SqueezeMetrics highlights implications of volatility, direction, and moneyness.

The monthly options expiration (OPEX) will coincide with the removal of lots of put-heavy exposures. This will decrease the dealers’ positive exposure to delta and make gamma exposures less negative. 

Therefore, absent some exogenous event that increases demand for protection, again, there is the potential for strength, post-OPEX. That’s when that real-money buying, alluded to above, may resolve in higher prices.

Technical: As of 6:30 AM ET, Friday’s regular session (9:30 AM – 4:00 PM ET), in the S&P 500, will likely open in the middle part of a positively skewed overnight inventory, inside of prior-range and -value, suggesting a limited potential for immediate directional opportunity.

Spikes: Spikes mark the beginning of a break from value. Spikes higher (lower) are validated by trade at or above (below) the spike base (i.e., the origin of the spike).

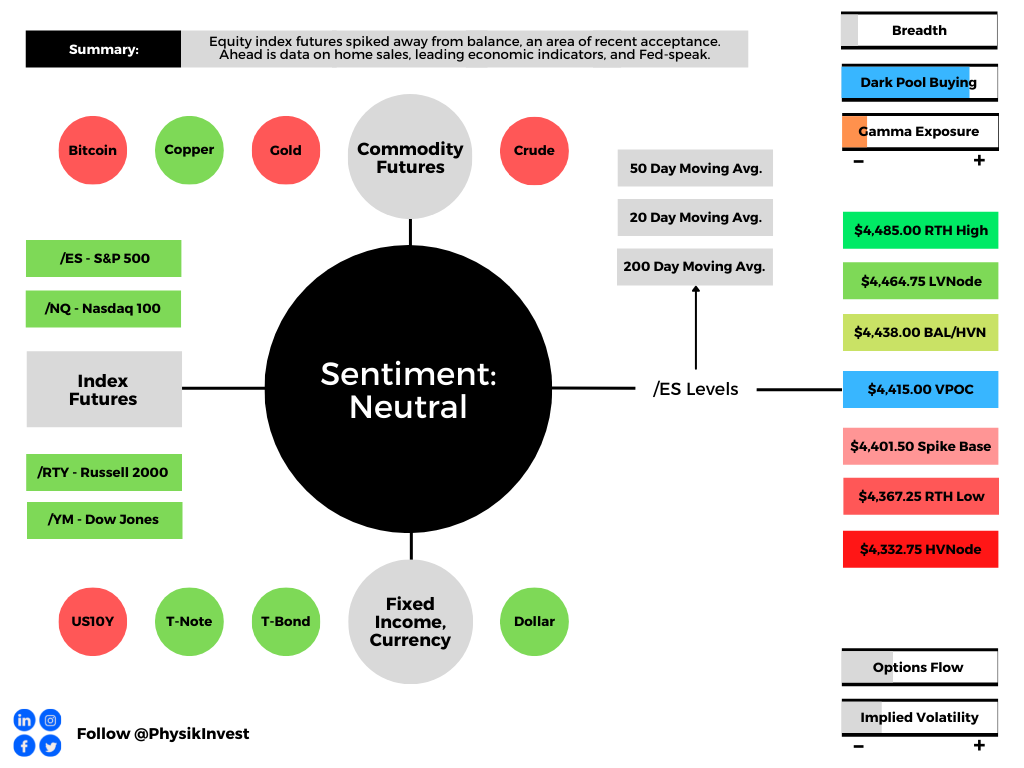
In the best case, the S&P 500 trades higher; activity above the $4,415.00 untested point of control (VPOC) puts in play the $4,438.00 key response area (balance boundary and high volume area). Initiative trade beyond the key response area could reach as high as the $4,464.75 low volume area (LVNode) and $4,485.00 regular trade high (RTH High), or higher.

In the worst case, the S&P 500 trades lower; activity below the $4,415.00 VPOC puts in play the $4,401.50 spike base. Initiative trade beyond the spike base could reach as low as the $4,367.25 regular trade low (RTH Low) and $4,332.75 high volume area (HVNode), or lower.

Click here to load today’s key levels into the web-based TradingView charting platform. Note that all levels are derived using the 65-minute timeframe. New links are produced, daily.
Graphic: 65-minute profile chart of the Micro E-mini S&P 500 Futures.

Definitions

Overnight Rally Highs (Lows): Typically, there is a low historical probability associated with overnight rally-highs (lows) ending the upside (downside) discovery process.

Volume Areas: A structurally sound market will build on areas of high volume (HVNodes). Should the market trend for long periods of time, it will lack sound structure, identified as low volume areas (LVNodes). LVNodes denote directional conviction and ought to offer support on any test. 

If participants were to auction and find acceptance into areas of prior low volume (LVNodes), then future discovery ought to be volatile and quick as participants look to HVNodes for favorable entry or exit.

POCs: POCs are valuable as they denote areas where two-sided trade was most prevalent in a prior day session. Participants will respond to future tests of value as they offer favorable entry and exit.

Options Expiration (OPEX): Traditionally, option expiries mark an end to pinning (i.e, the theory that market makers and institutions short options move stocks to the point where the greatest dollar value of contracts will expire) and the reduction dealer gamma exposure. In recent history, this reset in dealer positioning has been front-run; prior, there was an increase in volatility after the removal of large options positions and associated hedging.

Balance (Two-Timeframe Or Bracket): Rotational trade that denotes current prices offer favorable entry and exit. Balance-areas make it easy to spot a change in the market (i.e., the transition from two-time frame trade, or balance, to one-time frame trade, or trend). 

Modus operandi is responsive trade (i.e., fade the edges), rather than initiative trade (i.e., play the break).

Volume-Weighted Average Prices (VWAPs): A metric highly regarded by chief investment officers, among other participants, for quality of trade. Additionally, liquidity algorithms are benchmarked and programmed to buy and sell around VWAPs.

About

After years of self-education, strategy development, mentorship, and trial-and-error, Renato Leonard Capelj began trading full-time and founded Physik Invest to detail his methods, research, and performance in the markets.

Capelj is also a Benzinga finance and technology reporter interviewing the likes of Shark Tank’s Kevin O’Leary, JC2 Ventures’ John Chambers, FTX’s Sam Bankman-Fried, and ARK Invest’s Catherine Wood, as well as a SpotGamma contributor developing insights around impactful options market dynamics.

Disclaimer

Physik Invest does not carry the right to provide advice.

In no way should the materials herein be construed as advice. Derivatives carry a substantial risk of loss. All content is for informational purposes only.

Categories
Commentary

Daily Brief For February 17, 2022

Editor’s Note: The Daily Brief is a free glimpse into the prevailing fundamental and technical drivers of U.S. equity market products. Join the 200+ that read this report daily, below!

What Happened

Overnight, equity index futures were range-bound inside of a larger developing balance area. 

Volatility remains heightened in the face of conflicting narratives surrounding Russka-Ukraine and action by the Federal Reserve.

Ahead is data on jobless claims, building permits, housing starts, and the Philadelphia Fed Manufacturing Index (8:30 AM ET). 

Fed-speak follows. James Bullard will speak at 11:00 AM ET and Loretta Mester at 5:00 PM ET.

Below we discuss the implications of unprecedented Fed action and a “new Volcker moment,” positioning, and more.

Graphic updated 6:50 AM ET. Sentiment Neutral if expected /ES open is inside of the prior day’s range. /ES levels are derived from the profile graphic at the bottom of the following section. Levels may have changed since initially quoted; click here for the latest levels. SqueezeMetrics Dark Pool Index (DIX) and Gamma (GEX) calculations are based on where the prior day’s reading falls with respect to the MAX and MIN of all occurrences available. A higher DIX is bullish. At the same time, the lower the GEX, the more (expected) volatility. Learn the implications of volatility, direction, and moneyness. SHIFT data used for S&P 500 (INDEX: SPX) options activity. Note that options flow is sorted by the call premium spent; if more positive, then more was spent on call options. Breadth reflects a reading of the prior day’s NYSE Advance/Decline indicator. VIX reflects a current reading of the CBOE Volatility Index (INDEX: VIX) from 0-100.

What To Expect

Fundamental: Minutes of the January 25-26 Federal Open Market Committee meeting were released, yesterday. 

Per Bloomberg, “persistent real wage growth in excess of productivity growth that could trigger inflationary wage-price dynamics,” among other risks, participants responded positively to what seems to be overall “less-hawkish” narratives.

The yield curve steepened (i.e., the spread between long- and short-rates widened), shortly after, given sentiment that the Fed may be less inclined to raise rates than once priced in.

Graphic: Via Bloomberg.

The minutes said, however, that “if inflation does not move down as they expect, it would be appropriate for the Committee to remove policy accommodation at a faster pace than they currently anticipate. Some participants commented on the risk that financial conditions might tighten unduly in response to a rapid removal of policy accommodation.”

Moreover, Fed action today is in opposition to what has been done before

In the past, “the Fed used rate hikes to engineer recessions that generated the slack needed to keep inflation in check (‘opportunistic disinflation’),” Credit Suisse Group AG’s (NYSE: CS) Zoltan Pozsar says.

“With the Fed’s ‘updated dual mandate’ of inclusive low unemployment and the political imperative of redistribution through firmer wage growth at the bottom of the income distribution, the Fed aiming to slow inflation via a recession is unimaginable. Hikes today then are meant to slow inflation without a recession … which is not something that the Fed has ever managed.”

With that, the Fed has “no control over goods prices unless they curb demand through a recession,” the note adds. However, “they have a lot of control over services inflation – which, unlike goods inflation, is mainly a function of domestic nominal factors.”

Components of services inflation include OER and “all other services,” with the former a function of house prices, the latter a function of labor supply.

Both respond to financial conditions which are driven by long-term interest rates or term premia and less so by short rates. Thus far, the market is pricing little impact on long-term interest and mortgage rates, as well as richly-valued equities.

“More is needed,” Pozsar explains. “To slow OER inflation, mortgage rates need to be higher and house prices flat or outright lower. To slow all other services – driven by a shortage of labor – we need more supply of labor, not less demand for it through a recession.”

“We need to slow services inflation by slowing, not killing, wage growth.”

With this policy talk of increasing labor supply with lower asset prices (cutting into the riches of those involved in the equity and alternative asset markets over the recent years), a Fed first, Pozsar thinks we need “a Volcker moment.”

In other terms, as stated yesterday and before, prevailing monetary frameworks and max liquidity promoted a large divergence in price from fundamentals

Graphic: Taken from Lyn Alden. “US economic growth is softening, and that’s when everyone suddenly gets more critical on valuations.”

The growth in passive investing – the effect of increased moneyness among nonmonetary assets – and derivatives trading imply a lot of left-tail risks.

The (pending) removal of this liquidity cuts into “the processes that enforce these bubbles” found in the volatility market and beyond, therefore upping the judgment of valuations.

“A new Volcker moment should also mean a radical change in the Fed’s strategy and involve going from targeting rates to targeting quantities once again – not the quantity of reserves in the banking system, but the quantity of duration in the market-based shadow banking system to jolt all sorts or risk premia higher.”

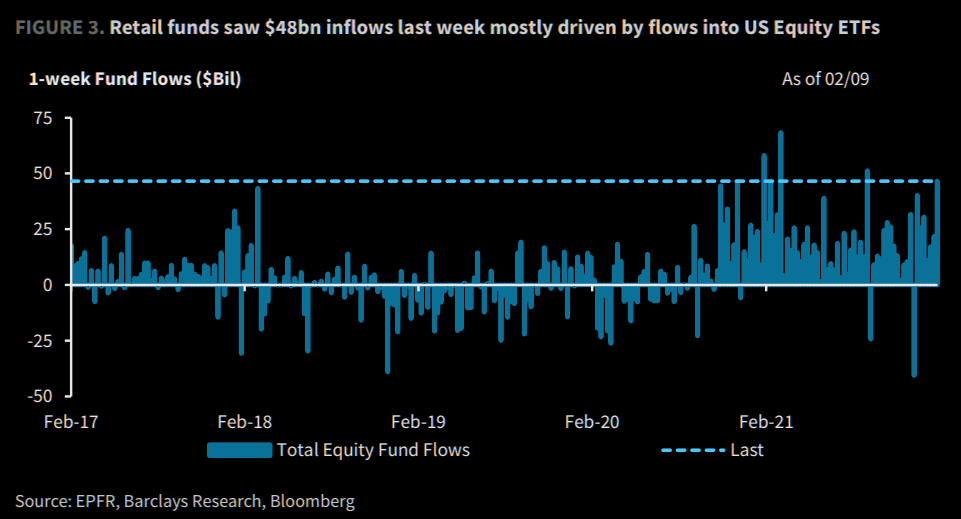
Positioning: Pursuant to comments in prior newsletters regarding “accumulation” and the rotation out of money market funds, according to Barclays PLC (NYSE: BCS), retail poured $48 billion into U.S. Equity ETFs last week.

Graphic: Via EPFR, Barclays, and Bloomberg. Taken from The Market Ear.

That is as, per The Market Ear, “vol[atility] targeting players, the crowd adjusting their positions as volatility is moving, have decreased their longs as [volatility has] moved higher.”

Graphic: Via Barclays and Bloomberg. Taken from The Market Ear.

In the face of this accumulation and prospects of buying in cases where volatility compresses, per JPMorgan Chase & Co’s (NYSE: JPM) Nikolaos Panigirtzoglou, however, “There is a good chance that 2022, in terms of equity fund flows, will look like 2018.”

Graphic: Per Panigirtzoglou, flows “started very strong in continuation of the previous year, but at some point that flow picture will be wilting.”

“As the Fed raises rates and other central banks are following the Fed, the risk is that at some point equity fund flows dissipate, or even turn negative,” he added. “I would not be surprised if we could have some sort of a repeat of 2018.”

On a micro level, in response to the FOMC minutes, participants sold puts and bought calls. Into the end-of-day, call buyers likely monetized their bets, while put selling continued. 

Graphic: SpotGamma’s Hedging Impact of Real-Time Options (HIRO) indicator.

The compression of volatility, coupled with that aforementioned trade, bolsters attempts higher.

Moreover, in the slightly bigger (week- and month-long picture), according to SpotGamma, “post-OPEX, the removal of linear short (-delta) hedges [to put-heavy exposures] may further bolster attempts higher.” 

On the other hand, “The removal of downside (put) protection may also open the door for weakness in a case where some outside (fundamental) event solicits real-money selling and a new demand for protection.”

Graphic: The “Biggest tail risk to SPX isn’t any macro data/virus/war but its own options market.”

Technical: As of 6:30 AM ET, Thursday’s regular session (9:30 AM – 4:00 PM ET), in the S&P 500, will likely open in the middle part of a negatively skewed overnight inventory, inside of prior-range and -value, suggesting a limited potential for immediate directional opportunity.

Balance (Two-Timeframe Or Bracket): Rotational trade that denotes current prices offer favorable entry and exit. Balance-areas make it easy to spot a change in the market (i.e., the transition from two-time frame trade, or balance, to one-time frame trade, or trend). 

Modus operandi is responsive trade (i.e., fade the edges), rather than initiative trade (i.e., play the break).

In the best case, the S&P 500 trades higher; activity above the $4,438.00 key response area (BAL/ONL/HVNode) puts in play the $4,485.00 regular trade high (RTH High). Initiative trade beyond the RTH High could reach as high as the $4,499.00 untested point of control (VPOC) and $4,526.25 high volume area (HVNode), or higher.

In the worst case, the S&P 500 trades lower; activity below the $4,438.00 key response area (BAL/ONL/HVNode) puts in play the $4,421.75 low volume area (LVNode). Initiative trade beyond the LVNode could reach as low as the $4,393.75 HVNode and $4,365.00 POC, or lower.

Click here to load today’s key levels into the web-based TradingView charting platform. Note that all levels are derived using the 65-minute timeframe. New links are produced, daily.
Graphic: 65-minute profile chart of the Micro E-mini S&P 500 Futures.

Definitions

Overnight Rally Highs (Lows): Typically, there is a low historical probability associated with overnight rally-highs (lows) ending the upside (downside) discovery process.

Volume Areas: A structurally sound market will build on areas of high volume (HVNodes). Should the market trend for long periods of time, it will lack sound structure, identified as low volume areas (LVNodes). LVNodes denote directional conviction and ought to offer support on any test. 

If participants were to auction and find acceptance into areas of prior low volume (LVNodes), then future discovery ought to be volatile and quick as participants look to HVNodes for favorable entry or exit.

POCs: POCs are valuable as they denote areas where two-sided trade was most prevalent in a prior day session. Participants will respond to future tests of value as they offer favorable entry and exit.

About

After years of self-education, strategy development, mentorship, and trial-and-error, Renato Leonard Capelj began trading full-time and founded Physik Invest to detail his methods, research, and performance in the markets.

Capelj is also a Benzinga finance and technology reporter interviewing the likes of Shark Tank’s Kevin O’Leary, JC2 Ventures’ John Chambers, FTX’s Sam Bankman-Fried, and ARK Invest’s Catherine Wood, as well as a SpotGamma contributor developing insights around impactful options market dynamics.

Disclaimer

Physik Invest does not carry the right to provide advice.

In no way should the materials herein be construed as advice. Derivatives carry a substantial risk of loss. All content is for informational purposes only.
Categories
Commentary

Daily Brief For February 11, 2022

Editor’s Note: The Daily Brief is a free glimpse into the prevailing fundamental and technical drivers of U.S. equity market products. Join the 200+ that read this report daily, below!

What Happened

Overnight, equity index futures continued lower after the hottest inflation reading in decades and hawkish (i.e., favoring contractionary policy) Fed-speak by St. Louis Fed Chair James Bullard.

Ahead is data on University of Michigan sentiment and inflation expectations (10:00 AM ET).

Graphic updated 6:30 AM ET. Sentiment Risk-Off if expected /ES open is below the prior day’s range. /ES levels are derived from the profile graphic at the bottom of the following section. Levels may have changed since initially quoted; click here for the latest levels. SqueezeMetrics Dark Pool Index (DIX) and Gamma (GEX) calculations are based on where the prior day’s reading falls with respect to the MAX and MIN of all occurrences available. A higher DIX is bullish. At the same time, the lower the GEX, the more (expected) volatility. Learn the implications of volatility, direction, and moneyness. SHIFT data used for S&P 500 (INDEX: SPX) options activity. Note that options flow is sorted by the call premium spent; if more positive, then more was spent on call options. Breadth reflects a reading of the prior day’s NYSE Advance/Decline indicator. VIX reflects a current reading of the CBOE Volatility Index (INDEX: VIX) from 0-100.

What To Expect

Fundamental: Bonds and equities were sold, yesterday.

This is after the hottest inflation reading in four decades and comments by the Fed’s Bullard that the central bank should hike rates by 100 basis points over the next three meetings.

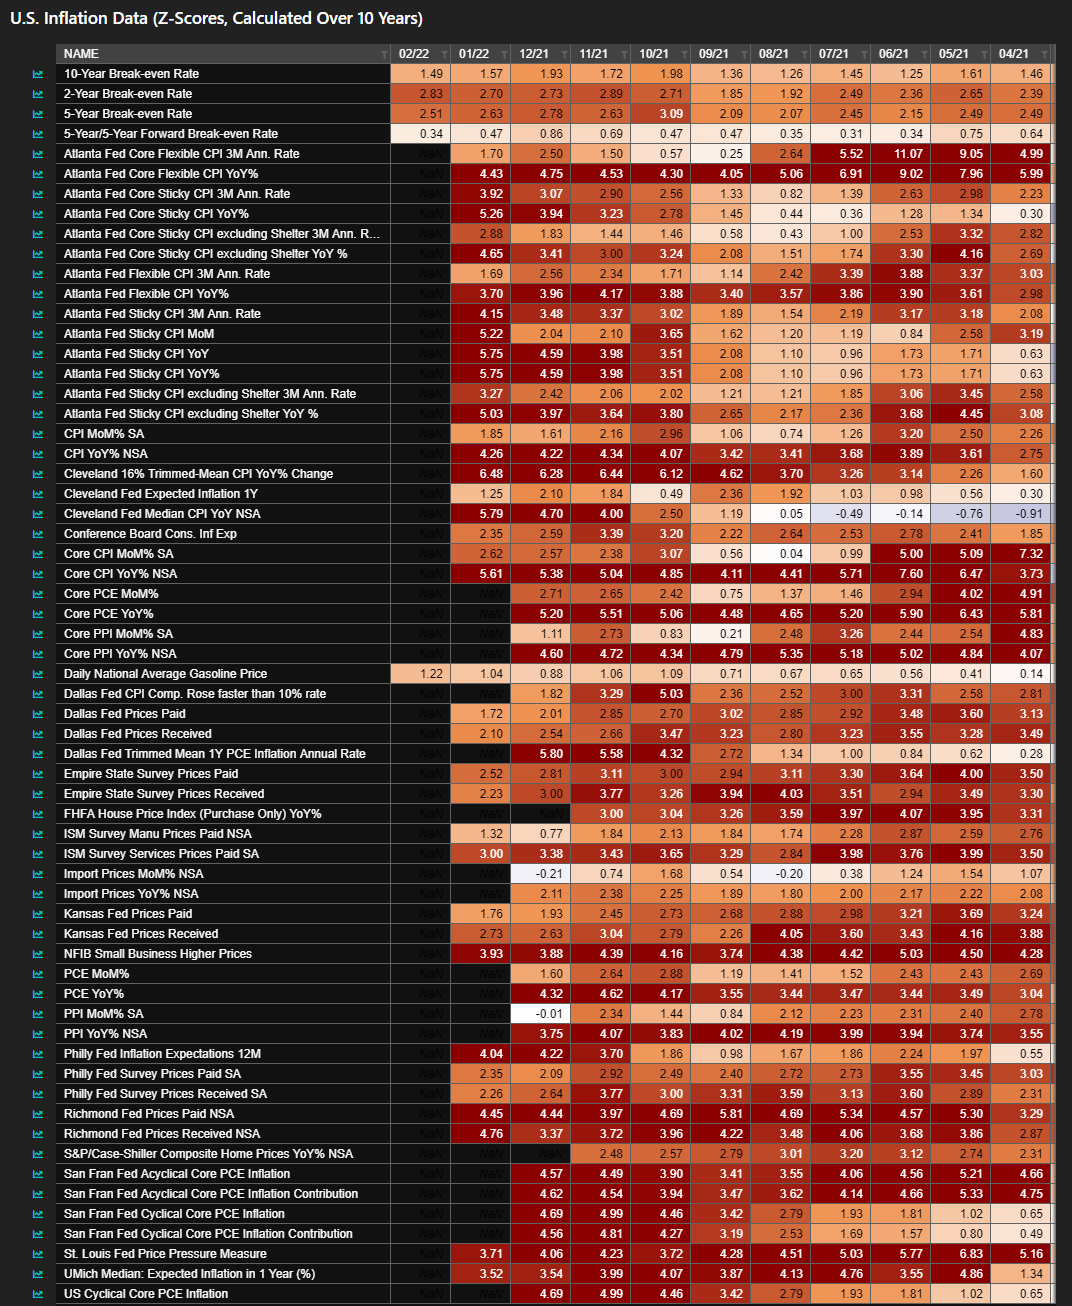
Graphic: Via Bloomberg, “This is a heat map produced by the Bloomberg ECAN function, and it shows every indicator relevant to U.S. inflation now well above its recent mean.”

“Bullard’s plan involves spreading the increases over three meetings, shrinking the Fed’s balance sheet starting in the second quarter and then deciding on the path of rates in the second half based on updated data,” Bloomberg explained

“Markets boosted bets on rate hikes, pricing a full percentage-point increase over three meetings, which would require the first 50 basis-point increase since 2000 unless a move was made between Fed meetings.”

Graphic: Via Bloomberg.

Further, though this FOMC participant’s more hawkish tilt differs from what the entire committee has committed to, so long as “the market expects it, … the odds of a 50bp hike in March or May are higher.”

This trend in expectations has been worsening with each major macroeconomic event in 2022. The Fed’s Minutes, FOMC meeting, Nonfarm Payrolls, and CPI have all played a part in the disruption of long-term trends in yields which has a negative impact on valuations, to put simply.

Though earnings growth may offset the negative valuation impact of higher rates, as discussed in detail days ago, the yield curve – e.g., spread between 10- and 2-year – is on its way toward an inversion, as is the yield curve measure involving overnight index swaps (OIS).

For context, per Reuters, an “OIS transaction involves exchanging an overnight rate such as the federal funds rate for a fixed one. For instance, in a U.S. 2-year OIS swap, one party to the transaction receives a fixed two-year rate in exchange for paying the fed funds rate daily over the next two years.”

The OIS market is also a reflection of traders’ expectations for rates. An inversion (which may signal the expectation of aggressive action against inflation that could also stifle economic growth) previously occurred in July 2018. Months later, markets sold and the Fed cut rates. 

Per Alfonso Peccatiello, the former head of a $20 billion investment portfolio and author of The Macro Compass: The inversion of the OIS curve may worsen a downturn in the economy as short-term refinancing credit becomes more expensive and markets price weaker long-term growth.

The OIS curve is “a cleaner indication of yield curve inversions,” Peccatiello added. 

Positioning: Bonds down. Equities down. What the heck? 

This newsletter has talked about this dynamic in the past and will borrow from that, below.

In short, over the past 40 or so years, monetary policy was used as a crutch to support the economy. This promoted deflation, innovation, and the subsequent rise in valuations.

With rates near zero and lifting, that’s a headwind; coupled with participants’ increased exposure to rate and equity market risk, which can play into cross-market hedging and de-leveraging cascades, 60/40 turns into somewhat of a poor hedge.

Why? Higher rates have the potential to decrease the present value of future earnings, making stocks, especially those that are high growth, less attractive.

According to a note published by Andy Constan of Damped Spring Advisors, “The lack of additional liquidity provided by Fed purchase will also remove a damper for the market and the economy keeping asset volatility well bid, while also causing asset diversification benefit to fall, generating rising portfolio volatility and the risk demanded to hold assets.”

“Now, with the Fed poised to hike interest rates to combat raging inflation, the bond-stock relationship could be upended,” Bloomberg explains

“At stake are trillions of dollars that are managed at risk parity funds, balanced mutual funds, and pension funds that follow the framework of 60/40 asset allocation.”

Why mention any of this? Well, it forces us to look elsewhere for protection. 

In this case, the growing asset class of volatility, so to speak, is that protection. Investors are aware of both the protective and speculative efficiency afforded to them by options and that is the primary reason option volumes are so comparable to stock volumes, now.

Notwithstanding, with option volumes higher, related hedging flows can represent an increased share of volume in underlying stocks. Therefore, the correlation of stock moves, versus options activity, is more pronounced.

To put it simply, we can look to the options market for clues on where to next, for lack of better phrasing. So, let’s do that!

Heading into Thursday’s session, participants were committing capital to bets on lower volatility.

The counterparties to this short volatility trade were long; if the market were to trade higher (lower), they would sell (buy) futures against increased (decreased) positive delta exposure.

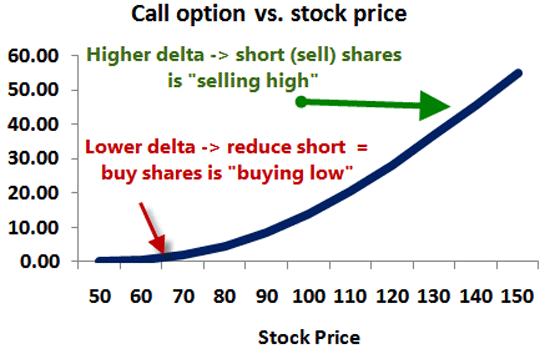
Graphic: A rudimentary example of what is involved in hedging a long call option. 

However, Thursday’s post-CPI trade disrupted the balance of trade; lower prices and demand for protection, in the face of lower levels of “on-screen liquidity,” solicited dealer selling to hedge increased exposure to the positive delta from demanded short-dated, highly convex options.

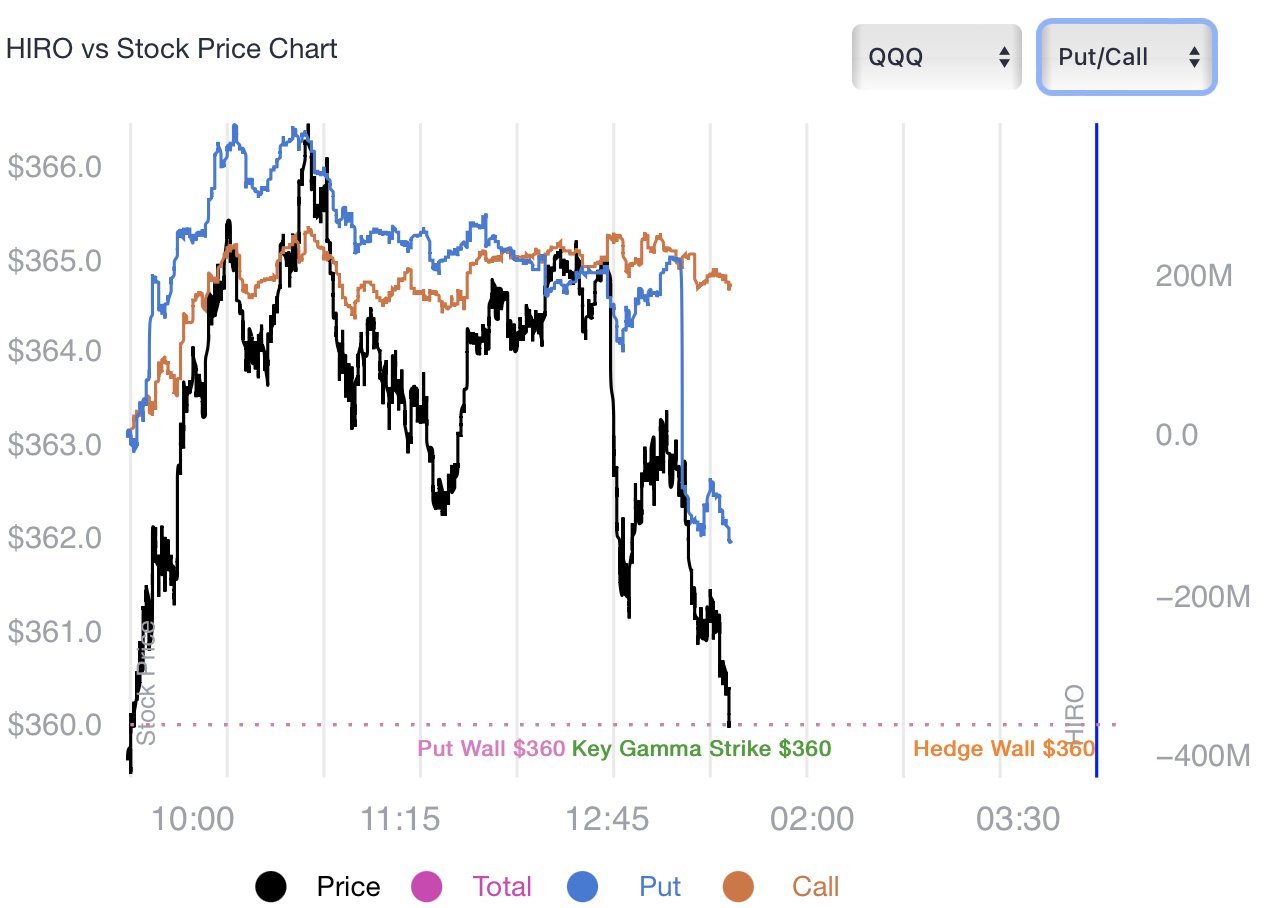
Graphic: SpotGamma’s Hedging Impact of Real-Time Options (HIRO) indicator; “customers bought put options (a negative delta trade) leaving dealers short (a positive delta trade).” 

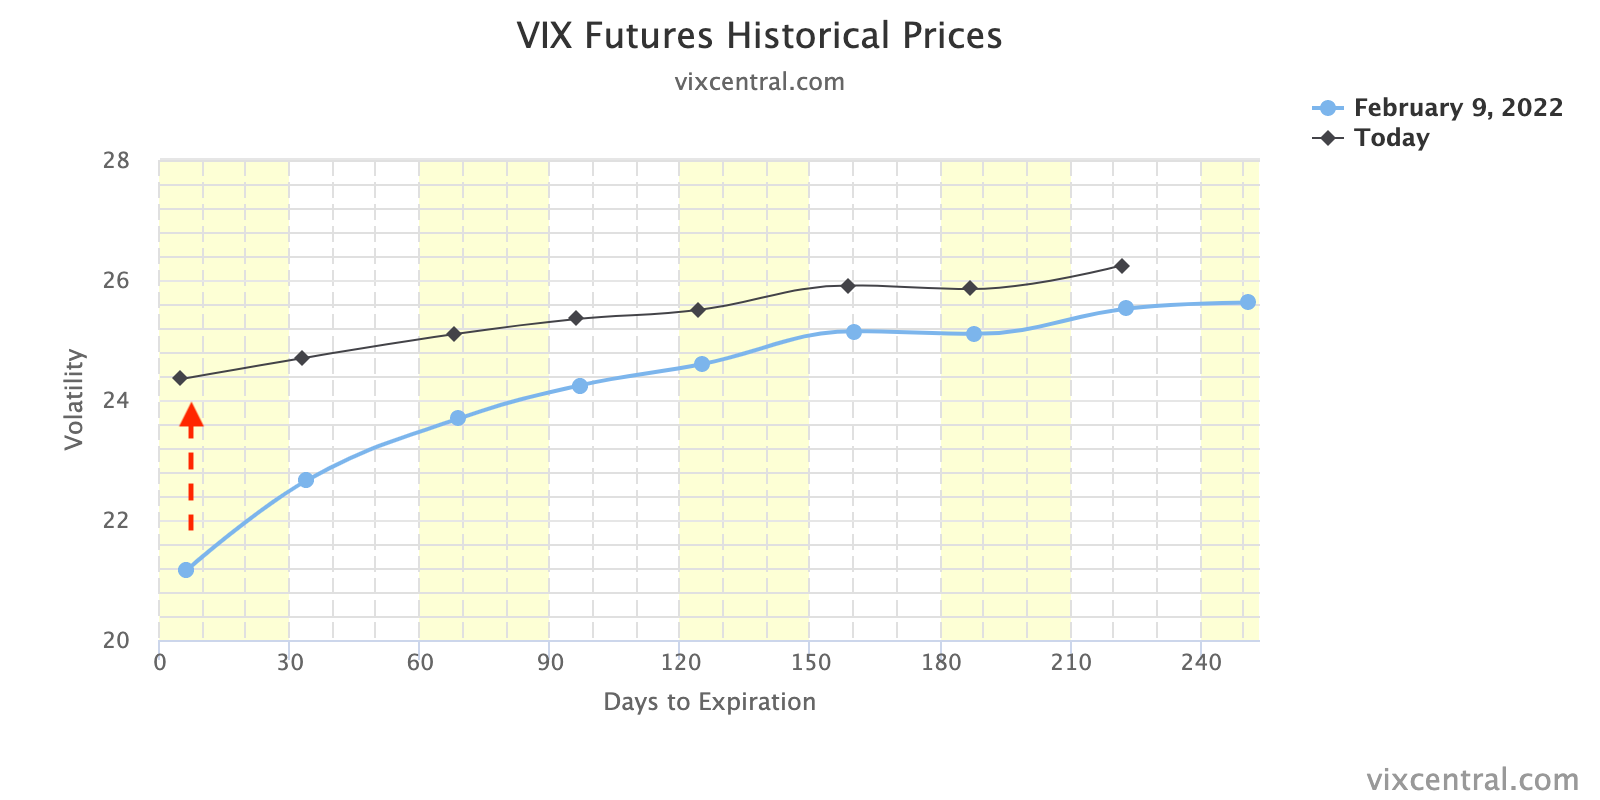
The demand for shorter-dated protection is better visualized by the VIX term structure which shifted markedly at the front-end, yesterday.

Graphic: VIX term structure shifts higher (dramatically at the front-end).

As direction (delta) and volatility (vega) are inputs to the pricing of options, lower prices and higher volatility (a reflection of fear and demand for protection) will mark options higher. Hedging pressures will exacerbate weakness, as a result of real selling (as talked about above), at the index and single-stock level.

Graphic: SqueezeMetrics details the implications of customer activity in the options market, on the underlying’s order book.

Taking into account options positioning, versus buying pressure (measured via short sales or liquidity provision on the market-making side), positioning metrics remain positively skewed.

Graphic: Data SqueezeMetrics. Graph via Physik Invest.

To conclude, the dip lower and demand for protection could serve to prime the market for upside (when volatility starts to compress again and counterparties unwind hedges thus supporting any attempt higher). All eyes are on next week’s monthly options expiration (OPEX). We will discuss the implications of this, later.

Technical: As of 6:30 AM ET, Friday’s regular session (9:30 AM – 4:00 PM ET), in the S&P 500, will likely open in the middle-to-lower part of a negatively skewed overnight inventory, inside of prior-range and -value, suggesting a limited potential for immediate directional opportunity.

In the best case, the S&P 500 trades higher; activity above the $4,473.00 point of control (POC) puts in play the $4,526.25 high volume area (HVNode). Initiative trade beyond the HVNode could reach as high as the $4,565.00 untested POC (VPOC) and $4,585.00 regular trade high (RTH High), or higher.

In the worst case, the S&P 500 trades lower; activity below the $4,473.00 POC puts in play the key response area at $4,438.75 (BAL/ONL/HVNode). Initiative trade beyond the key response area could reach as low as the $4,393.75 HVNode and $4,365.00 VPOC, or lower.

Click here to load today’s key levels into the web-based TradingView charting platform. Note that all levels are derived using the 65-minute timeframe. New links are produced, daily.
Graphic: 65-minute profile chart of the Micro E-mini S&P 500 Futures.

Definitions

Overnight Rally Highs (Lows): Typically, there is a low historical probability associated with overnight rally-highs (lows) ending the upside (downside) discovery process.

Volume Areas: A structurally sound market will build on areas of high volume (HVNodes). Should the market trend for long periods of time, it will lack sound structure, identified as low volume areas (LVNodes). LVNodes denote directional conviction and ought to offer support on any test. 

If participants were to auction and find acceptance into areas of prior low volume (LVNodes), then future discovery ought to be volatile and quick as participants look to HVNodes for favorable entry or exit.

POCs: POCs are valuable as they denote areas where two-sided trade was most prevalent in a prior day session. Participants will respond to future tests of value as they offer favorable entry and exit.

Options Expiration (OPEX): Traditionally, option expiries mark an end to trend or pinning (i.e, the theory that market makers and institutions short options move stocks to the point where the greatest dollar value of contracts will expire) and the reset in dealer gamma exposure.

Volume-Weighted Average Prices (VWAPs): A metric highly regarded by chief investment officers, among other participants, for quality of trade. Additionally, liquidity algorithms are benchmarked and programmed to buy and sell around VWAPs.

About

After years of self-education, strategy development, mentorship, and trial-and-error, Renato Leonard Capelj began trading full-time and founded Physik Invest to detail his methods, research, and performance in the markets.

Capelj is also a Benzinga finance and technology reporter interviewing the likes of Shark Tank’s Kevin O’Leary, JC2 Ventures’ John Chambers, FTX’s Sam Bankman-Fried, and ARK Invest’s Catherine Wood, as well as a SpotGamma contributor developing insights around impactful options market dynamics.

Disclaimer

Physik Invest does not carry the right to provide advice.

In no way should the materials herein be construed as advice. Derivatives carry a substantial risk of loss. All content is for informational purposes only.
Categories
Commentary

Daily Brief For February 10, 2022

Editor’s Note: The Daily Brief is a free glimpse into the prevailing fundamental and technical drivers of U.S. equity market products. Join the 200+ that read this report daily, below!

What Happened

Overnight, equity index futures auctioned off recovery highs, with bonds. Most commodity products held a bid, as did measures of equity index implied volatility (IV). 

Ahead is data on Jobless Claims, the Consumer Price Index (8:30 AM ET), the Federal Budget (2:00 PM ET), and Fed-speak (7:00 PM ET).

Graphic updated 6:50 AM ET. Sentiment Neutral if expected /ES open is inside of the prior day’s range. /ES levels are derived from the profile graphic at the bottom of the following section. Levels may have changed since initially quoted; click here for the latest levels. SqueezeMetrics Dark Pool Index (DIX) and Gamma (GEX) calculations are based on where the prior day’s reading falls with respect to the MAX and MIN of all occurrences available. A higher DIX is bullish. At the same time, the lower the GEX, the more (expected) volatility. Learn the implications of volatility, direction, and moneyness. SHIFT data used for S&P 500 (INDEX: SPX) options activity. Note that options flow is sorted by the call premium spent; if more positive, then more was spent on call options. Breadth reflects a reading of the prior day’s NYSE Advance/Decline indicator. VIX reflects a current reading of the CBOE Volatility Index (INDEX: VIX) from 0-100.

What To Expect

Fundamental: Participants have readied themselves for data on inflation.

According to Nordea Bank’s (OTC: NRDBY) research, though January inflation will be higher, ultimately leading to volatility in bonds and equities, there will be a moderation in momentum.

The headline figure may print at 7.4% y/y (consensus: 7.2%) while core inflation may print 5.9% y/y (consensus: 5.9%). This is after CPI basket weights were updated and show an increased weight towards the prices that are rising the most (used cars and shelter costs).

“An above-consensus print could imply frontloading of hikes and increased speculation in a 50bp March-hike,” Nordea’s Philip Maldia Madsen and Helene Østergaard explain. 

“Frontloading rate hikes support the USD, but substantial gains may require higher terminal rates pricing (more hikes priced, not just faster).”

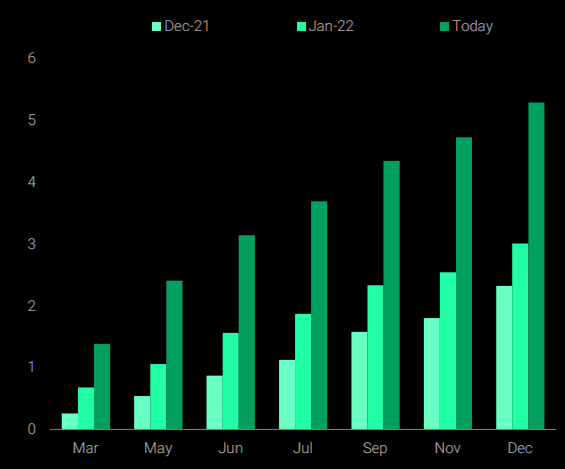
Graphic: Via TS Lombard. Taken from The Market Ear. Market prices in more than five rate hikes in 2022.

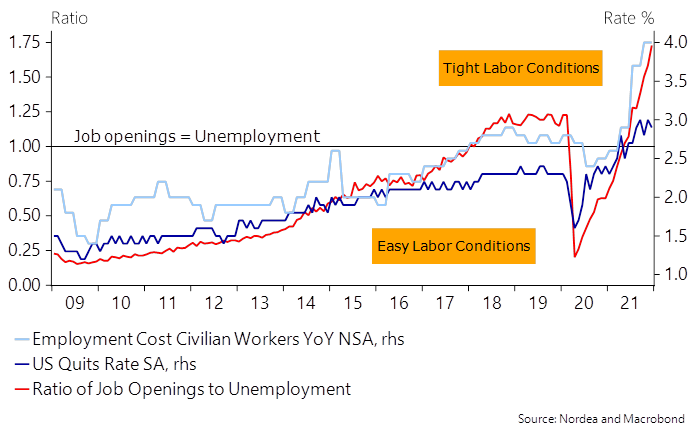
This is as U.S. labor conditions have tightened markedly, fueling a “sell-off in the short-end of the USD curve as inflation risks remain historically high.”

Graphic: Via Nordea, “the million-dollar question for 2022 remains whether wage growth will persist as base effects start to kick in.”

Taken together, data points to the Federal Reserve staying hawkish and a continued risk in shorter-duration bonds. 

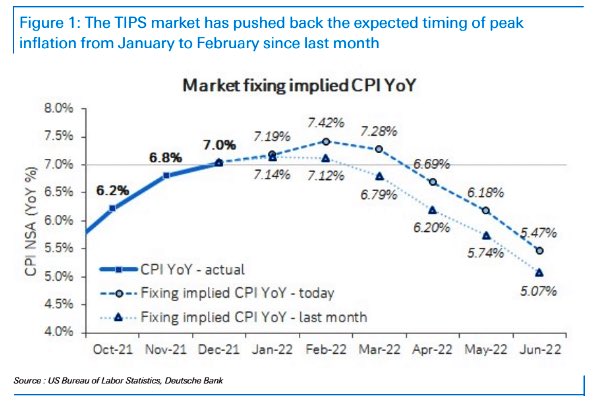
Andreas Steno Larsen of Heimstaden, who this newsletter quoted, yesterday, has explained that despite inflation printing higher in Q1, the trends will shift in Q2-Q4, given new CPI weights.

“The changes made by the BLS hence provide a net/net negative impact on inflation down the line (likely during H2-2022 already), but not before another positive tilt to inflation is seen in the very short-term.”

Graphic: Via Deutsche Bank (NYSE: DB), inflation proving stickier.

What is the outlook for bonds and tech? Steno Larsen suggests it is benign. 

“I don’t really fear the planned QT from the Fed in that regards either,” he elaborates. 

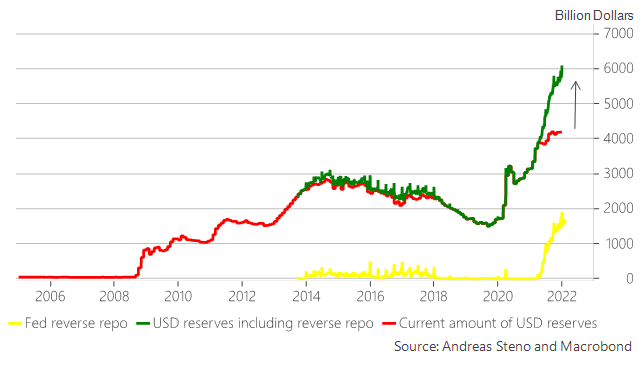
“We will not see a strong negative USD liquidity effect from QT initially as the gap between the total amount of printed USD reserves and the current amount of USD reserves available to the banking system will act as a buffer once the Fed starts bringing down the balance sheet size (QT).”

Graphic: Via Steno Larsen, “USD reserves currently parked at the reverse repo will flow into T-bills once QT commences effectively leaving USD liquidity unchanged as frozen reverse repo liquidity will be unleashed into the system, … [mitigating] the adverse effects of the Fed trying to bring down the balance sheet size again, and this is in sharp contrast to the QT process of 2017-2018.”

Positioning: The effects of continued volatility compression contended with demand for protection, yesterday.

Graphic: VIX term structure continues to compress. This solicits flows that may bolster a price rise.

In the face of a sort-of upward drift, participants legged into negative delta (-delta) trades that offered them positive exposure to the downside. 

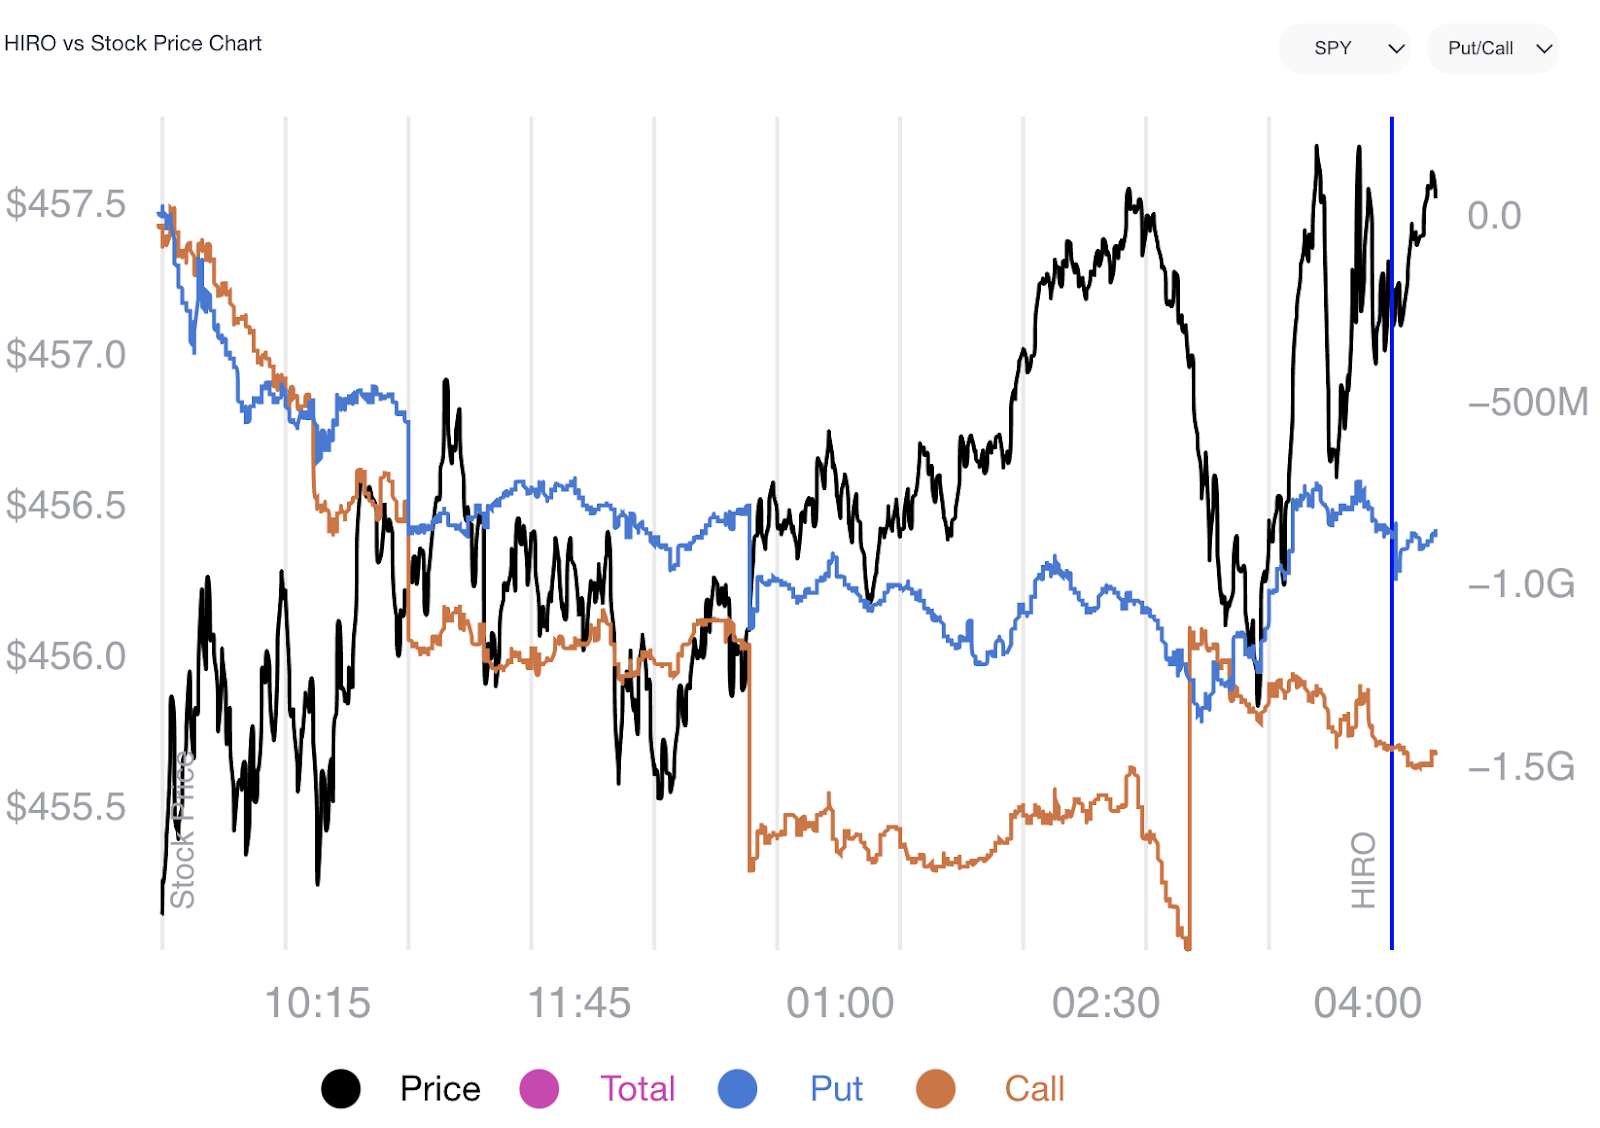
Below is a chart of SpotGamma’s (beta) Hedging Impact of Real-Time Options indicator. Notice the trend in the blue (put) and orange (call) lines. This trend denotes demand for -delta (call selling and put buying) which translates to pressure from dealers who are selling underlying (adding -delta) against their positive delta (+delta) options exposure.

Graphic: SpotGamma’s HIRO indicator for the SPDR S&P 500 ETF Trust (NYSE: SPY).

As stated, the pressure from this divergence was offset by continued compression in volatility; as time and volatility trend to zero, the supportive hedging flows with respect to time (charm) and volatility (vanna), along with “passive buying support,” took from the negative implications of customer demand for protection.

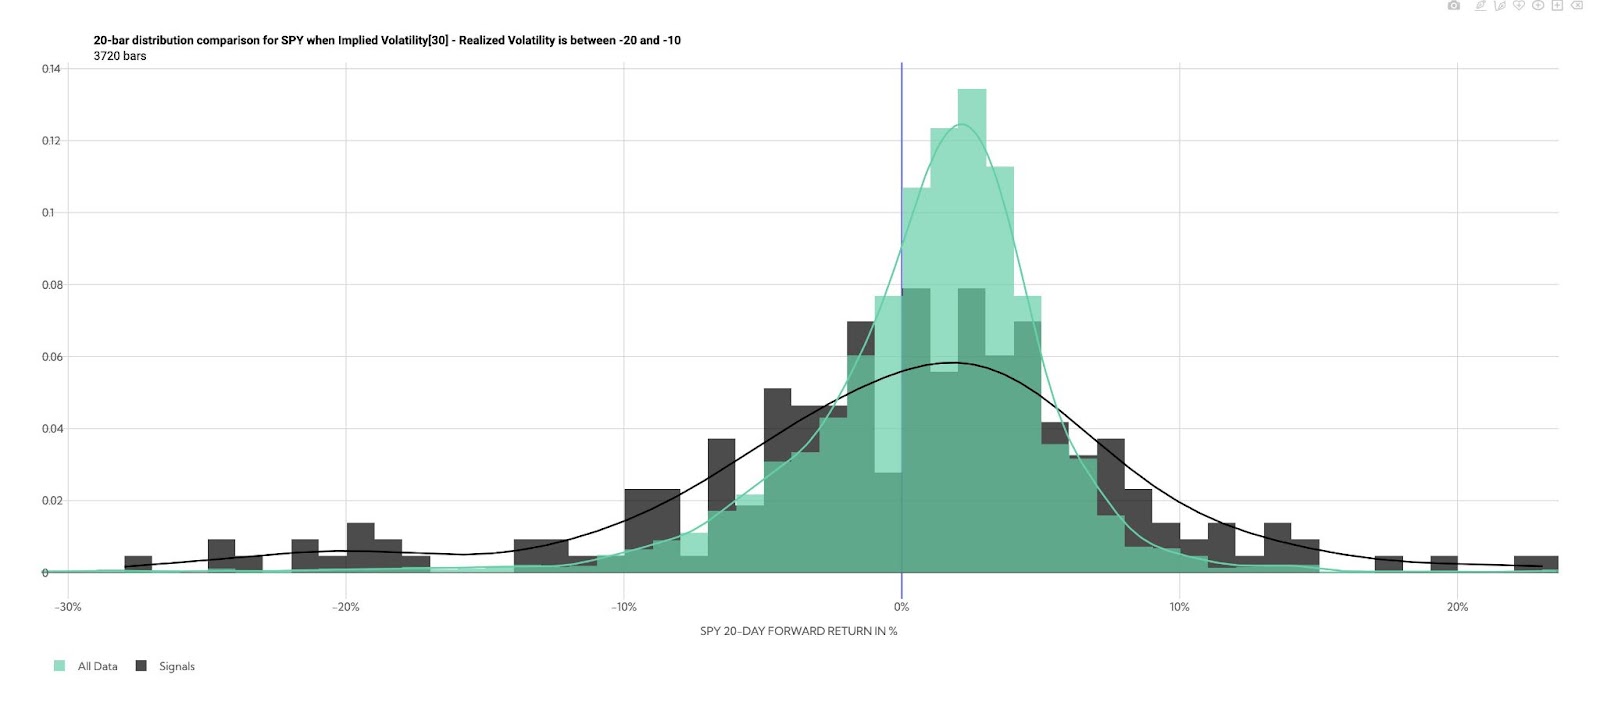
Overall, similar to yesterday, buying proxies still point to modest bullishness.

Graphic: Via @HalfersPower, the forward return distribution for SPY when implied volatility less realized volatility is between -20 and -10. “VRP (30 Day ATM Implied Volatility – 21 Day Realized Volatility (Y-Z) is the most deeply negative since the 2020 crash at -12 pts (hitting as low as -14 on Wednesday).”

Technical: As of 6:30 AM ET, Monday’s regular session (9:30 AM – 4:00 PM ET), in the S&P 500, will likely open in the middle part of a negatively skewed overnight inventory, inside of prior-range and -value, suggesting a limited potential for immediate directional opportunity.

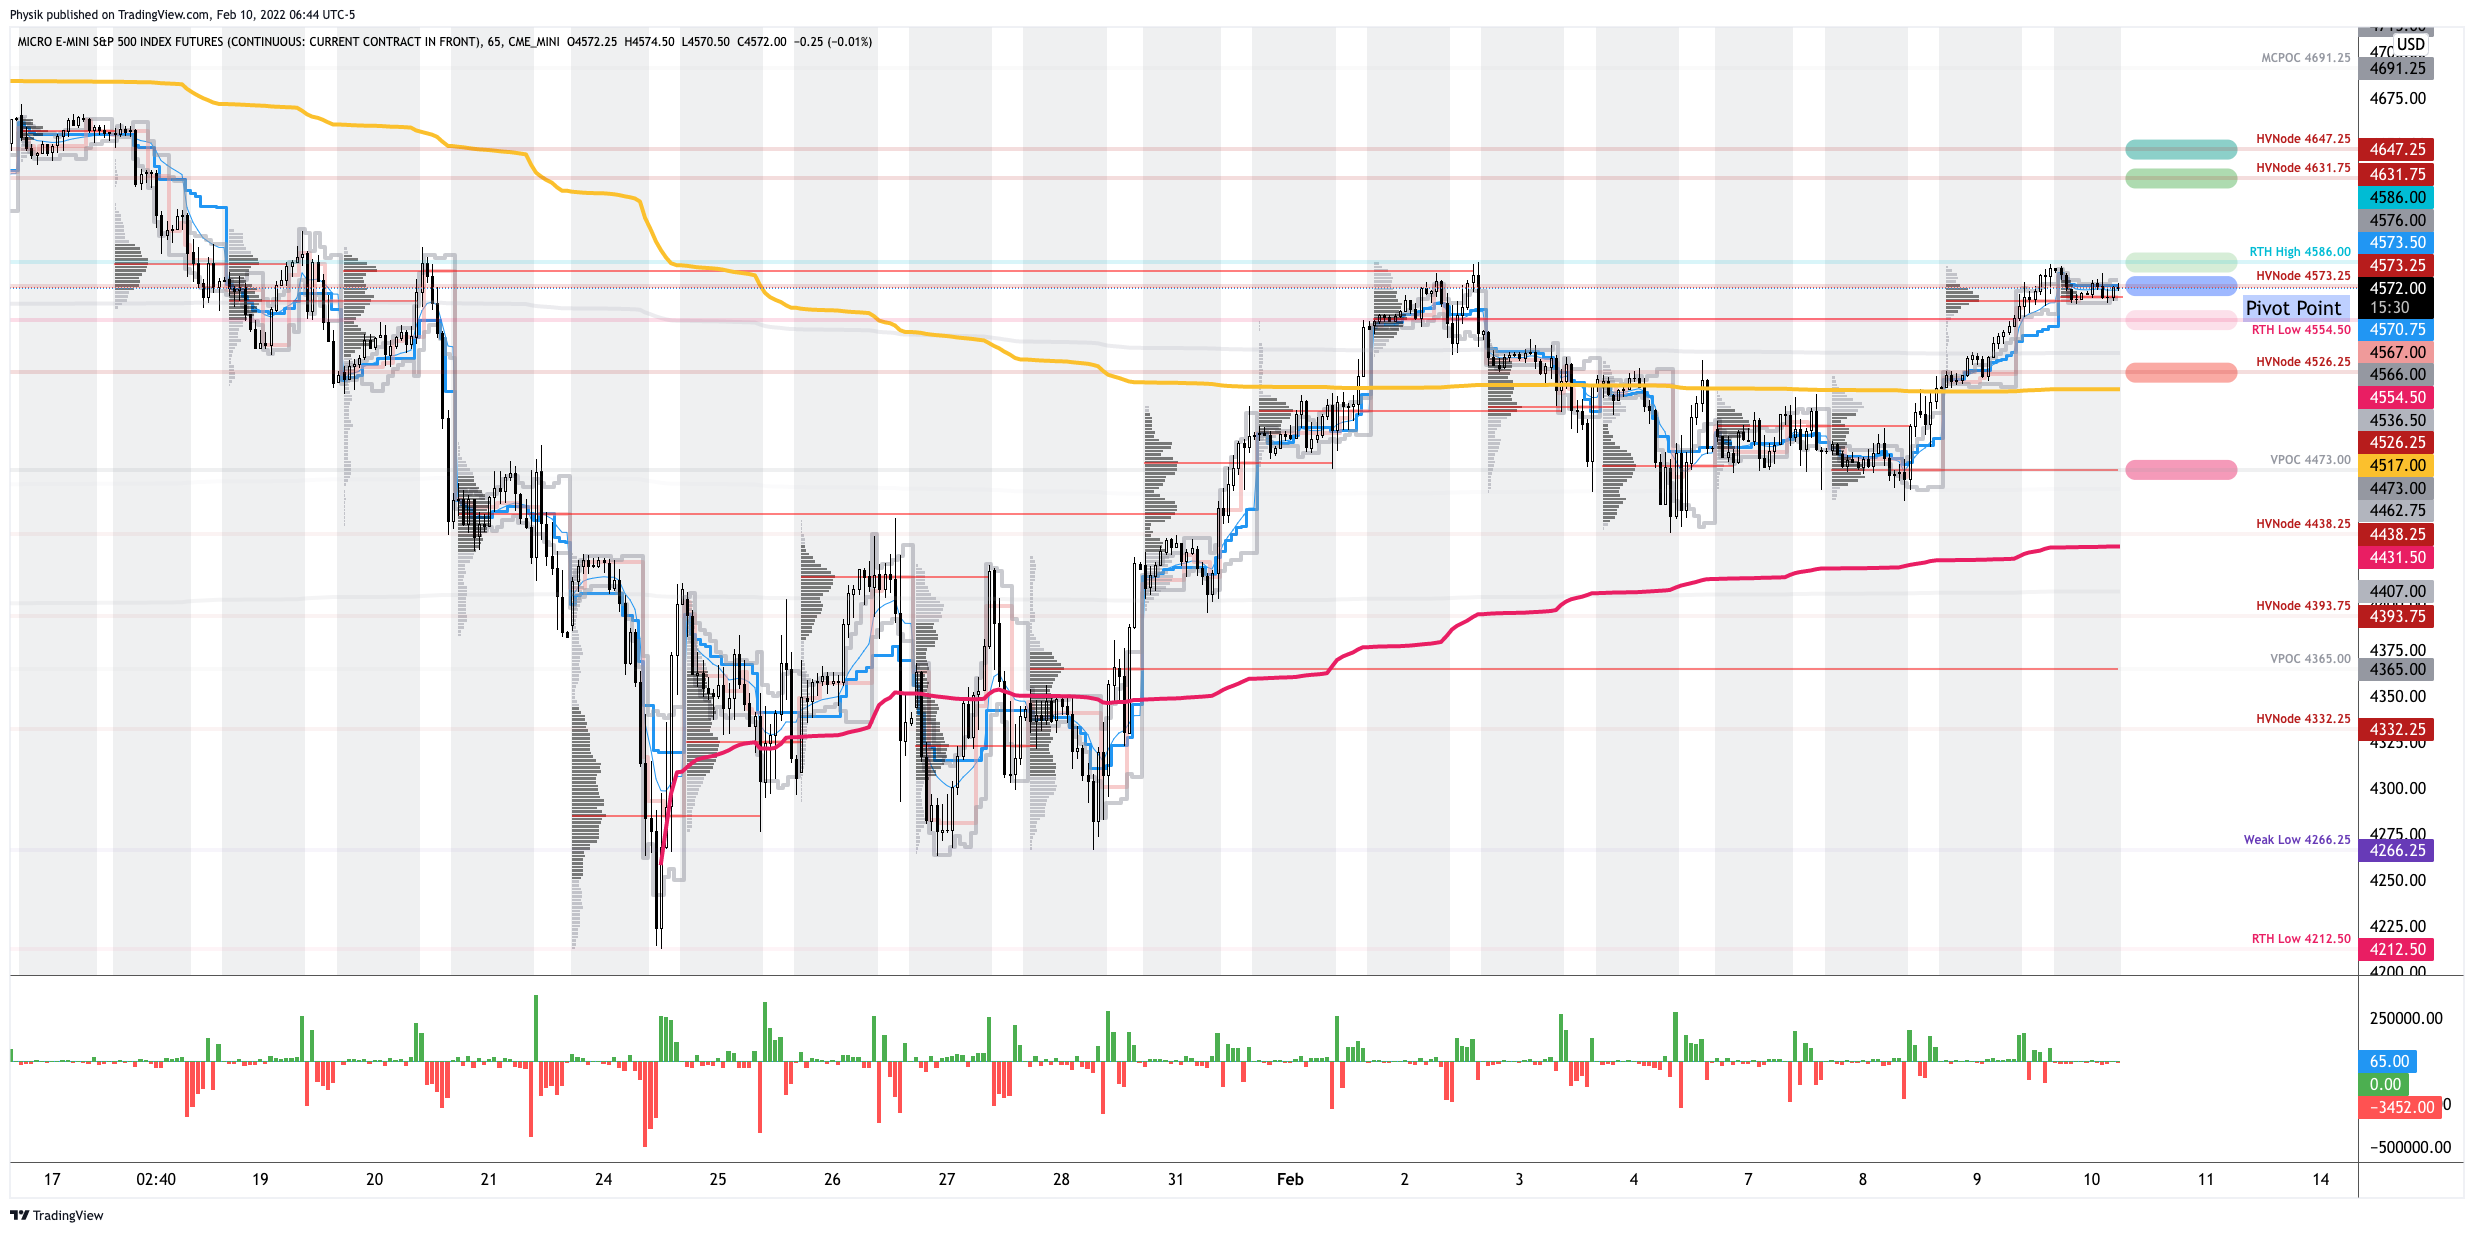
In the best case, the S&P 500 trades higher; activity above the $4,573.25 high volume area (HVNode) puts in play the $4,586.00 regular trade high (RTH High). Initiative trade beyond the RTH High could reach as high as the $4,631.75 and $4,647.25 HVNodes, or higher.

In the worst case, the S&P 500 trades lower; activity below the $4,573.25 HVNode puts in play the $4,554.50 RTH Low. Initiative trade beyond the RTH Low could reach as low as the $4,526.25 HVNode and $4,473.00 VPOC, or lower.

Click here to load today’s key levels into the web-based TradingView charting platform. Note that all levels are derived using the 65-minute timeframe. New links are produced, daily.
Graphic: 65-minute profile chart of the Micro E-mini S&P 500 Futures.

What People Are Saying

Definitions

Volume Areas: A structurally sound market will build on areas of high volume (HVNodes). Should the market trend for long periods of time, it will lack sound structure, identified as low volume areas (LVNodes). LVNodes denote directional conviction and ought to offer support on any test. 

If participants were to auction and find acceptance into areas of prior low volume (LVNodes), then future discovery ought to be volatile and quick as participants look to HVNodes for favorable entry or exit.

POCs: POCs are valuable as they denote areas where two-sided trade was most prevalent in a prior day session. Participants will respond to future tests of value as they offer favorable entry and exit.

About

After years of self-education, strategy development, mentorship, and trial-and-error, Renato Leonard Capelj began trading full-time and founded Physik Invest to detail his methods, research, and performance in the markets.

Capelj is also a Benzinga finance and technology reporter interviewing the likes of Shark Tank’s Kevin O’Leary, JC2 Ventures’ John Chambers, FTX’s Sam Bankman-Fried, and ARK Invest’s Catherine Wood, as well as a SpotGamma contributor developing insights around impactful options market dynamics.

Disclaimer

Physik Invest does not carry the right to provide advice.

In no way should the materials herein be construed as advice. Derivatives carry a substantial risk of loss. All content is for informational purposes only.
Categories
Commentary

Daily Brief For February 9, 2022

Editor’s Note: The Daily Brief is a free glimpse into the prevailing fundamental and technical drivers of U.S. equity market products. Join the 200+ that read this report daily, below!

What Happened

Overnight, equity index futures broke the confines of tight consolidation. 

As stated some commentaries ago, the odds pointed to a continued counter-trend rally; volatility compression, coupled with metrics that point to buying support, was to bolster follow-through.

Ahead is data on Wholesale Inventories (10:00 AM ET), as well as Fed-speak by Governor Michelle Bowman (10:30 AM ET) and President Loretta Mester (12:00 PM ET).

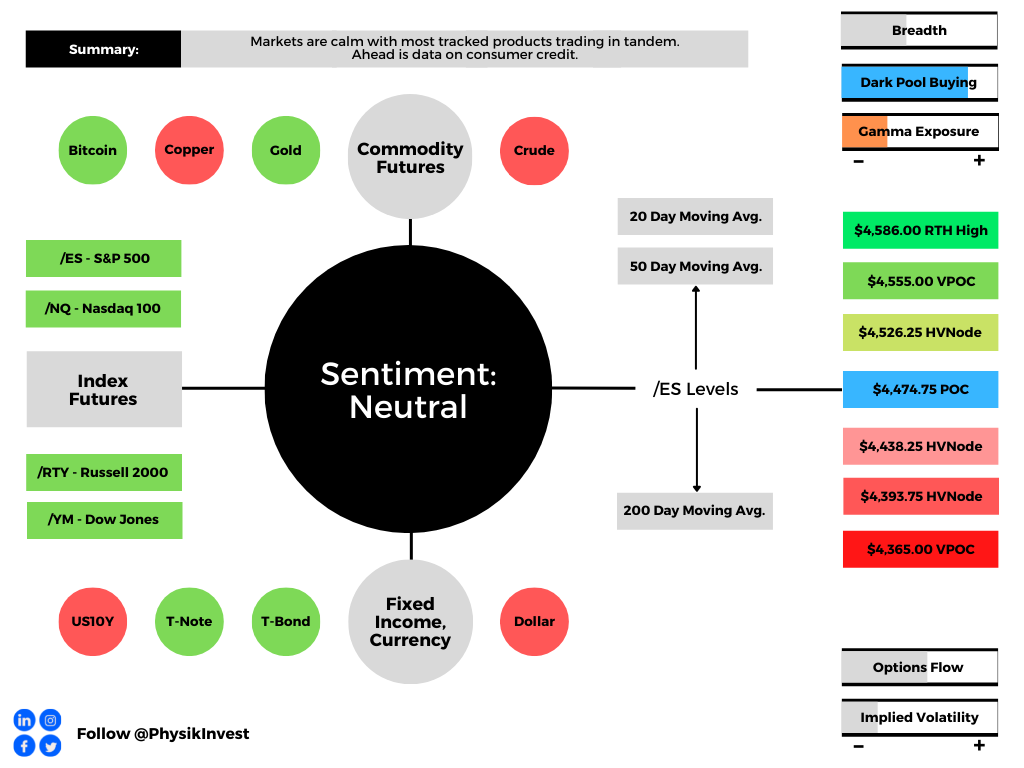
Graphic updated 6:30 AM ET. Sentiment Risk-On if expected /ES open is above the prior day’s range. /ES levels are derived from the profile graphic at the bottom of the following section. Levels may have changed since initially quoted; click here for the latest levels. SqueezeMetrics Dark Pool Index (DIX) and Gamma (GEX) calculations are based on where the prior day’s reading falls with respect to the MAX and MIN of all occurrences available. A higher DIX is bullish. At the same time, the lower the GEX, the more (expected) volatility. Learn the implications of volatility, direction, and moneyness. SHIFT data used for S&P 500 (INDEX: SPX) options activity. Note that options flow is sorted by the call premium spent; if more positive, then more was spent on call options. Breadth reflects a reading of the prior day’s NYSE Advance/Decline indicator. VIX reflects a current reading of the CBOE Volatility Index (INDEX: VIX) from 0-100.

What To Expect

Fundamental: Equity indices resolve higher in the face of hawkishness from the Federal Reserve (Fed) and data showing slowing growth at home and abroad.

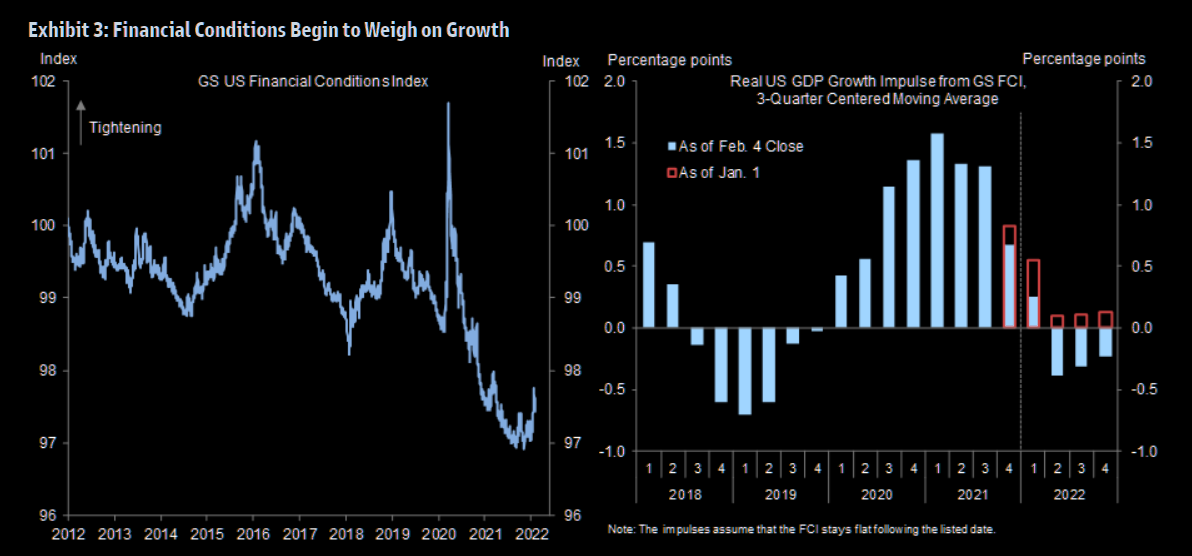
“Fiscal policy is turning more restrictive, the Q4 inventory boost is now behind us, and the financial conditions impulse will go from sharply positive in 2021 to (at least) modestly negative in 2022,” Goldman Sachs Group Inc (NYSE: GS) strategists explain. 

“For these reasons, our 2022 GDP forecast of 2¼% on a Q4/Q4 basis is 0.8pp below the latest Bloomberg consensus and 1.8pp below the FOMC’s last published forecast (as of the December meeting).”

Graphic: Via Goldman Sachs. Retrieved through The Market Ear.

At the same time, according to Moody’s Corporation (NYSE: MCO), the Fed has not pushed “against market expectations for three to four rate hikes this year.” 

Instead, Chair Jerome Powell “signaled the central bank will have zero tolerance for any upside surprises in inflation.”

To note, though, the consensus expectation – five rate hikes or more – is ahead of itself, according to Andreas Steno Larsen of Heimstaden. 

“Direct transfers and fiscal deficits are behind the current inflation spikes,” he explains. “If they were the root causes of inflation, they will also turn into the root causes of disinflation again during H2-2022.”

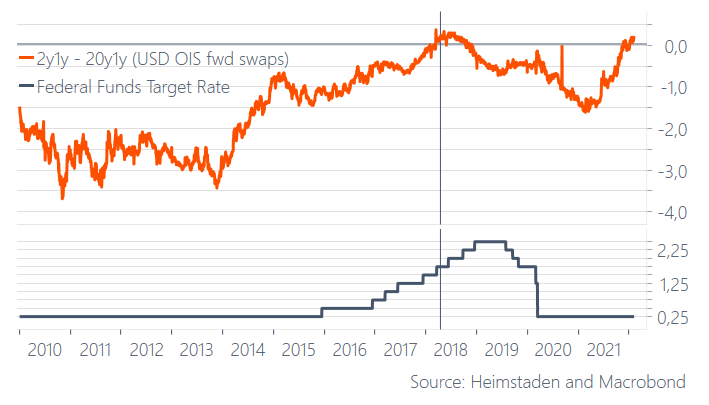
Steno Larsen adds that the 20y1y and 2y1y curve is inverted, “as it was when the 2015-2018 hiking cycle was very mature,” and only three hikes occurred after inversion.

Graphic: “Good luck hiking 6-7 times this year, … 3-4 max,” via Steno Larsen

The net effect, according to Steno Larsen, is that long bond yields will likely not rise over the next quarters; rate-sensitive technology and innovation products may rebound while cyclical assets may suffer.

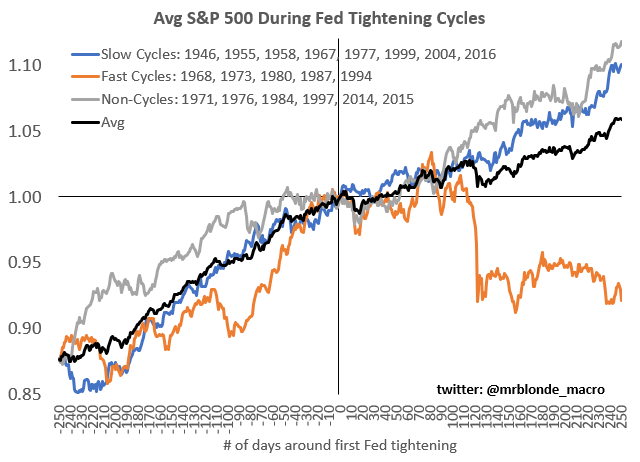
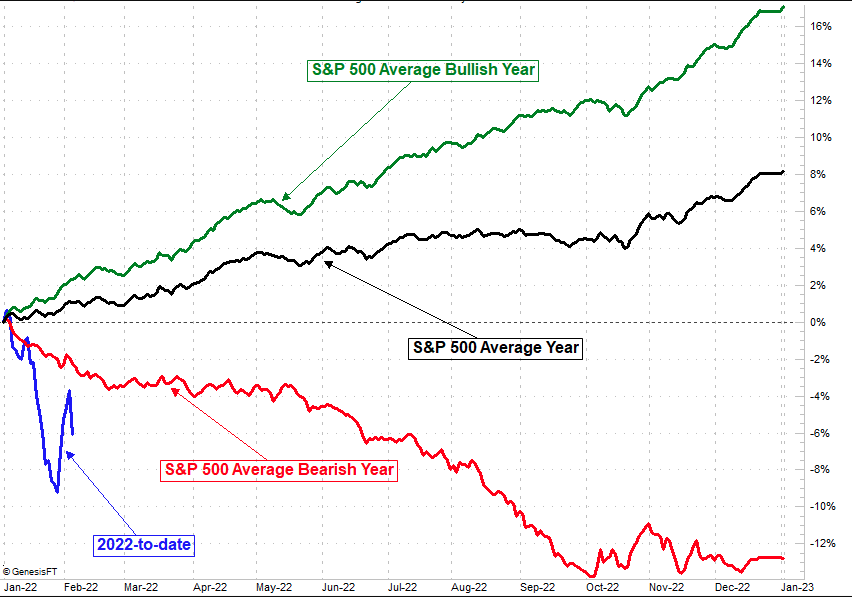
In line with the above comments is the average S&P 500 trend into Fed tightening cycles. 

Graphic: Retrieved from Callum Thomas’ Weekly S&P 500 ChartStorm newsletter.

Positioning: Ranges compressed as participants committed capital to bets on lower volatility.

Such bets (expressed via the selling of protection on both sides of the market) left counterparties warehousing the other side (long puts and calls). 

In hedging this exposure on a move higher, the counterparties increased +delta exposure is offset via the addition in -delta (sell futures)

In hedging this exposure on a move lower, the counterparties increased -delta exposure is offset via the addition of +delta (buy futures).

Moreover, as (1) participants continue to bet on lower ranges and (2) time and volatility trend to zero for the expiries most open interest is concentrated in, gamma, the sensitivity of options to changes in underlying price (delta) increases. 

What that means is that counterparties’ near-the-money exposure to options delta rises and portends increased liquidity (e.g., the counterparty will buy futures into weakness and sell futures into strength).

Given a lower liquidity environment, these hedging flows therefore have a bigger impact.

Graphic: Via SpotGamma, “gamma flows increasingly important in a lower liquidity environment. If the counterparty is taking on more exposure to positive gamma, then their addition of liquidity to hedge may suppress ranges.”

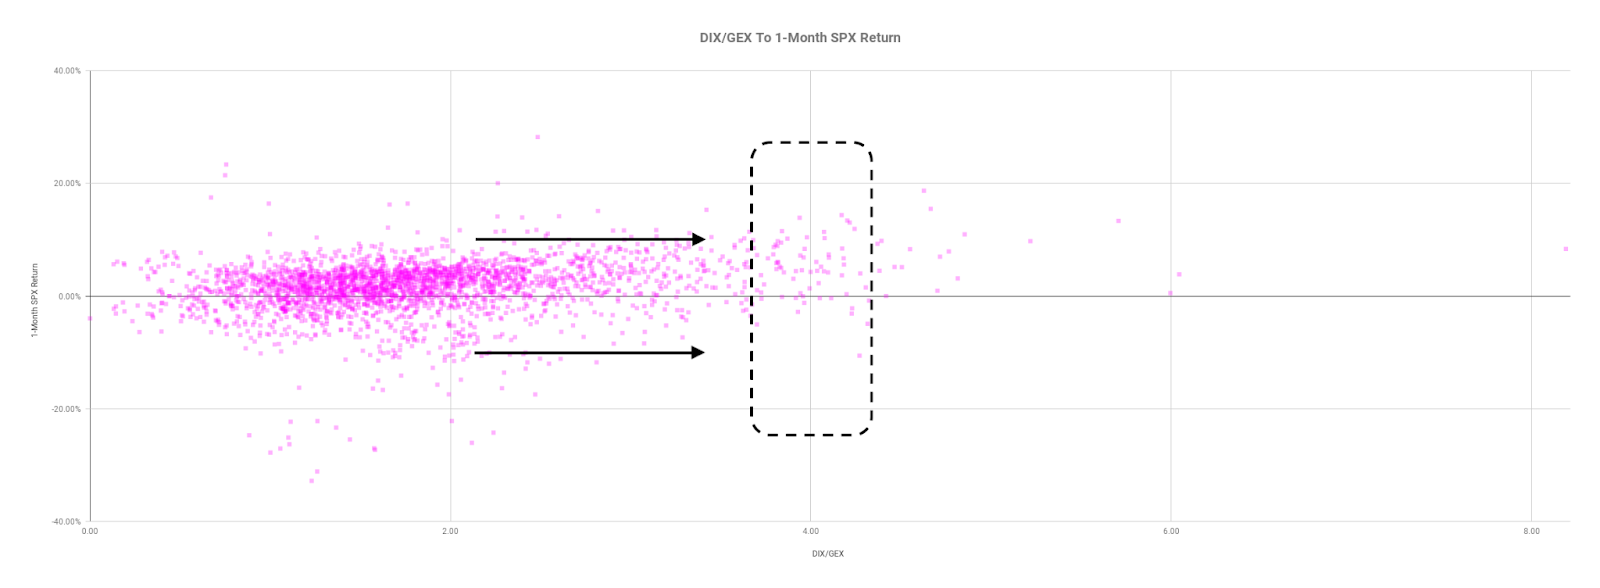
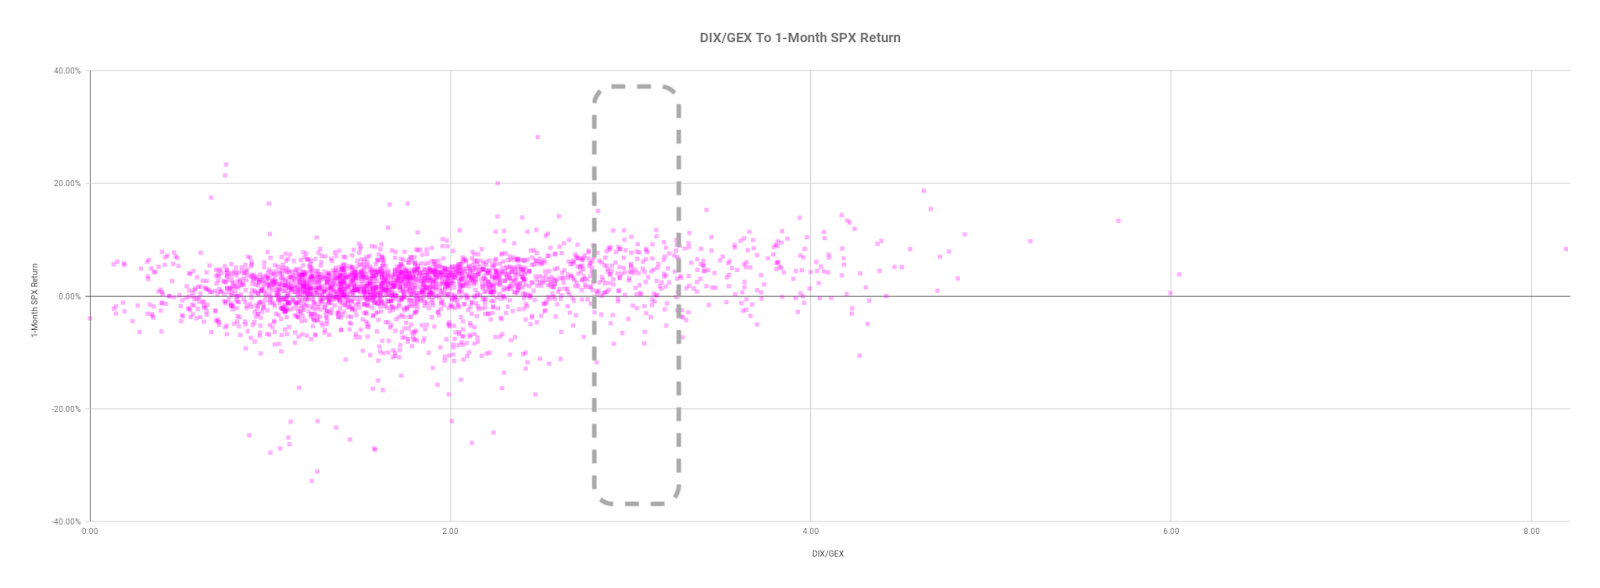
The resolve of this consolidation, coupled with decaying out-of-the-money protection and supportive hedging flows with respect to time (charm) and volatility (vanna), and buying proxies, point to “[m]odest bullishness on the 1-month timeframe.”

Graphic: Data via SqueezeMetrics. Graph via Physik Invest.

Technical: As of 6:30 AM ET, Wednesday’s regular session (9:30 AM – 4:00 PM ET), in the S&P 500, will likely open in the upper part of a positively skewed overnight inventory, outside of prior-range and -value, suggesting a potential for immediate directional opportunity.

Balance-Break + Gap Scenarios: A change in the market (i.e., the transition from two-time frame trade, or balance, to one-time frame trade, or trend) is occurring.

Monitor for acceptance (i.e., more than 1-hour of trade) outside of the balance area. 

Leaving value behind on a gap-fill or failing to fill a gap (i.e., remaining outside of the prior session’s range) is a go-with indicator. 

Rejection (i.e., return inside of balance) portends a move to the opposite end of the balance.

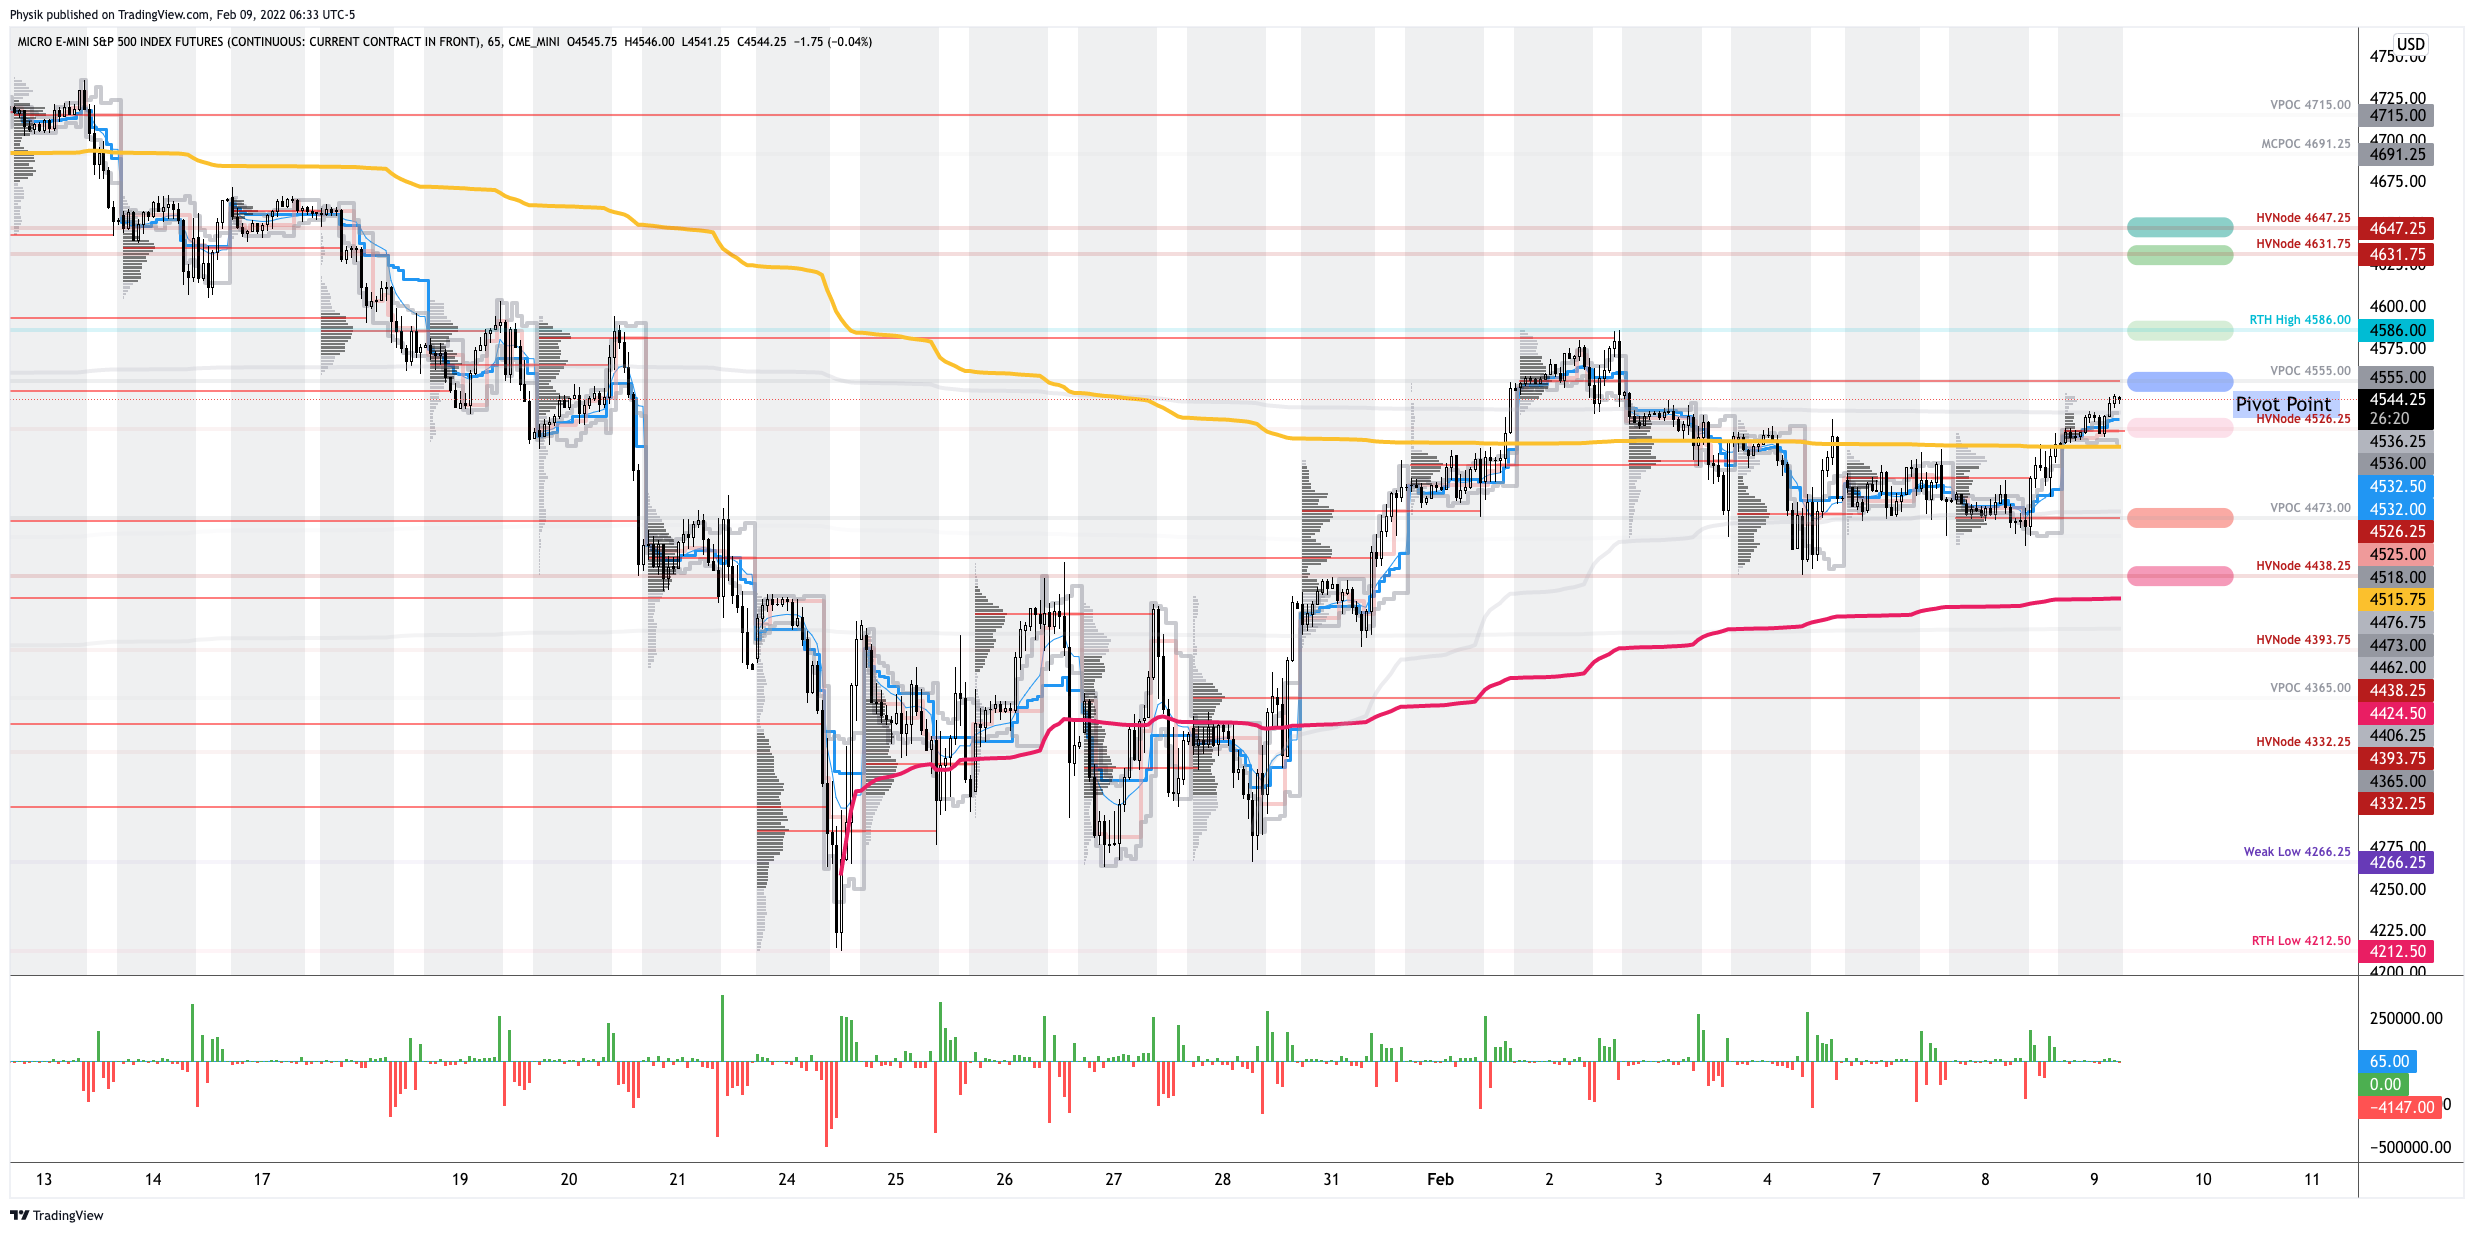
In the best case, the S&P 500 trades higher; activity above the $4,555.00 untested point of control (VPOC) puts in play the $4,586.00 regular trade high (RTH High). Initiative trade beyond the RTH High could reach as high as the $4,631.75 and $4,647.25 HVNode, or higher.

In the worst case, the S&P 500 trades lower; activity below the $4,555.00 VPOC puts in play the $4,526.25 HVNode. Initiative trade beyond the $4,526.25 HVNode could reach as low as the $4,473.00 VPOC and $4,438.25 HVNode, or lower.

Consideration: All equity index products have resolved tight consolidation’s higher. The Nasdaq 100 and Russell 2000 are the furthest away from clear areas of resistance. 

On the other hand, the S&P 500 and Dow Jones Industrial Average have little in the way of higher prices.

Graphic: Updated 2/8/2022. Anchored Volume Weighted Average Price (VWAP) analysis via Physik Invest. Notice Dow Jones Industrial Average (bottom right) and S&P 500 (top left) strength, as well as Nasdaq 100 (top right) and Russell 2000 (bottom left) weakness. Key pivots marked off.
Click here to load today’s key levels into the web-based TradingView charting platform. Note that all levels are derived using the 65-minute timeframe. New links are produced, daily.
Graphic: 65-minute profile chart of the Micro E-mini S&P 500 Futures.

What People Are Saying

Definitions

Volume Areas: A structurally sound market will build on areas of high volume (HVNodes). Should the market trend for long periods of time, it will lack sound structure, identified as low volume areas (LVNodes). LVNodes denote directional conviction and ought to offer support on any test. 

If participants were to auction and find acceptance into areas of prior low volume (LVNodes), then future discovery ought to be volatile and quick as participants look to HVNodes for favorable entry or exit.

POCs: POCs are valuable as they denote areas where two-sided trade was most prevalent in a prior day session. Participants will respond to future tests of value as they offer favorable entry and exit.

About

After years of self-education, strategy development, mentorship, and trial-and-error, Renato Leonard Capelj began trading full-time and founded Physik Invest to detail his methods, research, and performance in the markets.

Capelj is also a Benzinga finance and technology reporter interviewing the likes of Shark Tank’s Kevin O’Leary, JC2 Ventures’ John Chambers, FTX’s Sam Bankman-Fried, and ARK Invest’s Catherine Wood, as well as a SpotGamma contributor developing insights around impactful options market dynamics.

Disclaimer

Physik Invest does not carry the right to provide advice.

In no way should the materials herein be construed as advice. Derivatives carry a substantial risk of loss. All content is for informational purposes only.
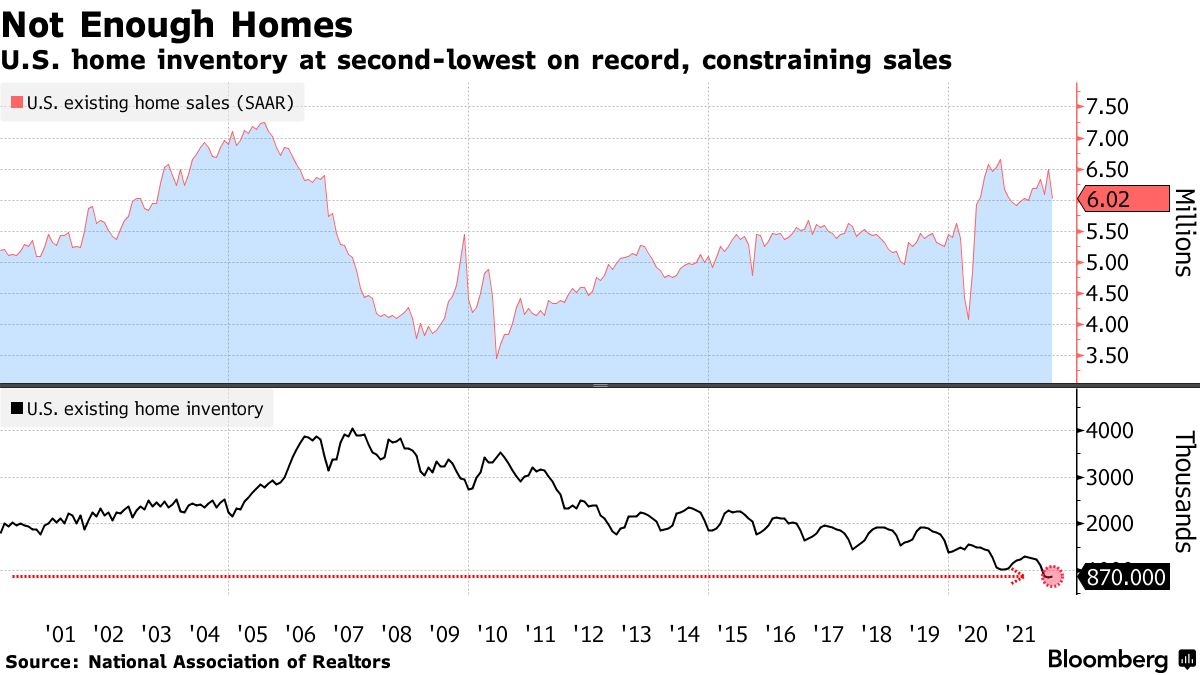
Categories
Commentary

Daily Brief For February 7, 2022

Editor’s Note: The Daily Brief is a free glimpse into the prevailing fundamental and technical drivers of U.S. equity market products. Join the 200+ that read this report daily, below!

What Happened

Overnight, markets were calm as most equity index, commodity, and bond futures traded in tandem.

Ahead is data on consumer credit (3:00 PM ET).

Graphic updated 7:50 AM ET. Sentiment Neutral if expected /ES open is inside of the prior day’s range. /ES levels are derived from the profile graphic at the bottom of the following section. Levels may have changed since initially quoted; click here for the latest levels. SqueezeMetrics Dark Pool Index (DIX) and Gamma (GEX) calculations are based on where the prior day’s reading falls with respect to the MAX and MIN of all occurrences available. A higher DIX is bullish. At the same time, the lower the GEX, the more (expected) volatility. Learn the implications of volatility, direction, and moneyness. SHIFT data used for S&P 500 (INDEX: SPX) options activity. Note that options flow is sorted by the call premium spent; if more positive, then more was spent on call options. Breadth reflects a reading of the prior day’s NYSE Advance/Decline indicator. VIX reflects a current reading of the CBOE Volatility Index (INDEX: VIX) from 0-100.

What To Expect

Fundamental: On the back of divergent breadth, geopolitical tensions, the prospect of reduced stimulus to combat inflation, wild responses to earnings, and disappointments in real demand and growth, 2022 has panned out as an incredibly bearish year for the stock and bond market.

Amidst this deleveraging of sorts, the S&P 500, in particular, traded well into correction territory, albeit in line with the average non-recessionary pullback of about 15%, and seasonality patterns of mid-term election years.

Graphic: Via Seth Golden, “Not sure investors realize just how BEARISH this year has been to date.”

According to an article from Nasdaq Inc’s (NASDAQ: NDAQ) Phil Mackintosh, retail investors have become even more active, setting “a new record for gross trading (buying and selling).”

To note, despite the recent “3.9 standard deviation share disposal,” when “retail investors offloaded a net $1.36 billion worth of stock by noon,” January 24, as discussed in prior Daily Briefs, retail investors “were still net buyers of stocks in January, adding $5 billion to their holdings for the month.”

What’s interesting though is retail’s reduced interest in ETF products tracking growth (those which have the most to lose in a higher rate environment).

Graphic: “Suddenly retail have less interest in growth ETFs,” via Nasdaq.

That’s amidst the fear of contractionary monetary policy, so to speak.

To explain, with additions in money supply, there were increases in consumer prices and monetary policymakers are now looking to temper those (supposed non-transitory) increases.

According to ARK Invest’s Catherine Wood, “we’ve seen money growth go from 27% at its peak during the coronavirus, to 13%, recently.”

In tempering this inflation, Wood, too, thinks that rate hikes are on the table heading into the mid-term election cycle. 

Contrary to commentary that alludes to the Federal Reserve (Fed) hiking between 4 and 7 times, Wood thinks that “50 basis points is the number that the Fed will basically [use to] telegraph that it means business and that it’s going to head inflation off.”

Graphic: Per Bloomberg, “Wall Street expects front-loaded hikes: Goldman Sachs Group Inc. and JPMorgan Chase & Co. are aligned on five hikes in 2022, while Bank of America Corp. is out front with a seven-hike forecast.”

“They might want to do the 50 basis points just to say: ‘Okay, we’re done for a while, now,’ … [because] I think the Fed could overdo it quite quickly.”

Wood’s fears come as @MacroAlf put well recently: 

“If the fast increase in the rate of change of money supply (M2) led to a sharp increase in the rate of change of prices (CPI),” what happens to inflation if M2 is falling?

Pursuant to Wood and @MacroAlf’s comments are large outflows from Treasury Inflation-Protected Securities (TIPS) that “protect against inflation because they mirror the movements of the consumer price index (CPI),” according to Nerd Wallet.

Graphic: @MacroAlf notes: “Largest weekly outflow from TIPS since the pandemic crash in March 2020. CPI might be 7% today, but markets are forward-looking.”

Positioning: Over the past weeks, measures of implied volatility (IV) expanded amidst heightened demand for negative-delta (short call and long put) exposure on the part of customers. 

Counterparties, in hedging their positive-delta (long call, short put) risk, sold stock and futures (added negative delta hedges), and this pressured markets. 

However, as SqueezeMetrics puts it well, “When investors buy puts, but the underlying doesn’t violently go down, those puts decay.”

Graphic: Ratio of puts bought to sold, via SqueezeMetrics.

Basically, demand for protection can result in options decay briefly taking a back seat, if you will. 

As markets settle, though, “decay returns with vengeance,” according to SpotGamma.

“As time and volatility trend to zero (as all options expire), given the current market environment, dealers’ exposure to the risk of out-of-the-money protection will decline. All that means is that the market ought to be supported by positive vanna and charm flows as dealers unwind short-delta hedges to decaying positive-delta protection (they are short).”

Graphic: Via SpotGamma. “SPX prices X-axis. Option delta Y-axis. When the factors of implied volatility and time change, hedging ratios change. For instance, if SPX is at $4,700.00 and IV jumps 15% (all else equal), the dealer may sell an additional 0.2 deltas to hedge their exposure to the addition of a positive 0.2 delta. The graphic is for illustrational purposes, only.”

Taking into account options positioning, versus buying pressure (measured via short sales or liquidity provision on the market-making side), metrics point to “[m]odest bullishness on the 1-month timeframe.”

Technical: As of 6:20 AM ET, Monday’s regular session (9:30 AM – 4:00 PM ET), in the S&P 500, will likely open in the middle part of a positively skewed overnight inventory, inside of prior-range and -value, suggesting a limited potential for immediate directional opportunity.

In the best case, the S&P 500 trades higher; activity above the $4,474.75 point of control (POC) puts in play the $4,526.25 high volume area (HVNode). Initiative trade beyond the HVNode could reach as high as the $4,555.00 untested point of control (VPOC) and $4,586.00 regular trade high (RTH High), or higher.

In the worst case, the S&P 500 trades lower; activity below the $4,474.75 POC puts in play the $4,438.25 HVNode. Initiative trade beyond the $4,438.25 HVNode could reach as low as the $4,393.75 HVNode and $4,365.00 VPOC, or lower.

Click here to load today’s key levels into the web-based TradingView charting platform. Note that all levels are derived using the 65-minute timeframe. New links are produced, daily.
Graphic: 65-minute profile chart of the Micro E-mini S&P 500 Futures.

What People Are Saying

Definitions

Volume Areas: A structurally sound market will build on areas of high volume (HVNodes). Should the market trend for long periods of time, it will lack sound structure, identified as low volume areas (LVNodes). LVNodes denote directional conviction and ought to offer support on any test. 

If participants were to auction and find acceptance into areas of prior low volume (LVNodes), then future discovery ought to be volatile and quick as participants look to HVNodes for favorable entry or exit.

Gamma: Gamma is the sensitivity of an option to changes in the underlying price. Dealers that take the other side of options trades hedge their exposure to risk by buying and selling the underlying. When dealers are short-gamma, they hedge by buying into strength and selling into weakness. When dealers are long-gamma, they hedge by selling into strength and buying into weakness. The former exacerbates volatility. The latter calms volatility.

Vanna: The rate at which the delta of an option changes with respect to volatility.

Charm: The rate at which the delta of an option changes with respect to time.

POCs: POCs are valuable as they denote areas where two-sided trade was most prevalent in a prior day session. Participants will respond to future tests of value as they offer favorable entry and exit.

About

After years of self-education, strategy development, mentorship, and trial-and-error, Renato Leonard Capelj began trading full-time and founded Physik Invest to detail his methods, research, and performance in the markets.

Capelj is also a Benzinga finance and technology reporter interviewing the likes of Shark Tank’s Kevin O’Leary, JC2 Ventures’ John Chambers, FTX’s Sam Bankman-Fried, and ARK Invest’s Catherine Wood, as well as a SpotGamma contributor developing insights around impactful options market dynamics.

Disclaimer

Physik Invest does not carry the right to provide advice.

In no way should the materials herein be construed as advice. Derivatives carry a substantial risk of loss. All content is for informational purposes only.
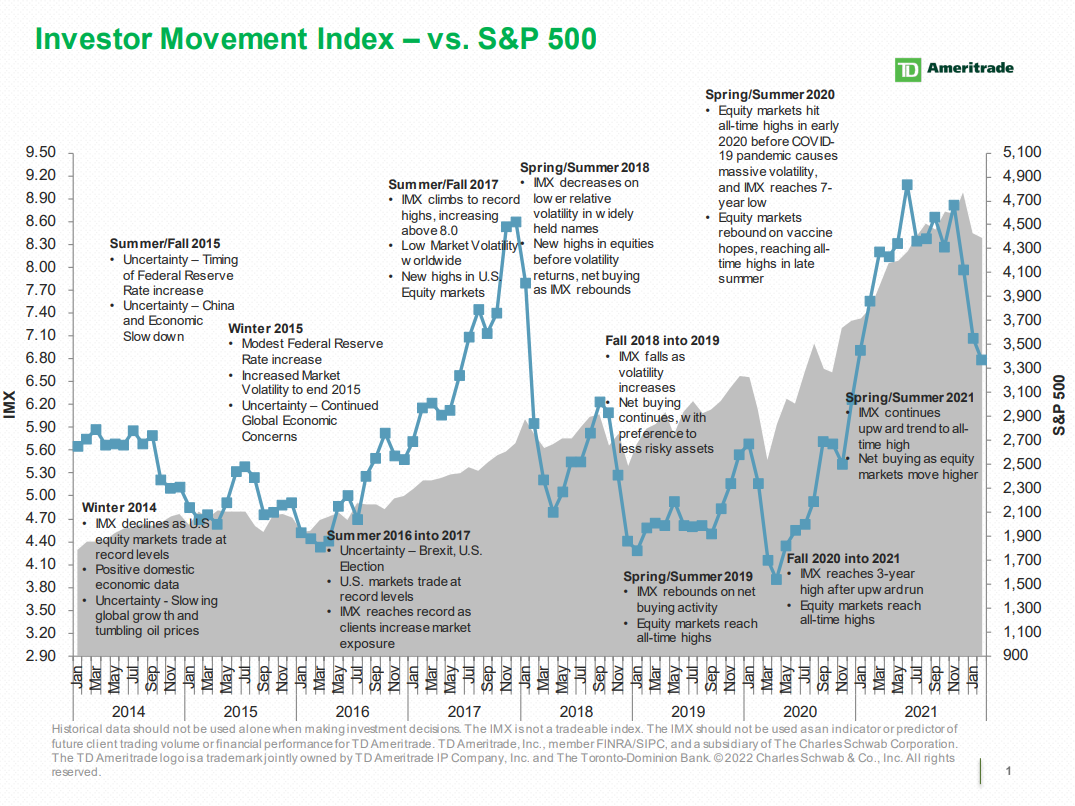
Categories
Commentary

Daily Brief For January 28, 2022

Editor’s Note: Thanks for subscribing to The Daily Brief, a free glimpse into the prevailing fundamental and technical drivers of U.S. equity market products. 

In the coming week, commentaries are set to pause as I go on vacation. Look forward to providing valuable market color when I return, on February 7, 2022

Talk to you soon!

What Happened

Despite certain index heavy-weights trading higher in light of earnings announcements, equity index futures remain weak, trading sideways to lower overnight with bonds. 

Measures of implied volatility (IV) remain bid while certain metrics continue to show buying support. Given the way counterparties to customer options trades hedge, a compression in volatility may bolster a move higher.

Though the odds point to a counter-trend rally, continued selling is not out of the question. A break of multi-session support levels, combined with rising IV, would pressure indices further.

Ahead is data on PCE Inflation, incomes, spending, and the Employment Cost Index (8:30 AM ET). After is University of Michigan data on sentiment and inflation expectations (10:00 AM ET).

Graphic updated 6:55 AM ET. Sentiment Risk-Off if expected /ES open is below the prior day’s range. /ES levels are derived from the profile graphic at the bottom of the following section. Levels may have changed since initially quoted; click here for the latest levels. SqueezeMetrics Dark Pool Index (DIX) and Gamma (GEX) calculations are based on where the prior day’s reading falls with respect to the MAX and MIN of all occurrences available. A higher DIX is bullish. At the same time, the lower the GEX, the more (expected) volatility. Learn the implications of volatility, direction, and moneyness. SHIFT data used for S&P 500 (INDEX: SPX) options activity. Note that options flow is sorted by the call premium spent; if more positive, then more was spent on call options. Breadth reflects a reading of the prior day’s NYSE Advance/Decline indicator. VIX reflects a current reading of the CBOE Volatility Index (INDEX: VIX) from 0-100.

What To Expect

Fundamental: Equity indices are struggling to catch a bid amidst a more hawkish Fed, persistent geopolitical tensions, and data showing slowing growth at home and abroad.

Graphic: @MacroAlf plots credit impulse as a percent of GDP and SPX year-over-year earnings.

This is in the face of heavyweights, like Apple Inc (NASDAQ: AAPL) which posted its highest-ever quarterly earnings after sales climbed 11% to a record $124 billion, trading higher.

Coming back to comments from yesterday, the Federal Open Market Committee (FOMC) revealed asset purchases would stop in March. Then, in the face of an economy that’s much stronger than at the start of the last hiking cycle, the window for higher rates would be opened. 

What spooked markets was Fed Chair Jerome Powell “saying that the Fed has plenty of room to raise interest rates without harming the labor market,” according to an analysis by Moody’s Corporation (NYSE: MCO).

“Powell didn’t push back against market expectations for three to four rate hikes this year, but he signaled the central bank will have zero tolerance for any upside surprises in inflation.”

According to a write-up by Nasdaq Inc’s (NASDAQ: NDAQ) Phil Mackintosh, “some economists are already worrying whether the Fed can engineer a ‘soft landing’ for the economy, which is where rate hikes slow the economy and inflation but don’t cause a recession.”

Based on the data, though, “selloffs in rate hike cycles, especially since 1975, are mostly much smaller corrections,” Mackintosh adds.

“So, it seems we should worry much more about a recession than hikes.”

Graphic: Per Nasdaq, “[S]tock market corrections are much more dependent on the business cycle than the rates cycle. That makes sense—during rate-hike cycles, companies have strong demand and revenue growth recessions. Whereas, during recessions, unemployment and spending usually contract.”

Complicating the Fed’s job, per Nasdaq, are outside influences such as waning fiscal stimulus and further supply shocks (the good and bad ones). 

However, “annualized returns for the S&P 500 during rate hike cycles are mostly positive, … [as] rising rates usually equals a strong economy, which is usually good for companies, leading to earnings growth.”

“That earnings growth more than offsets the valuation impact of higher rates.”

Graphic: Per Nasdaq, annualized S&P 500 returns during rate-hike cycles.

To assuage some fears, Goldman Sachs Group Inc (NYSE: GS) thinks that the “interplay of Fed policy, financial conditions, and the growth outlook could make it hard for the Fed to actually deliver consecutive hikes, even if they feel like a natural forecast along the way.”

Graphic: Goldman Sachs sees a (small) tightening in financial conditions. Graphic retrieved from The Market Ear. According to Bloomberg, “there is quite a long way to go before the Fed would feel any great need to come to their rescue.”

Positioning: A short-gamma environment (wherein an options delta falls with stock price rises and rises when stock prices fall) portends increased two-way volatility.

This is as the counterparties to customer options trades hedge in a manner that exacerbates movement (i.e., buying strength and selling weakness).

Graphic: SqueezeMetrics details the implications of customer activity in the options market, on the underlying’s order book. For instance, in selling a put, customers add liquidity and stabilize the market. How? The market maker long the put will buy (sell) the underlying to neutralize directional risk as price falls (rises).

As noted in past commentaries, the removal of put-heavy exposure, after the January monthly options expiration (OPEX), as well as the reduction in event premiums tied to FOMC, opened a window of strength, wherein dealers would have less positive delta to sell against.

In other words, as measures of implied volatility were to compress, as is the case when there is less demand (or more supply) of downside put protection (a positive-delta trade for the dealers), the dealer’s exposure to positive delta declines.

However, the failure to expand range is punishing toward highly demanded protection with a shorter time to maturity. These options, which are more “convex” and sensitive to changes in direction and volatility, have the most to lose as markets settle and “decay returns with vengeance,” according to SpotGamma, an options modeling and data service.

“As time and volatility trend to zero (as all options expire), given the current market environment, dealers’ exposure to the risk of out-of-the-money protection will decline.”

That solicits the dealers’ unwind of “short-delta hedges to decaying positive-delta protection.”

Those delta hedging flows with respect to time (charm) and volatility (vanna) are to reinforce the strong buying support (as measured by liquidity provision on the market-making side).

Graphic: From SpotGamma. SPX prices X-axis. Option delta Y-axis. When the factors of implied volatility and time change, hedging ratios change. For instance, if SPX is at $4,700.00 and IV jumps 15% (all else equal), the dealer may sell an additional 0.2 deltas to hedge their exposure to the addition of a positive 0.2 delta. The graphic is for illustrational purposes, only.

At present, in putting it simply, markets would really have to (1) fall out of bed or (2) demand for protection to explode for options counterparties, at least, to pressure markets much further.

As SpotGamma (which you can check out by clicking here) puts well: 

“In other words, the frantic hedging that destabilizes markets as customers reach for protection en masse has already happened. There would have to be an addition of macro flows for sale and/or new put buying for dealers to sell.”

Technical: As of 6:55 AM ET, Friday’s regular session (9:30 AM – 4:00 PM ET), in the S&P 500, will likely open in the lower part of a negatively skewed overnight inventory, outside of prior-range and -value, suggesting a potential for immediate directional opportunity.

Gap Scenarios: Gaps ought to fill quickly. Should they not, that’s a signal of strength; do not fade. Leaving value behind on a gap-fill or failing to fill a gap (i.e., remaining outside of the prior session’s range) is a go-with indicator.

Auctioning and spending at least 1-hour of trade back in the prior range suggests a lack of conviction; in such a case, do not follow the direction of the most recent initiative activity.

In the best case, the S&P 500 trades higher; activity above the $4,332.25 high volume area (HVNode) puts in play the $4,370.25 low volume area (LVNode). Initiative trade beyond the LVNode could reach as high as the $4,393.75 HVNode and $4,421.50 regular trade high (RTH High), or higher.

In the worst case, the S&P 500 trades lower; activity below the $4,332.25 HVNode puts in play the $4,299.25 RTH Low. Initiative trade beyond the RTH Low could reach as low as the $4,263.25 overnight low (ONL) and $4,212.50 RTH Low, or lower.

Click here to load today’s key levels into the web-based TradingView charting platform. Note that all levels are derived using the 65-minute timeframe. New links are produced, daily.
Graphic: 65-minute profile chart of the Micro E-mini S&P 500 Futures.

Definitions

Overnight Rally Highs (Lows): Typically, there is a low historical probability associated with overnight rally-highs (lows) ending the upside (downside) discovery process.

Volume Areas: A structurally sound market will build on areas of high volume (HVNodes). Should the market trend for long periods of time, it will lack sound structure, identified as low volume areas (LVNodes). LVNodes denote directional conviction and ought to offer support on any test. 

If participants were to auction and find acceptance into areas of prior low volume (LVNodes), then future discovery ought to be volatile and quick as participants look to HVNodes for favorable entry or exit.

Gamma: Gamma is the sensitivity of an option to changes in the underlying price. Dealers that take the other side of options trades hedge their exposure to risk by buying and selling the underlying. When dealers are short-gamma, they hedge by buying into strength and selling into weakness. When dealers are long-gamma, they hedge by selling into strength and buying into weakness. The former exacerbates volatility. The latter calms volatility.

Vanna: The rate at which the delta of an option changes with respect to volatility.

Charm: The rate at which the delta of an option changes with respect to time.

Options Expiration (OPEX): Traditionally, option expiries mark an end to pinning (i.e, the theory that market makers and institutions short options move stocks to the point where the greatest dollar value of contracts will expire) and the reduction dealer gamma exposure.

About

After years of self-education, strategy development, mentorship, and trial-and-error, Renato Leonard Capelj began trading full-time and founded Physik Invest to detail his methods, research, and performance in the markets.

Capelj is also a Benzinga finance and technology reporter interviewing the likes of Shark Tank’s Kevin O’Leary, JC2 Ventures’ John Chambers, FTX’s Sam Bankman-Fried, and ARK Invest’s Catherine Wood, as well as a SpotGamma contributor developing insights around impactful options market dynamics. 

Disclaimer

Physik Invest does not carry the right to provide advice.

In no way should the materials herein be construed as advice. Derivatives carry a substantial risk of loss. All content is for informational purposes only.