Categories
Commentary

Daily Brief For February 8, 2022

Editor’s Note: The Daily Brief is a free glimpse into the prevailing fundamental and technical drivers of U.S. equity market products. Join the 200+ that read this report daily, below!

What Happened

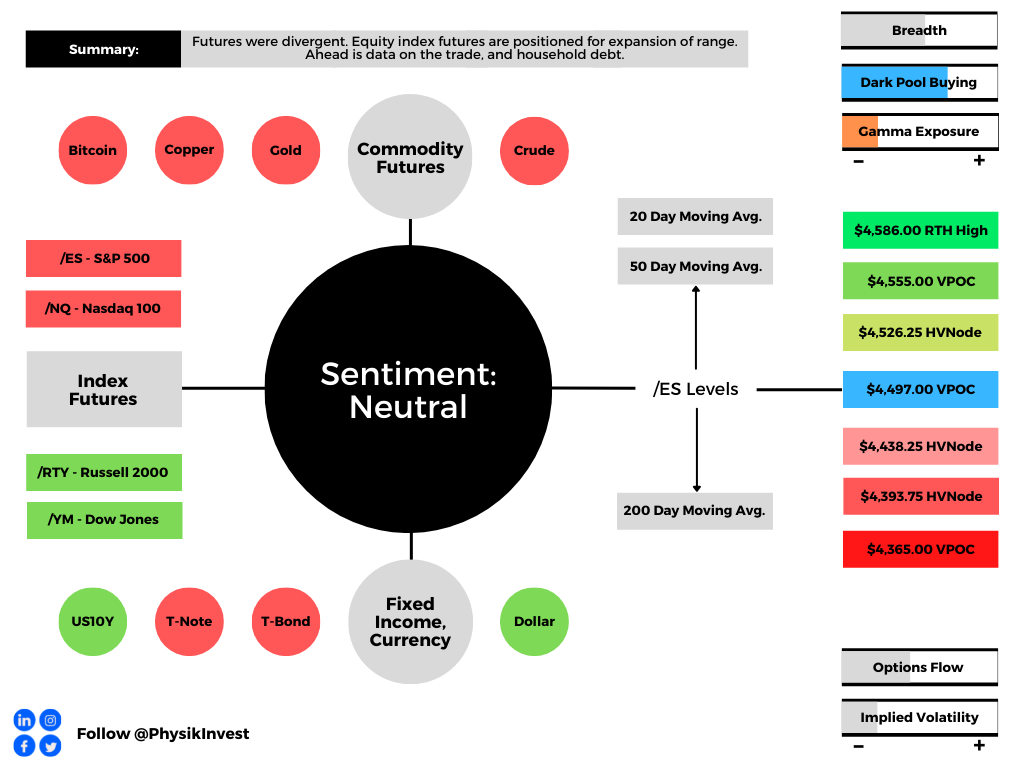
Overnight, equity index futures were divergent and weighed by the tech- and growth-heavy Nasdaq 100. Most commodity and bond products were much weaker, also. 

This stocks down, bonds down dynamic points to a continued deleveraging. 

Notwithstanding, sideways after a fast move lower, is not a bad thing. It’s one of the better cases to have given certain mechanics with respect to the options market, for instance.

Ahead is data on international trade (8:30 AM ET) and real household debt (11:00 AM ET).

Graphic updated 6:20 AM ET. Sentiment Neutral if expected /ES open is inside of the prior day’s range. /ES levels are derived from the profile graphic at the bottom of the following section. Levels may have changed since initially quoted; click here for the latest levels. SqueezeMetrics Dark Pool Index (DIX) and Gamma (GEX) calculations are based on where the prior day’s reading falls with respect to the MAX and MIN of all occurrences available. A higher DIX is bullish. At the same time, the lower the GEX, the more (expected) volatility. Learn the implications of volatility, direction, and moneyness. SHIFT data used for S&P 500 (INDEX: SPX) options activity. Note that options flow is sorted by the call premium spent; if more positive, then more was spent on call options. Breadth reflects a reading of the prior day’s NYSE Advance/Decline indicator. VIX reflects a current reading of the CBOE Volatility Index (INDEX: VIX) from 0-100.

What To Expect

Fundamental: Ranges, at the index level, have tightened markedly since the January sell-off culminating in a cross-market deleveraging cascade.

The situation is different at the single-stock level. There are a couple of factors behind this.

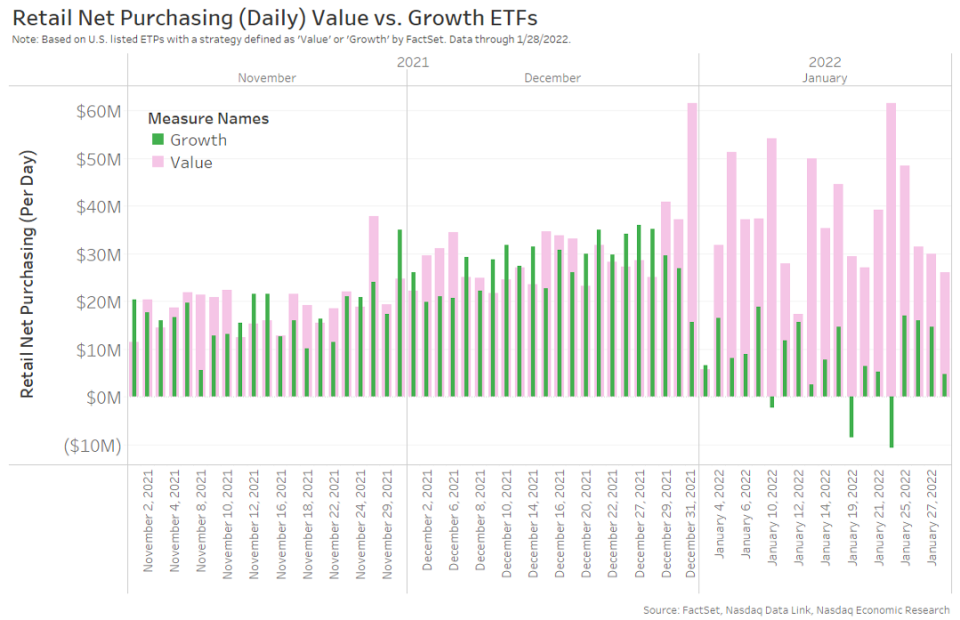
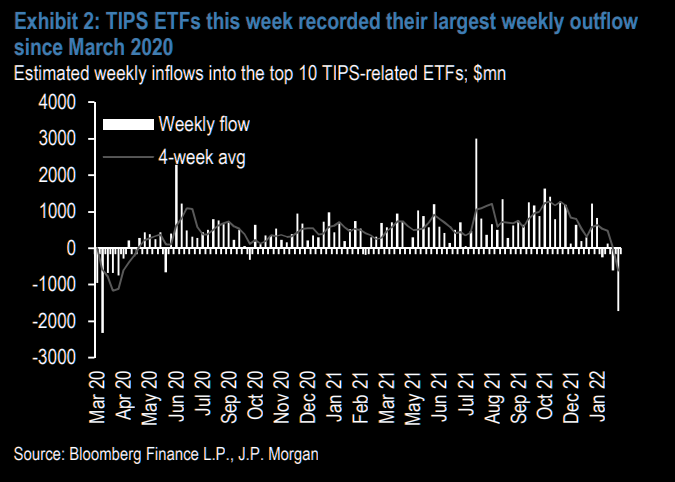
For one, ARK Invest’s Catherine Wood recently made an interesting point suggesting events of today are the exact opposite of the events leading into the tech-and-telecom bust.

“During the tech-and-telecom bubble, … investors were falling all over each other, trying to one-up each other, to get a bigger tech position, because tech in the indexes had moved to 35%. We saw many portfolios with 40%, 50% tech.”

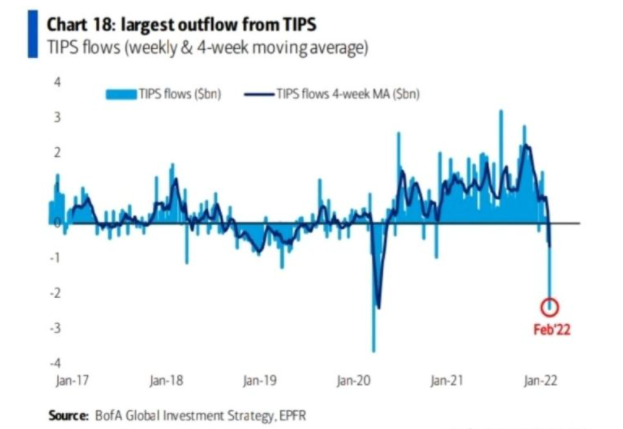
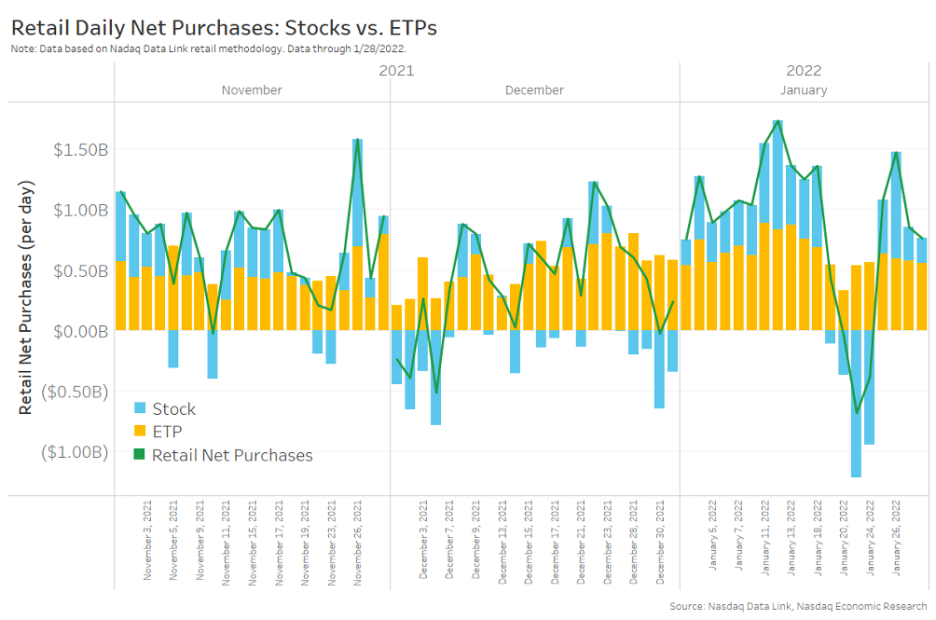
Basically, Wood thinks that investors are dumping single-stocks for index exposure. The below data supports this.

“We think that decision is going to prove to be just as incorrect as the decision to move en masse in the late 90s.”

Graphic: Per Nasdaq, “we’ve seen patches of retail selling of stocks that have mostly lasted for less than a week (blue bars in Chart 2). Interestingly, ETFs (yellow bars) remained net buy every single day, albeit at lower levels than usual in the last week of January.”

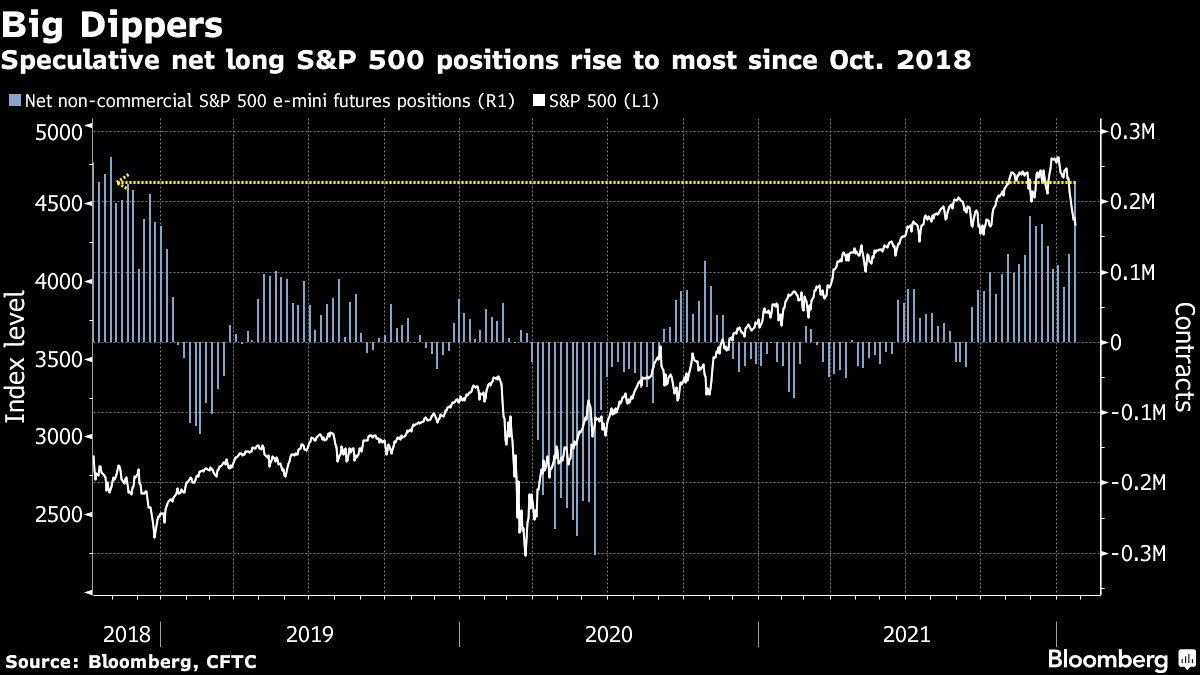
There is also the increasing demand for positive delta (long) exposure in the indexes as participants hedge their negative delta (short) exposure in the single stocks.

Graphic: Via Bloomberg.

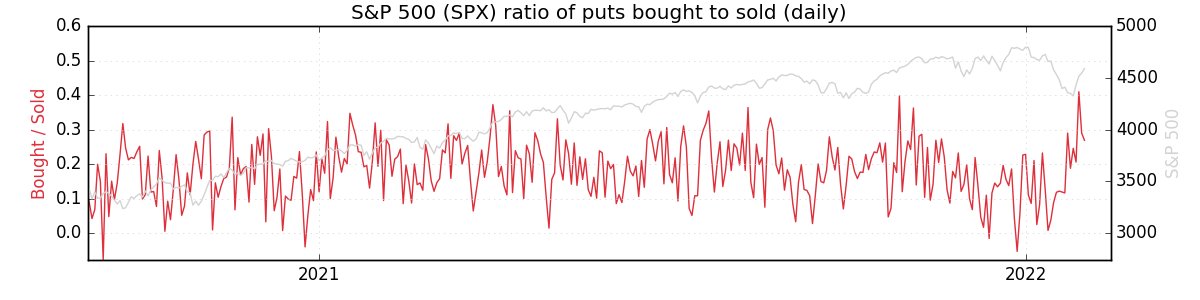
Then, there is also the supply and demand for options protection, at the index level. 

Mainly, the indexes are where the world will hedge and so the effects of dealers re-hedging their risks to decaying options protection provide markets a sort of passive buying support.

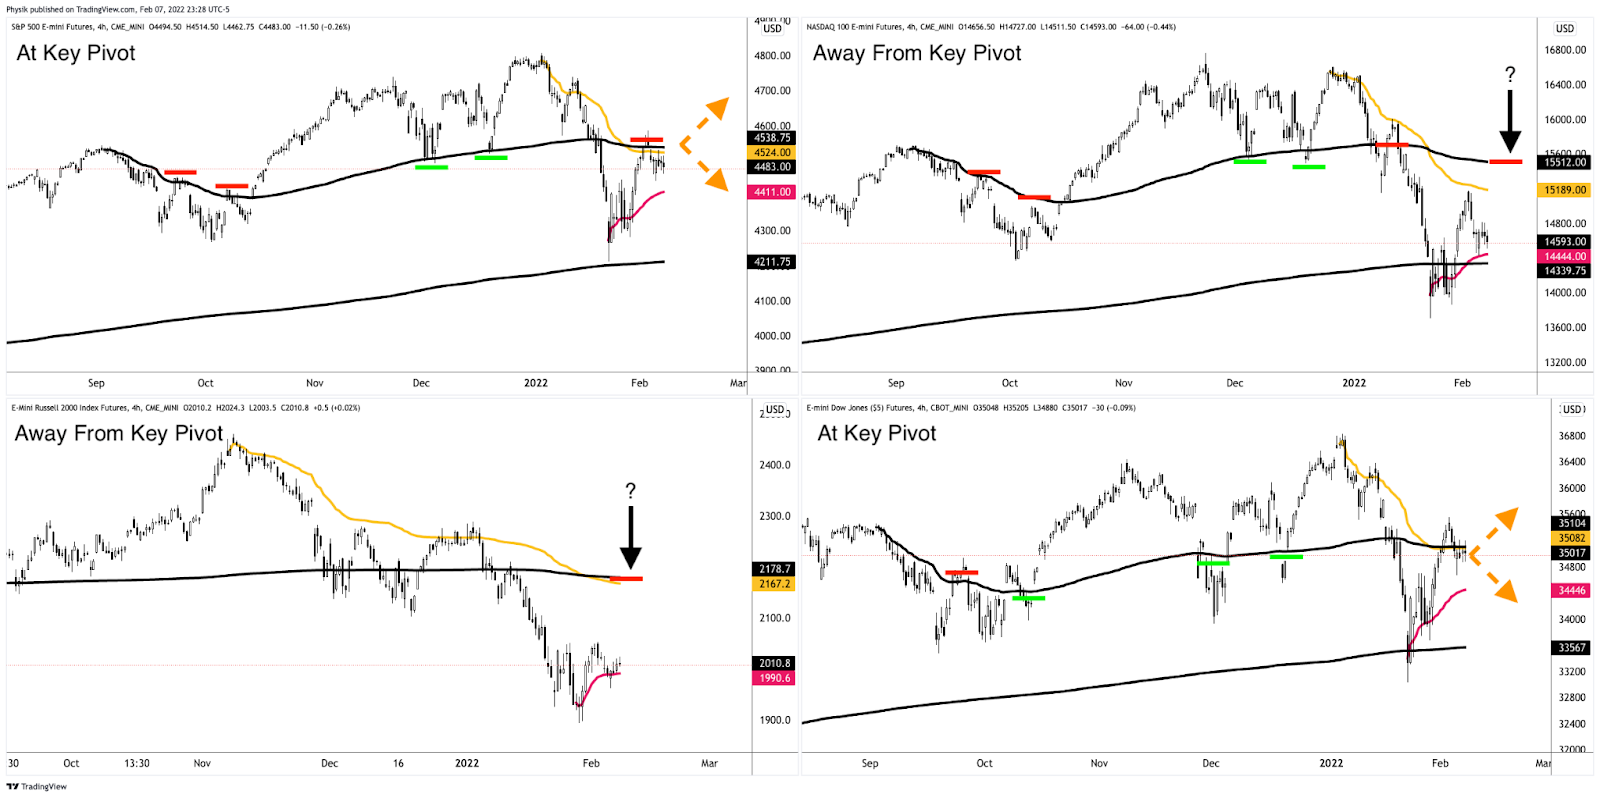
The S&P 500, which carries a more liquid derivatives complex and less exposure to tech- and growth-heavy constituents (when compared to the Nasdaq 100 and Russell 2000), appears stronger, but not as strong as the Dow Jones Industrial Average, a clear beneficiary of the rotation out of growth- and innovation-names to value- and cyclical-type stocks.

Graphic: Anchored Volume Weighted Average Price (VWAP) analysis via Physik Invest. Notice Dow Jones Industrial Average (bottom right) and S&P 500 (top left) strength, as well as Nasdaq 100 (top right) and Russell 2000 (bottom left) weakness. Key pivots marked off.

All the last-mentioned point is trying to make is the following: try hard enough and you’ll find an explanation for anything. 

Sometimes, though, a focus on the simplest of explanations (e.g., demand for assets that perform better in higher rate environments) may suffice in navigating volatility.

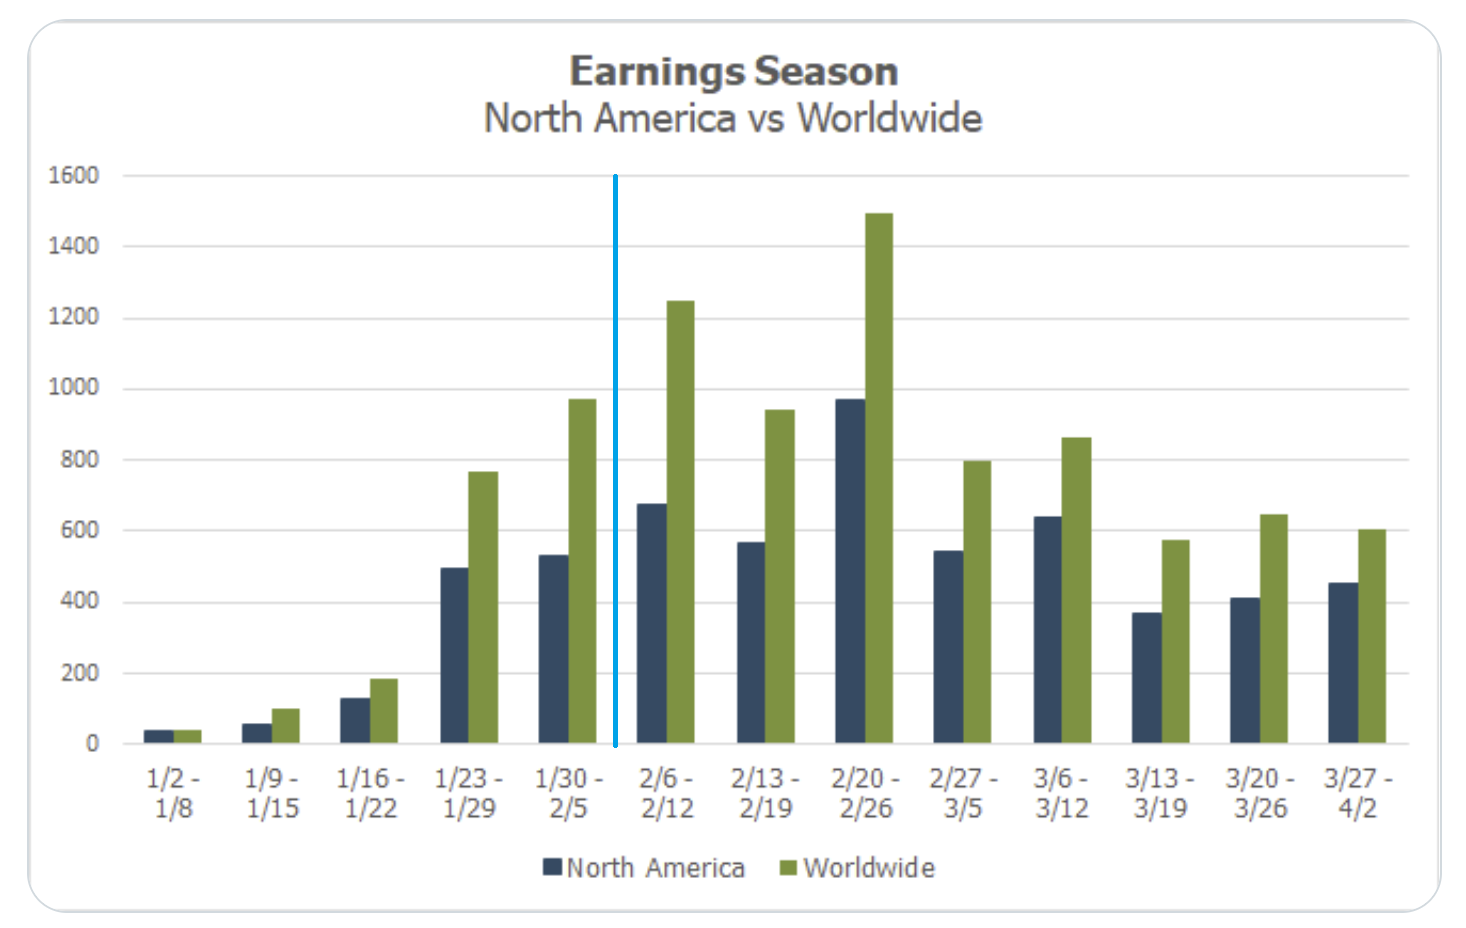
Going forward, despite many index heavy-weights reporting, the earnings season is set to accelerate over the coming weeks, and equity index futures traders have positioned themselves (as evidenced by tight, sideways trade) to react to new information accordingly.

Graphic: Via @MikeZaccardi. Retrieved from Callum Thomas.

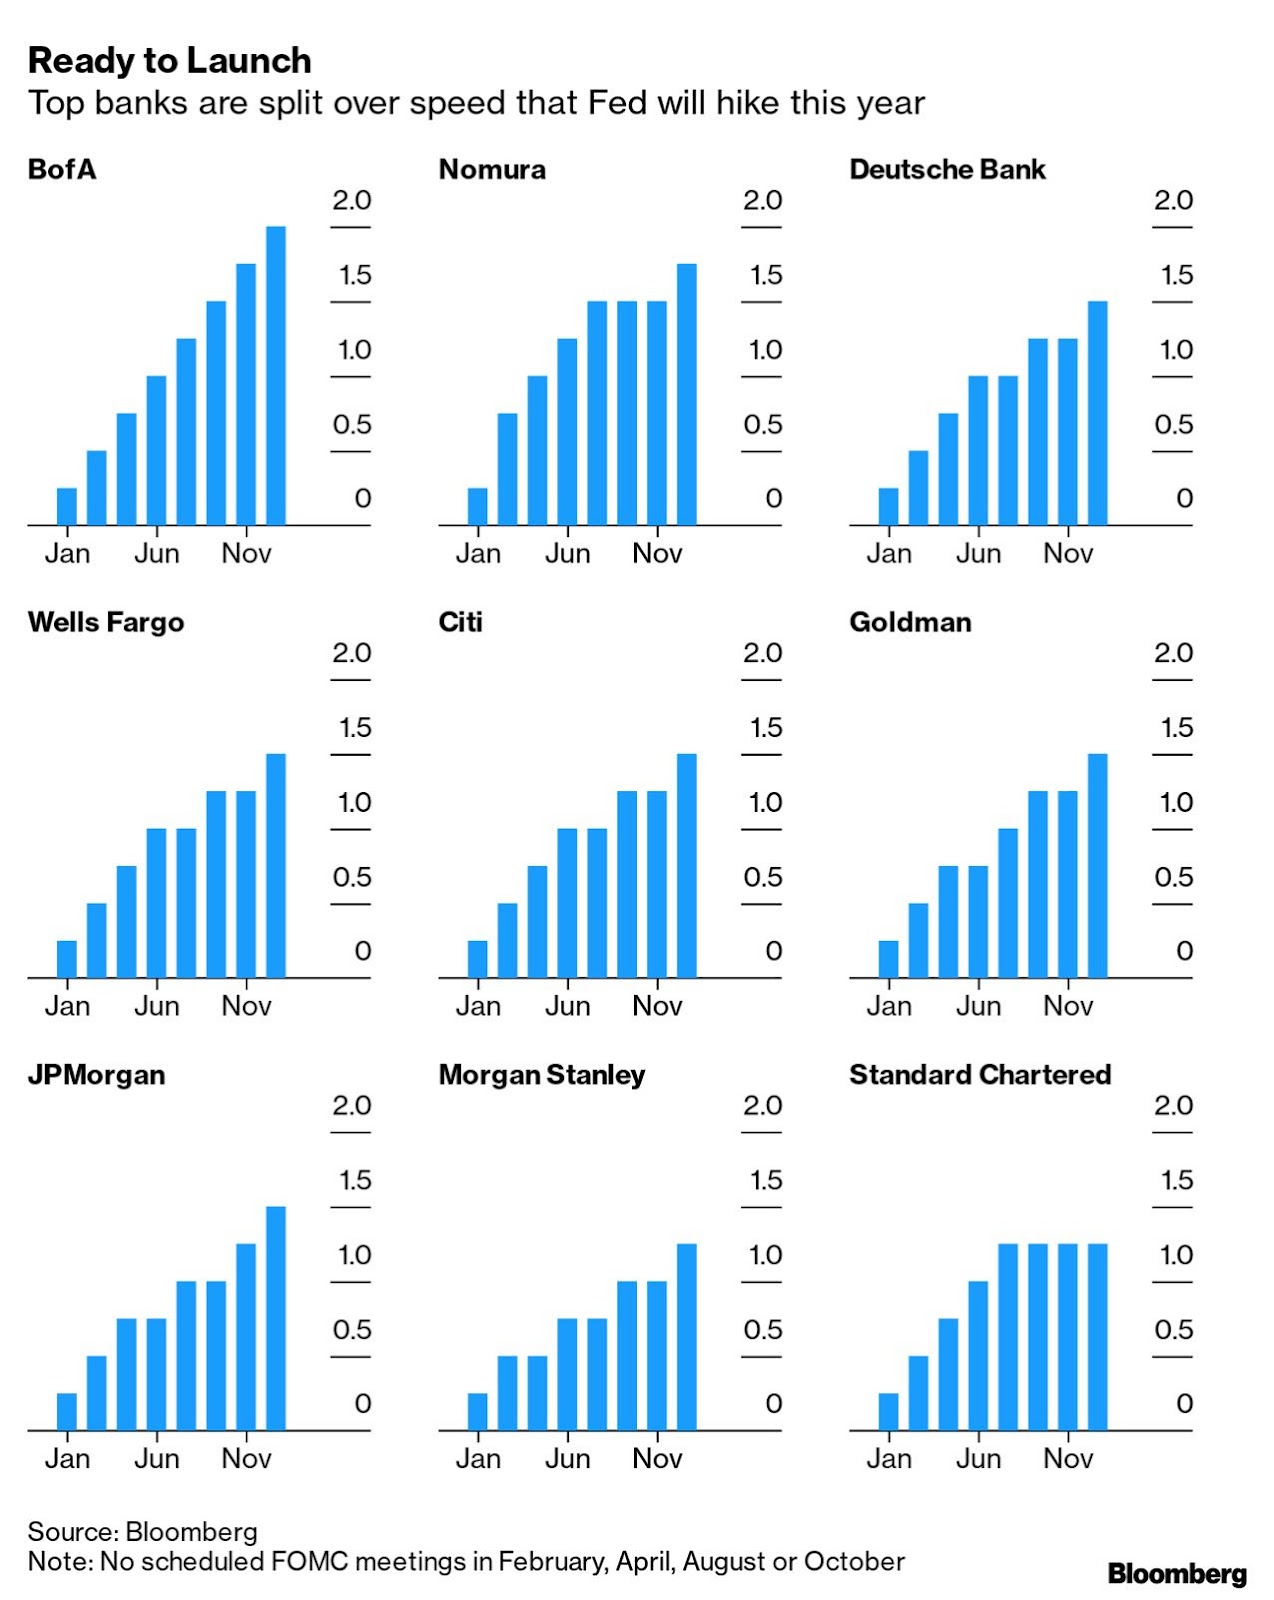
Per JPMorgan Chase & Co (NYSE: JPM) strategists, the bull thesis remains intact. 

The pace of economic growth is to stabilize in 2022 and the Federal Reserve is unlikely to move further into the hawkish territory.

We’re “Continuously seeing gains for earnings. Consensus projections for 2022 will most likely prove too low again,” JPM explains. “P/E multiples are elevated, but not equity yields vs credit & bond yields. We expect further, mild and benign, P/E compression in 2022. Overall, the picture is favorable, post the recent de-risking.”

Graphic: Via The Market Ear. As money supply (which played a part in increased CPI figures) is slated to fall, there have been large outflows from Treasury Inflation-Protected Securities. @MacroAlf notes that these are some of the largest outflows “since the pandemic crash in March 2020. CPI might be 7% today, but markets are forward-looking.”

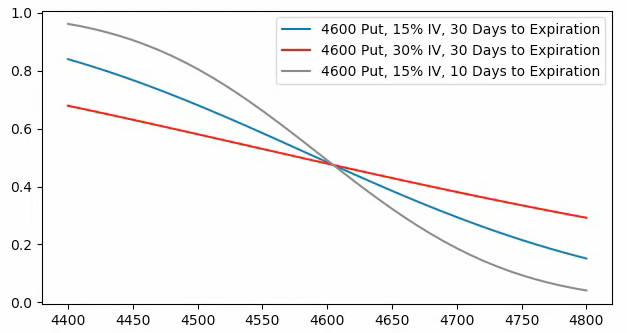
Positioning: Though markets will tend toward instability so long as volatility is heightened and products (especially the index constituents) remain in negative gamma, the dip lower and demand for protection may serve to prime the market for upside (when volatility starts to compress again and counterparties unwind hedges thus supporting any attempt higher).

Graphic: VIX term structure compresses markedly at the front end affecting most shorter-dated options more sensitive to the effects of direction and volatility.

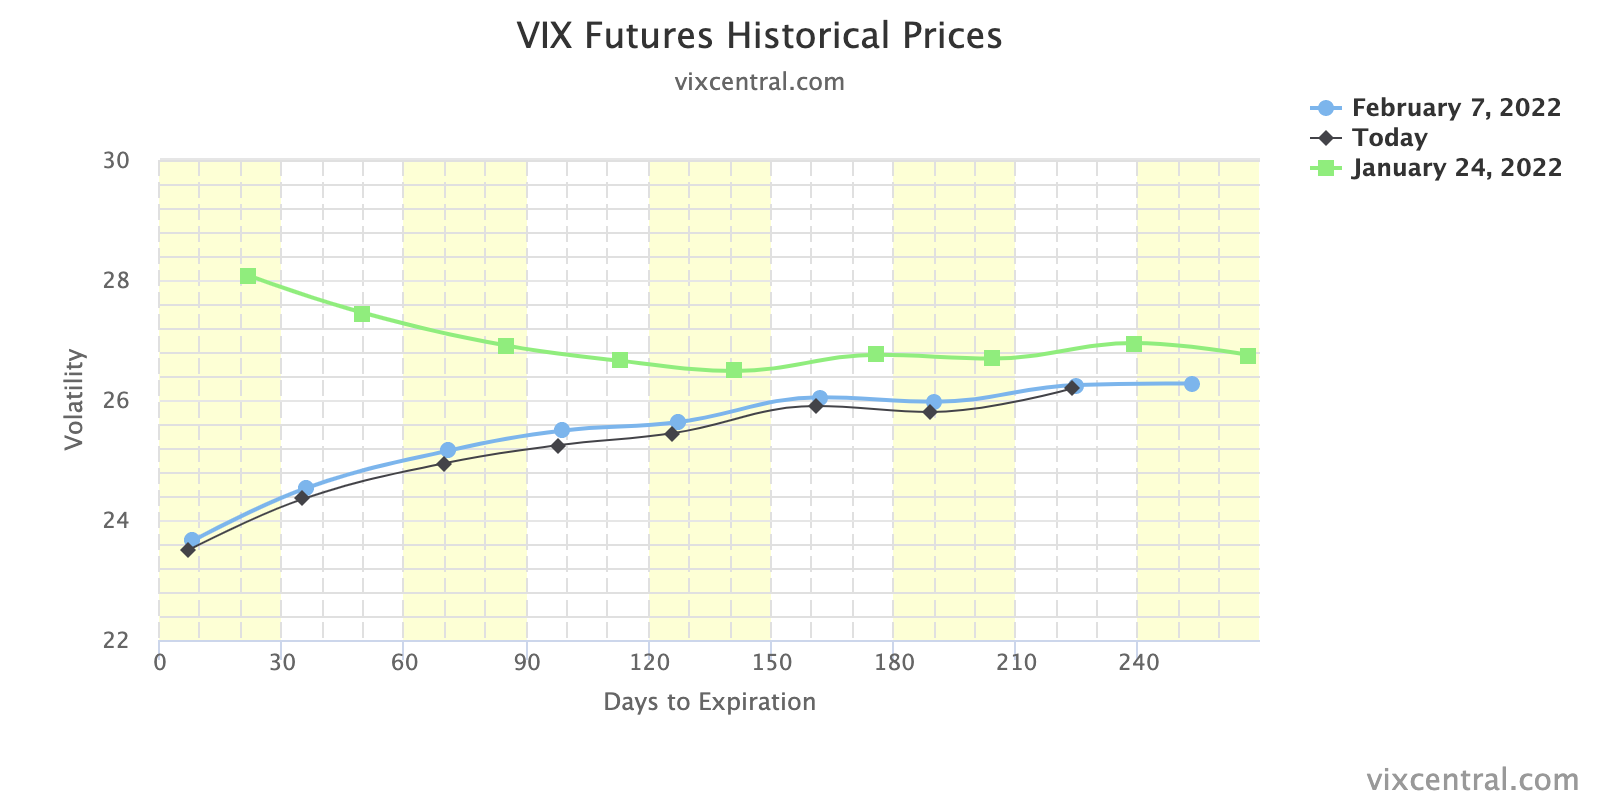
“Failure to expand the range, lower, on the index level, at least, likely invokes supportive dealer hedging flows with respect to time (‘charm’) and volatility (‘vanna’),” SpotGamma adds.

Graphic: Via SpotGamma. “SPX prices X-axis. Option delta Y-axis. When the factors of implied volatility and time change, hedging ratios change. For instance, if SPX is at $4,700.00 and IV jumps 15% (all else equal), the dealer may sell an additional 0.2 deltas to hedge their exposure to the addition of a positive 0.2 delta. The graphic is for illustrational purposes, only.”

Taking into account options positioning, versus buying pressure (measured via short sales or liquidity provision on the market-making side), metrics point to “[m]odest bullishness on the 1-month timeframe.”

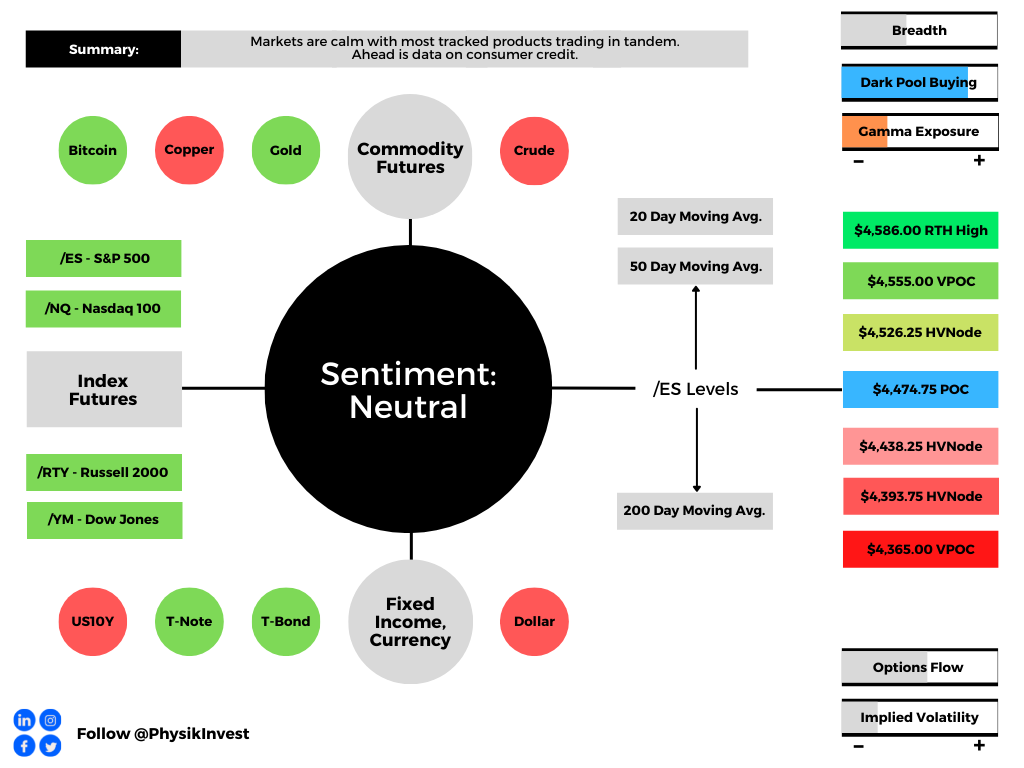
Technical: As of 6:20 AM ET, Tuesday’s regular session (9:30 AM – 4:00 PM ET), in the S&P 500, will likely open in the lower part of a negatively skewed overnight inventory, inside of prior-range and -value, suggesting a limited potential for immediate directional opportunity.

Balance-Break Scenarios: A change in the market (i.e., the transition from two-time frame trade, or balance, to one-time frame trade, or trend) may soon occur.

Monitor for acceptance (i.e., more than 1-hour of trade) outside of the balance area. Rejection (i.e., return inside of balance) portends a move to the opposite end of the balance.

In the best case, the S&P 500 trades higher; activity above the $4,497.00 untested point of control (VPOC) puts in play the $4,526.25 high volume area (HVNode). Initiative trade beyond the HVNode could reach as high as the $4,555.00 VPOC and $4,586.00 RTH High (regular trade high), or higher.

In the worst case, the S&P 500 trades lower; activity below the $4,497.00 VPOC puts in play the $4,438.25 HVNode. Initiative trade beyond the $4,438.25 HVNode could reach as low as the $4,393.75 HVNode and $4,365.00 VPOC, or lower.

Click here to load today’s key levels into the web-based TradingView charting platform. Note that all levels are derived using the 65-minute timeframe. New links are produced, daily.
Graphic: 65-minute profile chart of the Micro E-mini S&P 500 Futures.

Definitions

Volume Areas: A structurally sound market will build on areas of high volume (HVNodes). Should the market trend for long periods of time, it will lack sound structure, identified as low volume areas (LVNodes). LVNodes denote directional conviction and ought to offer support on any test. 

If participants were to auction and find acceptance into areas of prior low volume (LVNodes), then future discovery ought to be volatile and quick as participants look to HVNodes for favorable entry or exit.

POCs: POCs are valuable as they denote areas where two-sided trade was most prevalent in a prior day session. Participants will respond to future tests of value as they offer favorable entry and exit.

Volume-Weighted Average Prices (VWAPs): A metric highly regarded by chief investment officers, among other participants, for quality of trade. Additionally, liquidity algorithms are benchmarked and programmed to buy and sell around VWAPs.

About

After years of self-education, strategy development, mentorship, and trial-and-error, Renato Leonard Capelj began trading full-time and founded Physik Invest to detail his methods, research, and performance in the markets.

Capelj is also a Benzinga finance and technology reporter interviewing the likes of Shark Tank’s Kevin O’Leary, JC2 Ventures’ John Chambers, FTX’s Sam Bankman-Fried, and ARK Invest’s Catherine Wood, as well as a SpotGamma contributor developing insights around impactful options market dynamics.

Disclaimer

Physik Invest does not carry the right to provide advice.

In no way should the materials herein be construed as advice. Derivatives carry a substantial risk of loss. All content is for informational purposes only.

Categories
Commentary

Daily Brief For February 7, 2022

Editor’s Note: The Daily Brief is a free glimpse into the prevailing fundamental and technical drivers of U.S. equity market products. Join the 200+ that read this report daily, below!

What Happened

Overnight, markets were calm as most equity index, commodity, and bond futures traded in tandem.

Ahead is data on consumer credit (3:00 PM ET).

Graphic updated 7:50 AM ET. Sentiment Neutral if expected /ES open is inside of the prior day’s range. /ES levels are derived from the profile graphic at the bottom of the following section. Levels may have changed since initially quoted; click here for the latest levels. SqueezeMetrics Dark Pool Index (DIX) and Gamma (GEX) calculations are based on where the prior day’s reading falls with respect to the MAX and MIN of all occurrences available. A higher DIX is bullish. At the same time, the lower the GEX, the more (expected) volatility. Learn the implications of volatility, direction, and moneyness. SHIFT data used for S&P 500 (INDEX: SPX) options activity. Note that options flow is sorted by the call premium spent; if more positive, then more was spent on call options. Breadth reflects a reading of the prior day’s NYSE Advance/Decline indicator. VIX reflects a current reading of the CBOE Volatility Index (INDEX: VIX) from 0-100.

What To Expect

Fundamental: On the back of divergent breadth, geopolitical tensions, the prospect of reduced stimulus to combat inflation, wild responses to earnings, and disappointments in real demand and growth, 2022 has panned out as an incredibly bearish year for the stock and bond market.

Amidst this deleveraging of sorts, the S&P 500, in particular, traded well into correction territory, albeit in line with the average non-recessionary pullback of about 15%, and seasonality patterns of mid-term election years.

Graphic: Via Seth Golden, “Not sure investors realize just how BEARISH this year has been to date.”

According to an article from Nasdaq Inc’s (NASDAQ: NDAQ) Phil Mackintosh, retail investors have become even more active, setting “a new record for gross trading (buying and selling).”

To note, despite the recent “3.9 standard deviation share disposal,” when “retail investors offloaded a net $1.36 billion worth of stock by noon,” January 24, as discussed in prior Daily Briefs, retail investors “were still net buyers of stocks in January, adding $5 billion to their holdings for the month.”

What’s interesting though is retail’s reduced interest in ETF products tracking growth (those which have the most to lose in a higher rate environment).

Graphic: “Suddenly retail have less interest in growth ETFs,” via Nasdaq.

That’s amidst the fear of contractionary monetary policy, so to speak.

To explain, with additions in money supply, there were increases in consumer prices and monetary policymakers are now looking to temper those (supposed non-transitory) increases.

According to ARK Invest’s Catherine Wood, “we’ve seen money growth go from 27% at its peak during the coronavirus, to 13%, recently.”

In tempering this inflation, Wood, too, thinks that rate hikes are on the table heading into the mid-term election cycle. 

Contrary to commentary that alludes to the Federal Reserve (Fed) hiking between 4 and 7 times, Wood thinks that “50 basis points is the number that the Fed will basically [use to] telegraph that it means business and that it’s going to head inflation off.”

Graphic: Per Bloomberg, “Wall Street expects front-loaded hikes: Goldman Sachs Group Inc. and JPMorgan Chase & Co. are aligned on five hikes in 2022, while Bank of America Corp. is out front with a seven-hike forecast.”

“They might want to do the 50 basis points just to say: ‘Okay, we’re done for a while, now,’ … [because] I think the Fed could overdo it quite quickly.”

Wood’s fears come as @MacroAlf put well recently: 

“If the fast increase in the rate of change of money supply (M2) led to a sharp increase in the rate of change of prices (CPI),” what happens to inflation if M2 is falling?

Pursuant to Wood and @MacroAlf’s comments are large outflows from Treasury Inflation-Protected Securities (TIPS) that “protect against inflation because they mirror the movements of the consumer price index (CPI),” according to Nerd Wallet.

Graphic: @MacroAlf notes: “Largest weekly outflow from TIPS since the pandemic crash in March 2020. CPI might be 7% today, but markets are forward-looking.”

Positioning: Over the past weeks, measures of implied volatility (IV) expanded amidst heightened demand for negative-delta (short call and long put) exposure on the part of customers. 

Counterparties, in hedging their positive-delta (long call, short put) risk, sold stock and futures (added negative delta hedges), and this pressured markets. 

However, as SqueezeMetrics puts it well, “When investors buy puts, but the underlying doesn’t violently go down, those puts decay.”

Graphic: Ratio of puts bought to sold, via SqueezeMetrics.

Basically, demand for protection can result in options decay briefly taking a back seat, if you will. 

As markets settle, though, “decay returns with vengeance,” according to SpotGamma.

“As time and volatility trend to zero (as all options expire), given the current market environment, dealers’ exposure to the risk of out-of-the-money protection will decline. All that means is that the market ought to be supported by positive vanna and charm flows as dealers unwind short-delta hedges to decaying positive-delta protection (they are short).”

Graphic: Via SpotGamma. “SPX prices X-axis. Option delta Y-axis. When the factors of implied volatility and time change, hedging ratios change. For instance, if SPX is at $4,700.00 and IV jumps 15% (all else equal), the dealer may sell an additional 0.2 deltas to hedge their exposure to the addition of a positive 0.2 delta. The graphic is for illustrational purposes, only.”

Taking into account options positioning, versus buying pressure (measured via short sales or liquidity provision on the market-making side), metrics point to “[m]odest bullishness on the 1-month timeframe.”

Technical: As of 6:20 AM ET, Monday’s regular session (9:30 AM – 4:00 PM ET), in the S&P 500, will likely open in the middle part of a positively skewed overnight inventory, inside of prior-range and -value, suggesting a limited potential for immediate directional opportunity.

In the best case, the S&P 500 trades higher; activity above the $4,474.75 point of control (POC) puts in play the $4,526.25 high volume area (HVNode). Initiative trade beyond the HVNode could reach as high as the $4,555.00 untested point of control (VPOC) and $4,586.00 regular trade high (RTH High), or higher.

In the worst case, the S&P 500 trades lower; activity below the $4,474.75 POC puts in play the $4,438.25 HVNode. Initiative trade beyond the $4,438.25 HVNode could reach as low as the $4,393.75 HVNode and $4,365.00 VPOC, or lower.

Click here to load today’s key levels into the web-based TradingView charting platform. Note that all levels are derived using the 65-minute timeframe. New links are produced, daily.
Graphic: 65-minute profile chart of the Micro E-mini S&P 500 Futures.

What People Are Saying

Definitions

Volume Areas: A structurally sound market will build on areas of high volume (HVNodes). Should the market trend for long periods of time, it will lack sound structure, identified as low volume areas (LVNodes). LVNodes denote directional conviction and ought to offer support on any test. 

If participants were to auction and find acceptance into areas of prior low volume (LVNodes), then future discovery ought to be volatile and quick as participants look to HVNodes for favorable entry or exit.

Gamma: Gamma is the sensitivity of an option to changes in the underlying price. Dealers that take the other side of options trades hedge their exposure to risk by buying and selling the underlying. When dealers are short-gamma, they hedge by buying into strength and selling into weakness. When dealers are long-gamma, they hedge by selling into strength and buying into weakness. The former exacerbates volatility. The latter calms volatility.

Vanna: The rate at which the delta of an option changes with respect to volatility.

Charm: The rate at which the delta of an option changes with respect to time.

POCs: POCs are valuable as they denote areas where two-sided trade was most prevalent in a prior day session. Participants will respond to future tests of value as they offer favorable entry and exit.

About

After years of self-education, strategy development, mentorship, and trial-and-error, Renato Leonard Capelj began trading full-time and founded Physik Invest to detail his methods, research, and performance in the markets.

Capelj is also a Benzinga finance and technology reporter interviewing the likes of Shark Tank’s Kevin O’Leary, JC2 Ventures’ John Chambers, FTX’s Sam Bankman-Fried, and ARK Invest’s Catherine Wood, as well as a SpotGamma contributor developing insights around impactful options market dynamics.

Disclaimer

Physik Invest does not carry the right to provide advice.

In no way should the materials herein be construed as advice. Derivatives carry a substantial risk of loss. All content is for informational purposes only.