
Editor’s Note: The Daily Brief is a free glimpse into the prevailing fundamental and technical drivers of U.S. equity market products. Join the 200+ that read this report daily, below!
What Happened
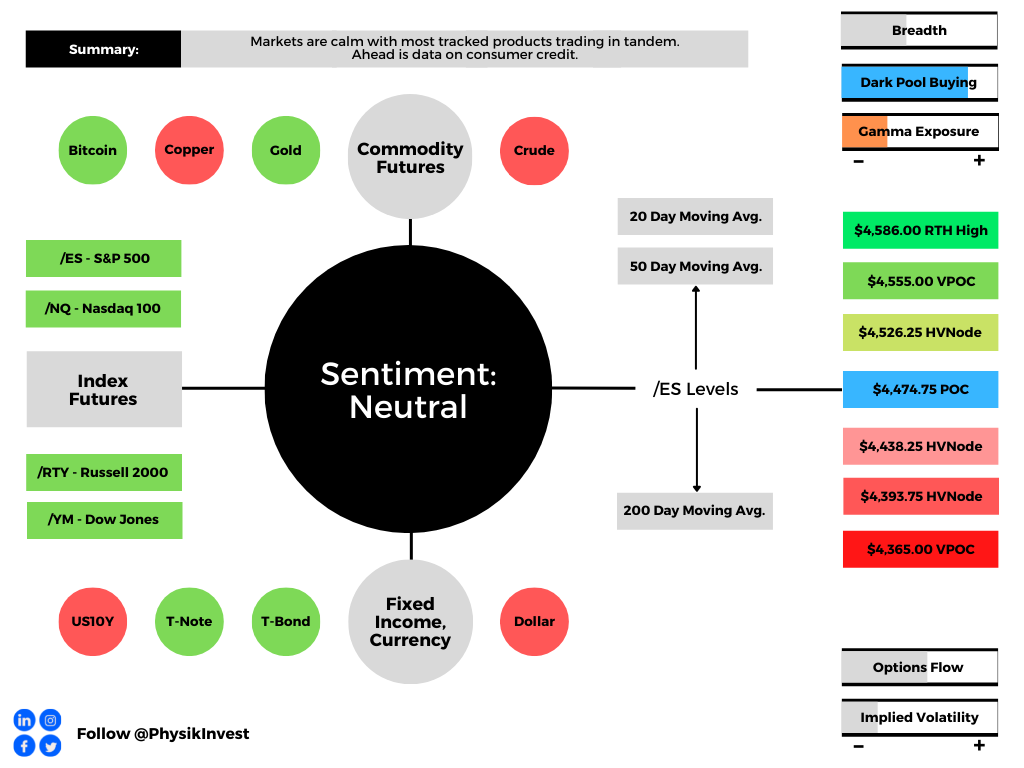
Overnight, markets were calm as most equity index, commodity, and bond futures traded in tandem.
Ahead is data on consumer credit (3:00 PM ET).
What To Expect
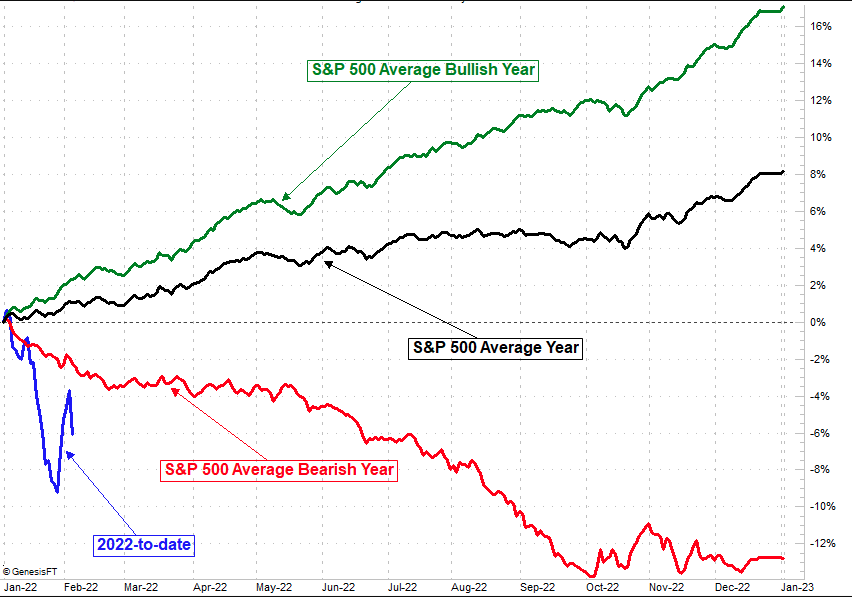
Fundamental: On the back of divergent breadth, geopolitical tensions, the prospect of reduced stimulus to combat inflation, wild responses to earnings, and disappointments in real demand and growth, 2022 has panned out as an incredibly bearish year for the stock and bond market.
Amidst this deleveraging of sorts, the S&P 500, in particular, traded well into correction territory, albeit in line with the average non-recessionary pullback of about 15%, and seasonality patterns of mid-term election years.
According to an article from Nasdaq Inc’s (NASDAQ: NDAQ) Phil Mackintosh, retail investors have become even more active, setting “a new record for gross trading (buying and selling).”
To note, despite the recent “3.9 standard deviation share disposal,” when “retail investors offloaded a net $1.36 billion worth of stock by noon,” January 24, as discussed in prior Daily Briefs, retail investors “were still net buyers of stocks in January, adding $5 billion to their holdings for the month.”
What’s interesting though is retail’s reduced interest in ETF products tracking growth (those which have the most to lose in a higher rate environment).
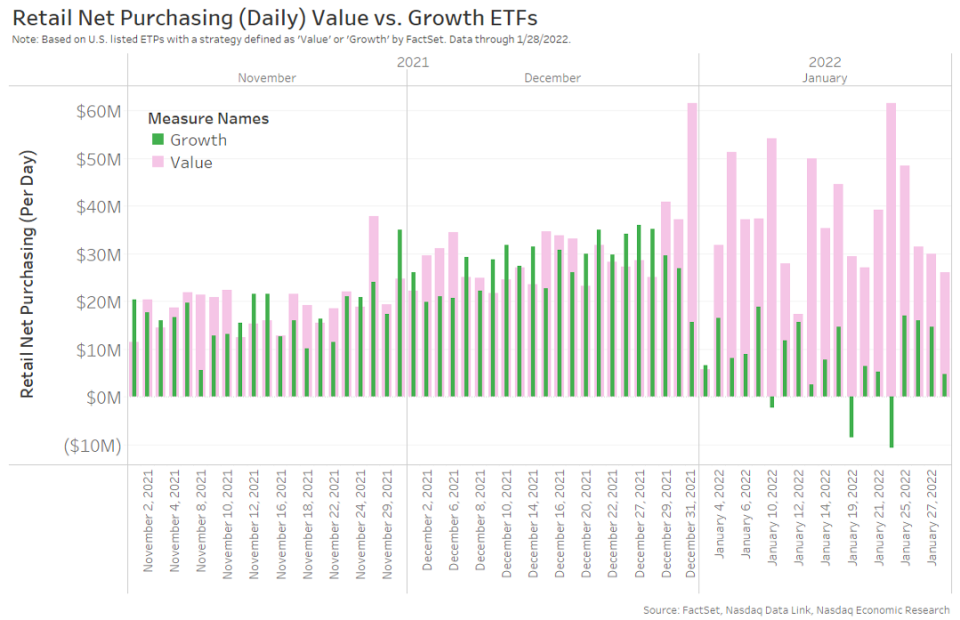
That’s amidst the fear of contractionary monetary policy, so to speak.
To explain, with additions in money supply, there were increases in consumer prices and monetary policymakers are now looking to temper those (supposed non-transitory) increases.
According to ARK Invest’s Catherine Wood, “we’ve seen money growth go from 27% at its peak during the coronavirus, to 13%, recently.”
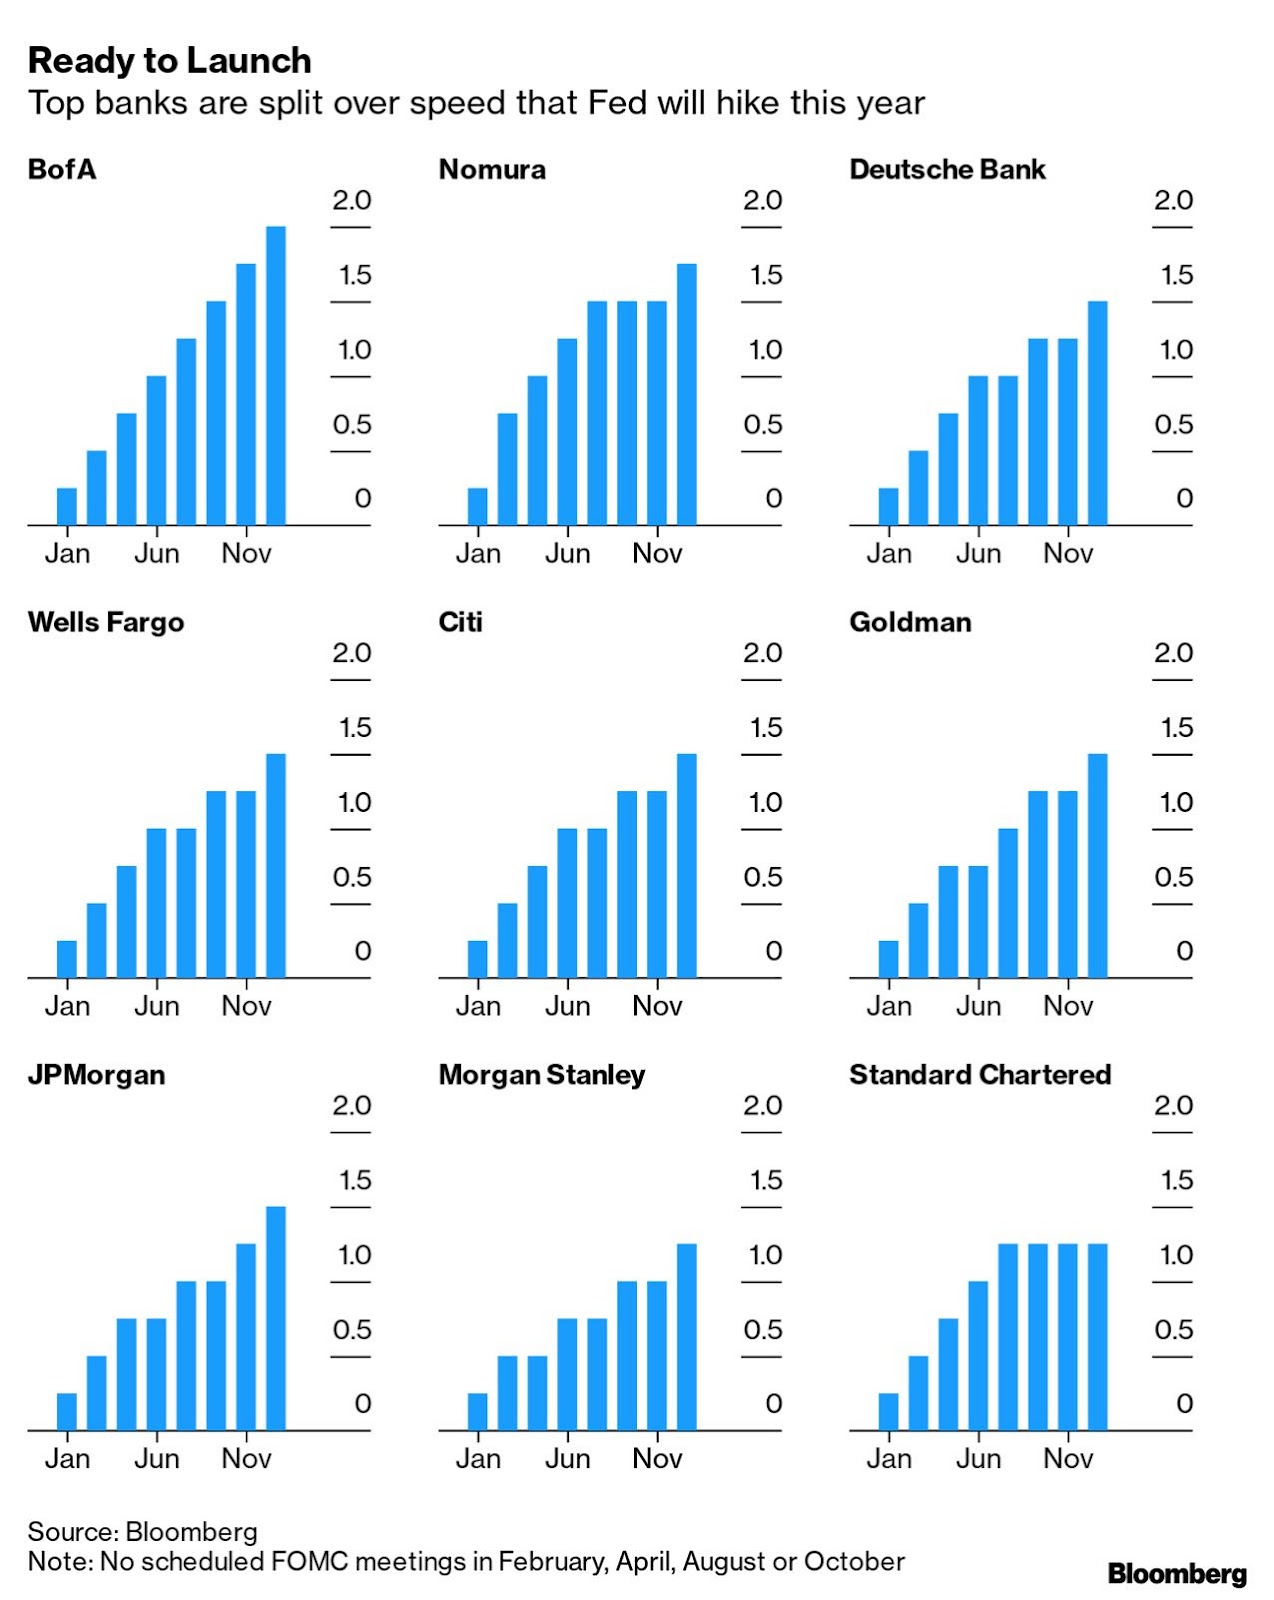
In tempering this inflation, Wood, too, thinks that rate hikes are on the table heading into the mid-term election cycle.
Contrary to commentary that alludes to the Federal Reserve (Fed) hiking between 4 and 7 times, Wood thinks that “50 basis points is the number that the Fed will basically [use to] telegraph that it means business and that it’s going to head inflation off.”
“They might want to do the 50 basis points just to say: ‘Okay, we’re done for a while, now,’ … [because] I think the Fed could overdo it quite quickly.”
Wood’s fears come as @MacroAlf put well recently:
“If the fast increase in the rate of change of money supply (M2) led to a sharp increase in the rate of change of prices (CPI),” what happens to inflation if M2 is falling?
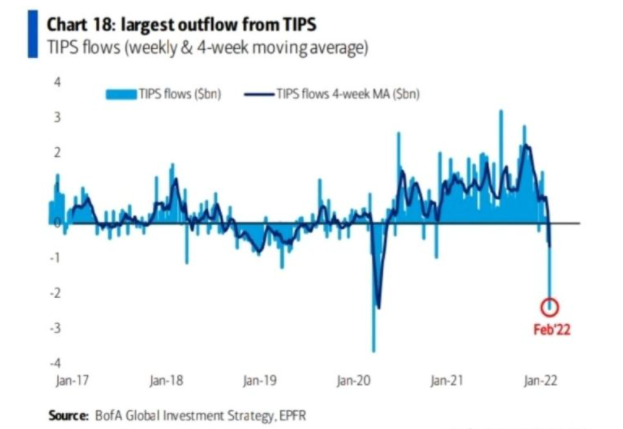
Pursuant to Wood and @MacroAlf’s comments are large outflows from Treasury Inflation-Protected Securities (TIPS) that “protect against inflation because they mirror the movements of the consumer price index (CPI),” according to Nerd Wallet.
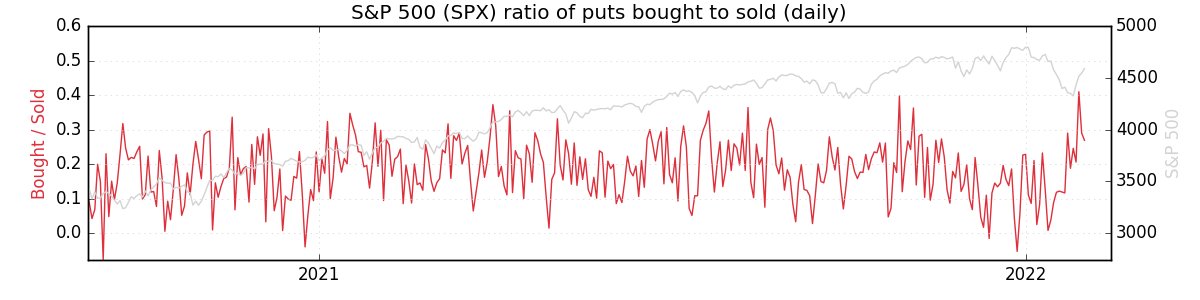
Positioning: Over the past weeks, measures of implied volatility (IV) expanded amidst heightened demand for negative-delta (short call and long put) exposure on the part of customers.
Counterparties, in hedging their positive-delta (long call, short put) risk, sold stock and futures (added negative delta hedges), and this pressured markets.
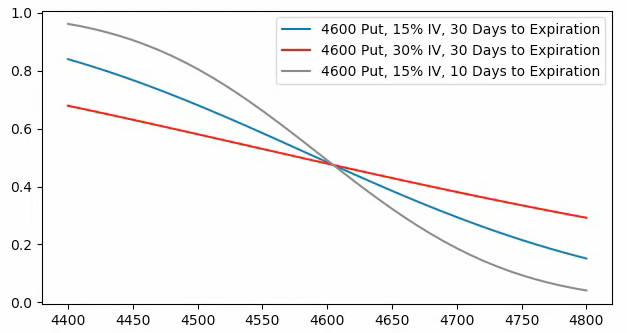
However, as SqueezeMetrics puts it well, “When investors buy puts, but the underlying doesn’t violently go down, those puts decay.”
Basically, demand for protection can result in options decay briefly taking a back seat, if you will.
As markets settle, though, “decay returns with vengeance,” according to SpotGamma.
“As time and volatility trend to zero (as all options expire), given the current market environment, dealers’ exposure to the risk of out-of-the-money protection will decline. All that means is that the market ought to be supported by positive vanna and charm flows as dealers unwind short-delta hedges to decaying positive-delta protection (they are short).”
Taking into account options positioning, versus buying pressure (measured via short sales or liquidity provision on the market-making side), metrics point to “[m]odest bullishness on the 1-month timeframe.”
Technical: As of 6:20 AM ET, Monday’s regular session (9:30 AM – 4:00 PM ET), in the S&P 500, will likely open in the middle part of a positively skewed overnight inventory, inside of prior-range and -value, suggesting a limited potential for immediate directional opportunity.
In the best case, the S&P 500 trades higher; activity above the $4,474.75 point of control (POC) puts in play the $4,526.25 high volume area (HVNode). Initiative trade beyond the HVNode could reach as high as the $4,555.00 untested point of control (VPOC) and $4,586.00 regular trade high (RTH High), or higher.
In the worst case, the S&P 500 trades lower; activity below the $4,474.75 POC puts in play the $4,438.25 HVNode. Initiative trade beyond the $4,438.25 HVNode could reach as low as the $4,393.75 HVNode and $4,365.00 VPOC, or lower.
Click here to load today’s key levels into the web-based TradingView charting platform. Note that all levels are derived using the 65-minute timeframe. New links are produced, daily.

What People Are Saying
Definitions
Volume Areas: A structurally sound market will build on areas of high volume (HVNodes). Should the market trend for long periods of time, it will lack sound structure, identified as low volume areas (LVNodes). LVNodes denote directional conviction and ought to offer support on any test.
If participants were to auction and find acceptance into areas of prior low volume (LVNodes), then future discovery ought to be volatile and quick as participants look to HVNodes for favorable entry or exit.
Gamma: Gamma is the sensitivity of an option to changes in the underlying price. Dealers that take the other side of options trades hedge their exposure to risk by buying and selling the underlying. When dealers are short-gamma, they hedge by buying into strength and selling into weakness. When dealers are long-gamma, they hedge by selling into strength and buying into weakness. The former exacerbates volatility. The latter calms volatility.
Vanna: The rate at which the delta of an option changes with respect to volatility.
Charm: The rate at which the delta of an option changes with respect to time.
POCs: POCs are valuable as they denote areas where two-sided trade was most prevalent in a prior day session. Participants will respond to future tests of value as they offer favorable entry and exit.
About
After years of self-education, strategy development, mentorship, and trial-and-error, Renato Leonard Capelj began trading full-time and founded Physik Invest to detail his methods, research, and performance in the markets.
Capelj is also a Benzinga finance and technology reporter interviewing the likes of Shark Tank’s Kevin O’Leary, JC2 Ventures’ John Chambers, FTX’s Sam Bankman-Fried, and ARK Invest’s Catherine Wood, as well as a SpotGamma contributor developing insights around impactful options market dynamics.
Disclaimer
Physik Invest does not carry the right to provide advice.
In no way should the materials herein be construed as advice. Derivatives carry a substantial risk of loss. All content is for informational purposes only.