The Daily Brief is a free glimpse into the prevailing fundamental and technical drivers of U.S. equity market products. Join the 200+ that read this report daily, below!
What Happened
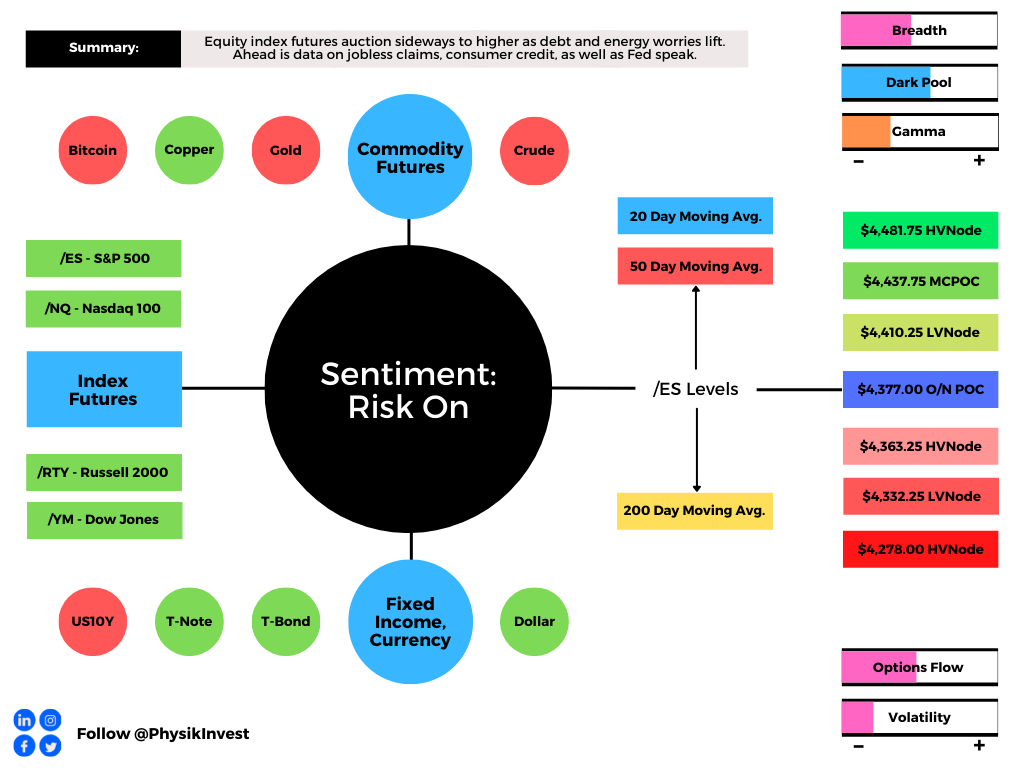
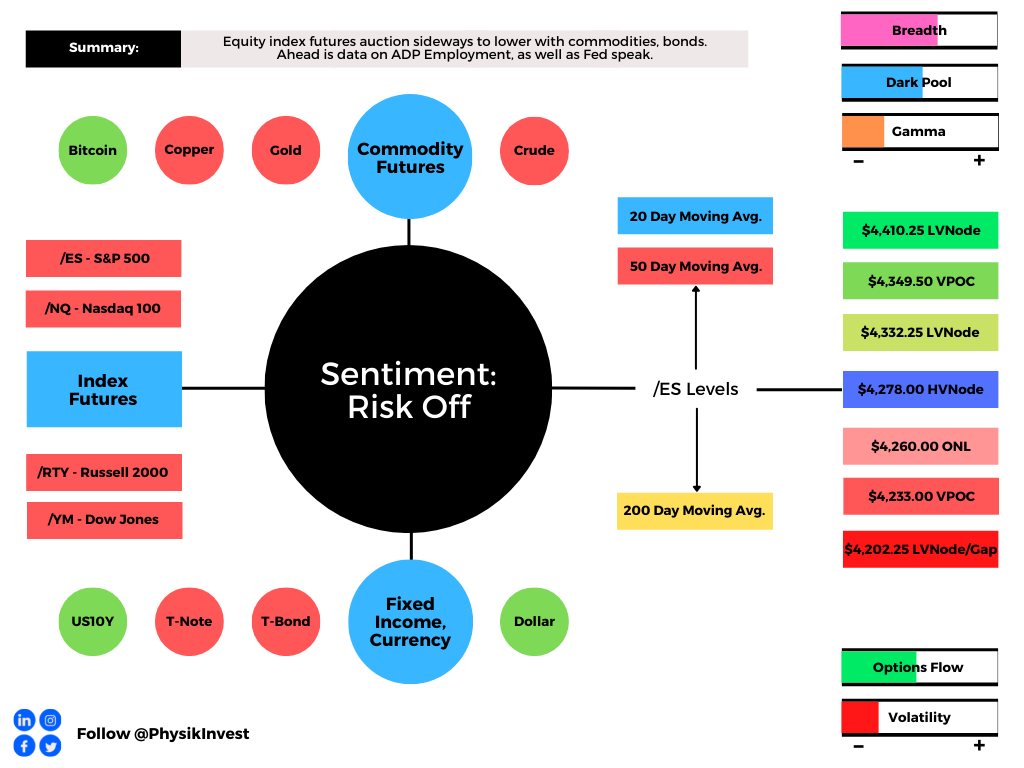
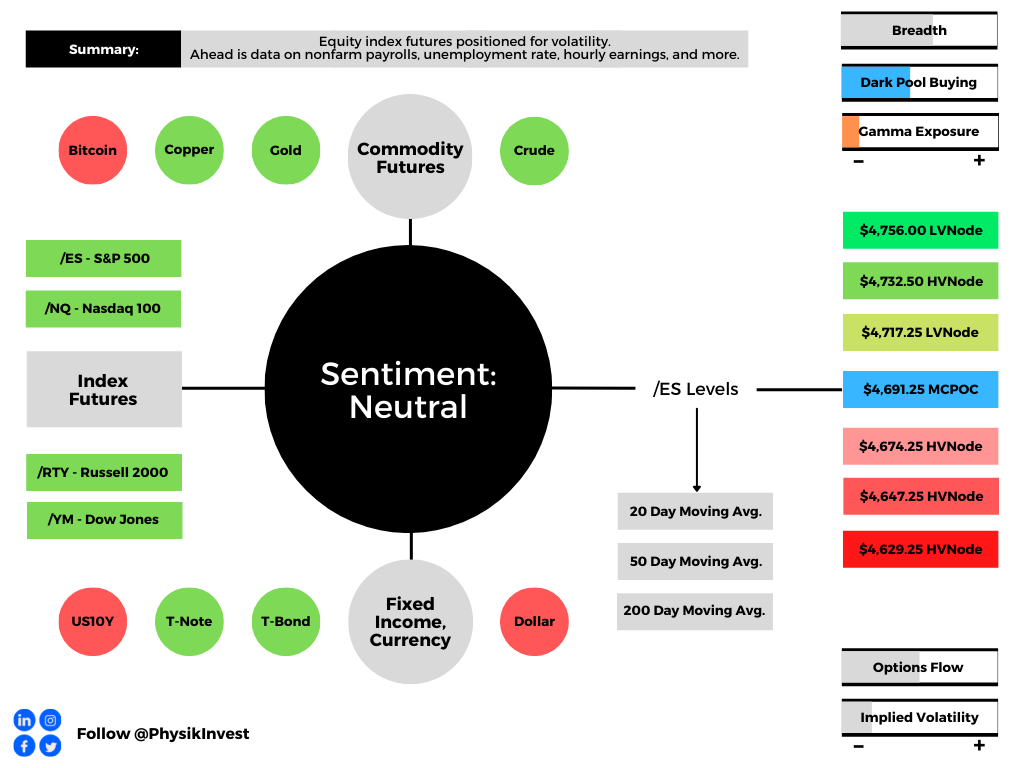
Equity index futures auctioned sideways, mostly, ahead of important economic releases such as data on Nonfarm payrolls, the unemployment rate, and average hourly earnings (8:30 AM ET), as well as Fed-speak (10:00 AM and 12:15 PM ET), and consumer credit data (3:00 PM ET).
What To Expect
Fundamental: Participants will receive further clarity around payrolls data.
According to Bloomberg, the expectation is that Friday’s jobs report ought to show the addition of about 450,000 workers, last month.
“[T]he so-called whisper number has already jumped to 500,000,” in light of this “Wednesday’s consensus-busting ADP Research Institute data that showed U.S. companies added the most jobs in seven months.”
This is all the while major equity indices are down on the week, “fueled by one of the most intense bouts of selling by professional speculators since the financial crisis.”
Per Goldman Sachs Group Inc (NYSE: GS) prime broker data, the sale of highly valued growth stocks reached levels not seen in more than 10 years. Selling worsened after minutes to the Federal Reserve’s last policy meeting pointed to faster hikes and balance sheet normalization.
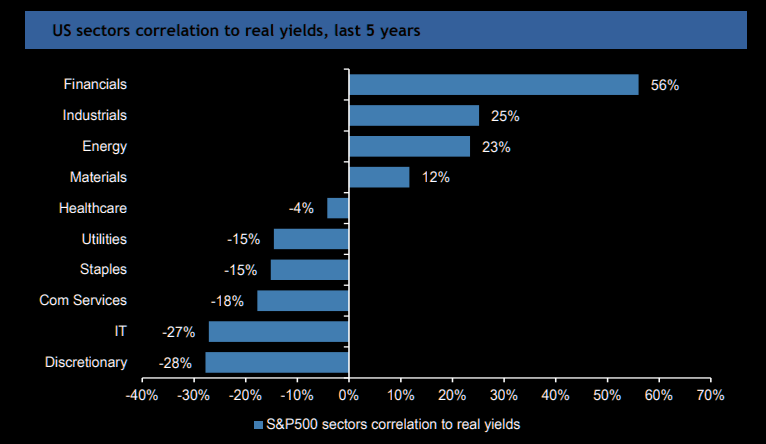
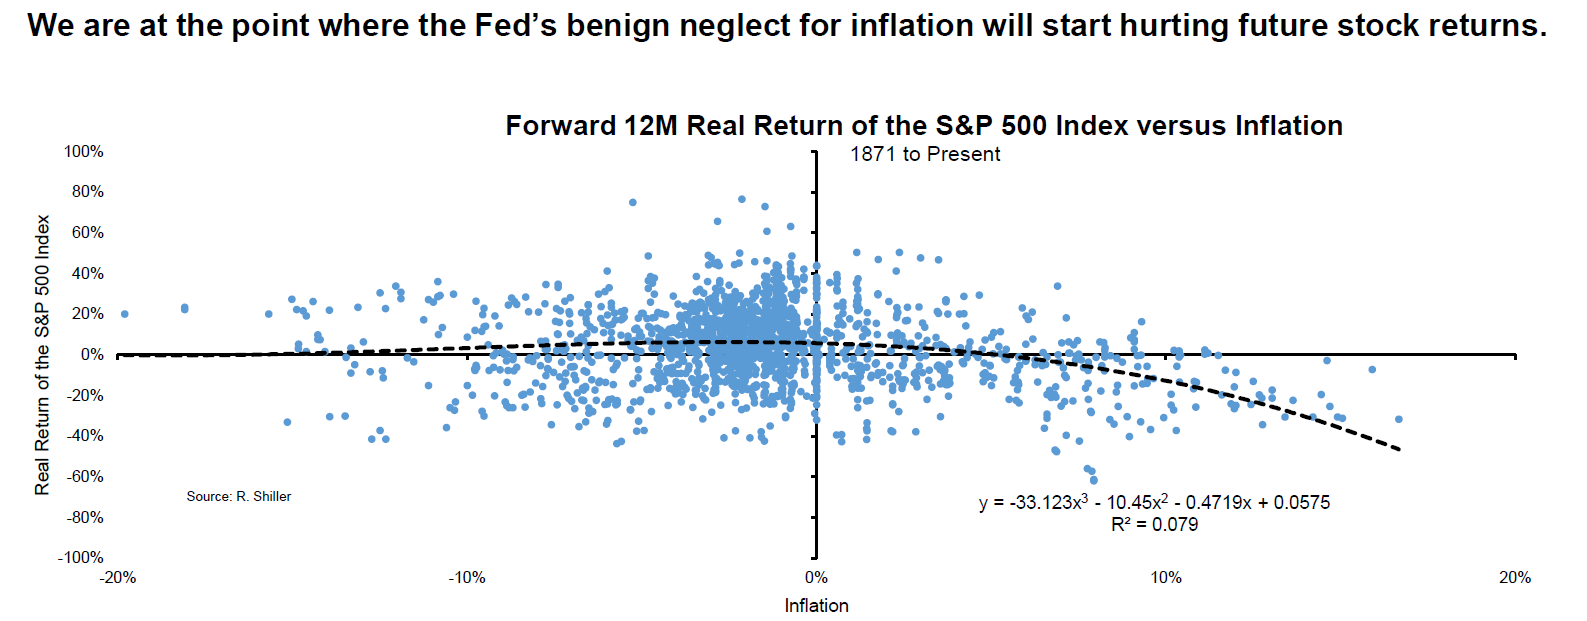
As higher rates are to fend off inflation, they, too, have the potential to decrease the present value of future earnings making stocks (especially high growth) less attractive.
“A strong [payrolls] print will see the market factor in hikes/quantitative tightening even earlier,” strategists at Mizuho International Plc said. “We’d therefore prefer to be positioned for more equity downside, and for higher yields.”
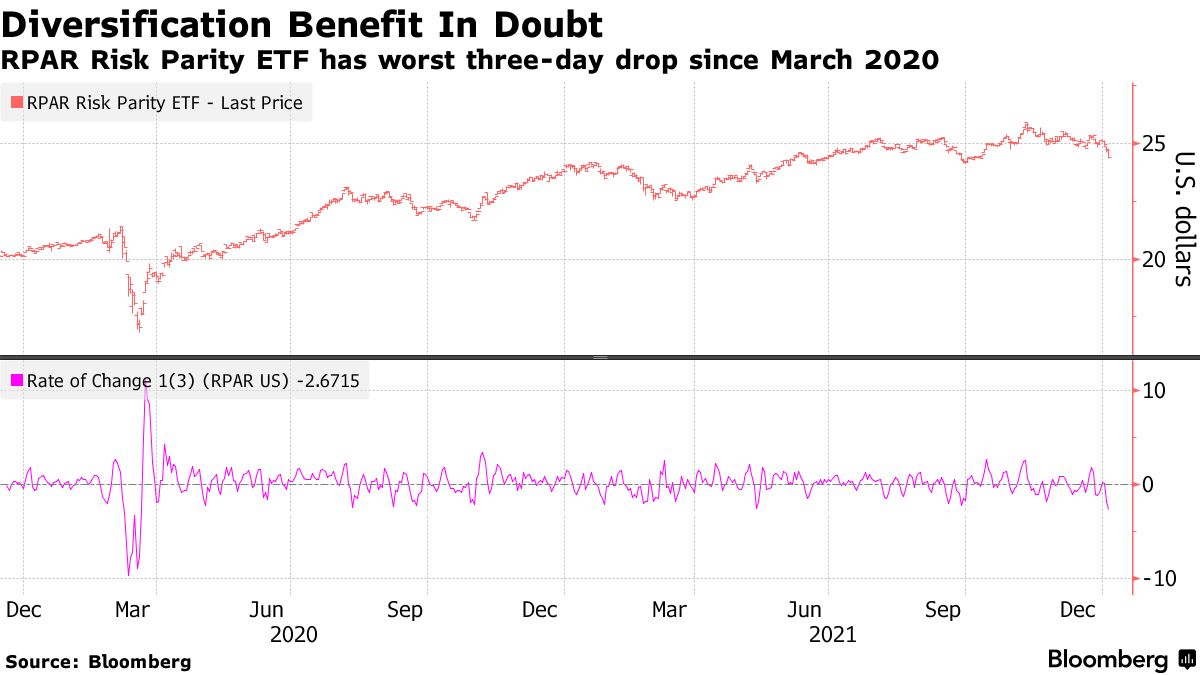
Positioning: Bonds down, equities down. Interesting, right?
Fresh in my mind is a conversation I had with Karan Sood, CEO and Managing Director, Head of Product Development at Cboe Vest Financial LLC, regarding his firm’s packaged options and volatility targeting strategies that help investors manage their portfolio volatility.
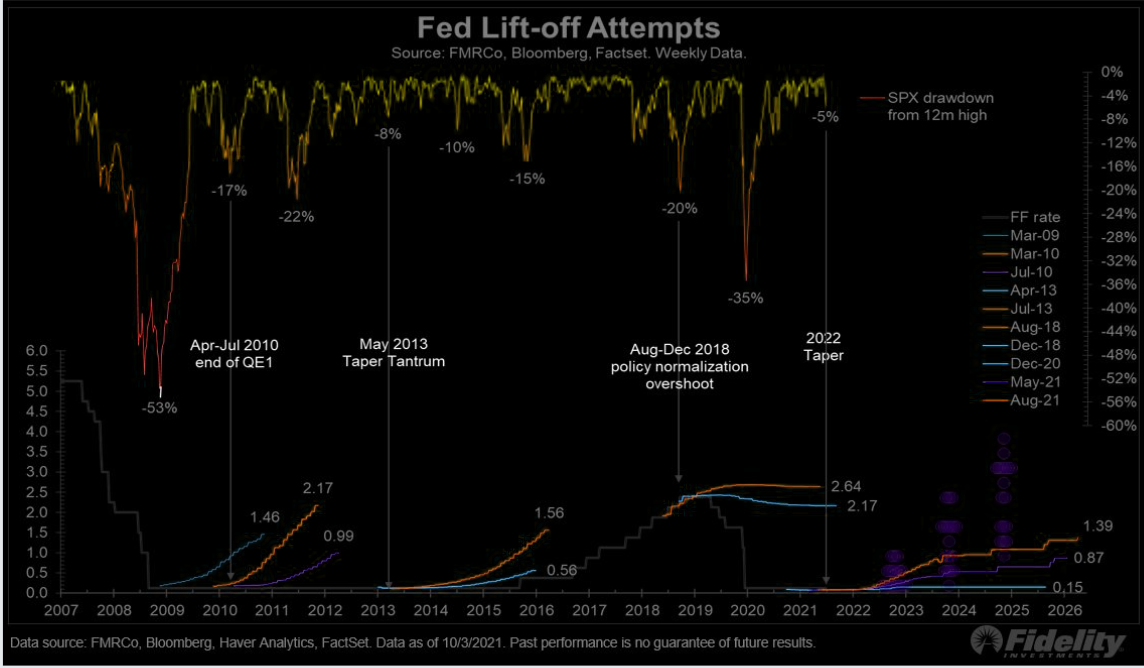
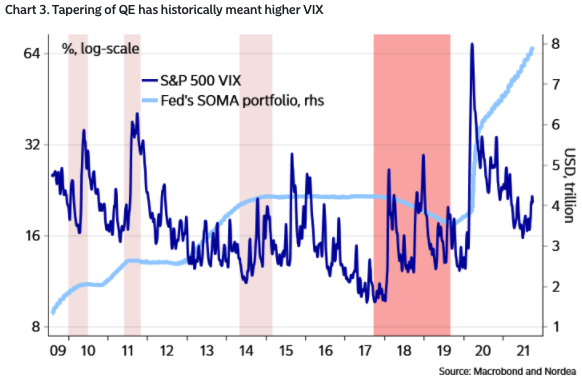
Moreover, over the past 40 or so years, monetary policy was used as a crutch to support the economy. This promoted deflation, innovation, and the subsequent rise in valuations.
“Bonds have been giving you really good returns because interest rates have been going down since the 1970s when they peaked at about 11%,” Sood explained to me.
“That’s changing now; we’re at the zero bound, and it’s unlikely that will be as a strong of a tailwind. Worse, it could be a headwind if interest rates start to rise.”
As a result of this dynamic, coupled with participants’ increased exposure to rate and equity market risk which can play into cross-market hedging and de-leveraging cascades, 60/40 can be somewhat of a poor hedge.
“Now, with the Fed poised to hike interest rates to combat raging inflation, the bond-stock relationship could be upended,” Bloomberg explains.
“At stake are trillions of dollars that are managed at risk parity funds, balanced mutual funds, and pension funds that follow the framework of 60/40 asset allocation.”

Why mention any of this? Well, it forces us to look elsewhere for protection.
In this case, the growing asset class of volatility, so to speak, is that protection. Investors are aware of both the protective and speculative efficiency afforded to them by options and that is the primary reason option volumes are so comparable to stock volumes, now.
Notwithstanding, with option volumes higher, related hedging flows can represent an increased share of volume in underlying stocks. Therefore, the correlation of stock moves, versus options activity, is more pronounced.
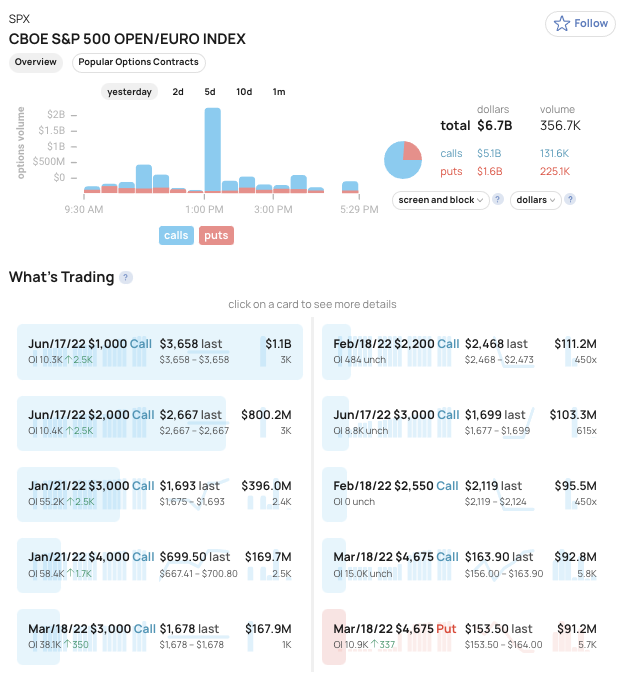
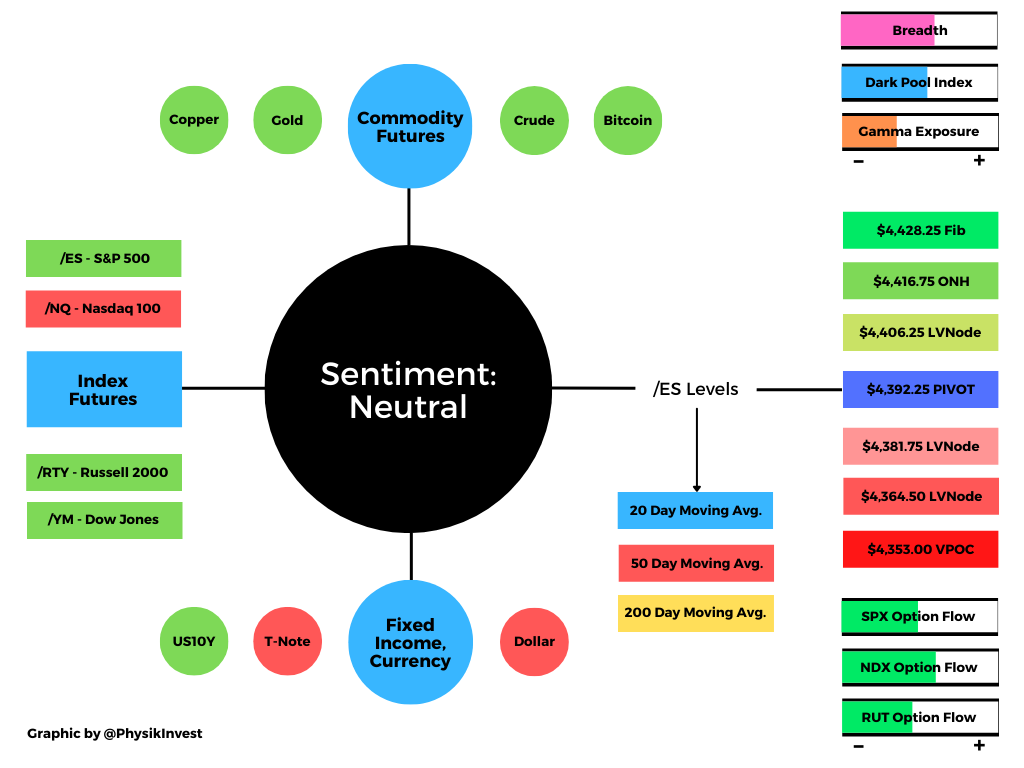
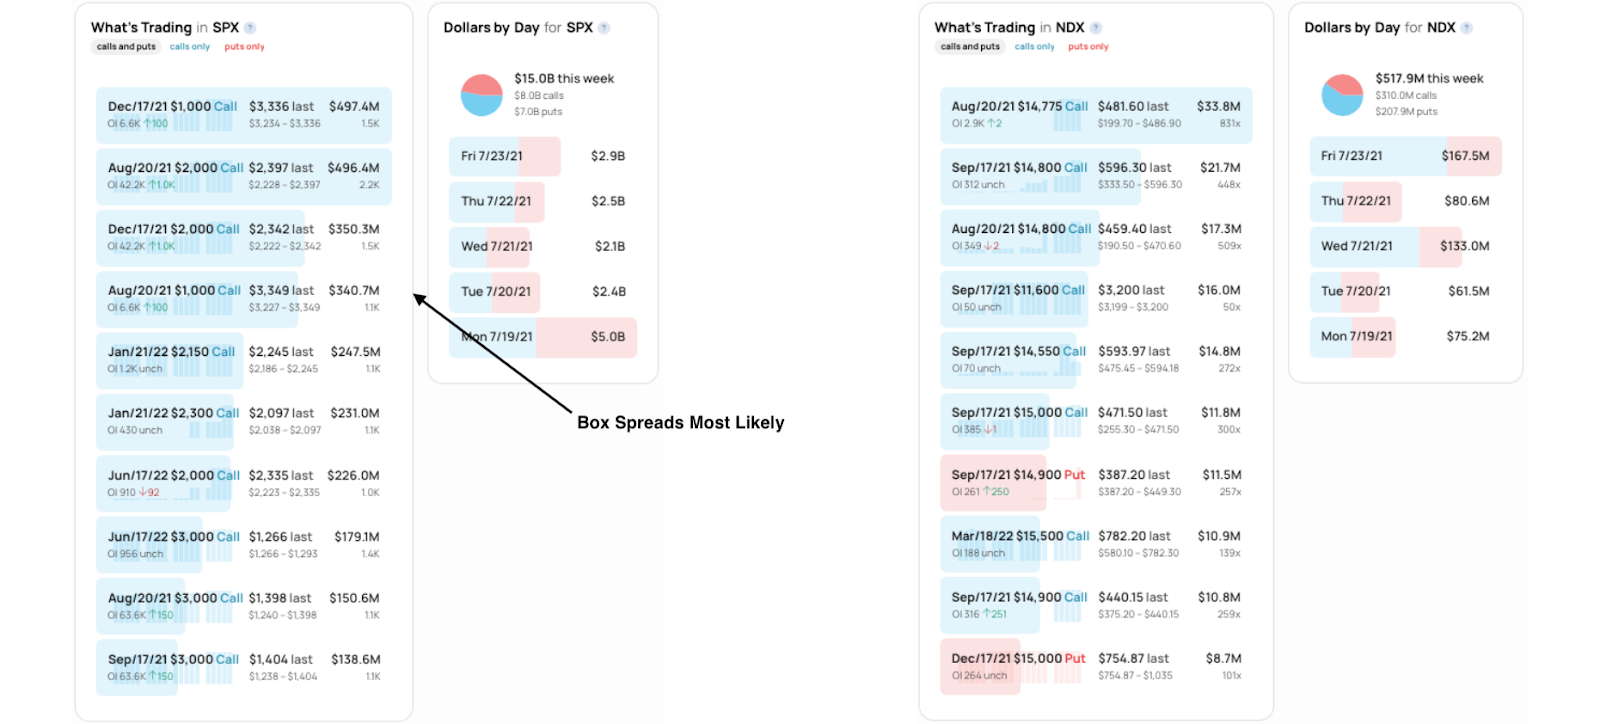
To put it simply, we can look to the options market for clues on where to next, for lack of better phrasing. So, let’s do that!
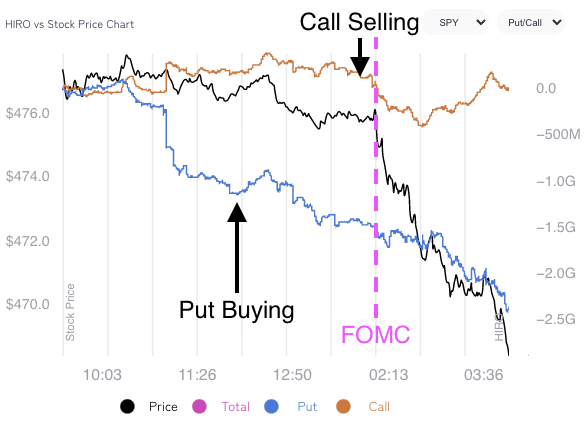
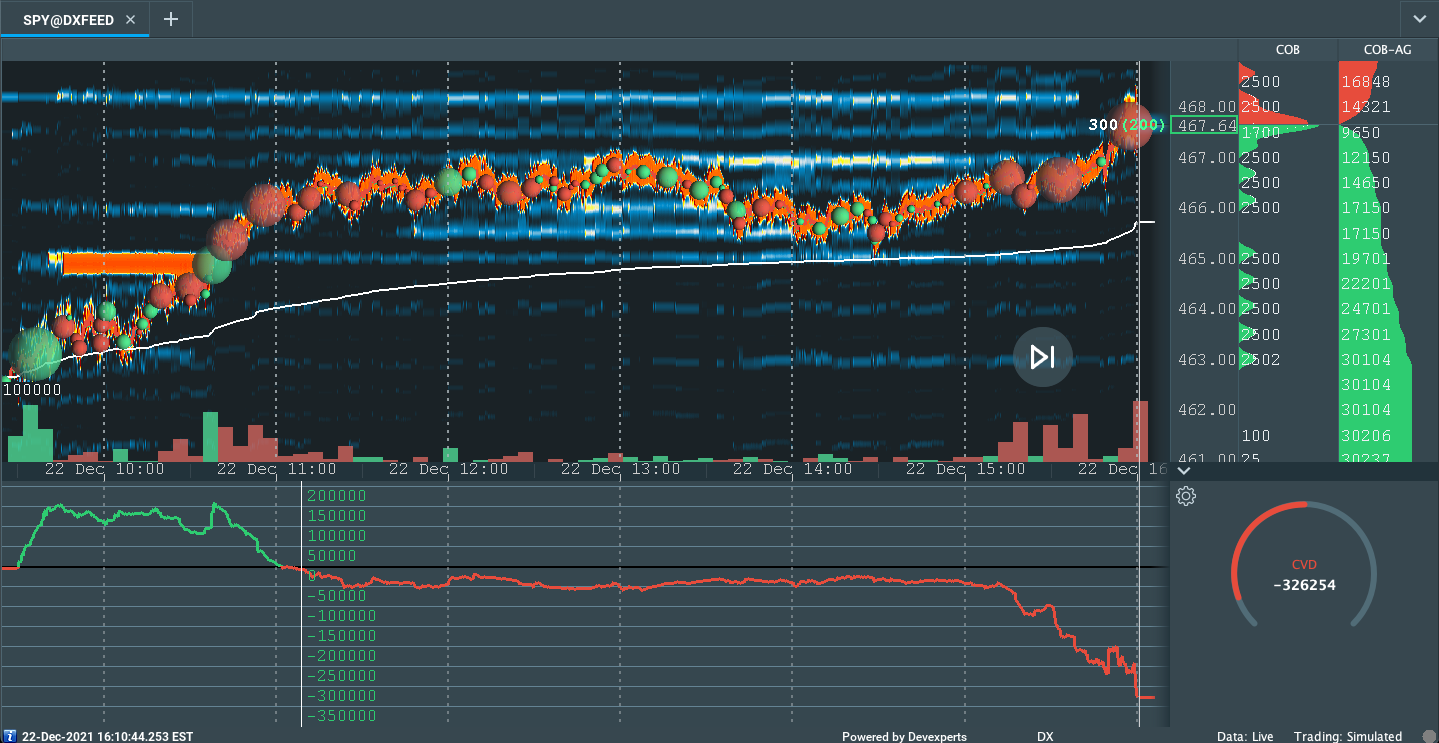
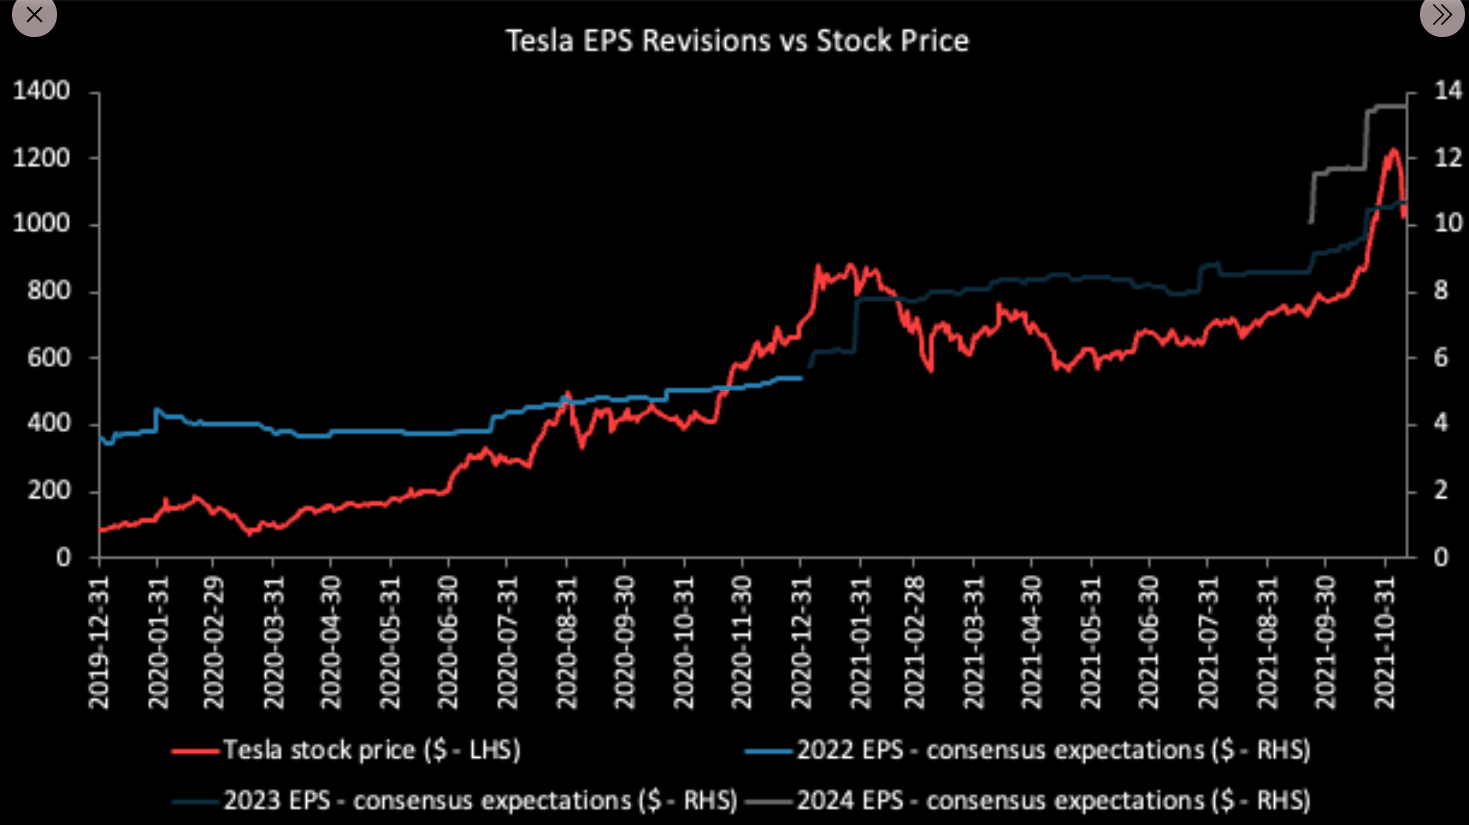
Wednesday’s session unwound some of the single-stock bullishness (in stocks like Tesla) that fed into the S&P 500, itself; an expansion in volatility coincided with the demand for downside (put) protection and supply of upside (call) protection.
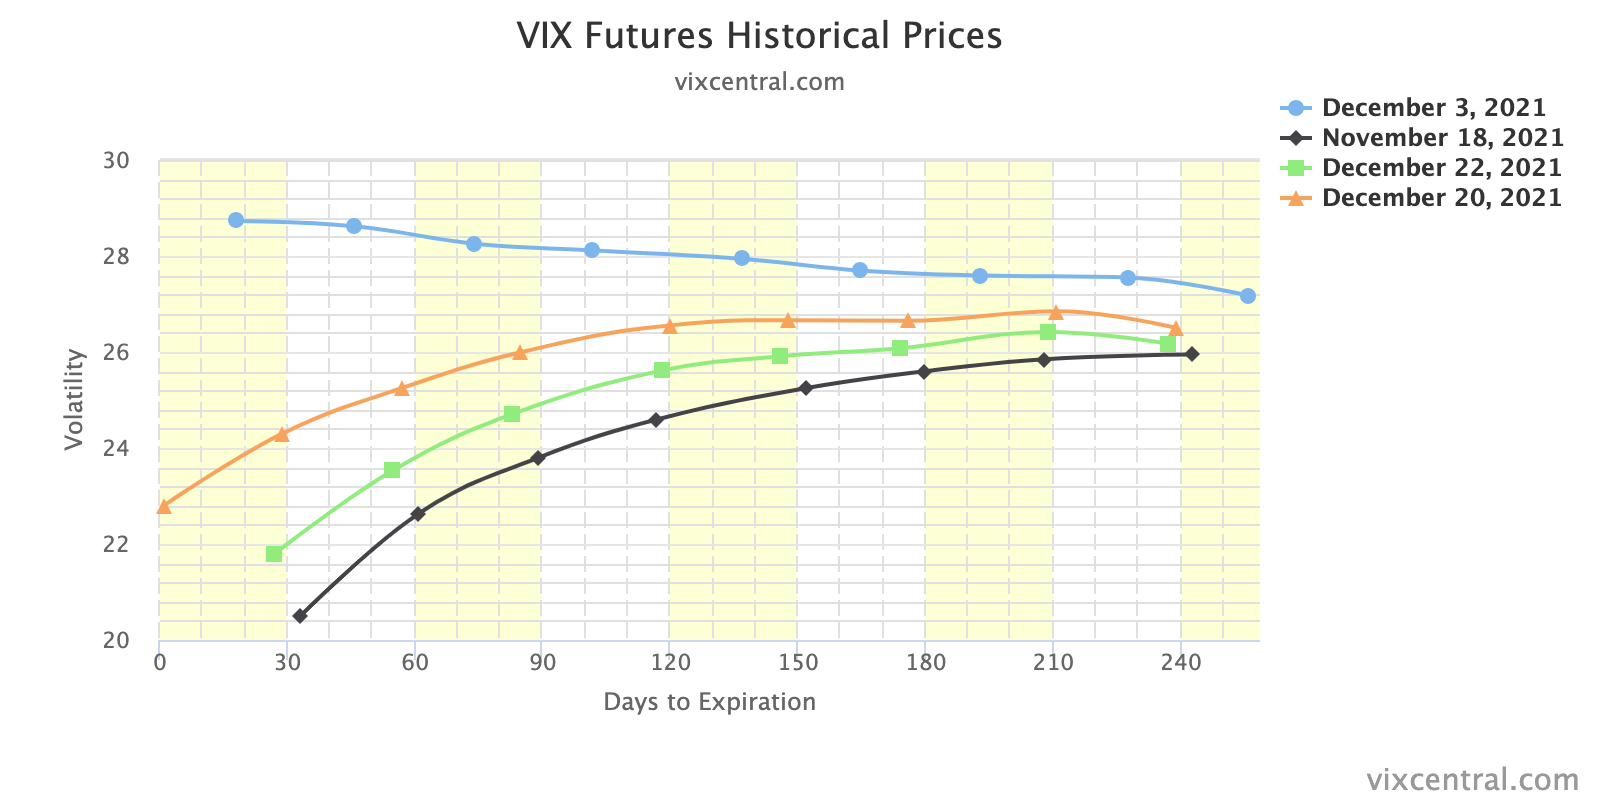
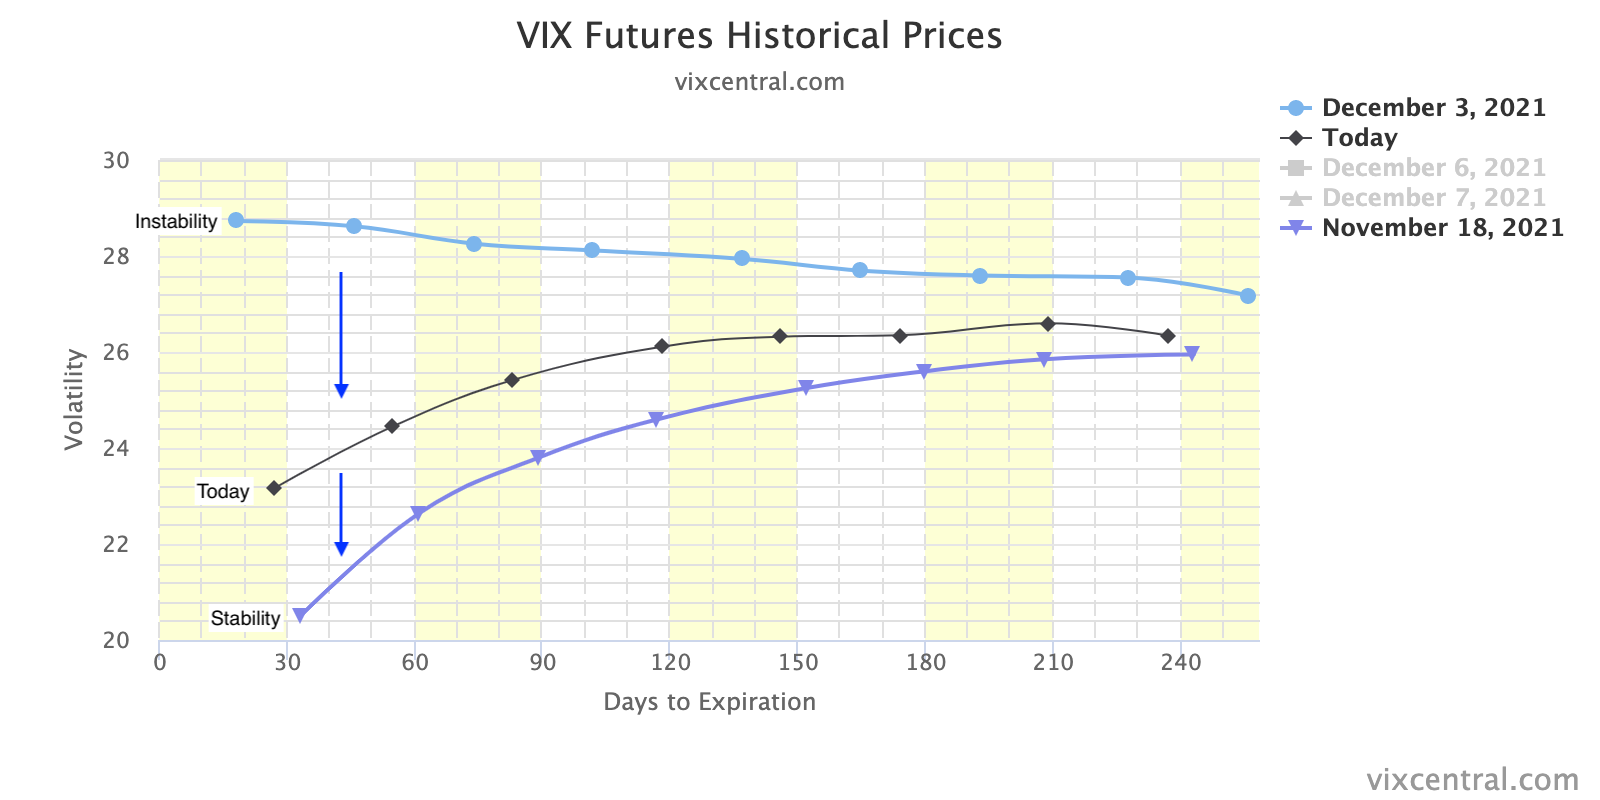
Conditions settled, Thursday. Though positioning metrics had little to offer in terms of predicting movement, implied volatility remained heightened and many products did not expand range.
All else equal, higher implied volatility marks up options delta (exposure to direction).
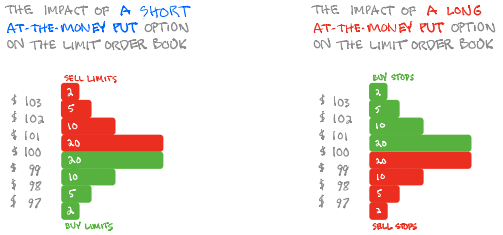
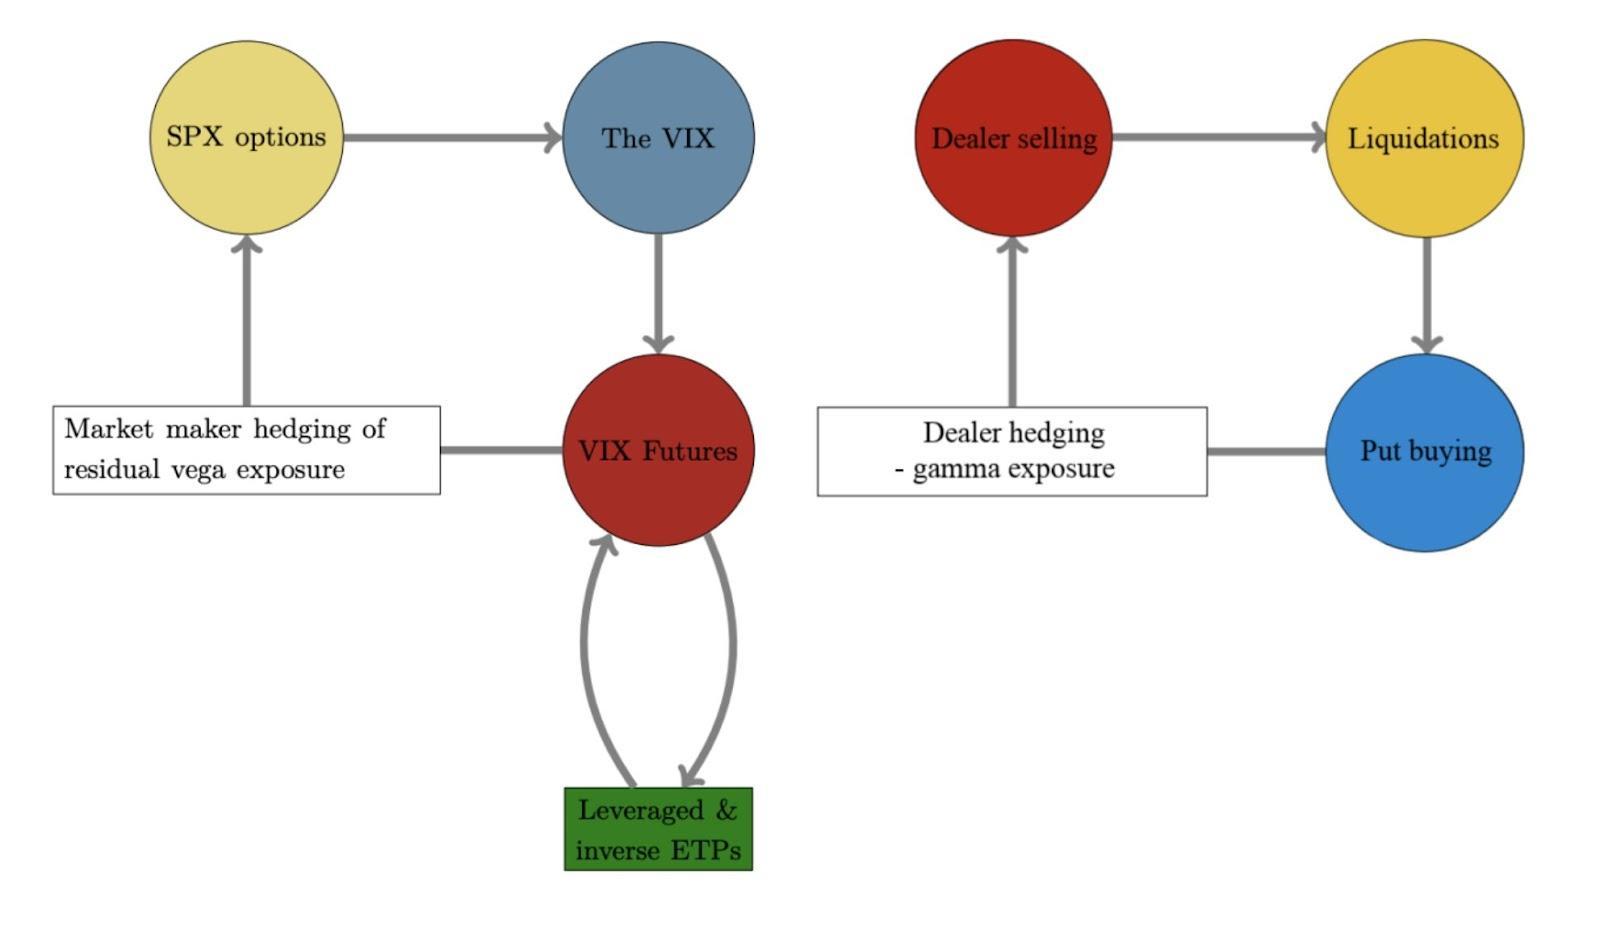
Knowing that demand for downside protection coincides with customers indirectly taking liquidity and destabilizing the market as the participant short the put will sell underlying to neutralize risk, participants ought to keep their eye out on whether implied volatility expands or contracts.

Higher implied volatility, higher delta, more selling. Hedging pressures will exacerbate weakness, as a result of real selling (as talked about above), at the index and single-stock level.
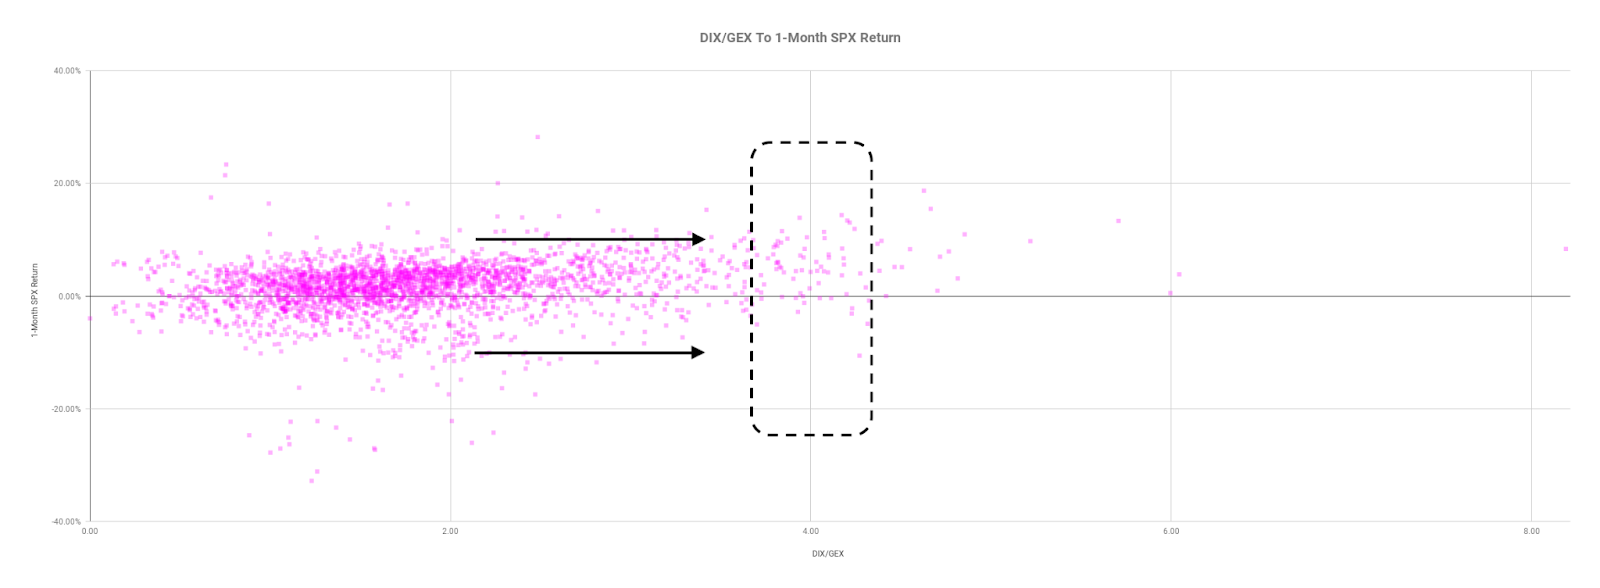
Taking into account options positioning, versus buying pressure (measured via short sales or liquidity provision on the market-making side), positioning metrics remain positively skewed, even more so than before.
As stated yesterday, though the dip lower and demand for protection may serve to prime the market for upside (when volatility starts to compress again and counterparties unwind hedges thus supporting any attempt higher), markets will tend toward instability so long as volatility is heightened and the market remains in short-gamma territory.
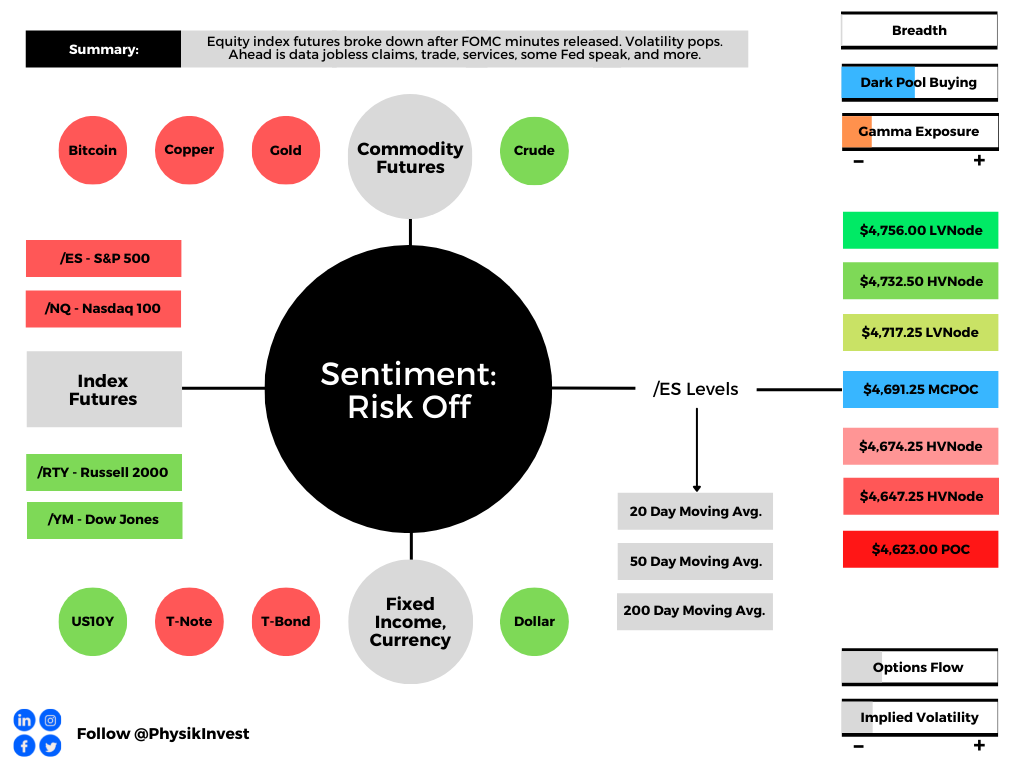
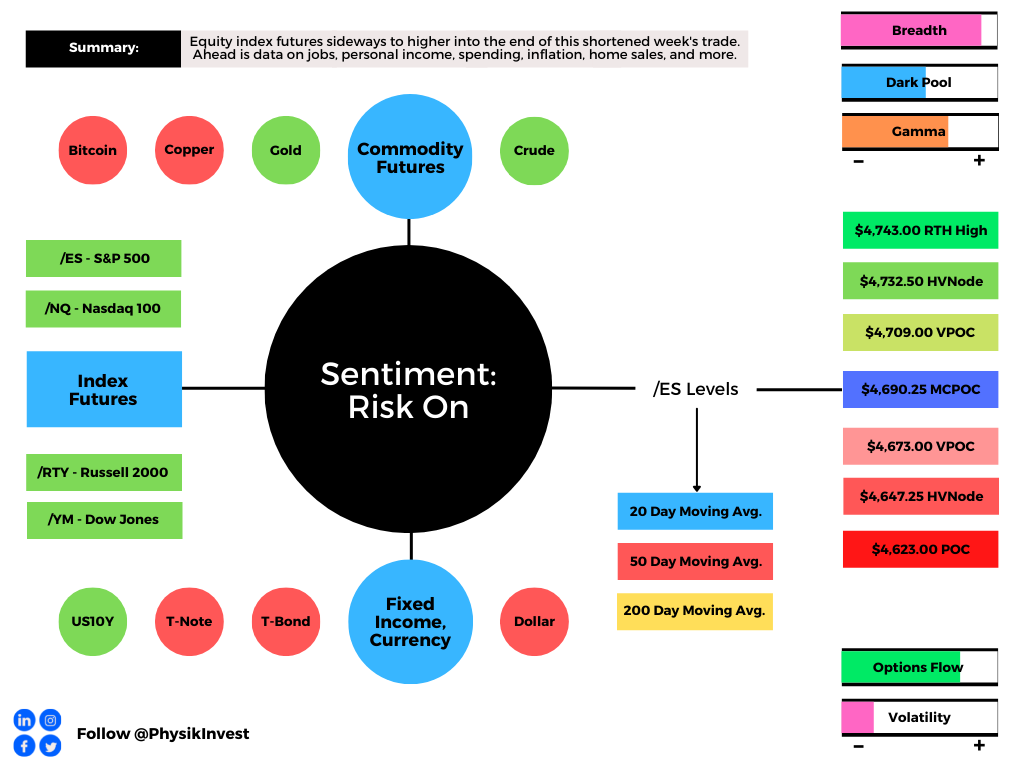
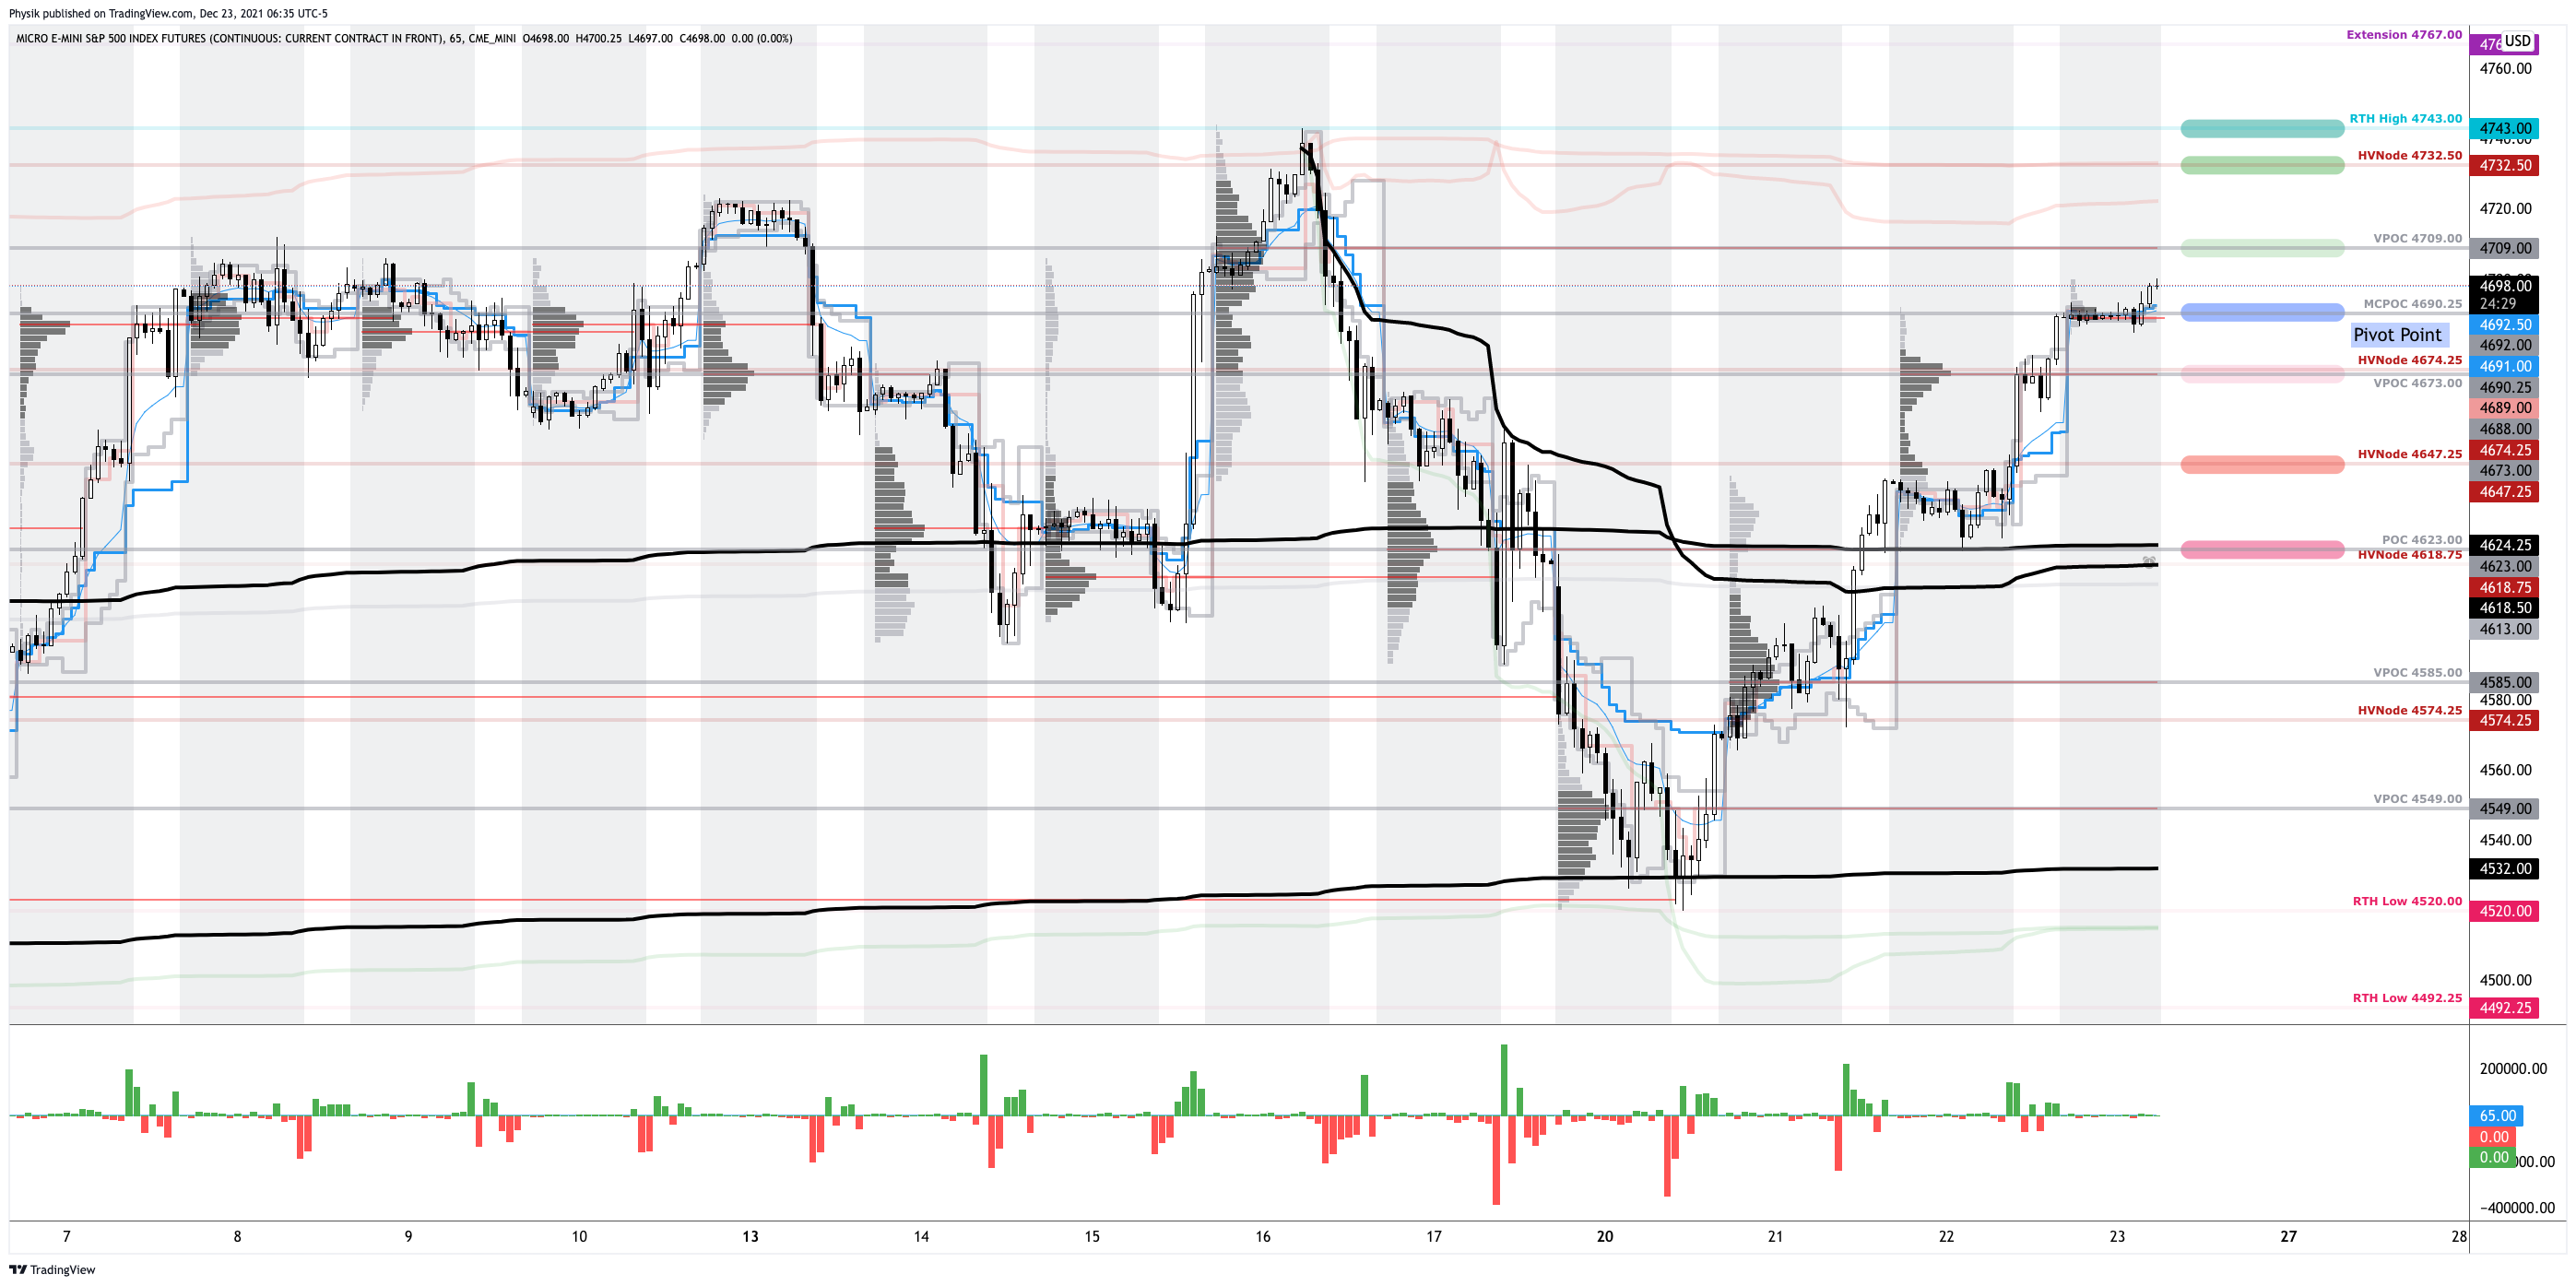
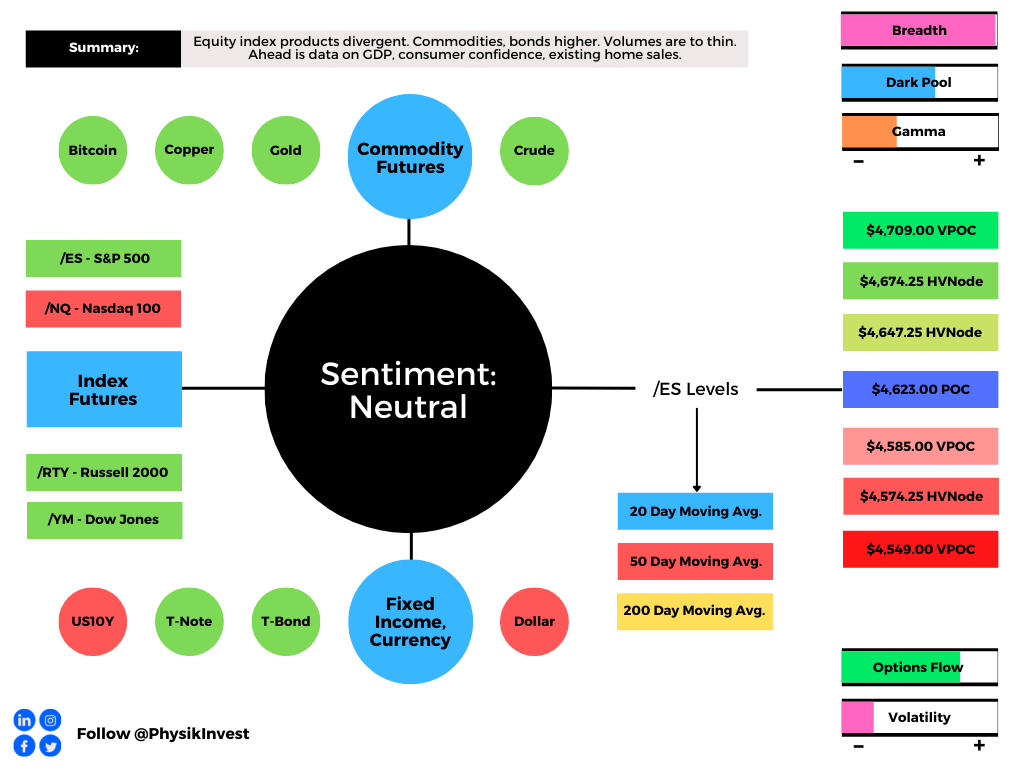
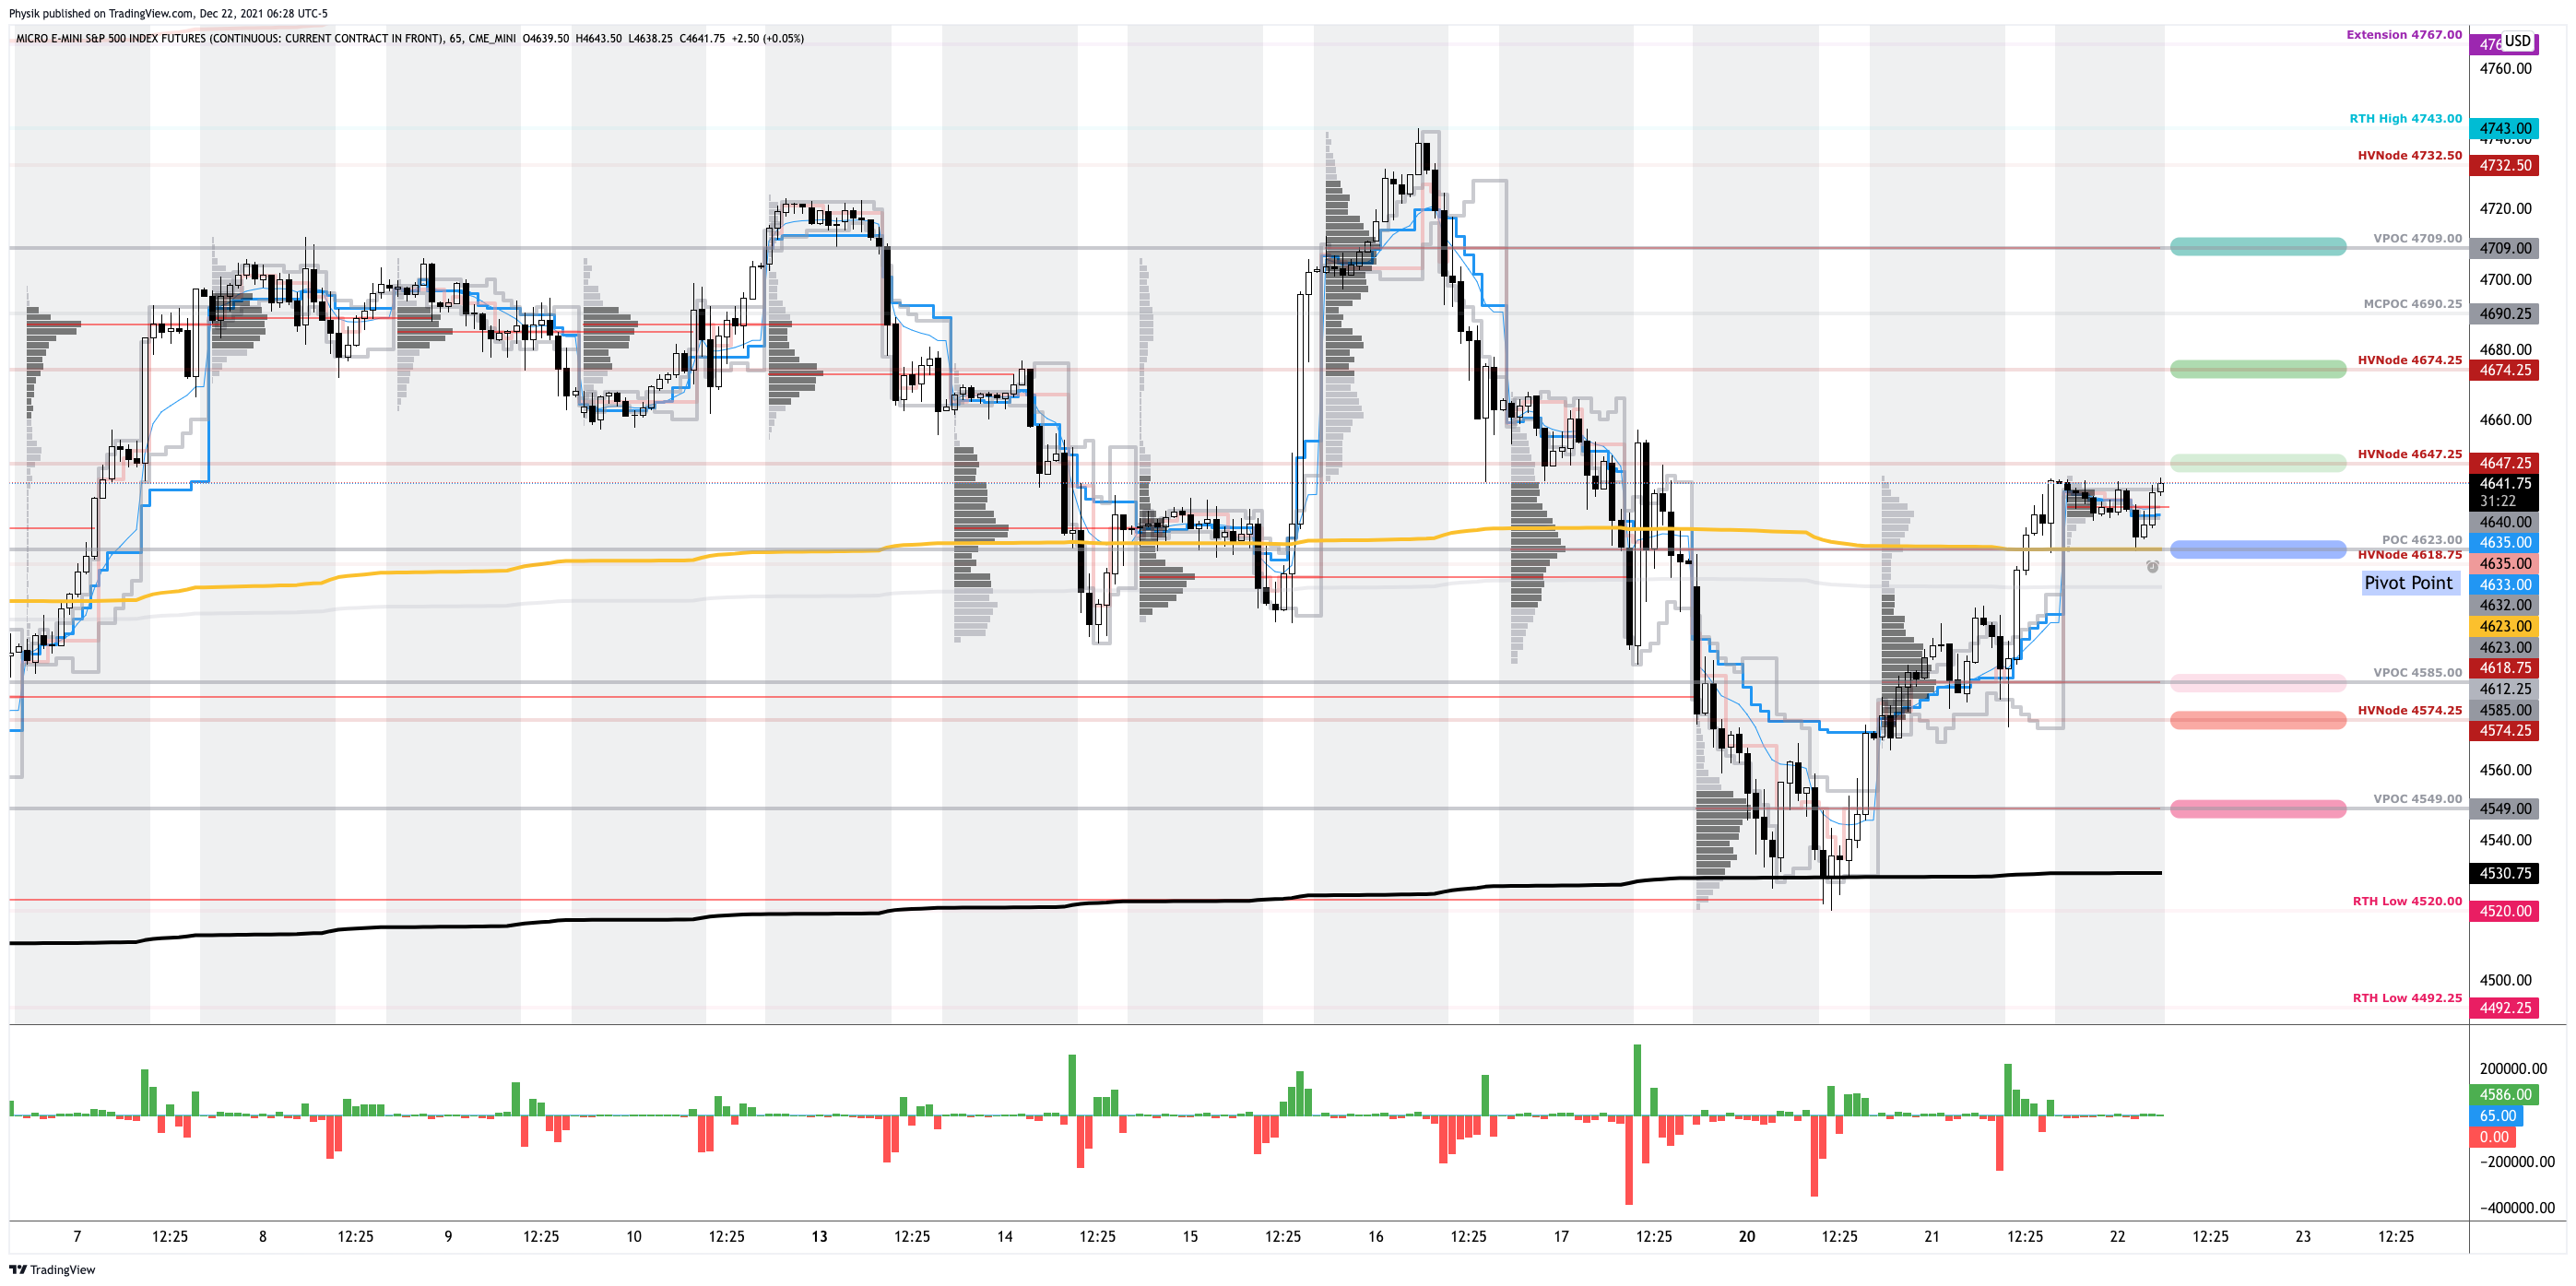
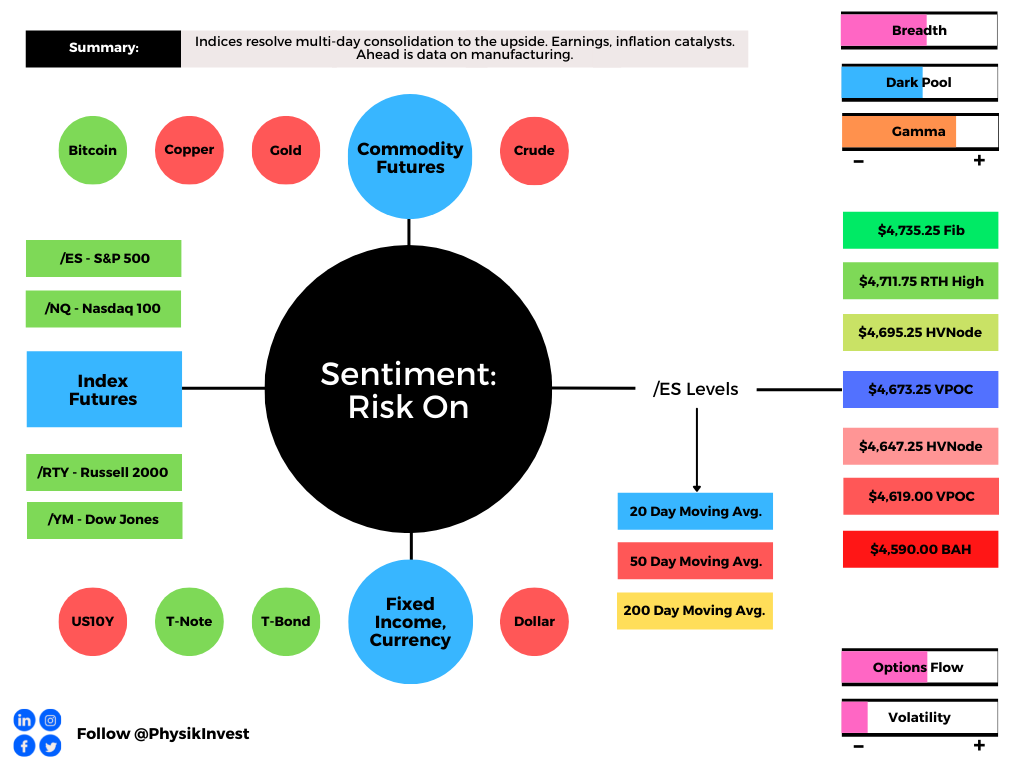
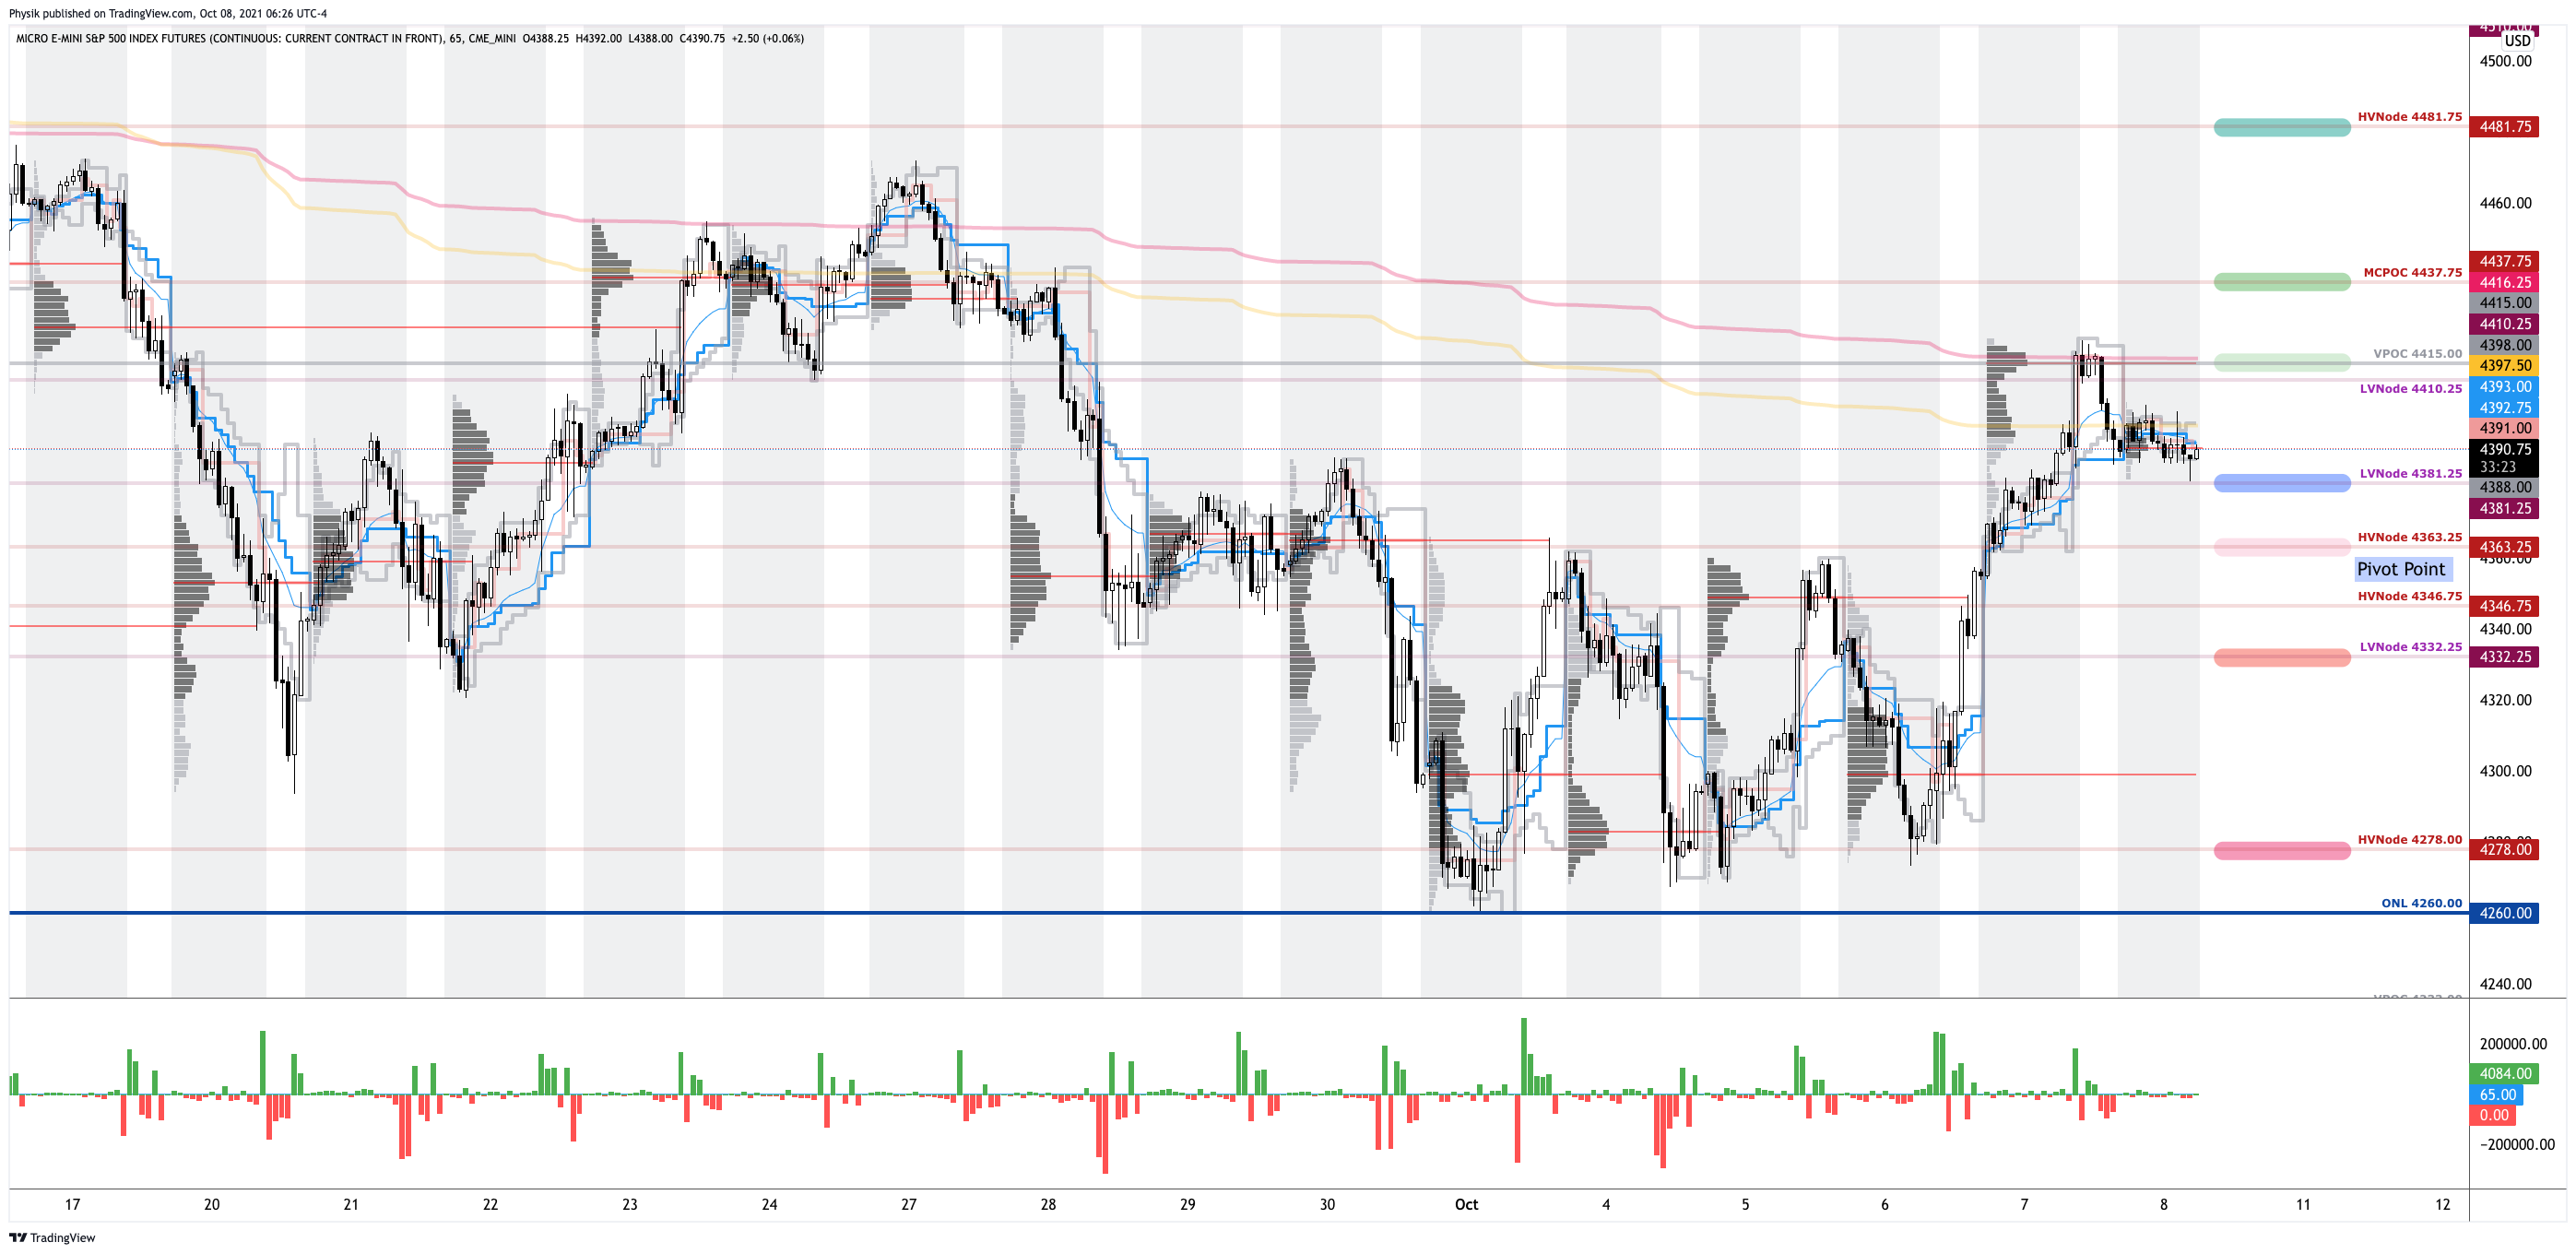
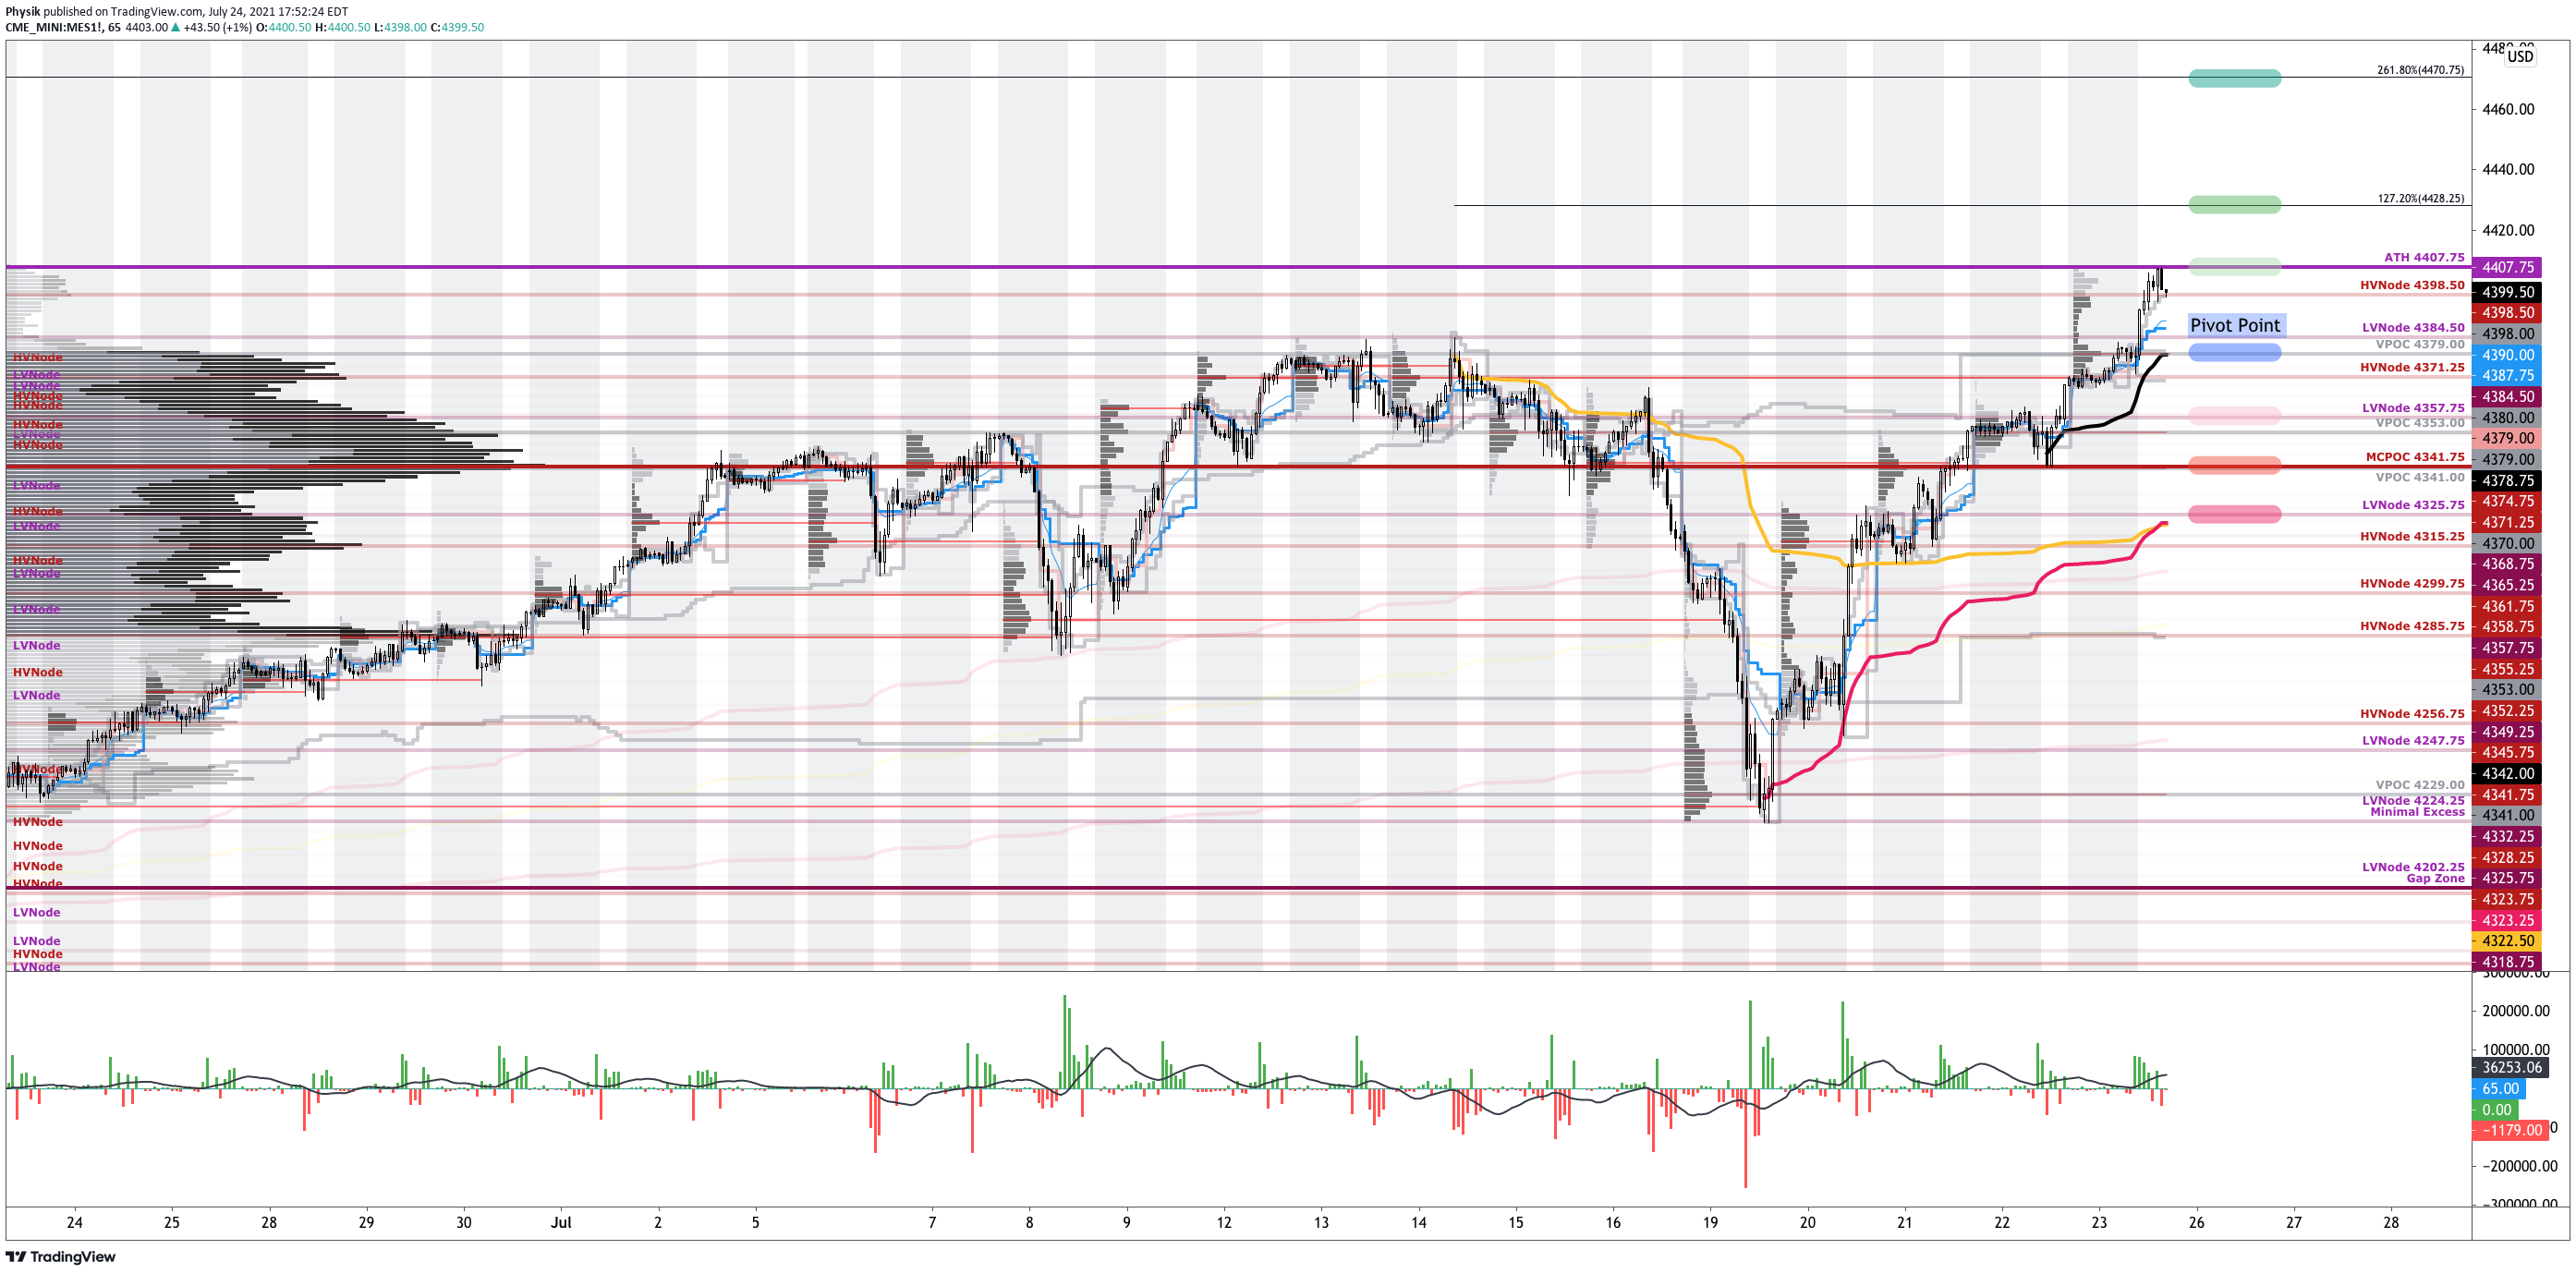
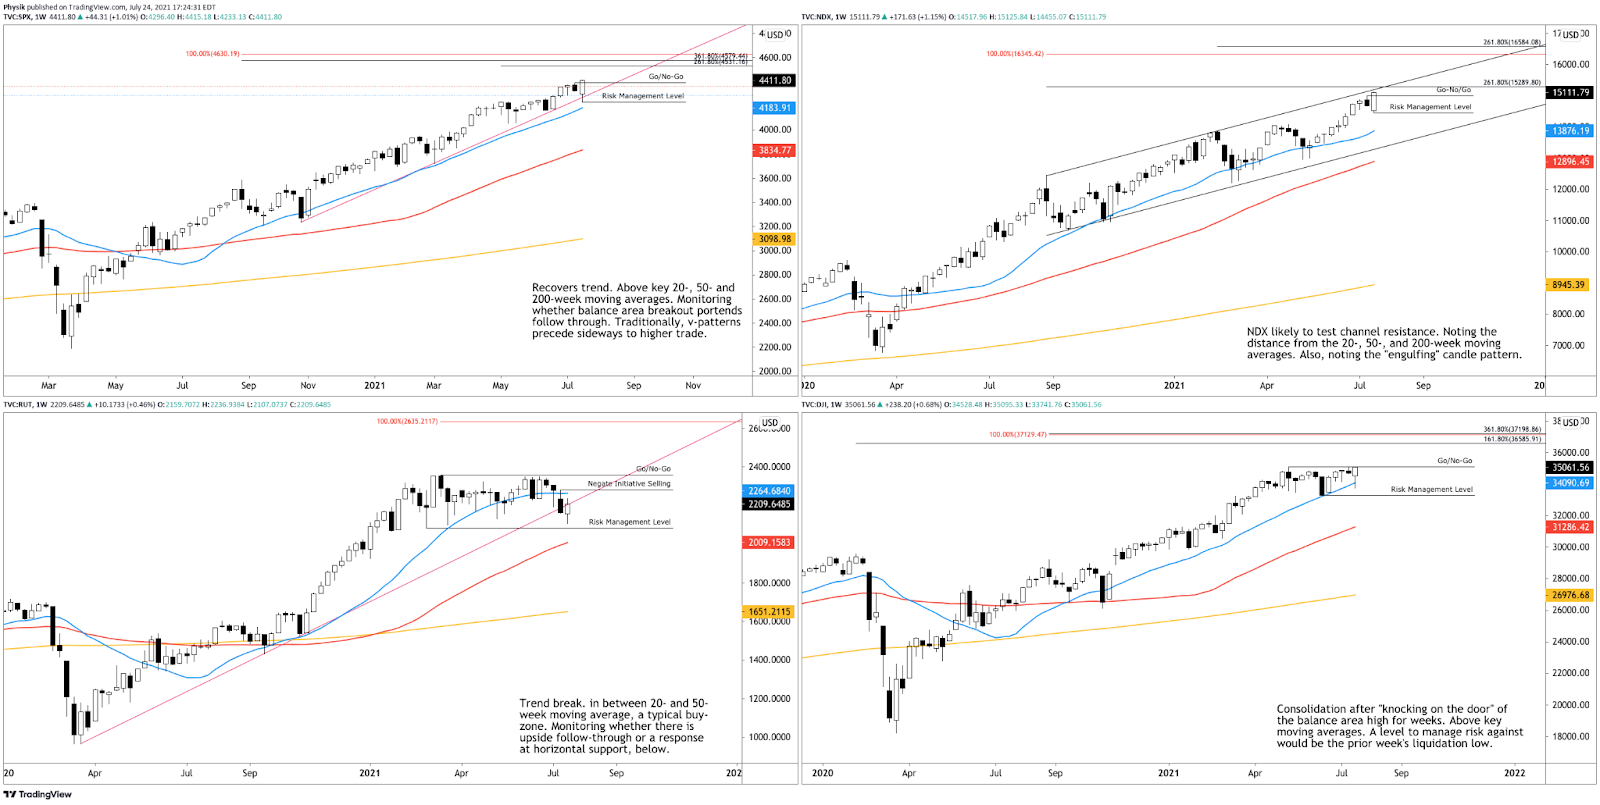
Technical: As of 6:30 AM ET, Friday’s regular session (9:30 AM – 4:00 PM ET), in the S&P 500, will likely open in the middle part of a balanced overnight inventory, inside of prior-range and -value, suggesting a limited potential for immediate directional opportunity.
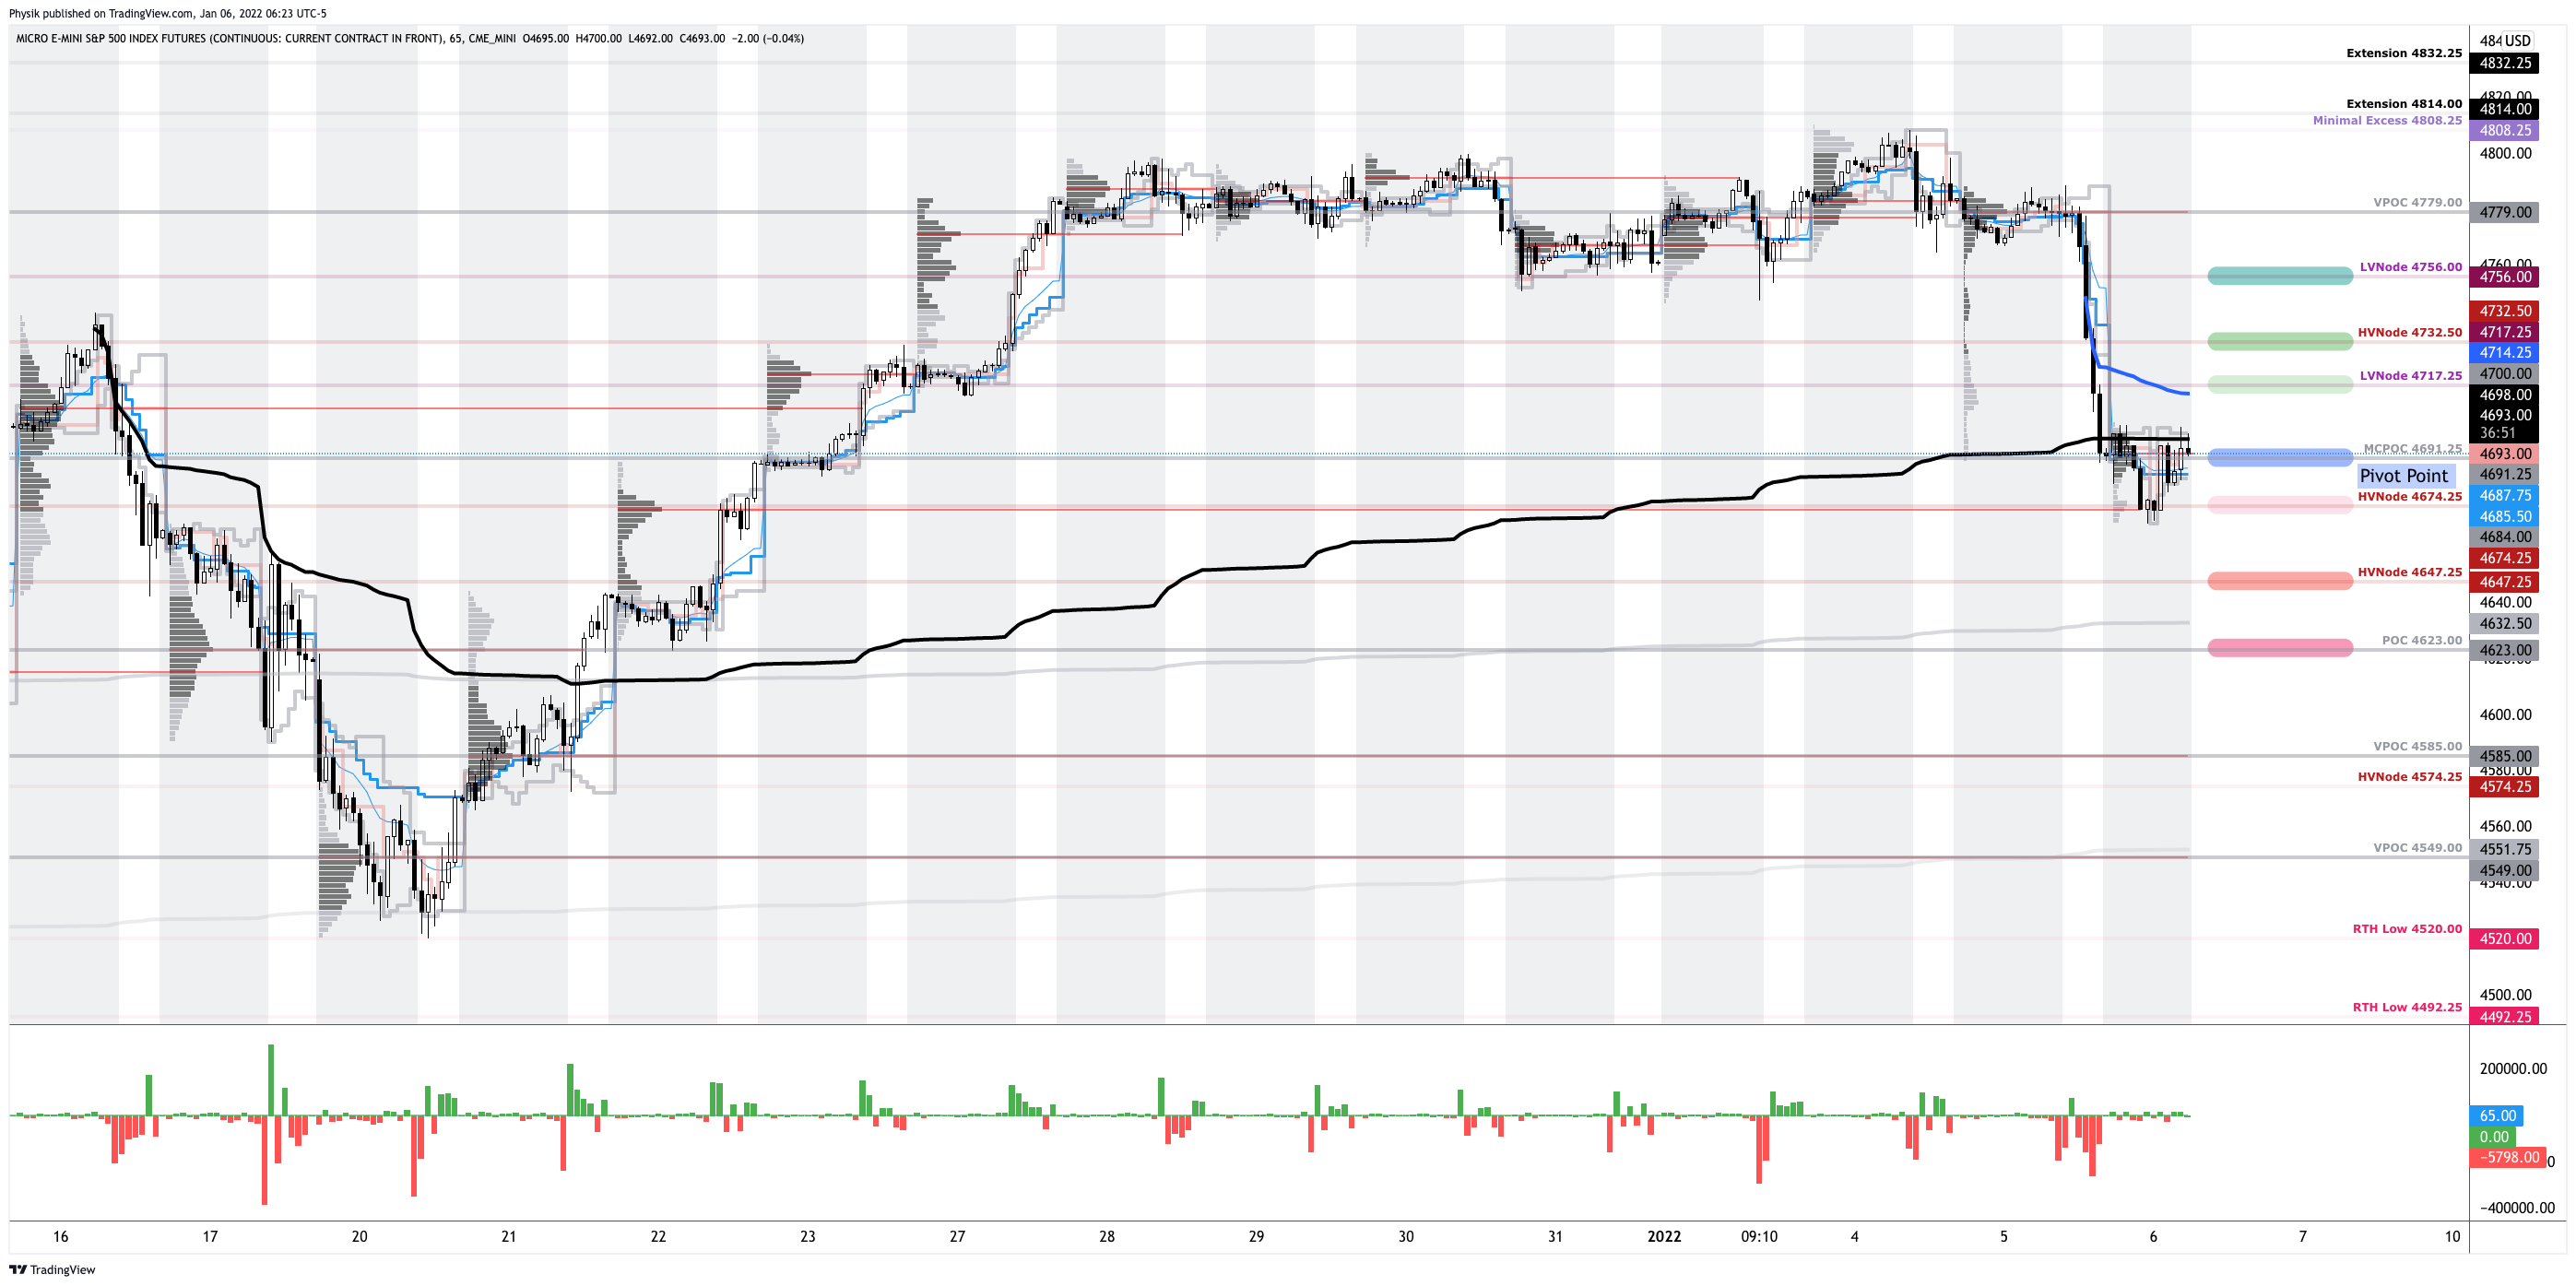
Spike Scenario In Play: Spike’s mark the beginning of a break from value. Spikes higher (lower) are validated by trade at or above (below) the spike base (i.e., the origin of the spike).

Spike base is at $4,761.25. Above, bullish. Below, bearish.
In the best case, the S&P 500 trades higher; activity above the $4,691.25 micro composite point of control (MCPOC) puts in play the $4,717.25 low volume area (LVNode). Initiative trade beyond the LVNode could reach as high as the $4,732.50 high volume area (HVNode) and $4,756.00 LVNode, or higher.
In the worst case, the S&P 500 trades lower; activity below the $4,691.25 MCPOC puts in play the $4,674.25 HVNode. Initiative trade beyond the latter could reach as low as the $4,647.25 and $4,629.25 HVNode, or lower.
Click here to load today’s key levels into the web-based TradingView charting platform. Note that all levels are derived using the 65-minute timeframe. New links are produced, daily.

What People Are Saying
Definitions
Volume Areas: A structurally sound market will build on areas of high volume (HVNodes). Should the market trend for long periods of time, it will lack sound structure, identified as low volume areas (LVNodes). LVNodes denote directional conviction and ought to offer support on any test.
If participants were to auction and find acceptance into areas of prior low volume (LVNodes), then future discovery ought to be volatile and quick as participants look to HVNodes for favorable entry or exit.
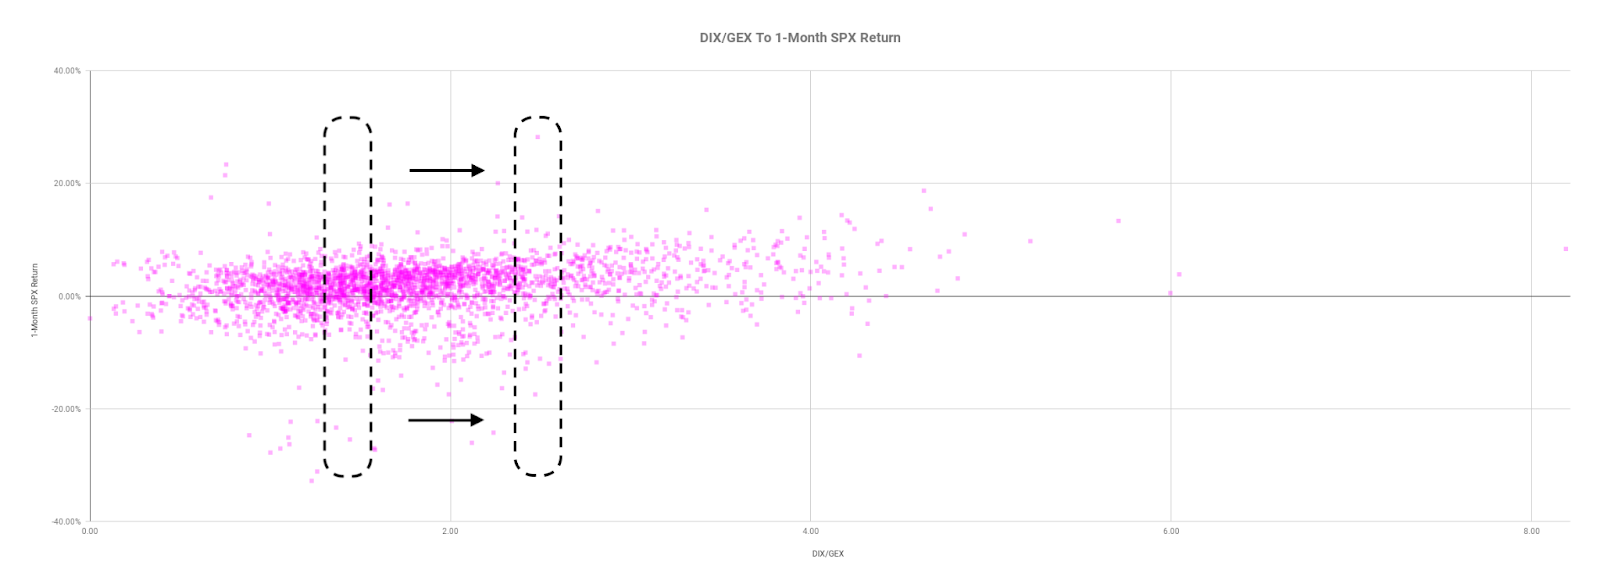
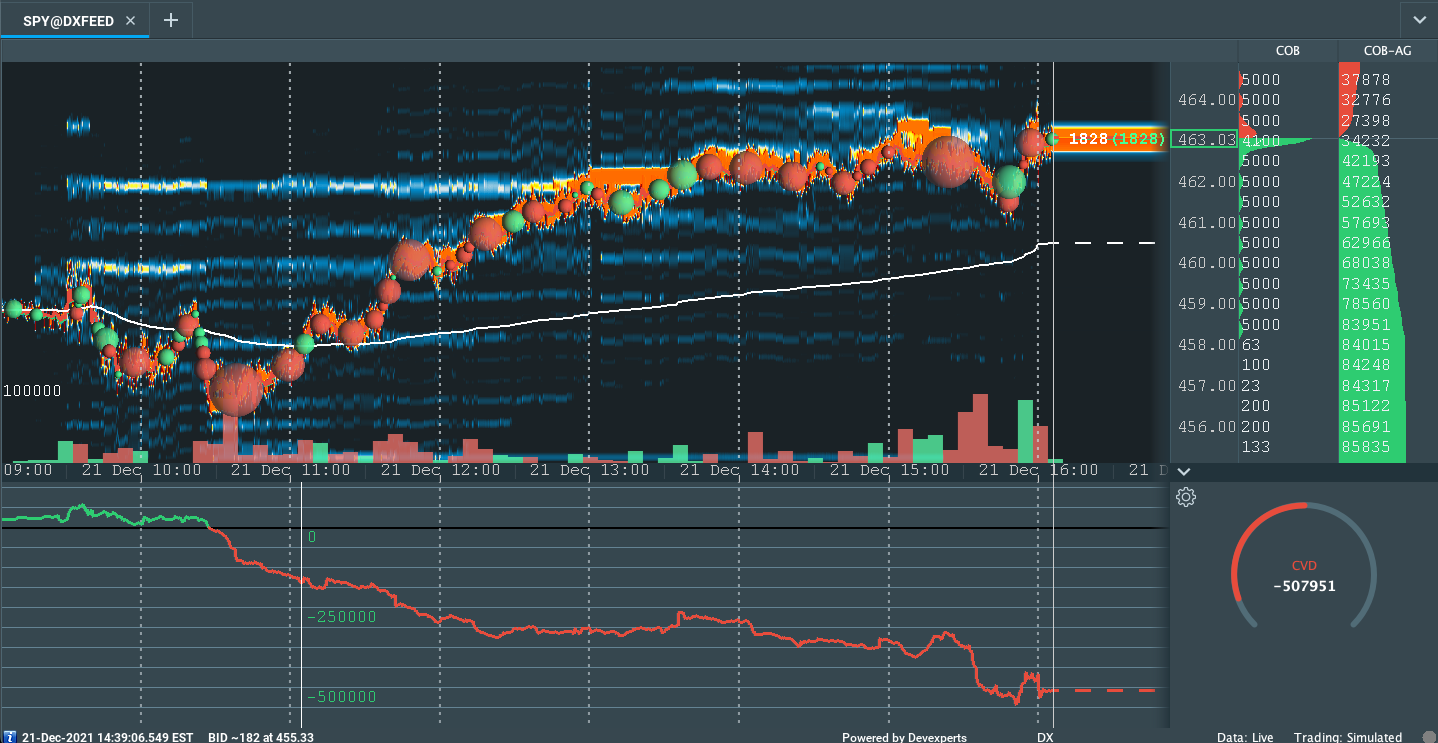
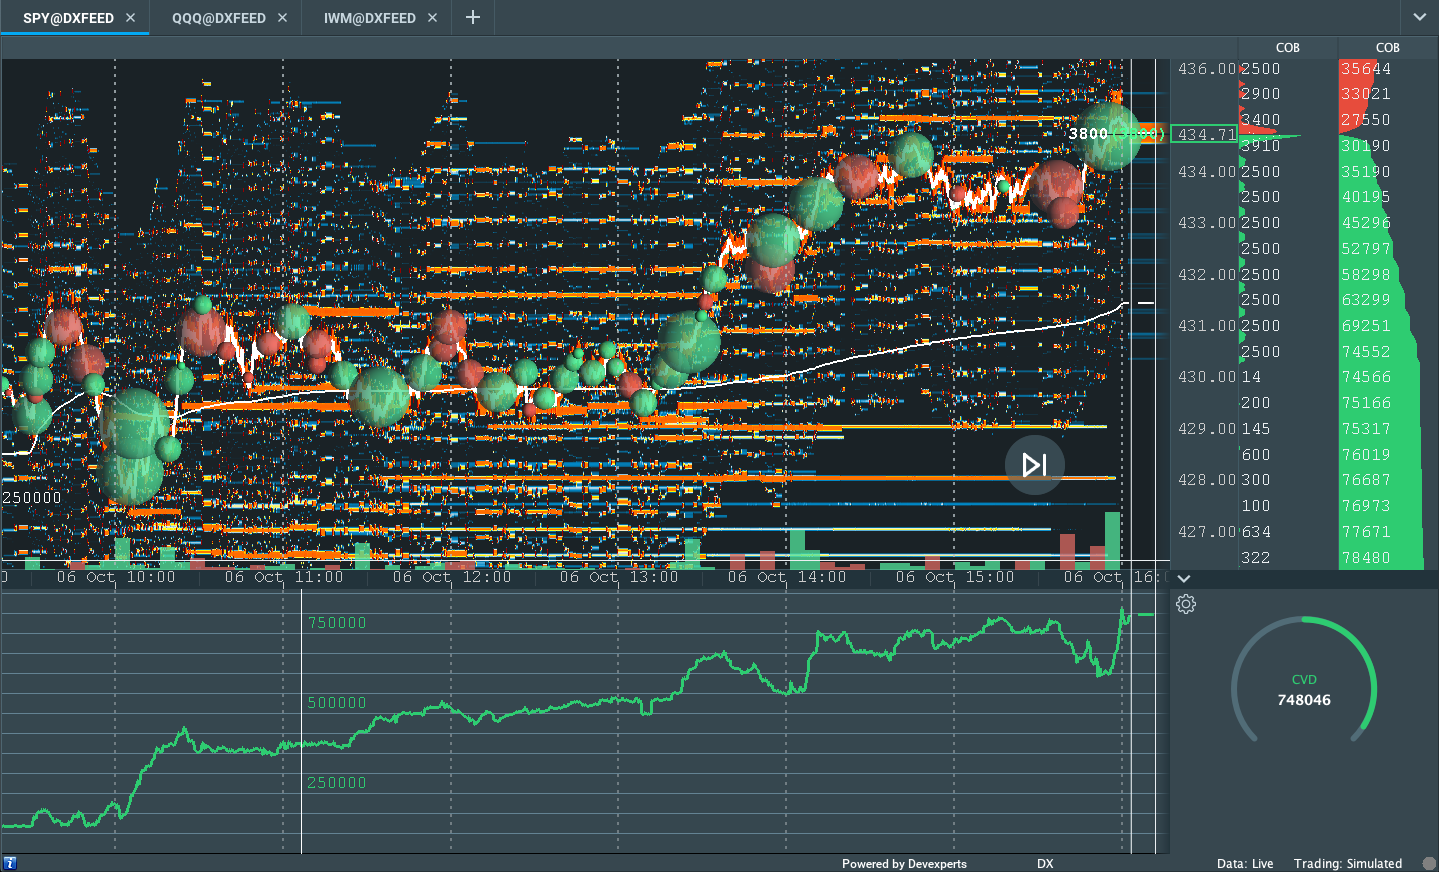
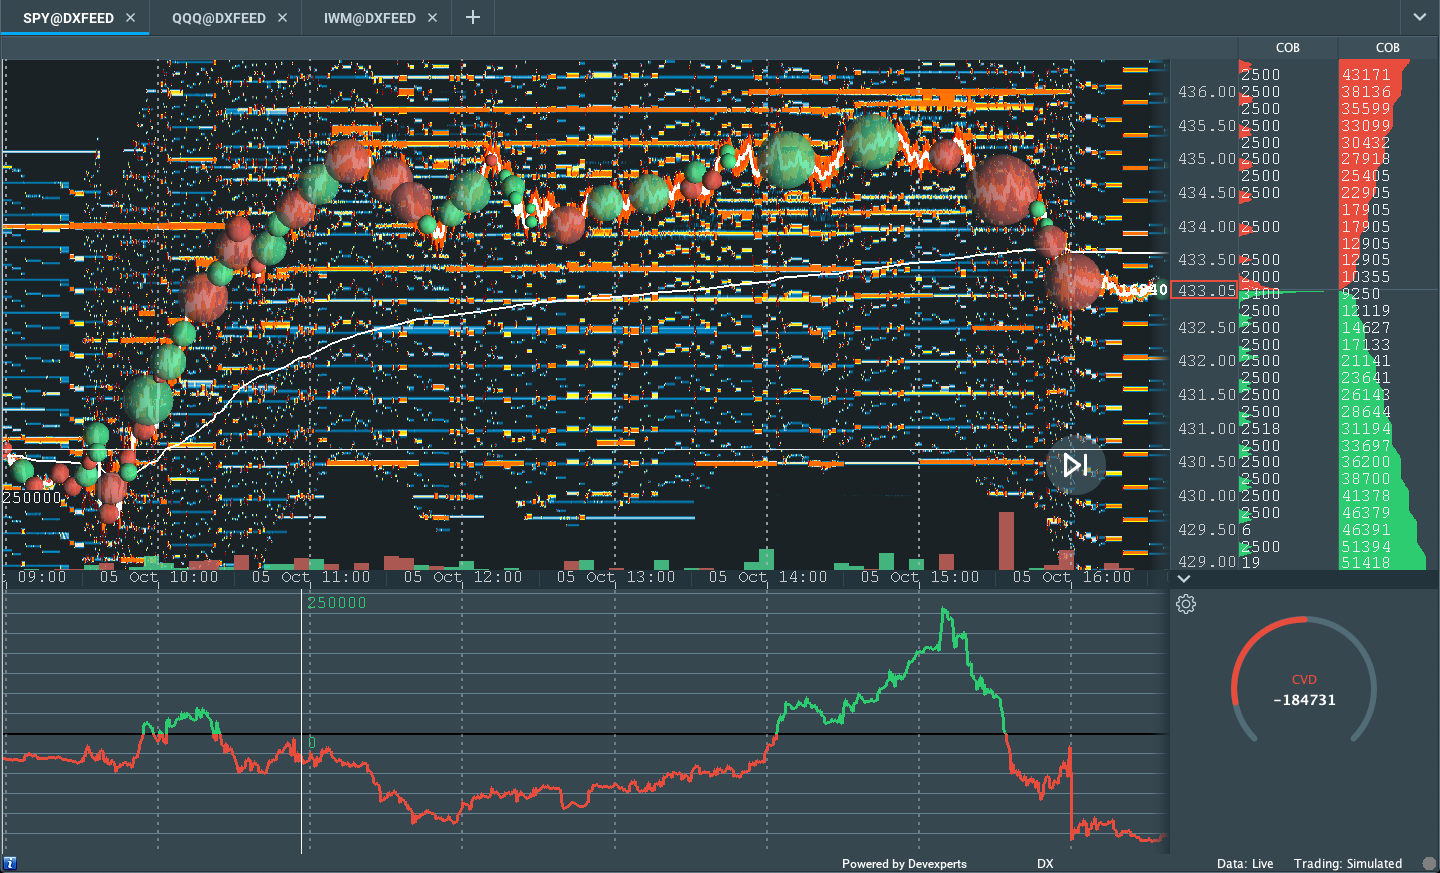
DIX: For every buyer is a seller (usually a market maker). Using DIX — which is derived from short sales (i.e., liquidity provision on the market-making side) — we can measure buying pressure.
Gamma: Gamma is the sensitivity of an option to changes in the underlying price. Dealers that take the other side of options trades hedge their exposure to risk by buying and selling the underlying. When dealers are short-gamma, they hedge by buying into strength and selling into weakness. When dealers are long-gamma, they hedge by selling into strength and buying into weakness. The former exacerbates volatility. The latter calms volatility.
Vanna: The rate at which the delta of an option changes with respect to volatility.
Charm: The rate at which the delta of an option changes with respect to time.
Options: If an option buyer was short (long) stock, he or she would buy a call (put) to hedge upside (downside) exposure. Option buyers can also use options as an efficient way to gain directional exposure.
POCs: POCs are valuable as they denote areas where two-sided trade was most prevalent in a prior day session. Participants will respond to future tests of value as they offer favorable entry and exit.
MCPOCs: POCs are valuable as they denote areas where two-sided trade was most prevalent over numerous day sessions. Participants will respond to future tests of value as they offer favorable entry and exit.
About
After years of self-education, strategy development, mentorship, and trial-and-error, Renato Leonard Capelj began trading full-time and founded Physik Invest to detail his methods, research, and performance in the markets.
Capelj is also a Benzinga finance and technology reporter interviewing the likes of Shark Tank’s Kevin O’Leary, JC2 Ventures’ John Chambers, FTX’s Sam Bankman-Fried, and ARK Invest’s Catherine Wood, as well as a SpotGamma contributor developing insights around impactful options market dynamics.
Disclaimer
Physik Invest does not carry the right to provide advice.
In no way should the materials herein be construed as advice. Derivatives carry a substantial risk of loss. All content is for informational purposes only.