Categories
Commentary

Daily Brief For May 3, 2022

The Daily Brief is a free glimpse into the prevailing fundamental and technical drivers of U.S. equity market products. Join the 200+ that read this report daily, below!

What Happened

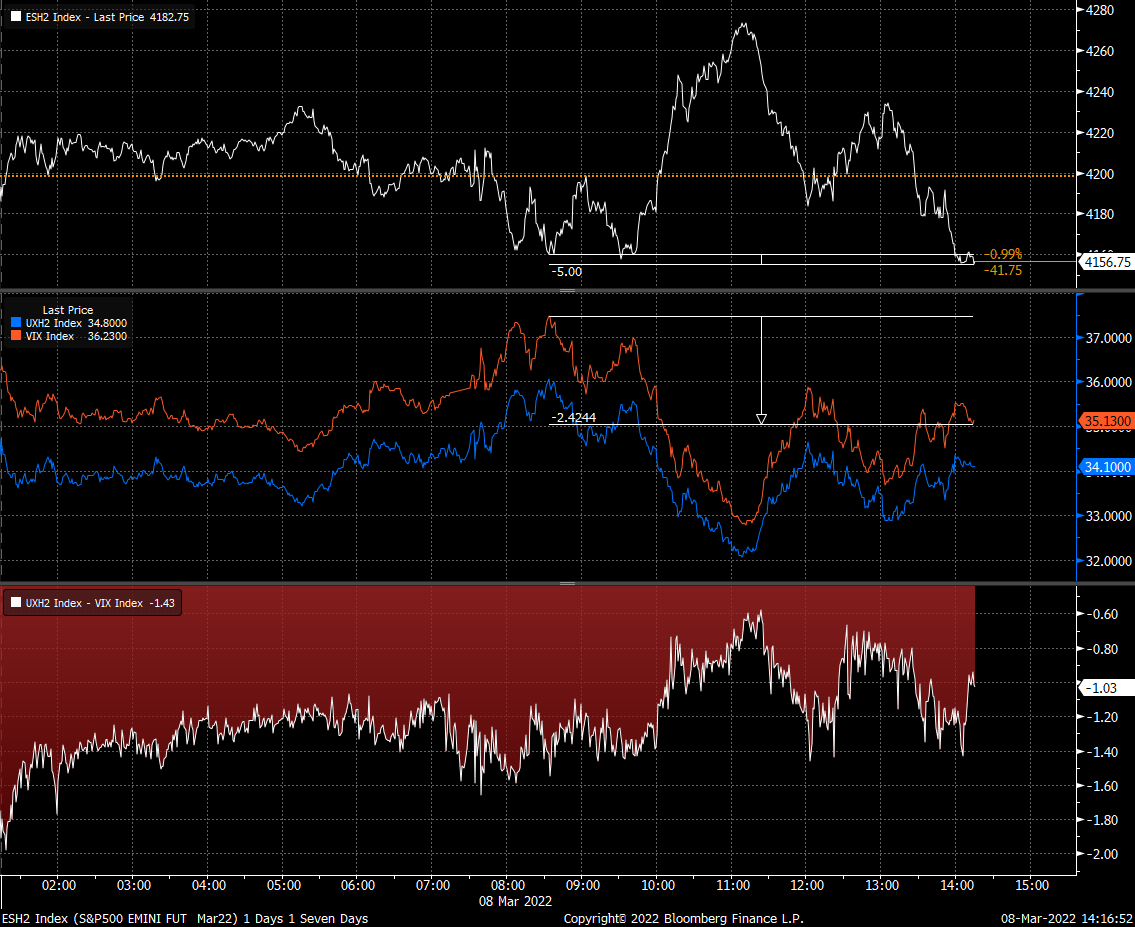
Overnight, equity index futures were sideways, inside of the prior range, after exploring much lower, Monday. Measures of implied volatility, bonds, and most commodities were bid.

This is alongside news that Russia is dodging default, the necessity for the Fed to drop inflation down to 4% by year-end per Citadel’s Ken Griffin, the U.S. Treasury’s intent to scale back sales of longer-term debt, falling earnings estimates, Taiwan preparing to fend-off a potential invasion as Beijing ordered officials to find ways to fight against western sanctions, similar to those used against Russia, among other things including Fitch trimming China’s 2022 growth forecast.

Also, near risk-free, inflation-protected I bonds will pay 9.62% through October, the Treasury said, and here’s more on the Citigroup Inc (NYSE: C) trader that’s behind a European crash.

Ahead is data on job openings and quits, as well as factory and core capital goods orders (10:00 AM ET).

Read on for coverage on the fundamental and technical position of the market, as well as ways to position for future trade.
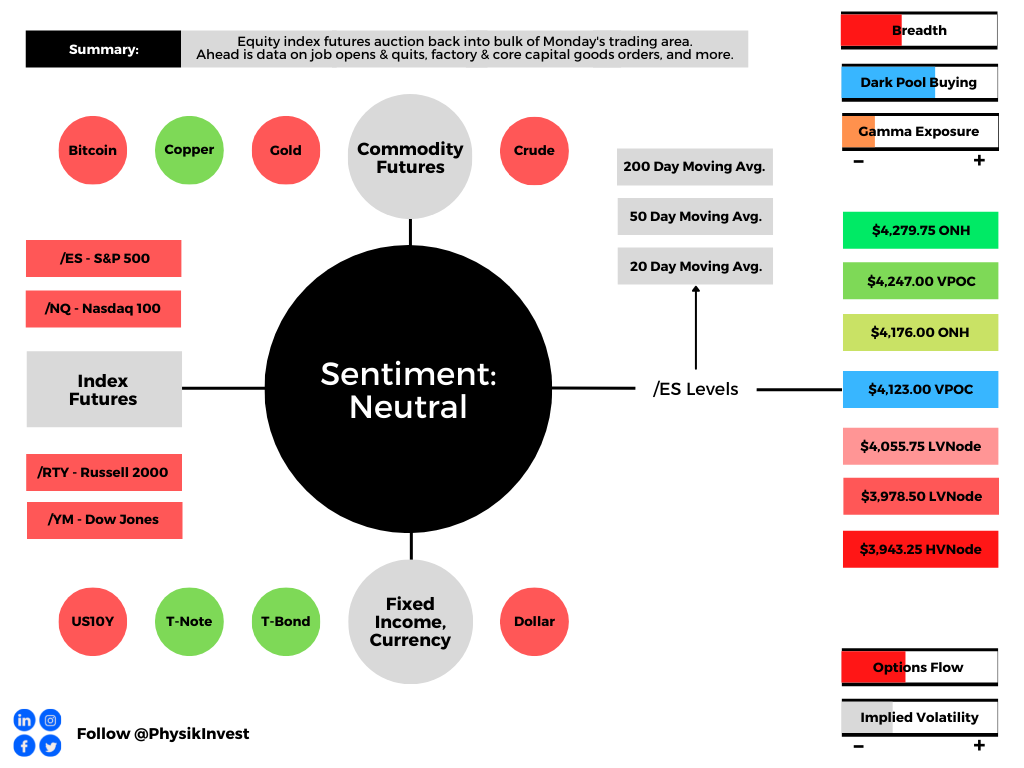
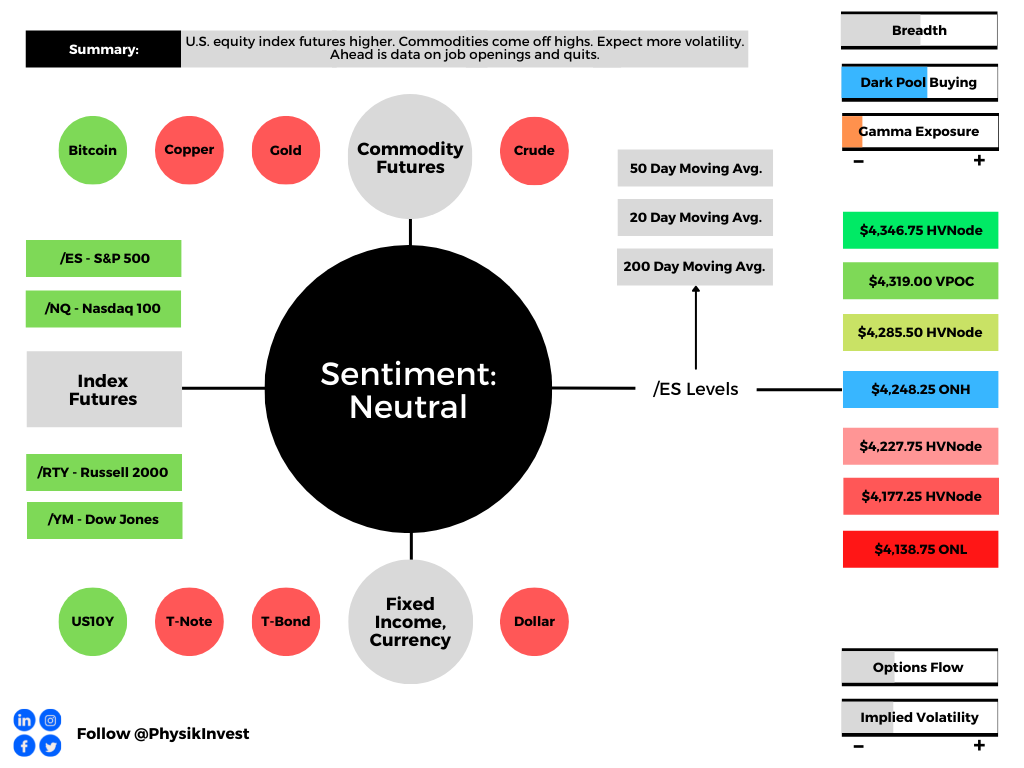
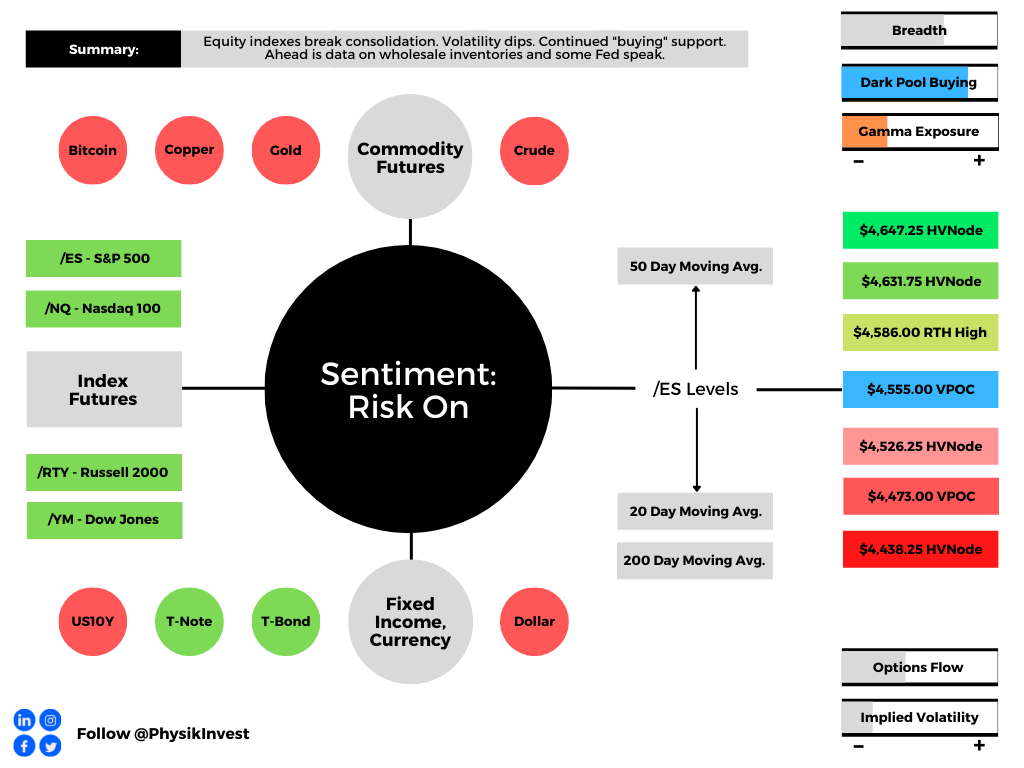
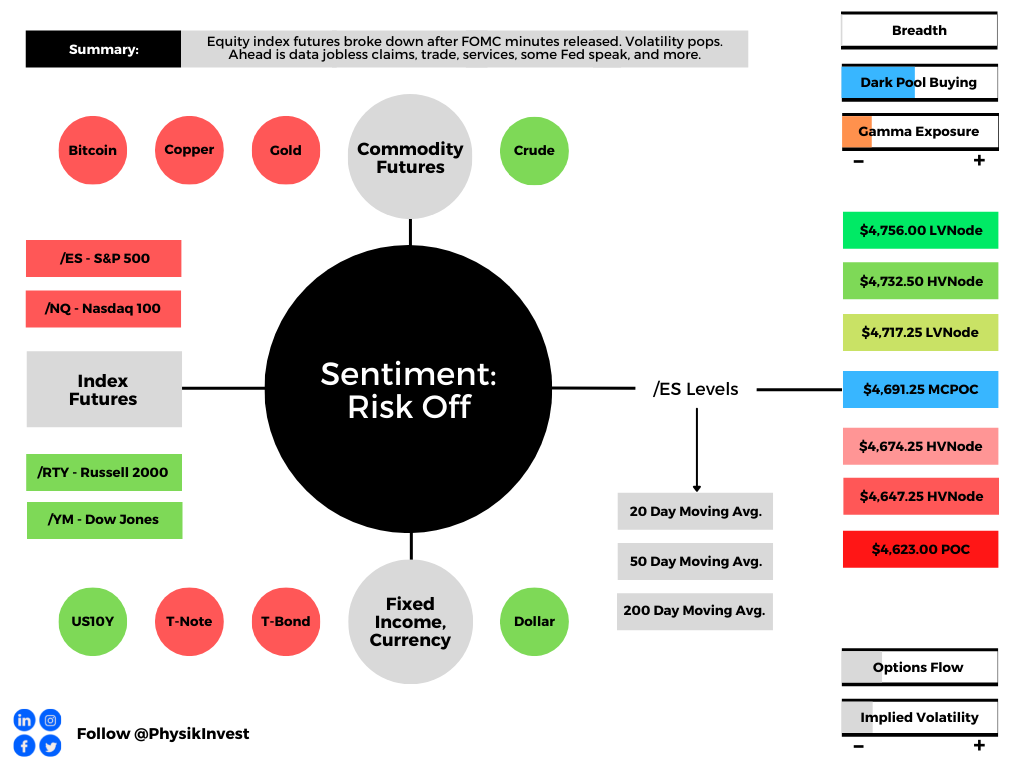
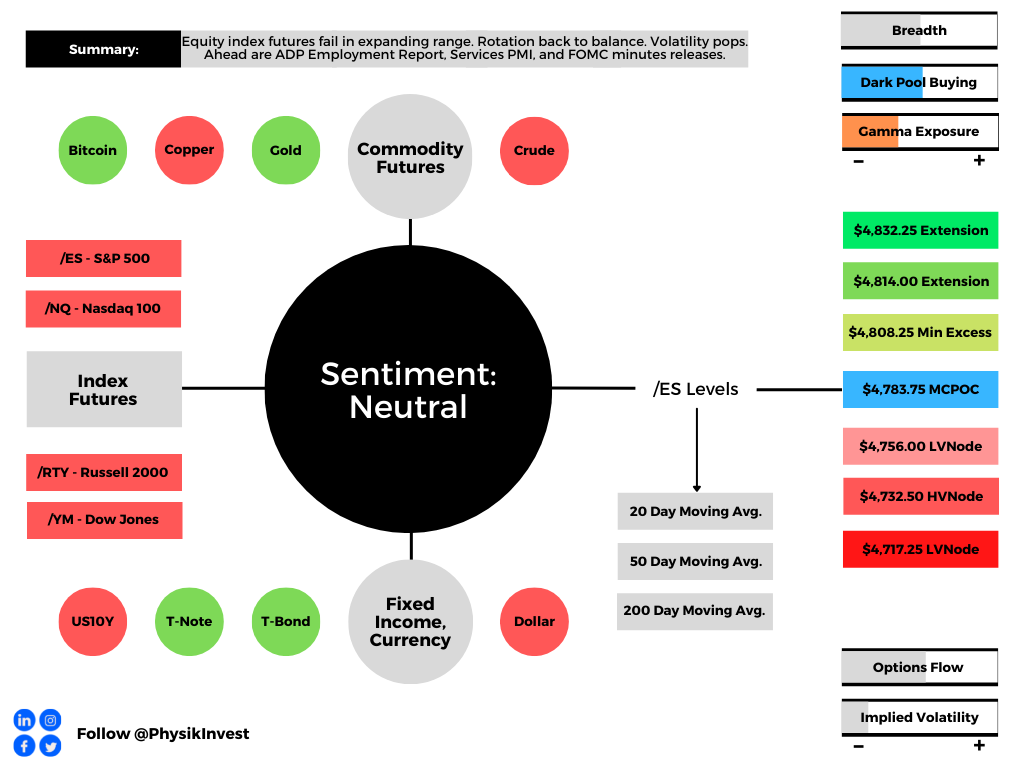
Graphic updated 6:45 AM ET. Sentiment Neutral if expected /ES open is inside of the prior day’s range. /ES levels are derived from the profile graphic at the bottom of the following section. Levels may have changed since initially quoted; click here for the latest levels. SqueezeMetrics Dark Pool Index (DIX) and Gamma (GEX) calculations are based on where the prior day’s reading falls with respect to the MAX and MIN of all occurrences available. A higher DIX is bullish. At the same time, the lower the GEX, the more (expected) volatility. Learn the implications of volatility, direction, and moneyness. SHIFT data used for S&P 500 (INDEX: SPX) options activity. Note that options flow is sorted by the call premium spent; if more positive, then more was spent on call options. Breadth reflects a reading of the prior day’s NYSE Advance/Decline indicator. VIX reflects a current reading of the CBOE Volatility Index (INDEX: VIX) from 0-100.

What To Expect

Fundamental: The Federal Reserve (Fed) is expected to raise its target overnight rate by about 50 basis points and provide updates on quantitative tightening (QT).
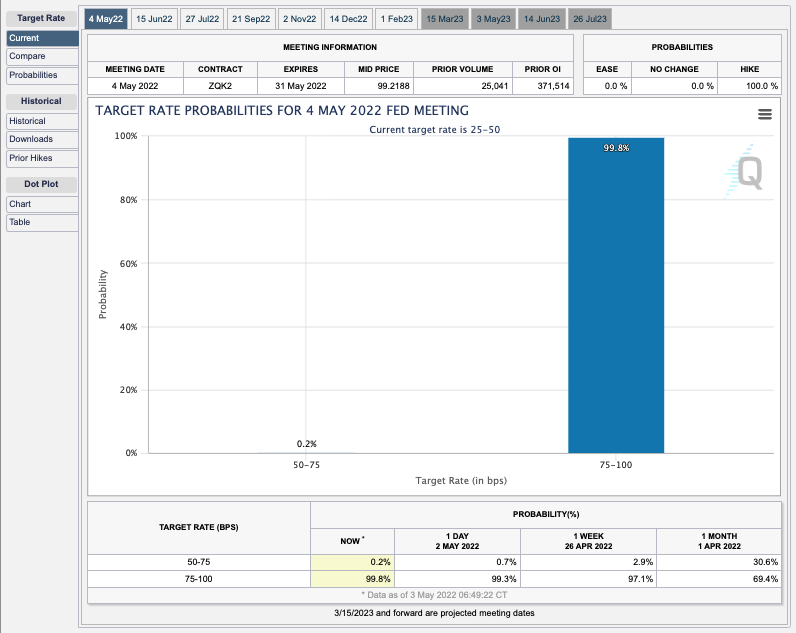
Graphic: Via CME Group Inc’s (NASDAQ: CME) FedWatch Tool. Market participants expect a near-100% chance the fed moves its target rate to 75 or 100 basis points.

The expectations of the aforementioned have played into a tightening of financial conditions which, as Columbia Threadneedle’s Gene Tannuzzo explains, “reduces demand and ultimately slows inflation.”

Graphic: Via Bloomberg. “Tighter financial conditions are the mechanism that reduces demand and ultimately slows inflation,” said Tannuzzo, the firm’s global head of fixed income. “If financial conditions don’t tighten and inflation remains high, in their eyes, they need to hike more.”

The key is the update on QT. As Bloomberg’s John Authers puts it well, “what the Fed does with its balance sheet at the margin [] matters for asset prices, and there is little or no lag.”
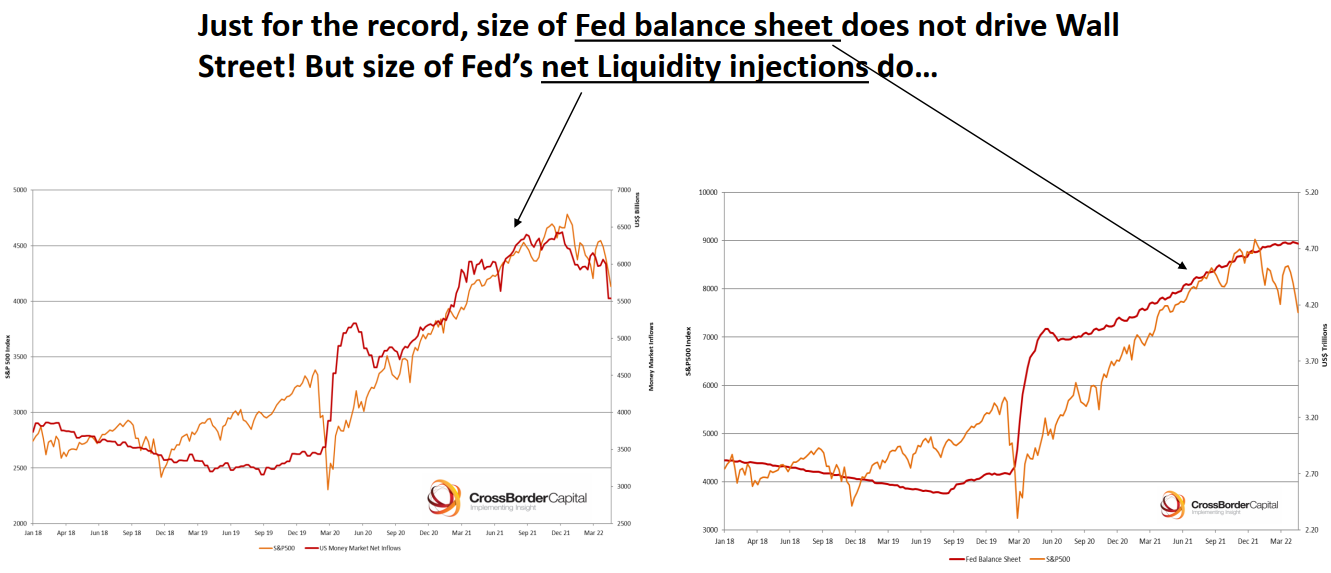
Graphic: Via Crossborder Capital Ltd. Taken from Bloomberg.

The Fed’s liquidity reductions, thus far, have played into the market’s troubles since the start of the year. This is as QT has an impact on the “ability to roll over or refinance investments.”

Graphic: Taken from The Market Ear. “46% of non-earnings driven market cap changes were explained by Fed balance sheet expansion since GFC.”

Perspective: JPMorgan Chase & Co (NYSE: JPM) strategists note that investors’ fears are unwarranted. The U.S.’s economic expansion has not been derailed. 

“Worries about China’s growth outlook, a negative take on the Q1 earnings reporting season, concerns about higher bond yields and further tightening of financial conditions from a strong dollar, all appear to have soured equity and credit investors’ sentiment,” the strategists said. 

“We find these fears overblown.”

Positioning: Comments from yesterday’s morning letter remain valid, today.

Participants’ bets on the direction are concentrated in negative delta (long puts, short calls). The exposure is short-dated and extremely sensitive to changes in implied volatility and direction.
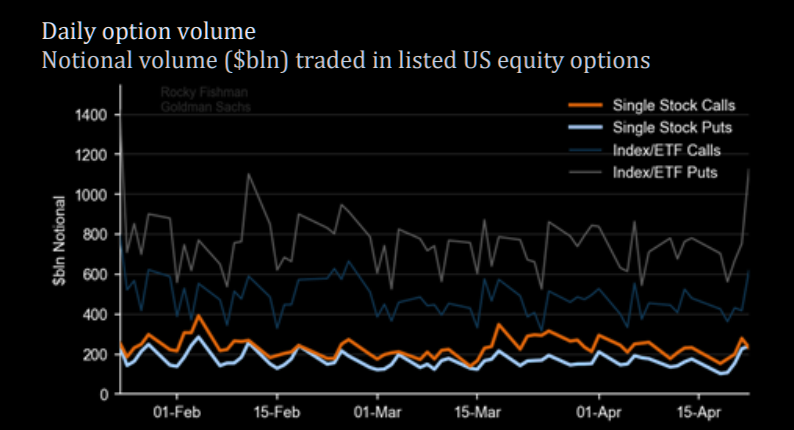
Graphic: Via Goldman Sachs Group Inc (NYSE: GS). Taken from The Market Ear. “Retail Investors buyers of 0-1 DTE (days-to-expiry) puts are largest on record.”

Those options carry a lot of gamma and are exposed to the potential for asymmetric or convex payouts. This is not good for those who are on the other side.

In hedging a short put, for instance, a positive delta and negative gamma trade, counterparties sell underlying if there is weakness or jumps in implied volatility. If the underlying trades higher, or dips in volatility, the counterparty will buy the underlying, all else equal.

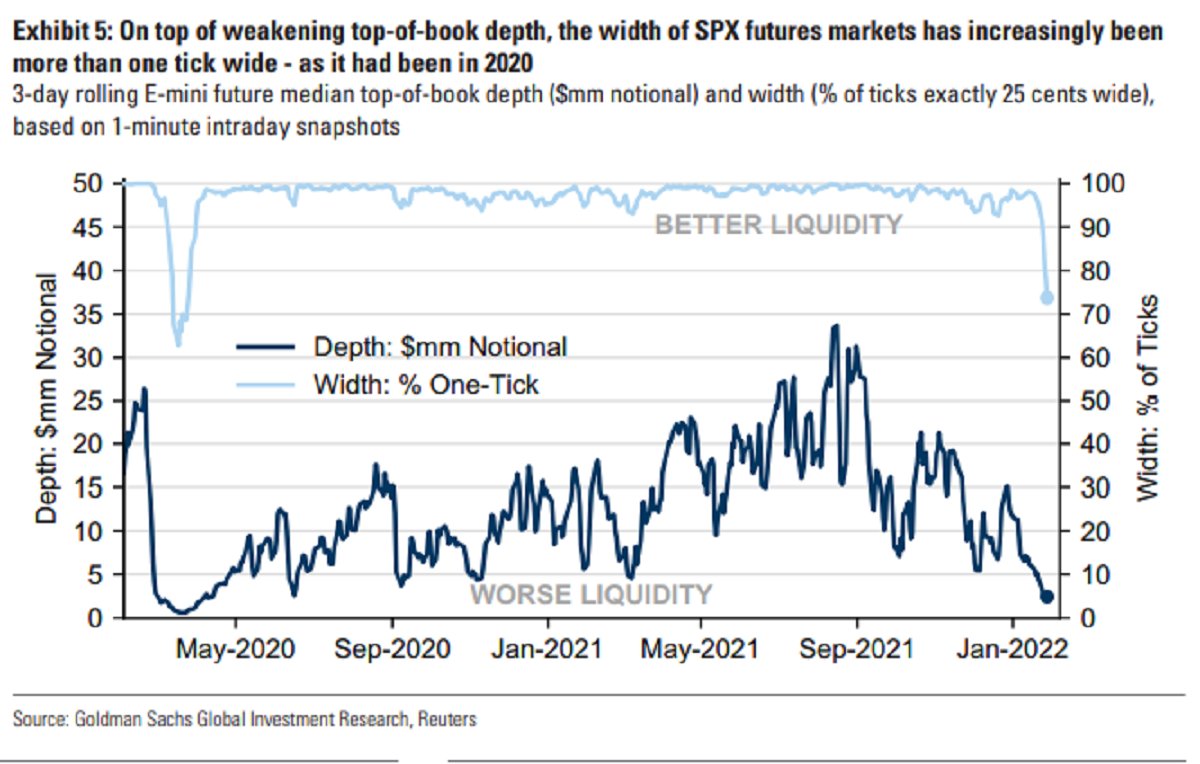
Taken together, in such an environment, the counterparty leans toward taking liquidity and this exacerbates underlying movement if there’s a thinning liquidity environment, SpotGamma says.
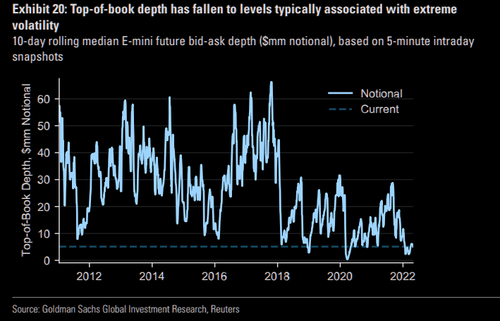
Graphic: Via Goldman Sachs Group Inc (NYSE: GS). Taken from SpotGamma.

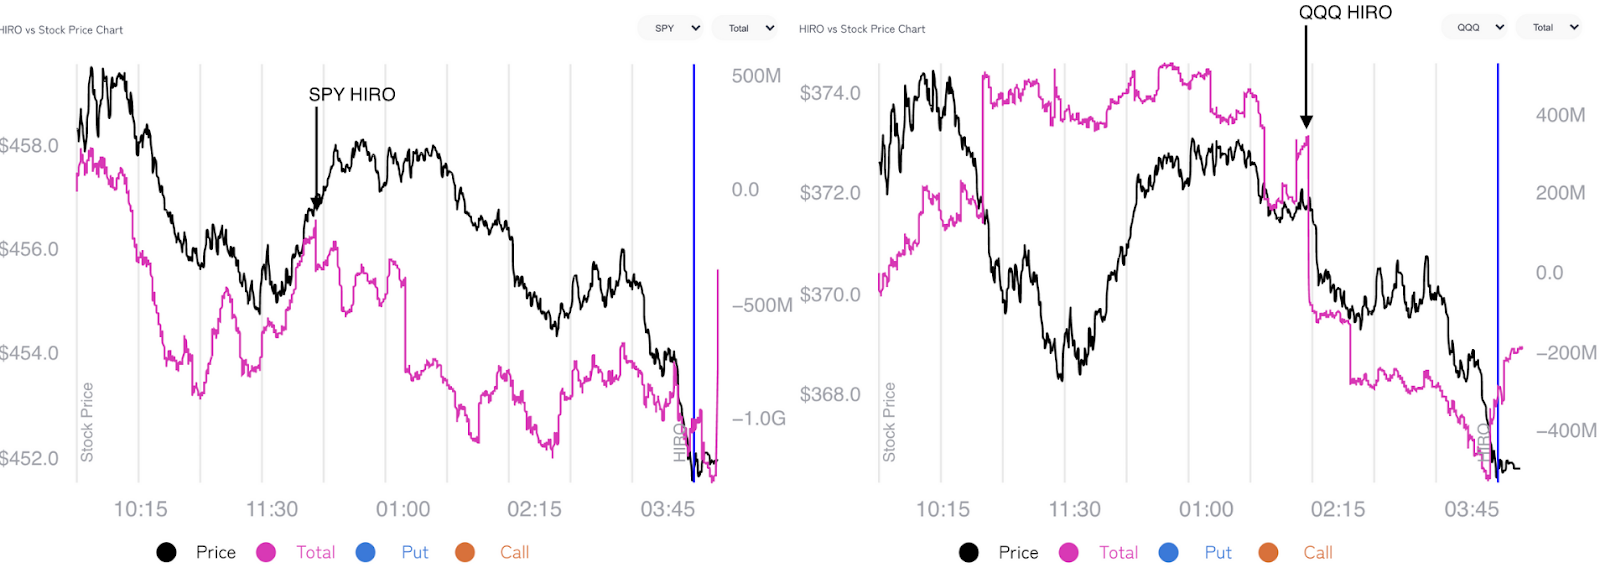
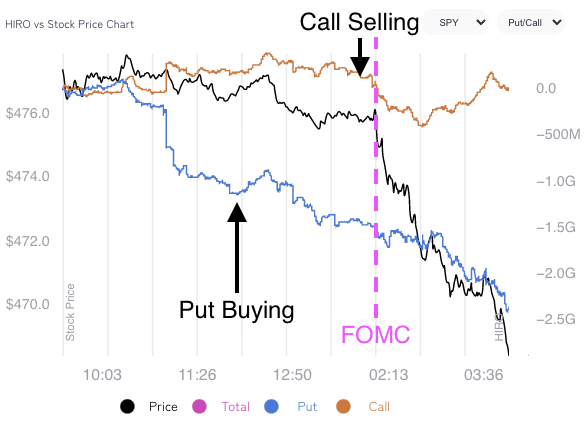
In other words, hedging matters more in such an environment. This was clear during Monday’s trade when a bout of put selling and light call buying appeared in both the SPDR S&P 500 ETF Trust (NYSE: SPY) and Invesco QQQ Trust Series 1 (NASDAQ: QQQ).

This, ultimately, too, fed into the compression of volatility at the short-end of the term structure, yesterday. To re-hedge, counterparts likely bought into the market’s weakness and bolstered the near-vertical reversal, and close higher.
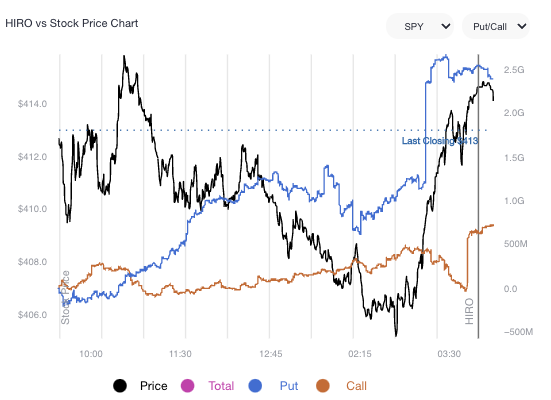
Graphic: SpotGamma’s Hedging Impact of Real-Time Options (HIRO) indicator for SPY. A rising blue and orange denote put selling and call buying, respectively.

The odds of follow-through, to the upside, come back to the fundamental situation and Fed announcements this week. Should fears with respect to monetary policy be assuaged, then volatility can compress and that, alone, will spur a buy-back of those underlying short hedges.

If participants start to concentrate their bets at higher prices, further out in time, that confirms the odds of sustained follow-through. If not, it’s likely that prices, after a short-term relief, will succumb to fundamental weaknesses.

Technical: As of 6:45 AM ET, Tuesday’s regular session (9:30 AM – 4:00 PM ET), in the S&P 500, will likely open in the middle part of a balanced overnight inventory, inside of prior-range and -value, suggesting a limited potential for immediate directional opportunity.

In the best case, the S&P 500 trades higher; activity above the $4,123.00 untested point of control (VPOC) puts in play the $4,176.00 overnight high (ONH). Initiative trade beyond the ONH could reach as high as the $4,247.00 VPOC and $4,279.75 ONH, or higher.

In the worst case, the S&P 500 trades lower; activity below the $4,123.00 VPOC puts in play the $4,055.75 low volume area (LVNode). Initiative trade beyond the LVNode could reach as low as the $3,978.50 LVNode and $3,943.25 high volume area (HVNode), or lower.

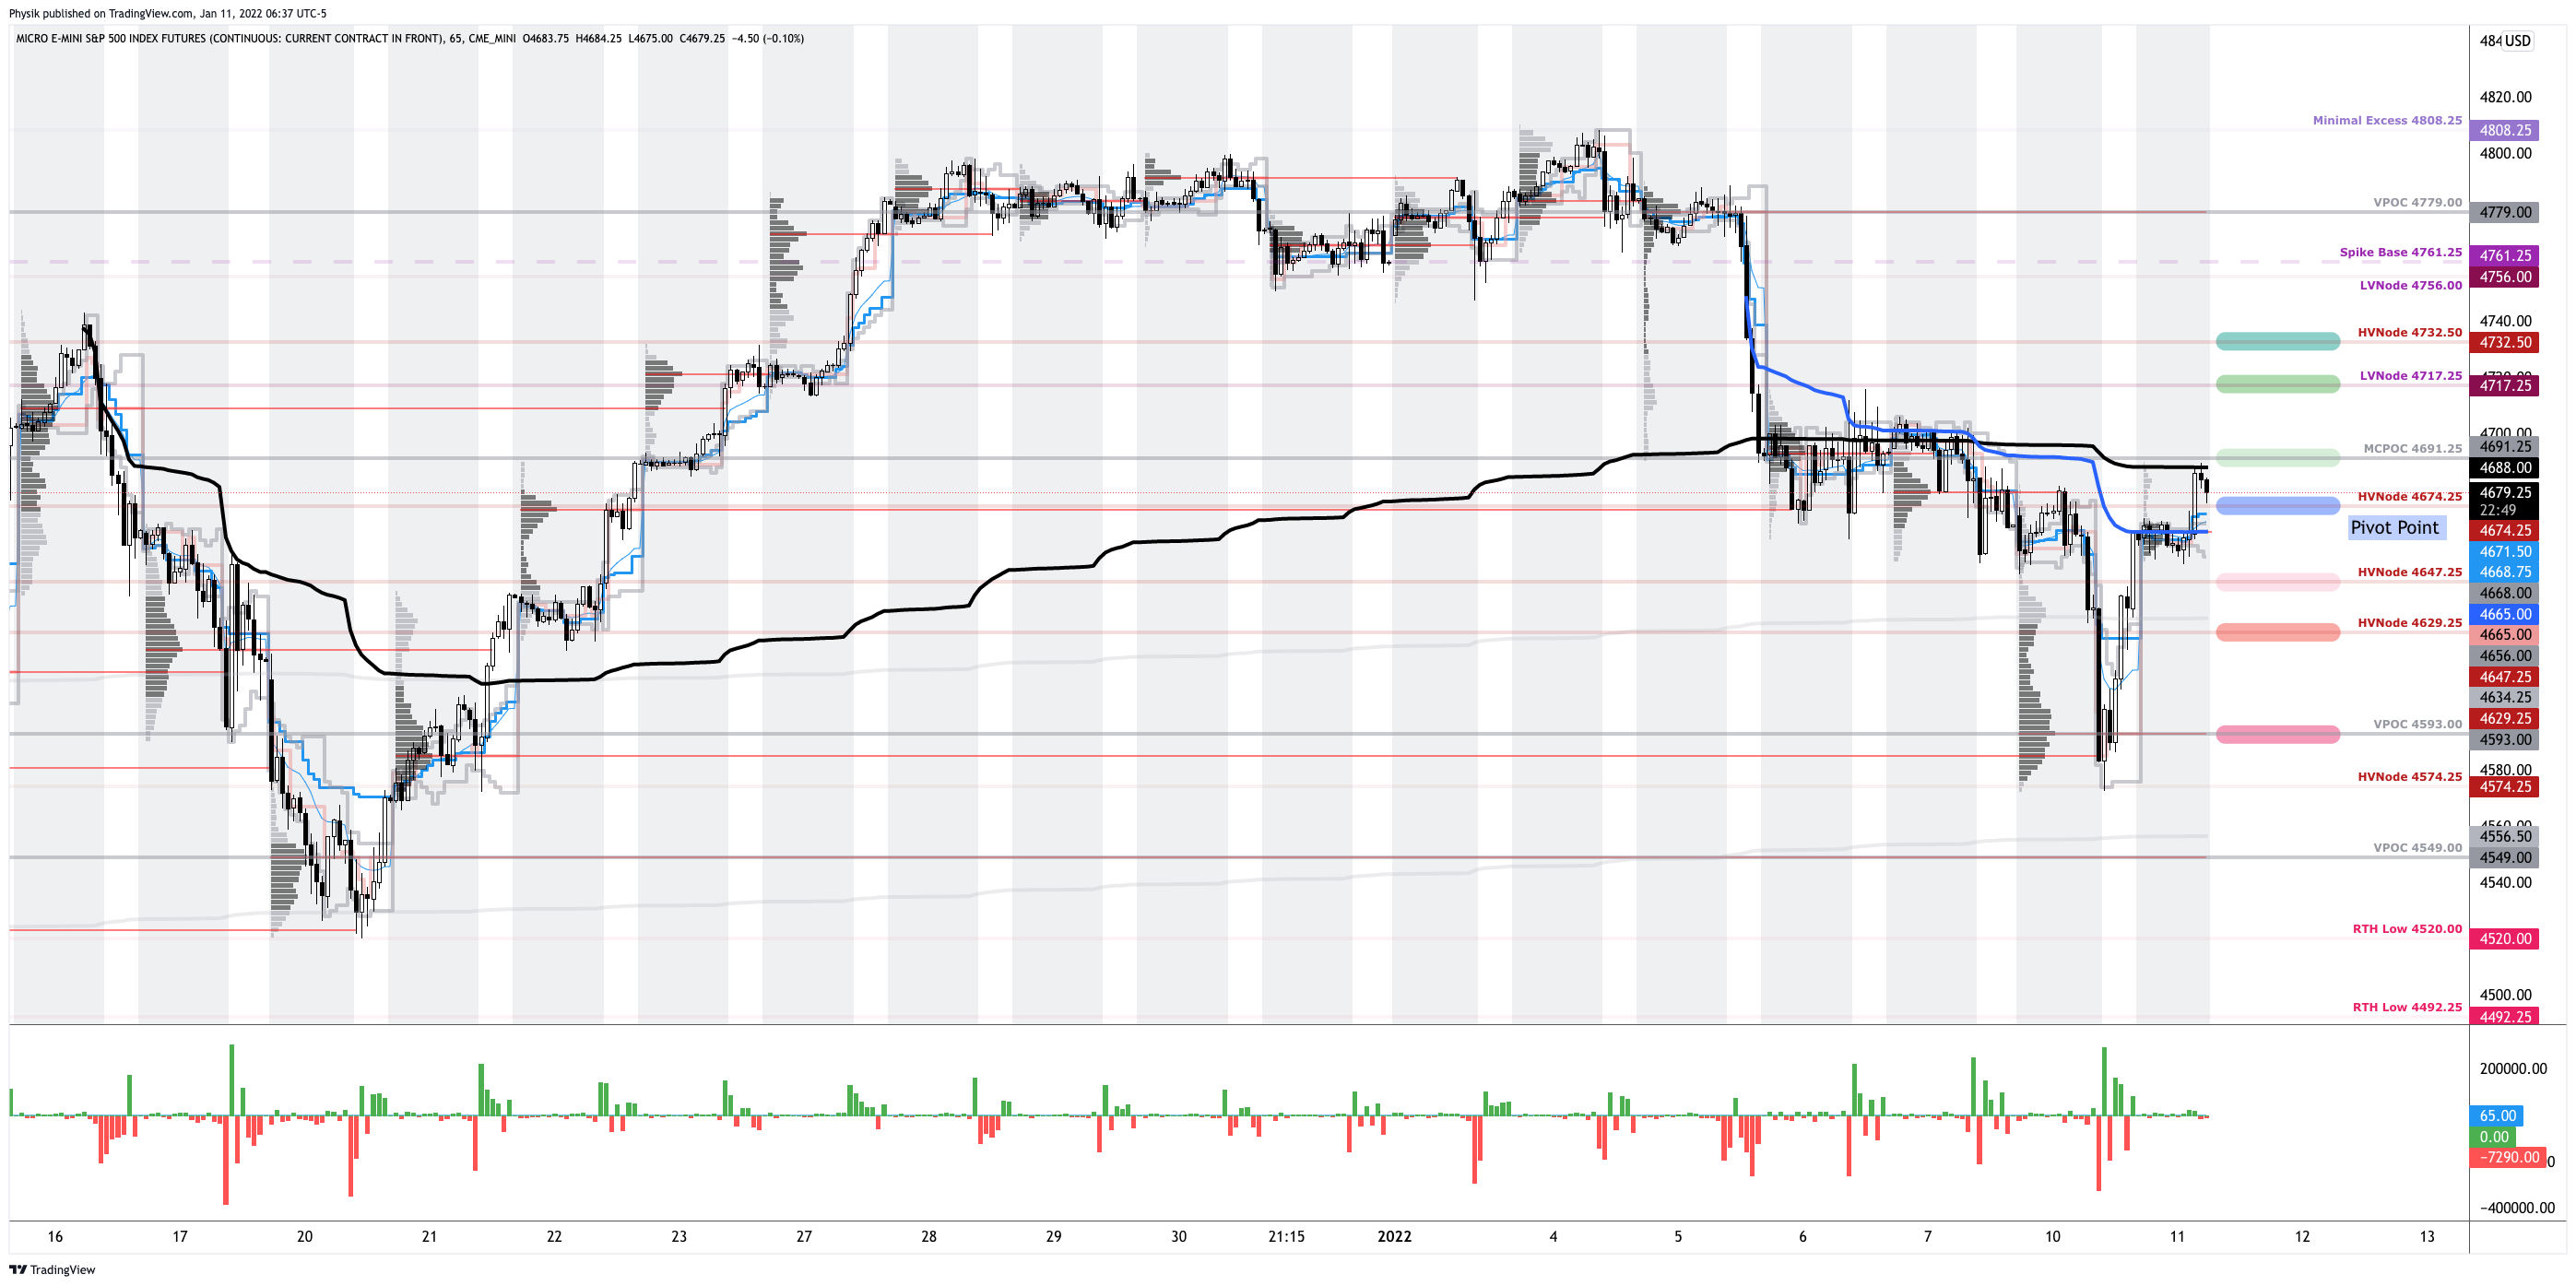
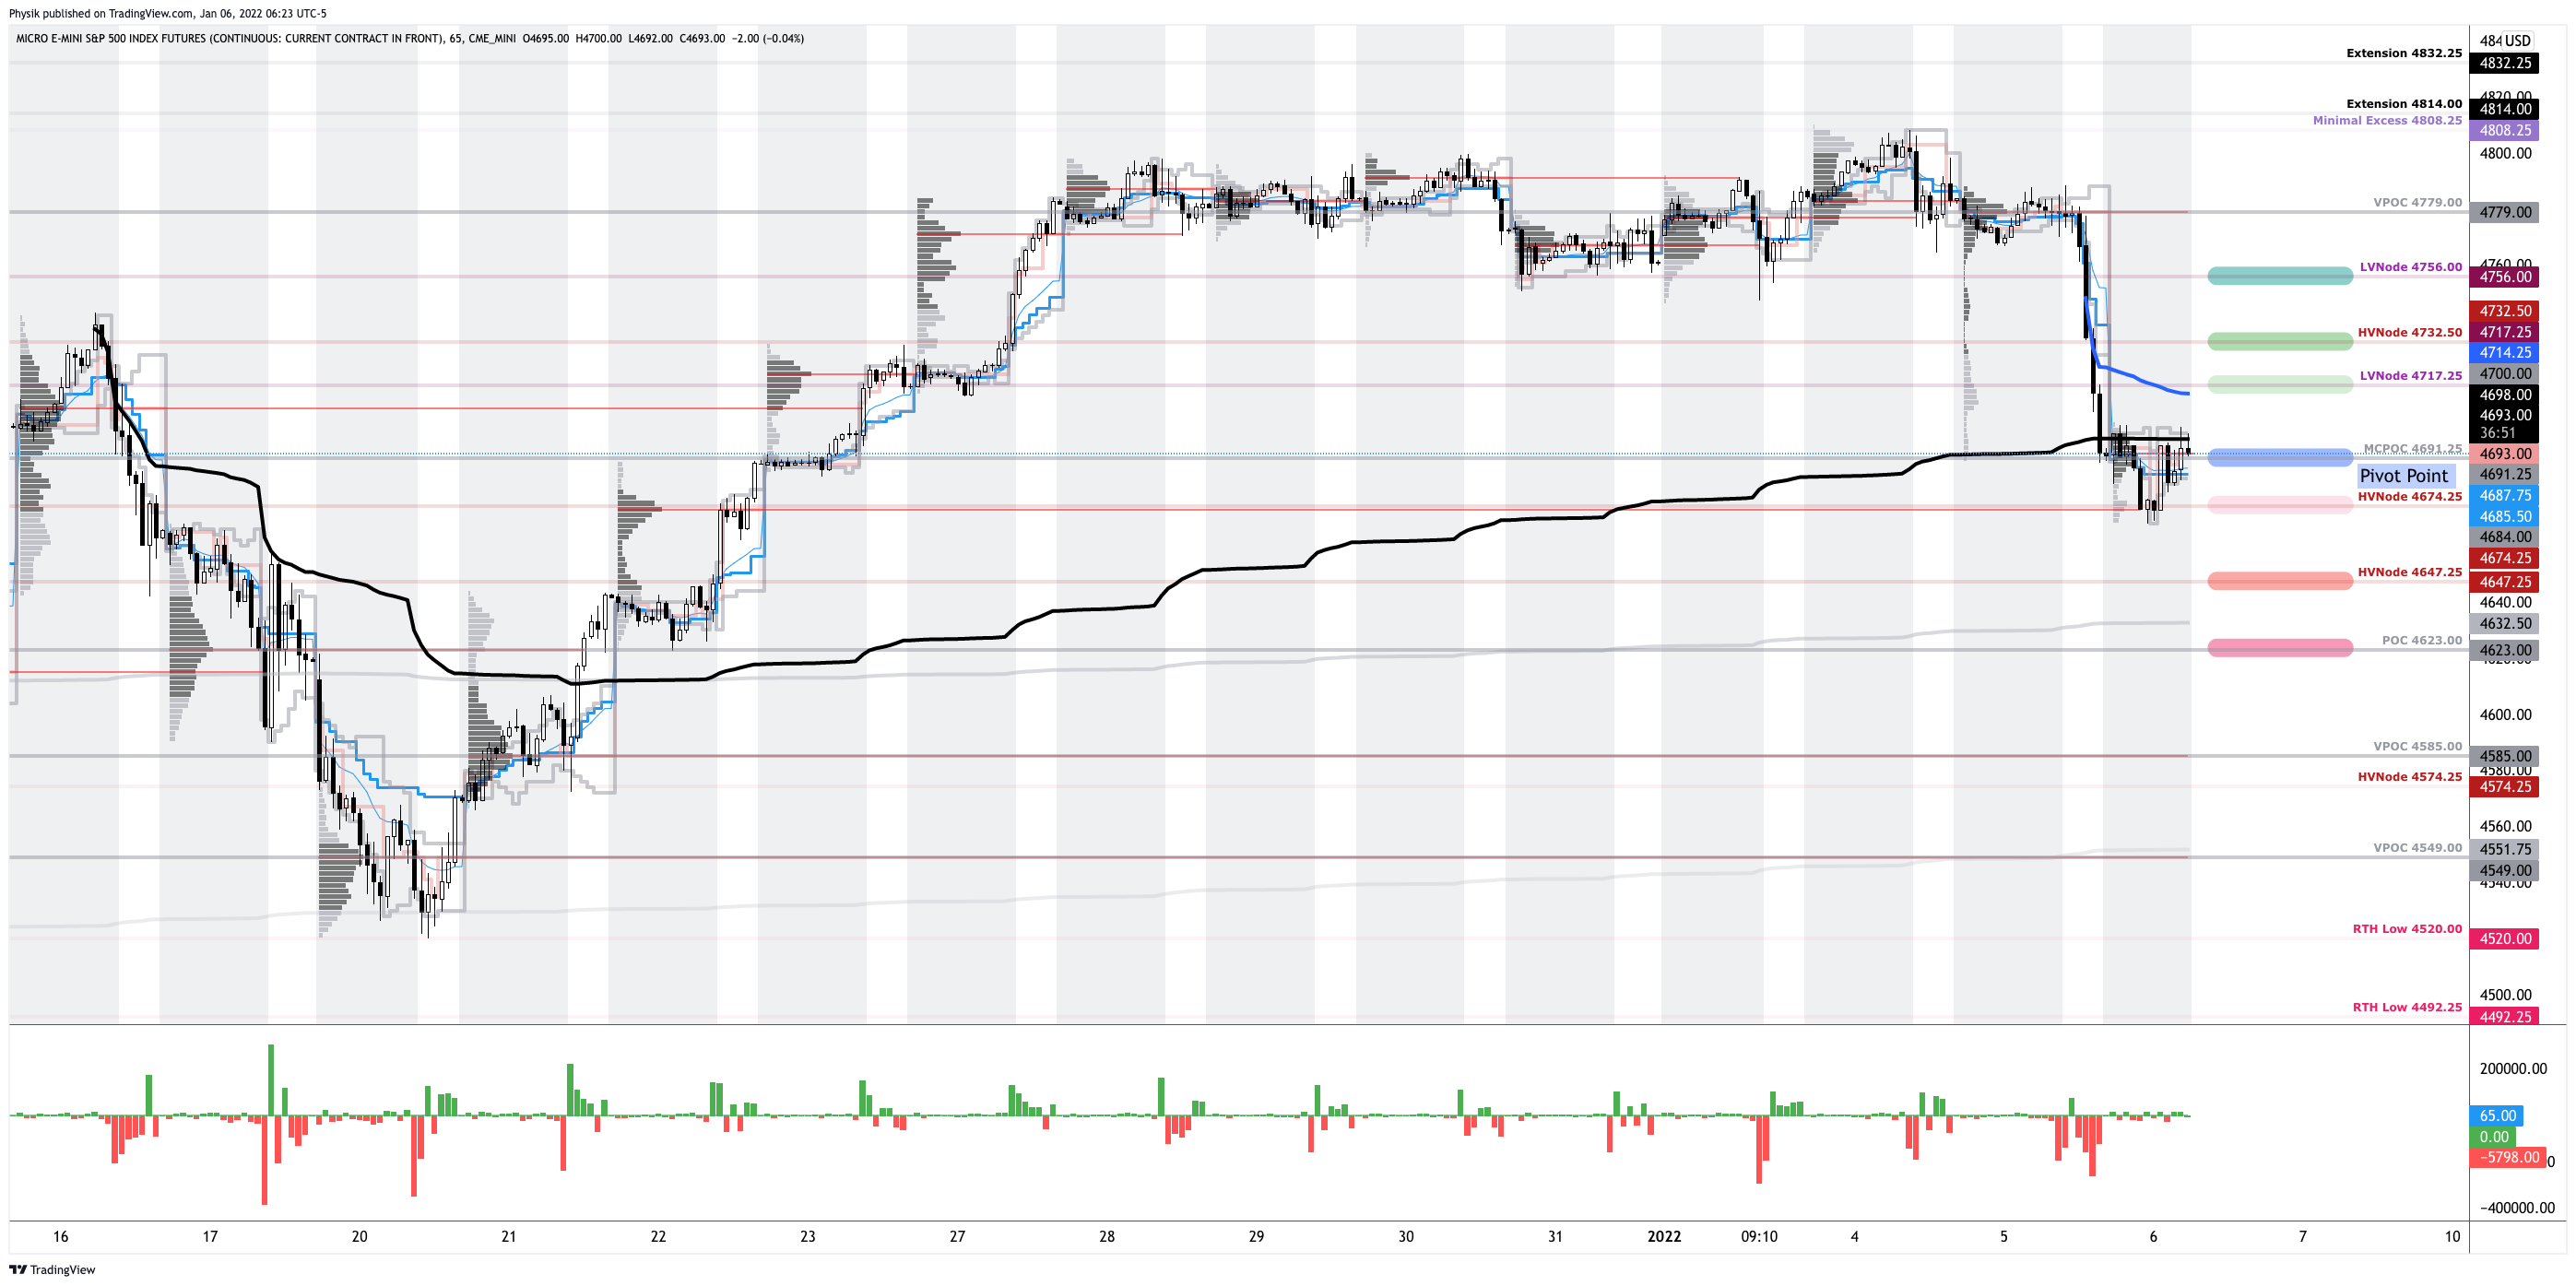
Click here to load today’s key levels into the web-based TradingView charting platform. Note that all levels are derived using the 65-minute timeframe. New links are produced, daily.
Graphic: 65-minute profile chart of the Micro E-mini S&P 500 Futures.

Considerations: Most interesting was Monday’s response at a key technical level ($4,055.75) outlined in the morning letter.

Specifically, the E-mini S&P 500 probed $4,056.00 before staging a sharp reversal and closing higher. This is noteworthy as it tells us a lot about who has (or is gaining) the upper hand.

Push-and-pull, as well as responsiveness near key-technical areas (discernable visually on a chart), suggests technically-driven traders with shorter time horizons are (becoming) active.

Such traders often lack the wherewithal to defend retests and, additionally, this type of trade may suggest other time frame participants are waiting for more information to initiate trades.

Adding, the Federal Reserve’s meeting this week concludes with statements to be shared on Wednesday. For weeks heading into this event, (larger) participants (that move by committee) have de-grossed and hedged. For that reason, the reliability of our technical levels took a hit.
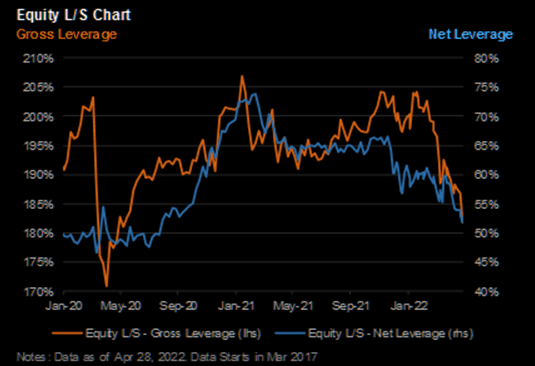
Graphic: Via JPMorgan Chase & Co (NYSE: JPM). Taken from The Market Ear. Per Bloomberg, “Hedge funds tracked by Morgan Stanley have also cut their net leverage — a measure of risk appetite that takes into account long versus short positions — to a two-year low.”

In the very near term, until more fundamental information is revealed, these technical-driven traders may play a larger role in the volatility. These traders, given capital constraints and tolerances, often trigger sharp moves in their entry and exit on news. Caution on whipsaw.

How I’m Playing: Presently, the market is stretched to the downside and participants are leaning, heavily, one way.
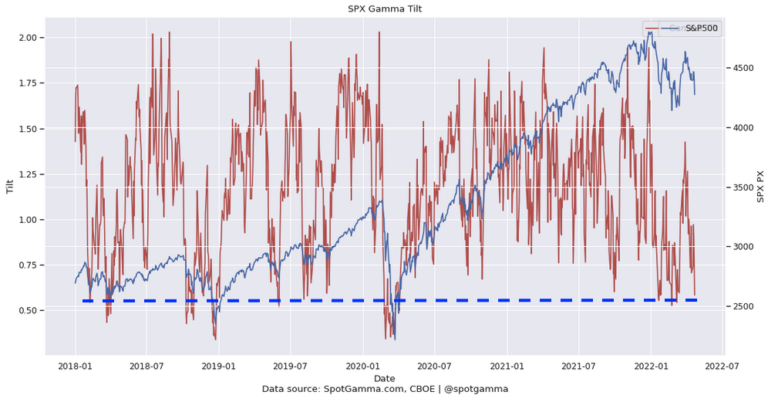
Graphic: Via SpotGamma, “Put vs Call gamma suggests stretched positioning.”

Pursuant to that remark, as SpotGamma says, “traders are underpricing right-tail risk,” and that opens the window for unique ways to play a returns distribution that is skewed positive (albeit with large negative outliers).

Consider zero- or low-cost bets that deliver asymmetric payouts in case of reversals.

This letter’s writer presently is structured positive delta and gamma in the Nasdaq 100 (INDEX: NDX) via ratios spread (1×2) and butterfly (1x2x1) structures. 

The concern with these strategies is the width and time to expiry. Should either of those be wrong, then spreads initially positive gamma turn negative, meaning losses are amplified.

For instance, in the Nasdaq 100, to put in short, 500-1000 points wide ratio spreads (buy the closer leg, sell two of the farther legs) expiring in ten to fifteen days work well. 

For those spreads that are not zero cost, debits can be offset with credit sales (on the put side) in products that have shown relative strength like the S&P 500 (INDEX: SPX). This, inherently, carries more risk. Read more about these strategies, here.

Please note that the above is NOT a trade recommendation or advice.
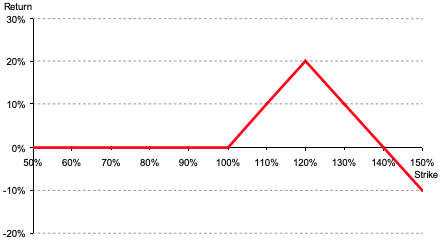
Graphic: Via Banco Santander SA (NYSE: SAN) research, the return profile, at expiry, of a classic 1×2 (long 1, short 2 further away) ratio spread.

Definitions

Overnight Rally Highs (Lows): Typically, there is a low historical probability associated with overnight rally-highs (lows) ending the upside (downside) discovery process.

Volume Areas: A structurally sound market will build on areas of high volume (HVNodes). Should the market trend for long periods of time, it will lack sound structure, identified as low volume areas (LVNodes). LVNodes denote directional conviction and ought to offer support on any test. 

If participants were to auction and find acceptance into areas of prior low volume (LVNodes), then future discovery ought to be volatile and quick as participants look to HVNodes for favorable entry or exit.

POCs: POCs are valuable as they denote areas where two-sided trade was most prevalent in a prior day session. Participants will respond to future tests of value as they offer favorable entry and exit.

Volume-Weighted Average Prices (VWAPs): A metric highly regarded by chief investment officers, among other participants, for quality of trade. Additionally, liquidity algorithms are benchmarked and programmed to buy and sell around VWAPs.

About

After years of self-education, strategy development, mentorship, and trial-and-error, Renato Leonard Capelj began trading full-time and founded Physik Invest to detail his methods, research, and performance in the markets.

Capelj also develops insights around impactful options market dynamics at SpotGamma and is a Benzinga reporter.

Some of his works include conversations with ARK Invest’s Catherine Wood, investors Kevin O’Leary and John Chambers, FTX’s Sam Bankman-Fried, Kai Volatility’s Cem Karsan, The Ambrus Group’s Kris Sidial, among many others.

Disclaimer

In no way should the materials herein be construed as advice. Derivatives carry a substantial risk of loss. All content is for informational purposes only.


Categories
Commentary

Daily Brief For April 28, 2022

The Daily Brief is a free glimpse into the prevailing fundamental and technical drivers of U.S. equity market products. Join the 200+ that read this report daily, below!

What Happened

Overnight, equity index futures auctioned sideways-to-higher alongside some upbeat earnings announcements.

Meta Platforms Inc (NASDAQ: FB) surged post-market, yesterday, after its main social network Facebook added more users than expected. 

PayPal Holdings Inc (NYSE: PYPL) vowed to rein in costs and boost profits while Qualcomm Inc (NASDAQ: QCOM) rose on an upbeat forecast.

There’s a strong push-and-pull between what’s good and bad. File Deutsche Bank’s (NYSE: DB) recent comments on a pending recession under what’s bad.

The bank sees the Fed Target Rate reaching up to 6% which “will push the economy into a significant recession by late next year.”

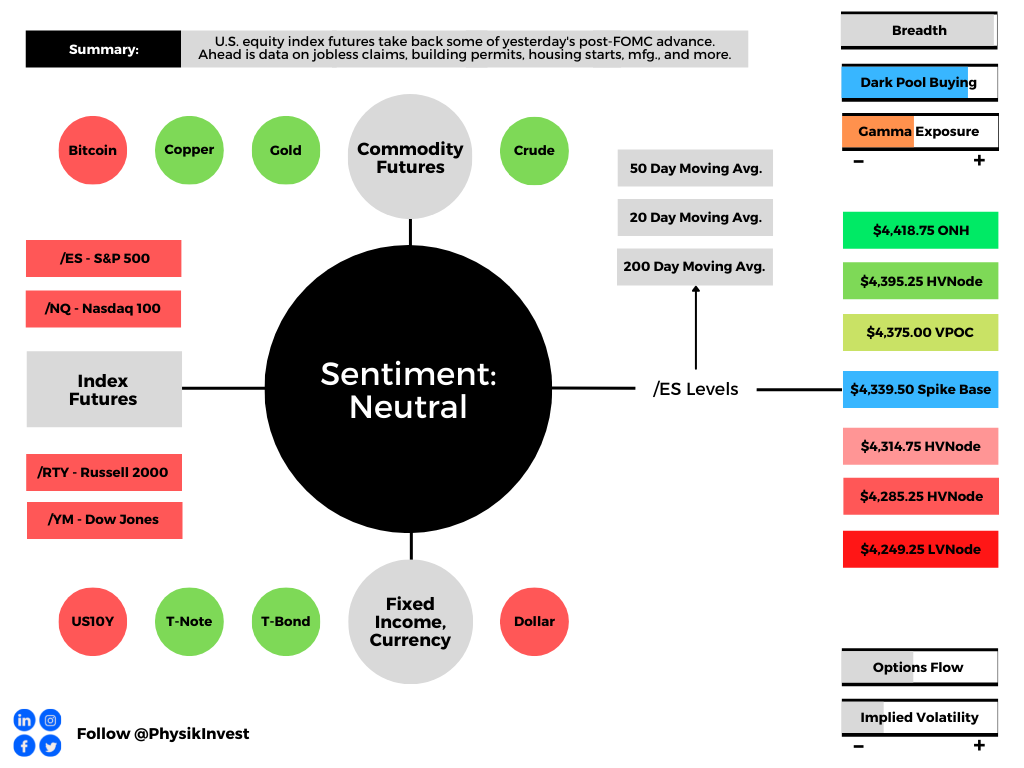
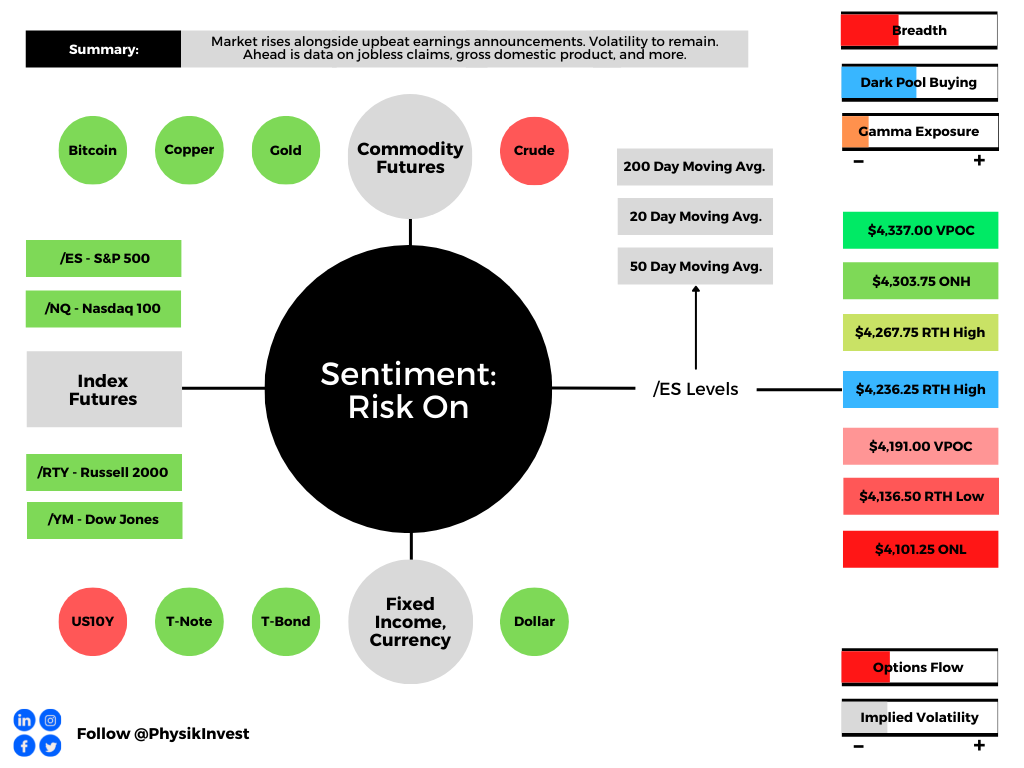
Graphic updated 7:00 AM ET. Sentiment Risk-On if expected /ES open is above the prior day’s range. Sentiment Risk-Off if expected /ES open is below the prior day’s range. /ES levels are derived from the profile graphic at the bottom of the following section. Levels may have changed since initially quoted; click here for the latest levels. SqueezeMetrics Dark Pool Index (DIX) and Gamma (GEX) calculations are based on where the prior day’s reading falls with respect to the MAX and MIN of all occurrences available. A higher DIX is bullish. At the same time, the lower the GEX, the more (expected) volatility. Learn the implications of volatility, direction, and moneyness. SHIFT data used for S&P 500 (INDEX: SPX) options activity. Note that options flow is sorted by the call premium spent; if more positive, then more was spent on call options. Breadth reflects a reading of the prior day’s NYSE Advance/Decline indicator. VIX reflects a current reading of the CBOE Volatility Index (INDEX: VIX) from 0-100.

What To Expect

Fundamental: Divergences across different assets and markets continue.

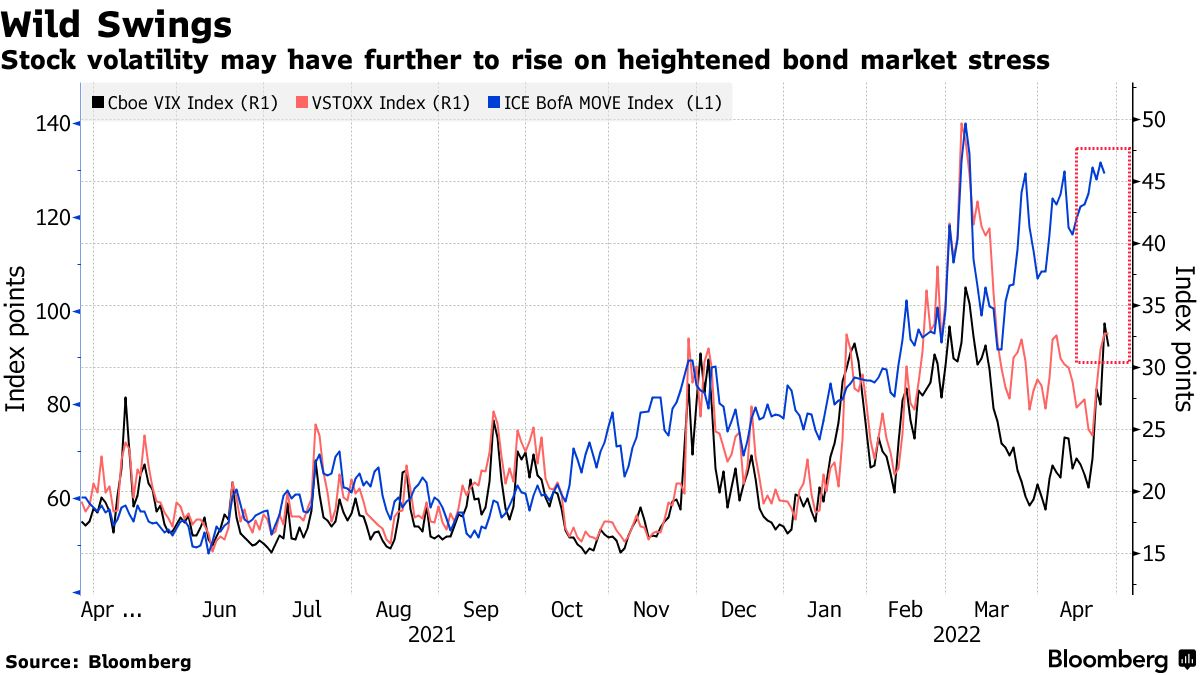
For instance, the equity market’s pricing of risk which we can take as being reflected by the CBOE Volatility Index [INDEX: VIX]) is not moving lock-step with that of measures elsewhere.

Graphic: Via Bloomberg.

The fear in one market tends to spread to others. Regardless of the cause, it seems that equity and bond market participants are not on the same page.

Is that really true, though? Not necessarily. 

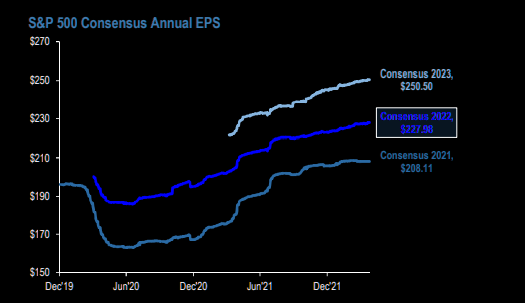
If we look at some single stocks, Netflix Inc (NASDAQ: NFLX), among others (all the while S&P 500 earnings have been revised up) has suffered through a substantial de-rate and volatility as participants priced the implications of policy evolution, slower economic growth, and beyond.

Graphic: Via JPMorgan Chase & Co (NYSE: JPM). Taken from The Market Ear.

That has us returning to pinning at the index level, relative to what the constituents are doing.

As well explained in Physik Invest’s March 3, 2022 commentary, this is more so a function of positioning and structural flows, or supply of liquidity.

Absent some exogenous event, participants are well-hedged for what is known (e.g., rate hikes and quantitative tightening (QT), COVID resurgences, Russia and Ukraine, among other things).

The caveat is that the Federal Reserve is far more aggressive than expected, ramping up QT, “a direct flow of capital to capital markets or flow out of,” per Kai Volatility’s Cem Karsan. 

For context, it is the intention to take from the max liquidity (which pushed participants out of the risk curve and promoted a divergence from fundamentals) markets were supplied with, and this has the effect of removing market excesses, some of which have fed into volatility markets.

In part, some of the QT has been reflected in bond prices, JPMorgan Chase & Co (NYSE: JPM) explains. However, should there be far more aggressive monetary action, as Deutsche research suggests, coupled with a worsening of the geopolitical and/or economic situation abroad (e.g., Russian default), markets are likely to succumb.

“Using the balance sheet as a tightening tool represents a large change in the Fed’s attitude, and IS NOT priced into the market,” MacroTourist’s Kevin Muir adds.

“An increase in the pace of tightening of QT should mean lower stocks, wider credit spreads, and a slight reduction in the need for front-end hikes.”

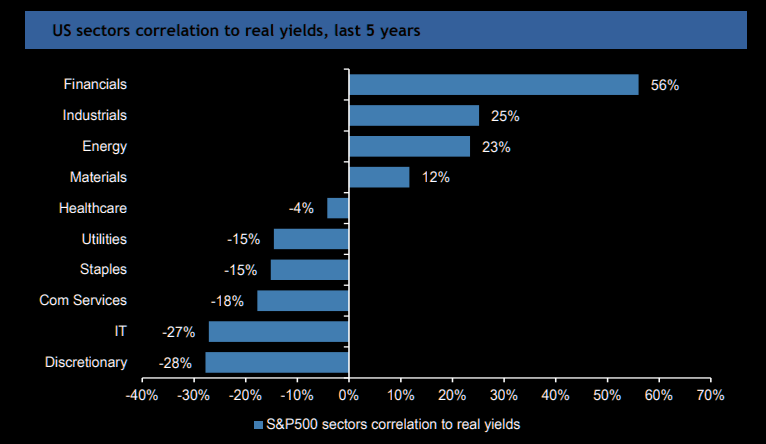
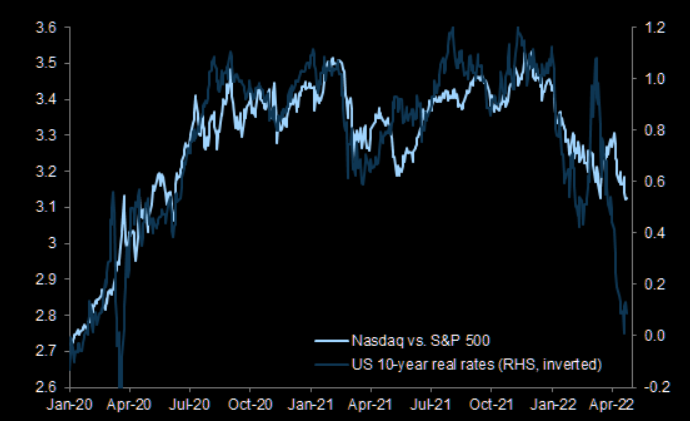
Graphic: Via Goldman Sachs Group Inc (NYSE: GS). Taken from The Market Ear. The “Nasdaq has underperformed the S&P 500 but by less than what the move in real yields would suggest.”

Positioning: Volatility to continue as markets have traded lower and participants have priced up the cost of insurance – particularly at the short-end – on underlying equity exposure.

Graphic: SPX volatility term structure via Refinitiv. Taken from The Market Ear.

This is due to options delta (exposure to direction) being far more sensitive (gamma) across shorter time horizons (i.e., the range across which options deltas shift from “near-zero to near-100% becomes very narrow.”)

Yesterday, markets were pinned after exploring lower in the days prior. The activity was concentrated in short-dated bets at those levels, and that’s in part a result of some of the hedging that went on.

Graphic: Via SpotGamma’s Hedging Impact of Real-Time Options Indicator.

If markets do not perform to the downside (i.e., do not trade lower), those short-dated bets on direction will quickly decay, and hedging flows with respect to time (charm) and volatility (vanna) may bolster sharp rallies.

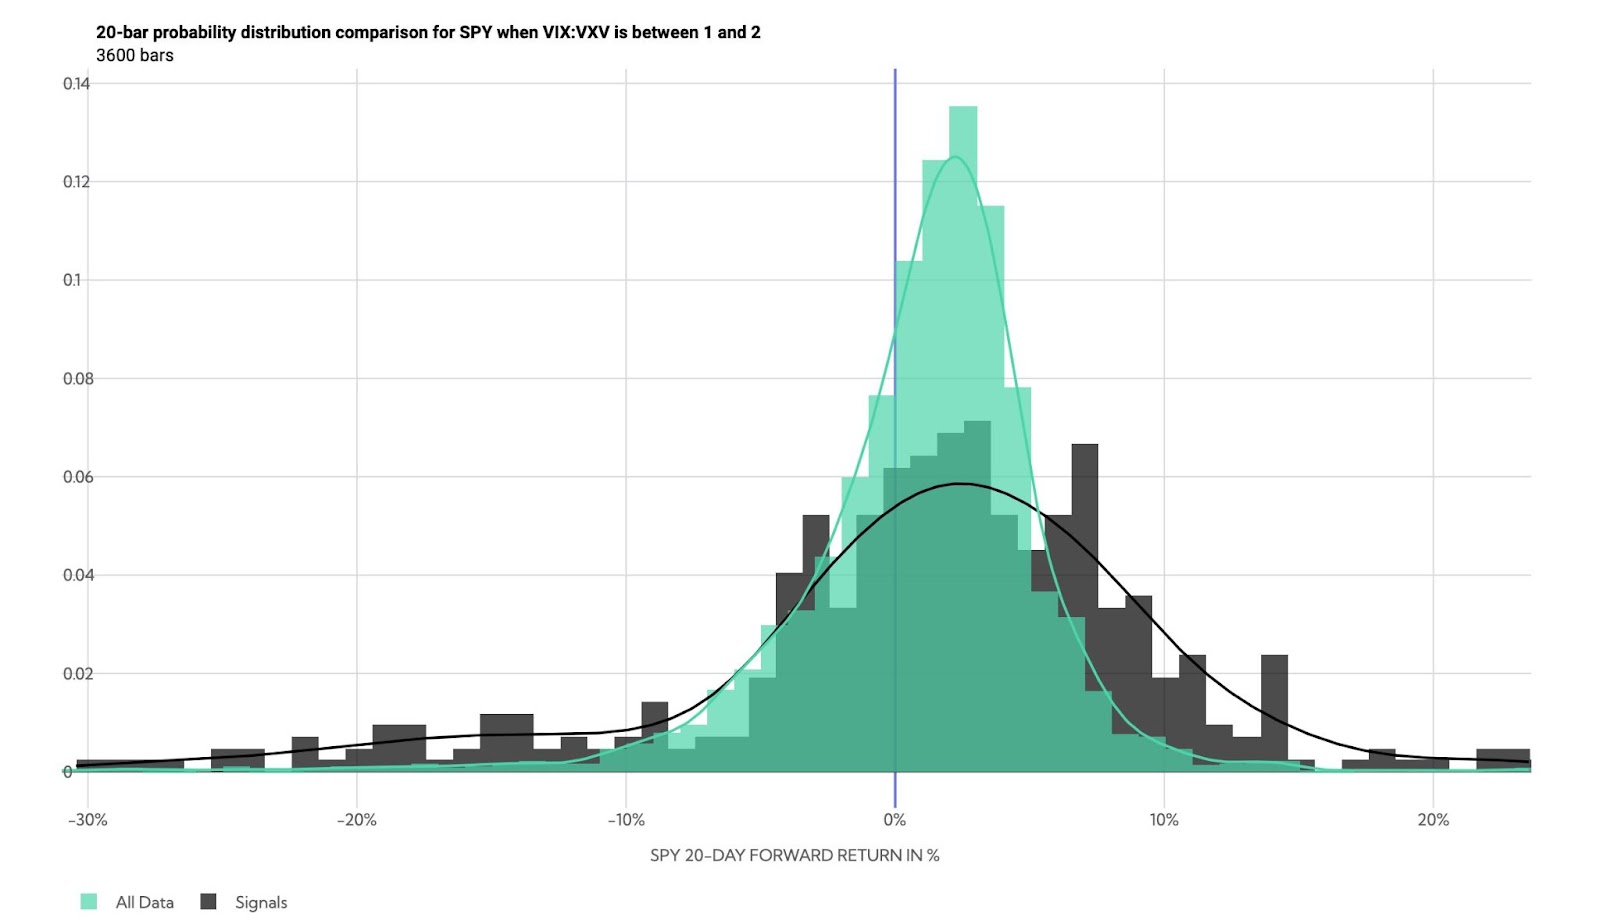
Whether those price rises have legs depends on what the fundamental situation is, then. Regardless, the returns distribution, based on implied volatility metrics alone, is skewed positive, albeit there are some large negative outliers.

Graphic: Via @HalfersPower. “In backwardation via $VIX: $VIX3M next month [realized volatility] is highest amongst the deciles (d10 >1) ~43% subsequent realized volatility.”

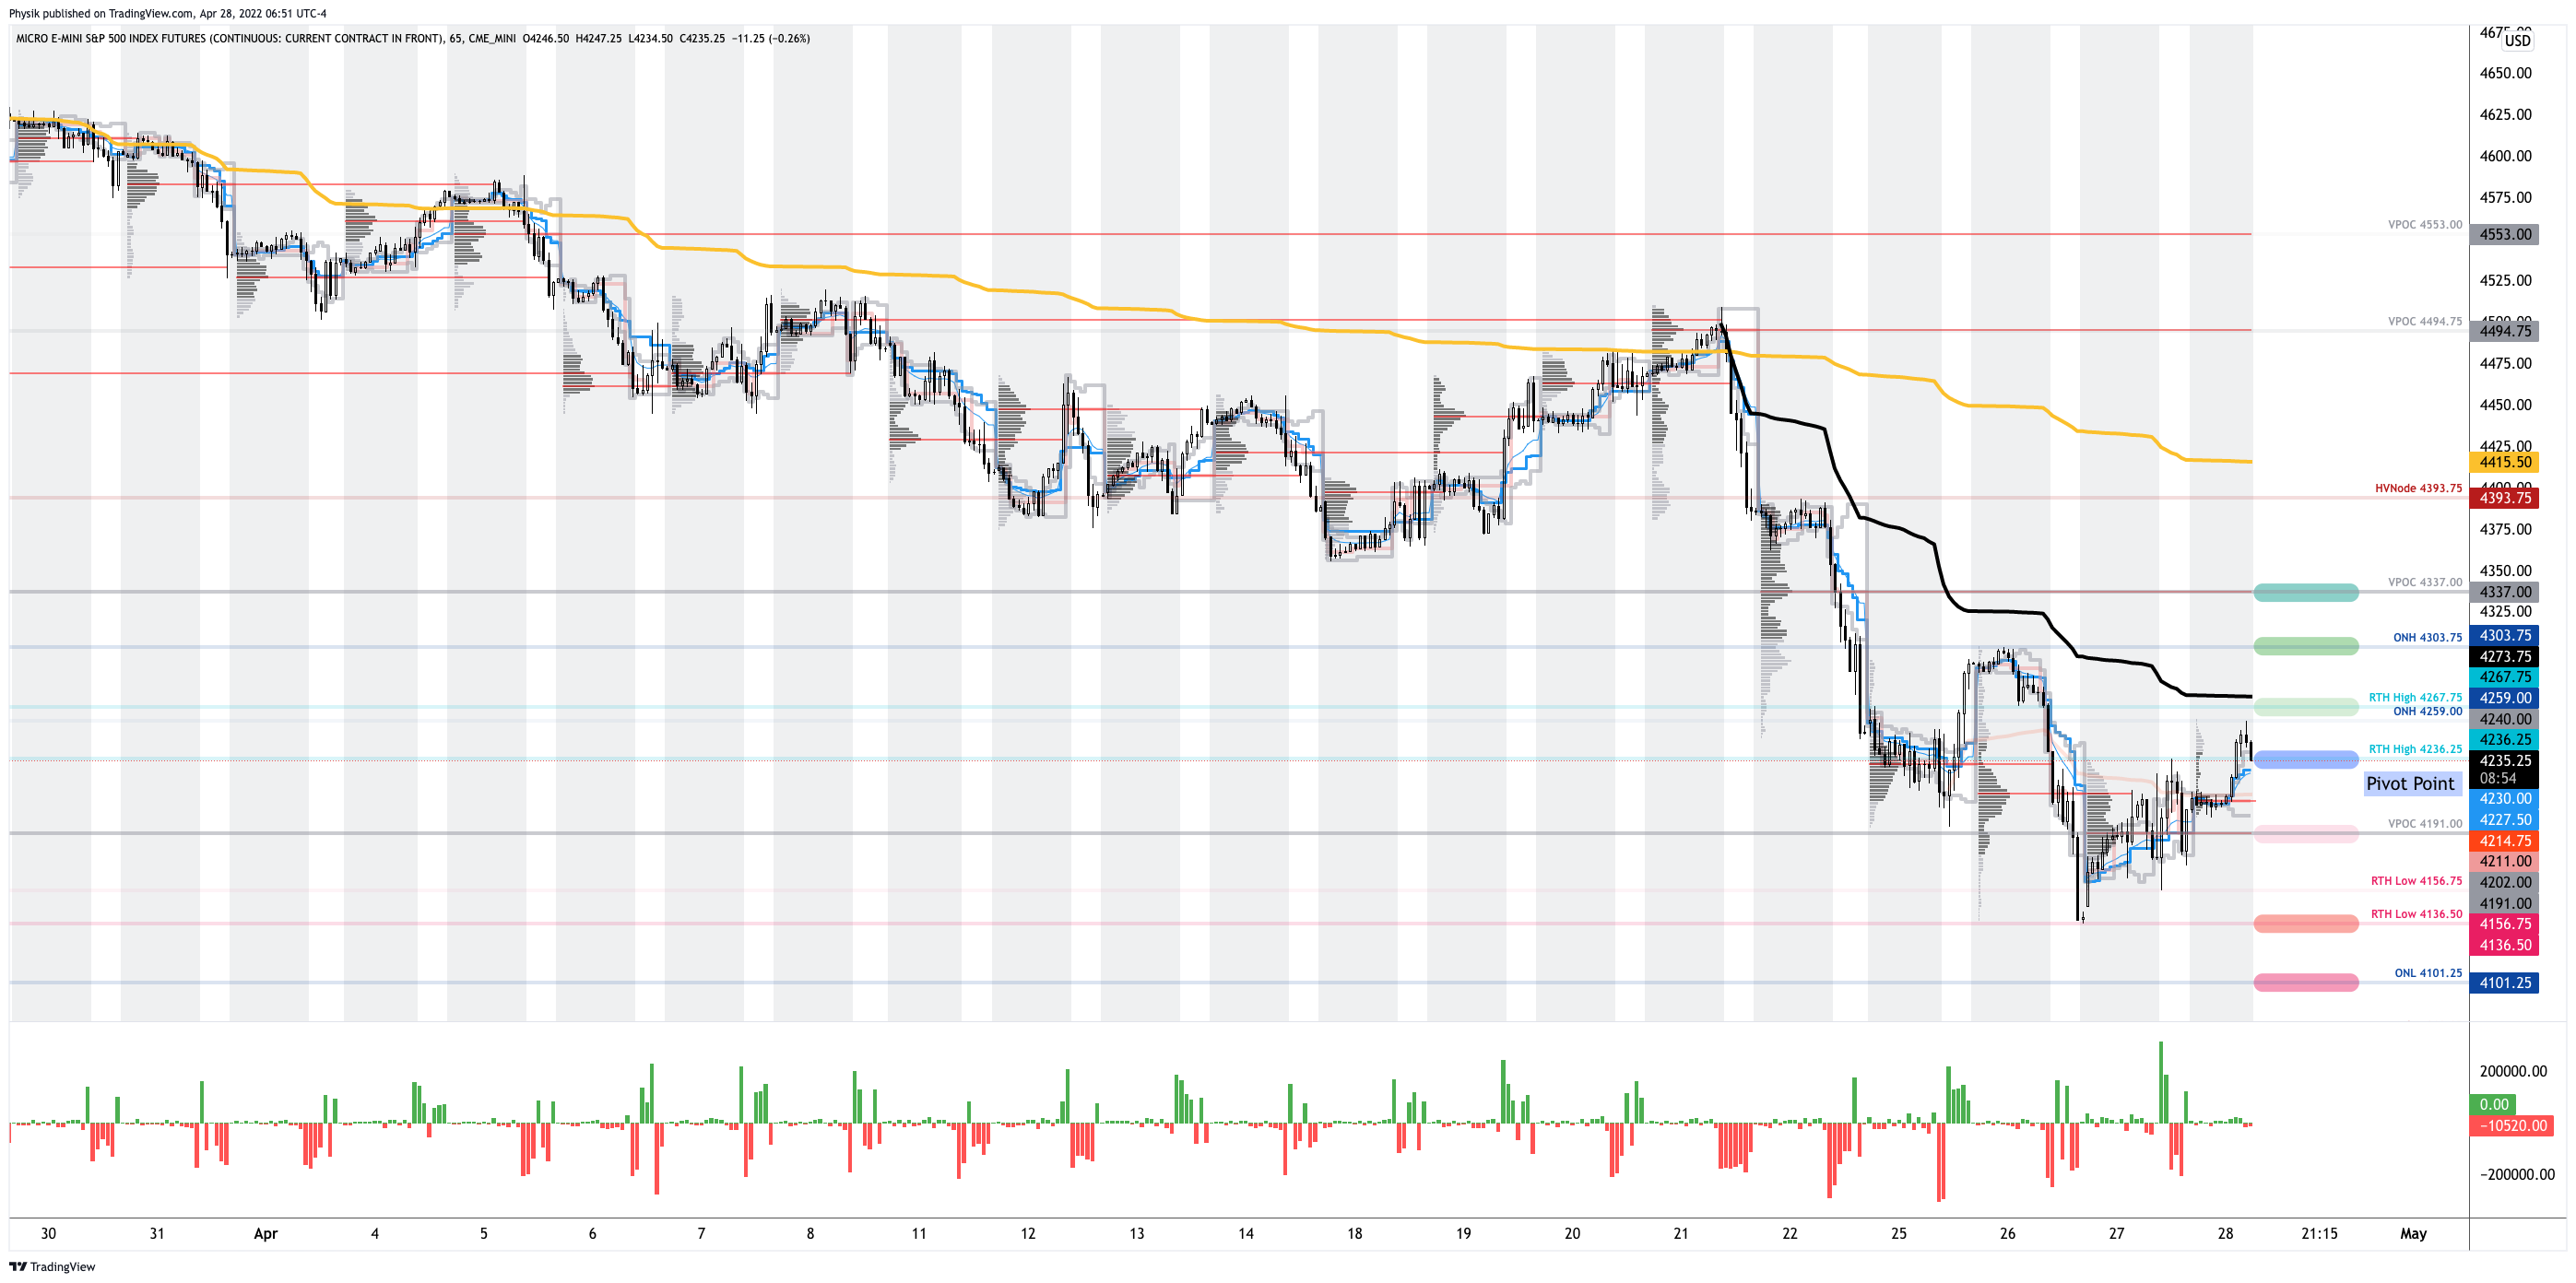
Technical: As of 7:00 AM ET, Thursday’s regular session (9:30 AM – 4:00 PM ET), in the S&P 500, will likely open in the middle part of a positively skewed overnight inventory, just inside of prior-range and -value, suggesting a limited potential for immediate directional opportunity.

In the best case, the S&P 500 trades higher; activity above the $4,236.25 regular trade high (RTH High) puts in play the $4,267.75 RTH High. Initiative trade beyond the $4,267.75 RTH High could reach as high as the $4,303.75 overnight high (ONH) and $4,337.00 untested point of control (VPOC), or higher.

In the worst case, the S&P 500 trades lower; activity below the $4,236.25 RTH High puts in play the $4,191.00 VPOC. Initiative trade beyond the VPOC could reach as low as the $4,136.00 regular trade low (RTH Low) and $4,101.25 overnight low (ONL), or lower.

Click here to load today’s key levels into the web-based TradingView charting platform. Note that all levels are derived using the 65-minute timeframe. New links are produced, daily.
Graphic: 65-minute profile chart of the Micro E-mini S&P 500 Futures.

Considerations: Markets are higher after testing some key levels outlined in prior letters.

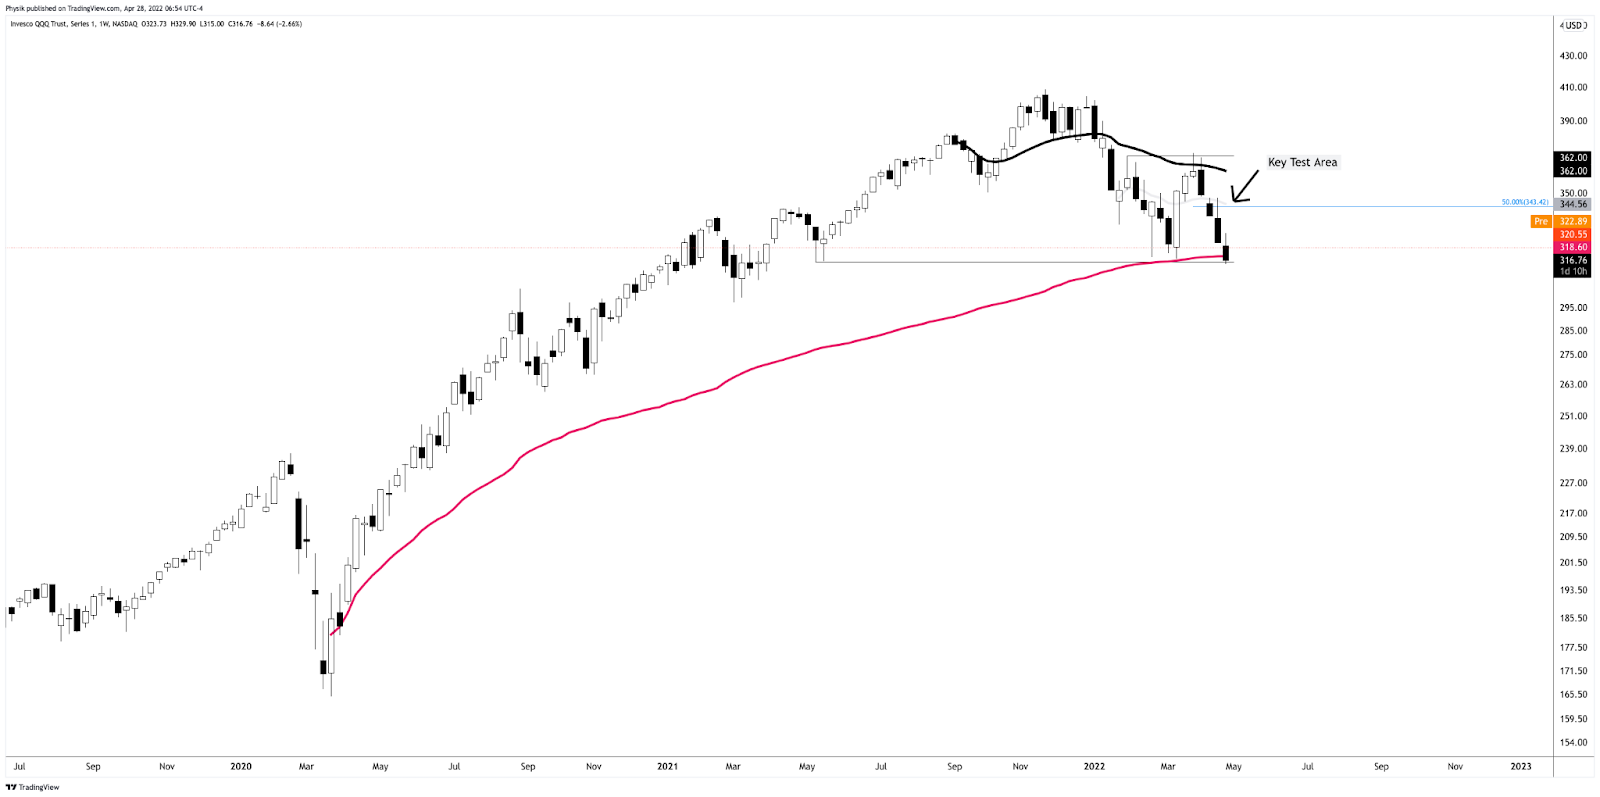
The Invesco QQQ Trust Series 1 (NASDAQ: QQQ), one of the weakest products this letter monitors, just tested a major VWAP, yesterday, anchored from the lows of March 2020. 

Graphic: Invesco QQQ Trust Series 1 (NASDAQ: QQQ) with anchored VWAPs.

The Nasdaq has led the market down. It may lead the market higher on reversals. We’ll continue to monitor market breadth, among other metrics, for signs of strength.

Definitions

Overnight Rally Highs (Lows): Typically, there is a low historical probability associated with overnight rally-highs (lows) ending the upside (downside) discovery process.

Volume Areas: A structurally sound market will build on areas of high volume (HVNodes). Should the market trend for long periods of time, it will lack sound structure, identified as low volume areas (LVNodes). LVNodes denote directional conviction and ought to offer support on any test. 

If participants were to auction and find acceptance into areas of prior low volume (LVNodes), then future discovery ought to be volatile and quick as participants look to HVNodes for favorable entry or exit.

Gamma: Gamma is the sensitivity of an option to changes in the underlying price. Dealers that take the other side of options trades hedge their exposure to risk by buying and selling the underlying. When dealers are short-gamma, they hedge by buying into strength and selling into weakness. When dealers are long-gamma, they hedge by selling into strength and buying into weakness. The former exacerbates volatility. The latter calms volatility.

Vanna: The rate at which the delta of an option changes with respect to volatility.

Charm: The rate at which the delta of an option changes with respect to time.

POCs: POCs are valuable as they denote areas where two-sided trade was most prevalent in a prior day session. Participants will respond to future tests of value as they offer favorable entry and exit.

Volume-Weighted Average Prices (VWAPs): A metric highly regarded by chief investment officers, among other participants, for quality of trade. Additionally, liquidity algorithms are benchmarked and programmed to buy and sell around VWAPs.

About

After years of self-education, strategy development, mentorship, and trial-and-error, Renato Leonard Capelj began trading full-time and founded Physik Invest to detail his methods, research, and performance in the markets.

Capelj also develops insights around impactful options market dynamics at SpotGamma and is a Benzinga reporter.

Some of his works include conversations with ARK Invest’s Catherine Wood, investors Kevin O’Leary and John Chambers, FTX’s Sam Bankman-Fried, Kai Volatility’s Cem Karsan, The Ambrus Group’s Kris Sidial, among many others.

Disclaimer

In no way should the materials herein be construed as advice. Derivatives carry a substantial risk of loss. All content is for informational purposes only.

Categories
Commentary

Daily Brief For March 17, 2022

Editor’s Note: The Daily Brief is a free glimpse into the prevailing fundamental and technical drivers of U.S. equity market products. Join the 200+ that read this report daily, below!

What Happened

Overnight, equity index futures took back part of Wednesday’s advance after the Federal Open Market Committee (FOMC) made the decision to tighten, albeit at a more aggressive pace than previously expected.

Moreover, according to some reports, last night’s decline comes as the Kremlin rejected claims that Ukraine peace talks were making progress. Subsequently, most commodity products rose.

Ahead is data on jobless claims, building permits, housing starts, and the Philadelphia Fed manufacturing survey (8:30 AM ET). Later, participants receive data on industrial production and capacity utilization (9:15 AM ET).

Graphic updated 6:40 AM ET. Sentiment Neutral if expected /ES open is inside of the prior day’s range. /ES levels are derived from the profile graphic at the bottom of the following section. Levels may have changed since initially quoted; click here for the latest levels. SqueezeMetrics Dark Pool Index (DIX) and Gamma (GEX) calculations are based on where the prior day’s reading falls with respect to the MAX and MIN of all occurrences available. A higher DIX is bullish. At the same time, the lower the GEX, the more (expected) volatility. Learn the implications of volatility, direction, and moneyness. SHIFT data used for S&P 500 (INDEX: SPX) options activity. Note that options flow is sorted by the call premium spent; if more positive, then more was spent on call options. Breadth reflects a reading of the prior day’s NYSE Advance/Decline indicator. VIX reflects a current reading of the CBOE Volatility Index (INDEX: VIX) from 0-100.

What To Expect

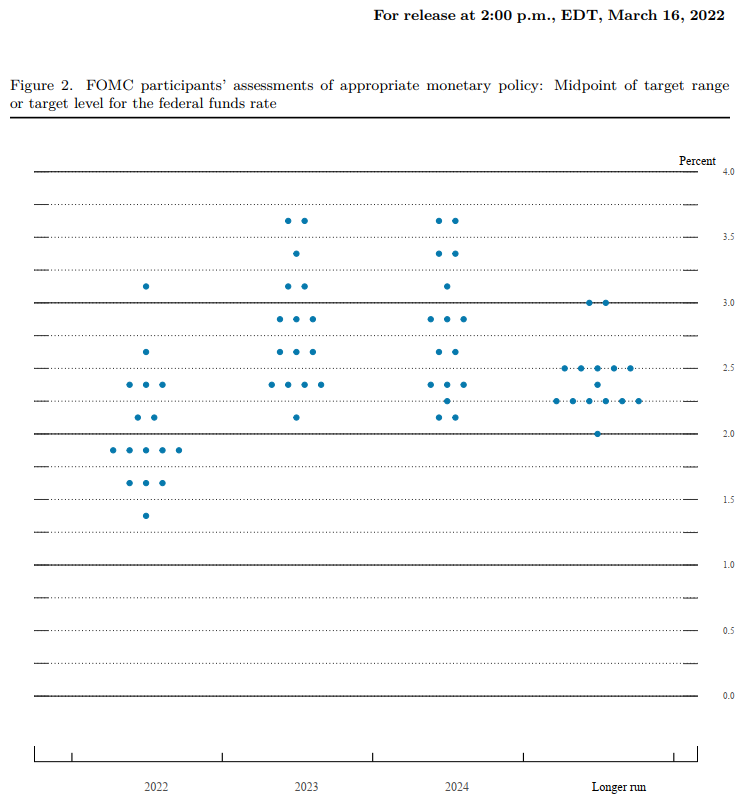
Fundamental: In the face of a strong economy (at home) plagued by supply and demand imbalances, as well as geopolitical tensions and economic turmoil (abroad), the Federal Reserve (Fed) raised borrowing costs by a quarter percentage point and signaled six more in 2022 putting the policy rate at ~2.8% before 2024.

Graphic: Via Bloomberg. The Fed’s updated dot plot.

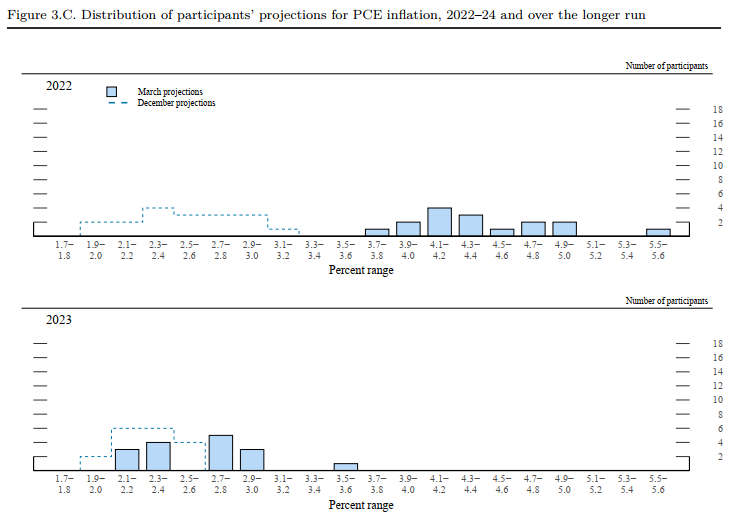
Bloomberg’s John Authers explains well what transpired. Essentially, not one FOMC member thought rates would exceed 2.25% by the end of 2023. Now, most members think rates may need to go as high as 3.75% to help rein in inflation and promote price stability.

“In addition to giving up on ‘lower for longer’ rates, the Fed also seems to be capitulating on its forecasts for inflation to come under control relatively swiftly,” Authers explains. 

“There is no consensus. That is alarming, and prompted some to fear that the Fed was admitting it didn’t know what was going on.”

Graphic: Via Bloomberg. “This chart shows how expectations for inflation at the end of this year and next have moved between the two [FOMC] meetings.”

Ultimately, the FOMC thinks inflation will return to their 2% long-term target, and the fed funds rate may top out at 2.4%, “the lowest projection for long-term rates on record.”

In terms of asset purchases, the FOMC will have an updated quantitative tightening (QT) schedule as soon as May.

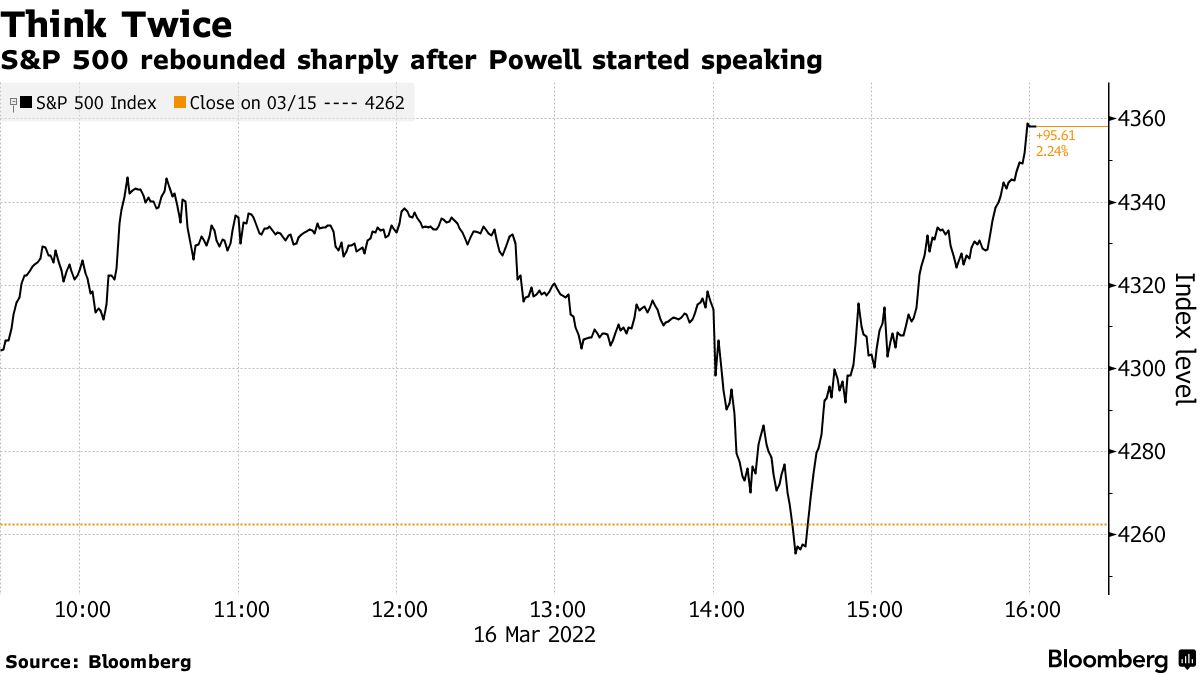
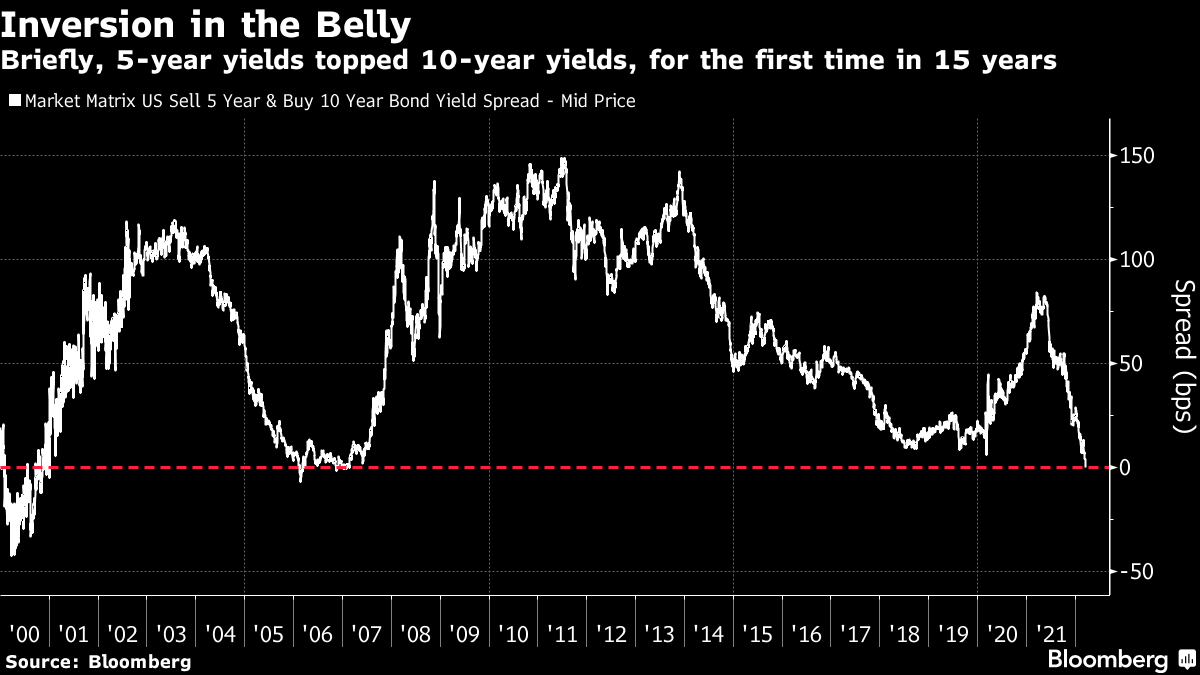
After the announcement, the U.S. equity market closed higher while 5-year yields topped 10-year yields for the first time in 15 years.

Graphic: Via Bloomberg. Stocks rise after the Fed’s Powell started speaking. “Jobs are stronger than ever. The unemployment rate is lower than pre-Covid, basically. Consumer spending is quite healthy. Consumer savings remains at all-time highs at $2.7 trillion,” said Sylvia Jablonski, CEO and CIO of Defiance ETFs. “It’s really hard to think about how we would go into a recession.”

“It was the first time this relationship had inverted since early 2007, shortly before the beginning of the credit crisis,” Authers explained in statements as to the factors that may lead to the Fed abandoning its tightening schedule. 

Graphic: Via Bloomberg. “Whenever the yield curve inverts, it tends to function as an early warning for a recession, suggesting that in the medium-term rates will have to fall.”

“Any inversion is a worrying sign, although one between five and 10 years, in the so-called ‘belly’ of the curve, is not as alarming as an inversion between three-month or two-year yields and the 10-year yield.”

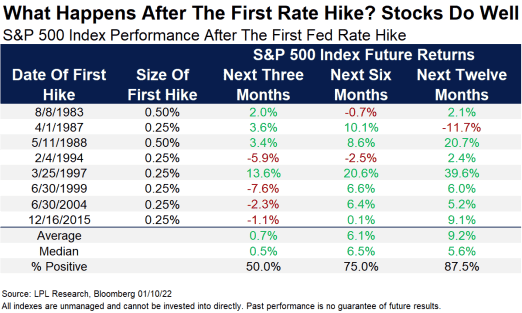
Moreover, according to stats compiled by LPL Research, stocks tend to do well after the Fed starts hiking rates.

Graphic: Via LPL Research

“Fed rate hikes usually happen near the middle of the economic cycle, with potentially years left of gains in stocks and the economy,” explained LPL Financial’s Ryan Detrick. 

“In fact, a year after the first hike in a cycle has been fairly strong, higher a year later the past six times.”

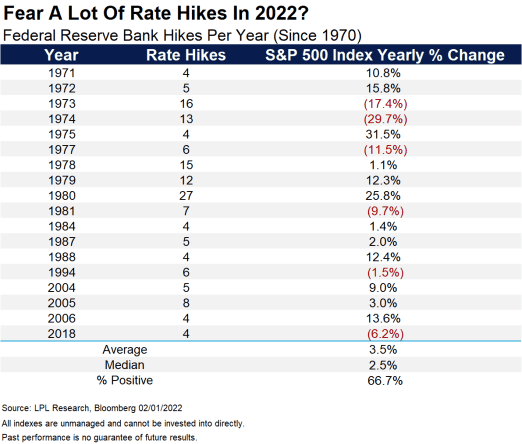
Graphic: Via LPL Research. “Lastly, here’s how stocks have done in years with a lot of rate hikes. The mid-2000s cycle is what has our attention, as there were 17 total rate hikes in 2004, 2005, and 2006, yet the S&P 500 managed to gain in every year.”

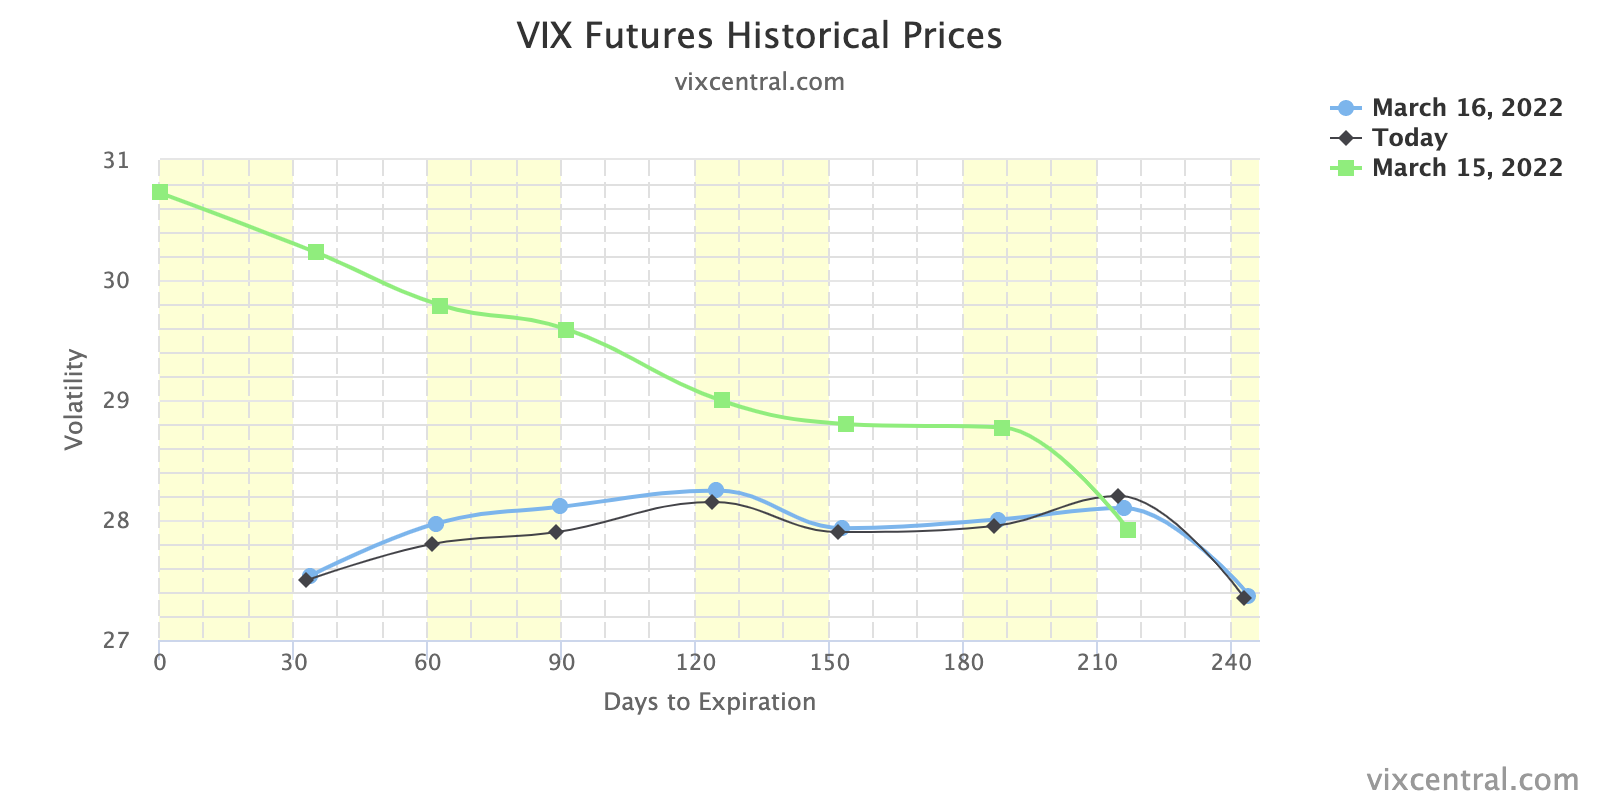
Positioning: Implied volatility metrics compressed markedly, yesterday, and this bolstered a near-vertical price rise in the equity market, as suggested would happen in past letters.

Graphic: Implied volatility term structure shifts inward. This solicits positive hedging (vanna) flows as counterparty exposure to positive delta declines. In other words, short stock and futures hedges (against options) are bought back.

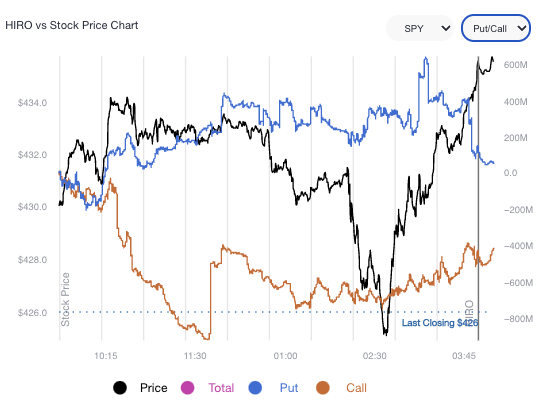
Checking out SpotGamma’s Hedging Impact of Real-Time Options (HIRO) indicator, we see little commitment by S&P 500 participants in this rally. Instead, the response was quite neutral.

Graphic: SpotGamma’s Hedging Impact of Real-Time Options (HIRO) indicator.

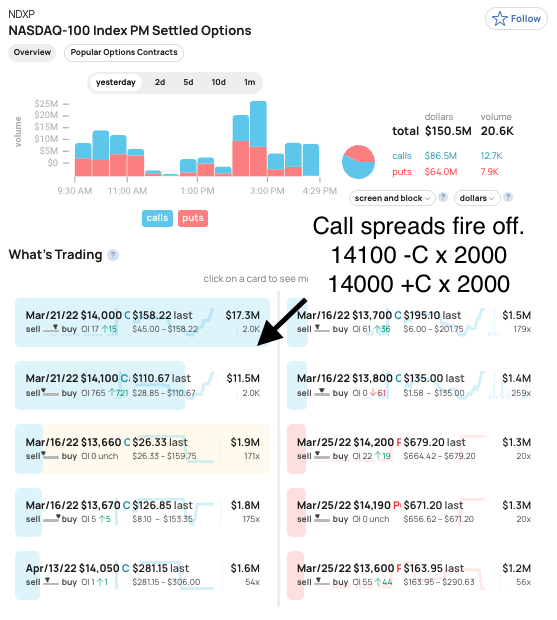
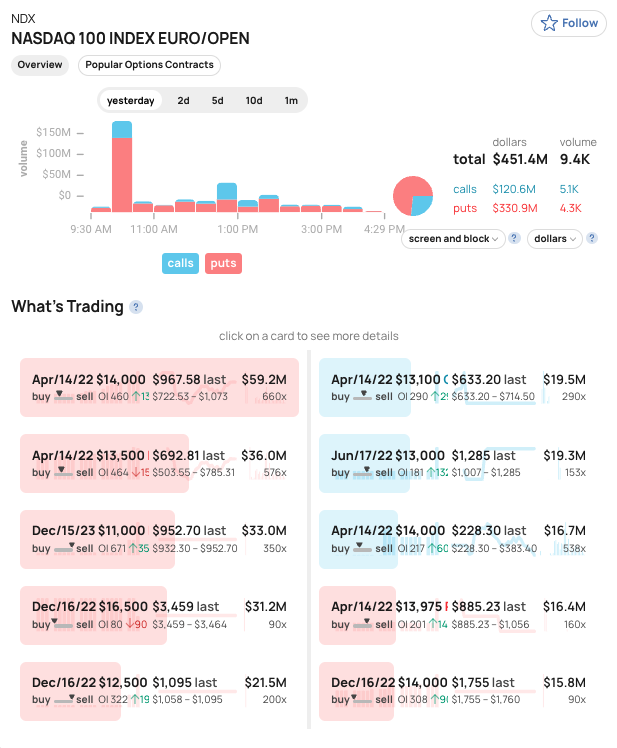
Taking a look at some of the cash-settled indexes, like the growth- and tech-heavy Nasdaq 100 (INDEX: NDX), there was some notable buying of call spreads (i.e., positions that make money if the underlying moves higher, all else equal), though.

Graphic: Via SHIFT. Notice the duration of the spread. Though this may have been a new trade, one must not discount the potential for it to have been a closing trade. In either case, there is potential that the de-rate in the tech and growth areas of the market has played its course.

“Moreover, heading into Wednesday’s FOMC, we saw the market well-hedged,” SpotGamma explained. “Participants’ demand for protection is concentrated in options with little time to expiry (given the monthly options expiration and roll-off a significant size of S&P delta).”

“Adding, the compression of volatility today, coupled with trade higher, solicits less counterparty hedging of put protection … [and] less positive delta = less selling to hedge = less pressure.”

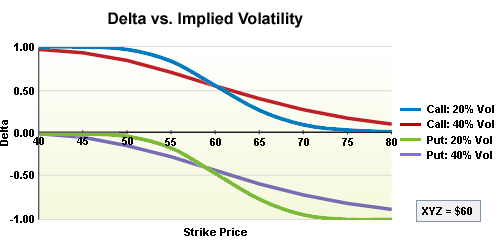
Graphic: Via SpotGamma. “For education only. As implied volatility falls, options delta falls. This solicits positive delta hedging flows (with respect to volatility) or vanna.”

Ultimately, this post-FOMC price rise may put the market in an underhedged position. In such a case, as talked about yesterday, new demand for protection would add fuel to weakness (later).

Regardless, comparing buying and options positioning metrics, the returns distribution remains skewed positive (albeit much less so than before).

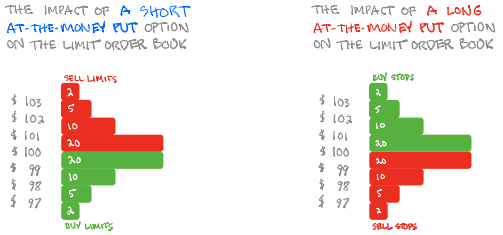
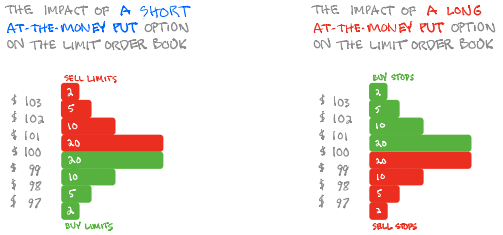
Graphic: SqueezeMetrics details the implications of customer activity in the options market, on the underlying’s order book. For instance, in selling a put, customers add liquidity and stabilize the market. How? The market maker long the put will buy (sell) the underlying to neutralize directional risk as price falls (rises).

Technical: As of 6:30 AM ET, Thursday’s regular session (9:30 AM – 4:00 PM ET), in the S&P 500, will likely open in the middle-to-lower part of a negatively skewed overnight inventory, inside of prior-range and -value, suggesting a limited potential for immediate directional opportunity.

Spike Scenarios In Play: Spikes mark the beginning of a break from value. Spikes higher (lower) are validated by trade at or above (below) the spike base (i.e., the origin of the spike).

In the best case, the S&P 500 trades higher; activity above the $4,339.50 spike base puts in play the $4,375.00 untested point of control (VPOC). Initiative trade beyond the VPOC could reach as high as the $4,395.25 high volume area (HVNode) and $4,418.75 overnight high (ONH), or higher.

In the worst case, the S&P 500 trades lower; activity below the $4,339.50 spike base puts in play the $4,314.75 HVNode. Initiative trade beyond the $4,314.75 could reach as low as the $4,285.25 HVNode and $4,249.25 low volume area (LVNode), or lower.

Considerations: Push-and-pull, as well as responsiveness near key-technical areas (that are discernable visually on a chart), suggests technically-driven traders with short time horizons are very active. 

Such traders often lack the wherewithal to defend retests and, additionally, the type of trade may be indicative of the other time frame participants waiting for more information to initiate trades.

Click here to load today’s key levels into the web-based TradingView charting platform. Note that all levels are derived using the 65-minute timeframe. New links are produced, daily.
Graphic: 65-minute profile chart of the Micro E-mini S&P 500 Futures.

Definitions

Overnight Rally Highs (Lows): Typically, there is a low historical probability associated with overnight rally-highs (lows) ending the upside (downside) discovery process.

Volume Areas: A structurally sound market will build on areas of high volume (HVNodes). Should the market trend for long periods of time, it will lack sound structure, identified as low volume areas (LVNodes). LVNodes denote directional conviction and ought to offer support on any test. 

If participants were to auction and find acceptance into areas of prior low volume (LVNodes), then future discovery ought to be volatile and quick as participants look to HVNodes for favorable entry or exit.

POCs: POCs are valuable as they denote areas where two-sided trade was most prevalent in a prior day session. Participants will respond to future tests of value as they offer favorable entry and exit.

About

After years of self-education, strategy development, mentorship, and trial-and-error, Renato Leonard Capelj began trading full-time and founded Physik Invest to detail his methods, research, and performance in the markets.

Capelj is also a Benzinga finance and technology reporter interviewing the likes of Shark Tank’s Kevin O’Leary, JC2 Ventures’ John Chambers, FTX’s Sam Bankman-Fried, and ARK Invest’s Catherine Wood, as well as a SpotGamma contributor developing insights around impactful options market dynamics. 

Disclaimer

Physik Invest does not carry the right to provide advice.

In no way should the materials herein be construed as advice. Derivatives carry a substantial risk of loss. All content is for informational purposes only.

Categories
Commentary

Daily Brief For March 9, 2022

Editor’s Note: The Daily Brief is a free glimpse into the prevailing fundamental and technical drivers of U.S. equity market products. Join the 200+ that read this report daily, below!

What Happened

Overnight, equity index futures, led by the tech- and growth-heavy Nasdaq 100 auctioned higher. This is immediately after a session characterized by rampant, two-way volatility. 

Much of the action in the equity indices and commodity markets is headline-driven. 

For instance, at one point, alongside news that Ukraine would no longer insist on NATO membership, the S&P 500 auctioned higher nearly 3%. Thereafter, responsive selling at a very key technical level preceded the index’s over 3% drop shortly after.

This push-and-pull, as well as responsiveness near key-technical areas (that are discernable visually on a chart), suggests technically-driven traders with short time horizons are very active. 

Such traders often lack the wherewithal to defend retests and, additionally, the type of trade may be indicative of the other time frame participants waiting for more information to initiate trades.

Ahead is data on job openings and quits (10:00 AM ET).

Graphic updated 6:45 AM ET. Sentiment Neutral if expected /ES open is inside of the prior day’s range. /ES levels are derived from the profile graphic at the bottom of the following section. Levels may have changed since initially quoted; click here for the latest levels. SqueezeMetrics Dark Pool Index (DIX) and Gamma (GEX) calculations are based on where the prior day’s reading falls with respect to the MAX and MIN of all occurrences available. A higher DIX is bullish. At the same time, the lower the GEX, the more (expected) volatility. Learn the implications of volatility, direction, and moneyness. SHIFT data used for S&P 500 (INDEX: SPX) options activity. Note that options flow is sorted by the call premium spent; if more positive, then more was spent on call options. Breadth reflects a reading of the prior day’s NYSE Advance/Decline indicator. VIX reflects a current reading of the CBOE Volatility Index (INDEX: VIX) from 0-100.

What To Expect

Fundamental: The prevailing narrative is concerned with the slowdown in economic growth, the intent to withdraw monetary stimulus, and the response to Russia’s invasion of Ukraine.

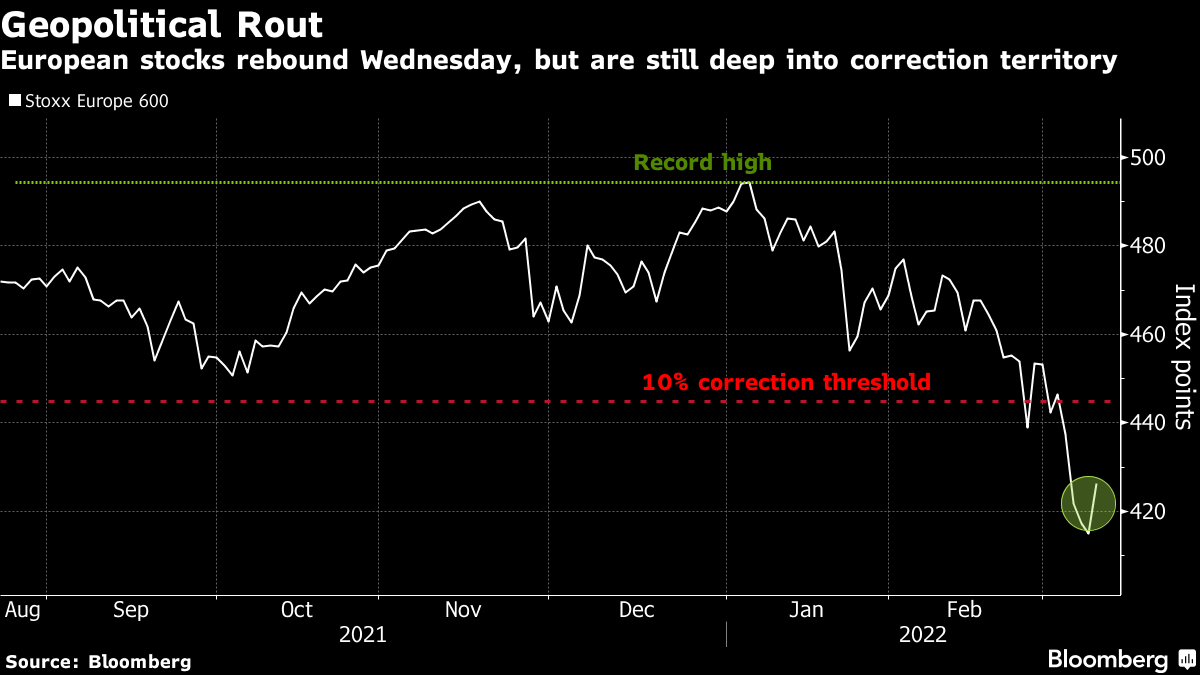
Graphic: Bloomberg. U.S. equity indexes spared of recent bloodshed, abroad.

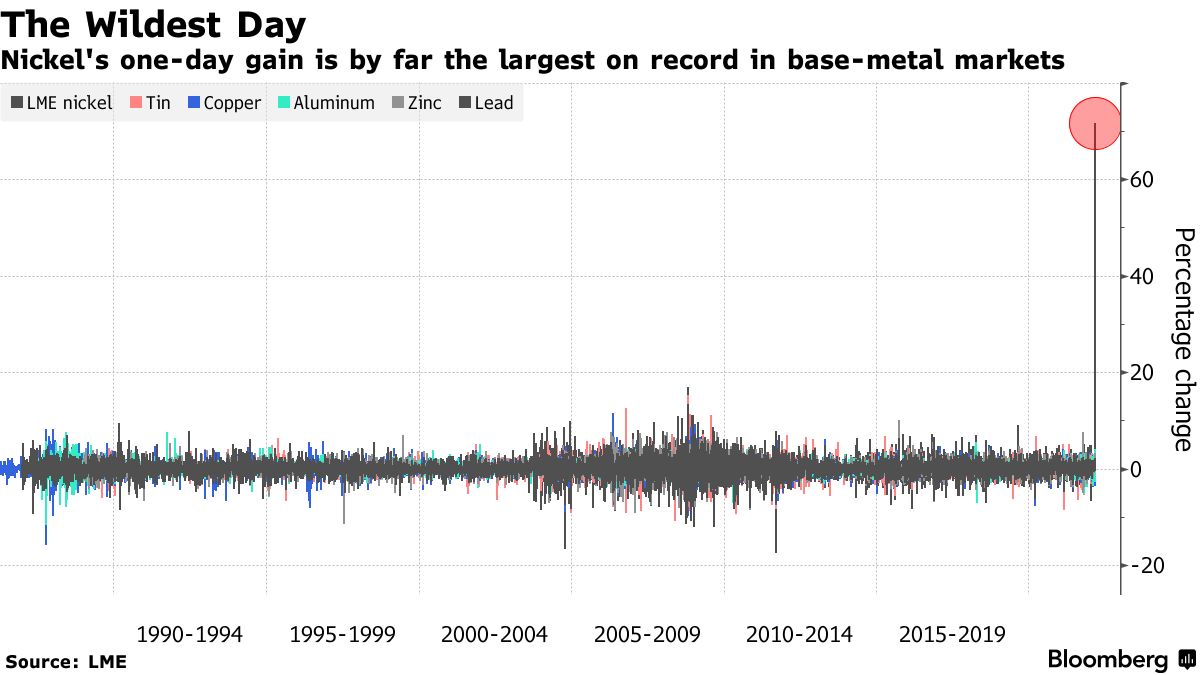
Pursuant to the response to Russia’s invasion of Ukraine has been a disruption in supply chains; commodities, like oil and nickel, have risen and that has inflation and growth impacts.

Graphic: Via Bloomberg, Oxford Economics. “The war in Ukraine is making it harder and more costly for goods to move freely across the globe. Key shipping routes are blocked, and others are feeling ripple effects from the conflict.”

In the coming days and weeks, central banks will announce their monetary policy decisions. Per Bloomberg, commodity costs underline the inflation challenge to the Federal Reserve.

Graphic: Via Bloomberg. The historical analogy is different but close (as today’s economy is less dependent on oil); the “Fed responded to the [1973] shock, and to the growing wave of inflation that preceded it, with a massive tightening.”

With breakevens on 30-year inflation-linked Treasuries – an indicator of the pace of price gains over three decades – climbing to their highest level, the Fed is expected to hike rates 25 bps.

Graphic: Via CME Group Inc (NASDAQ: CME). Participants price in an increased probability of a shift in the target rate. Click here to access the FedWatch Tool.

In the past days, there have been a variety of takes on what’s going on. A pessimistic, yet, interesting take is offered by Credit Suisse Group AG’s (NYSE: CS) Zoltan Pozsar.

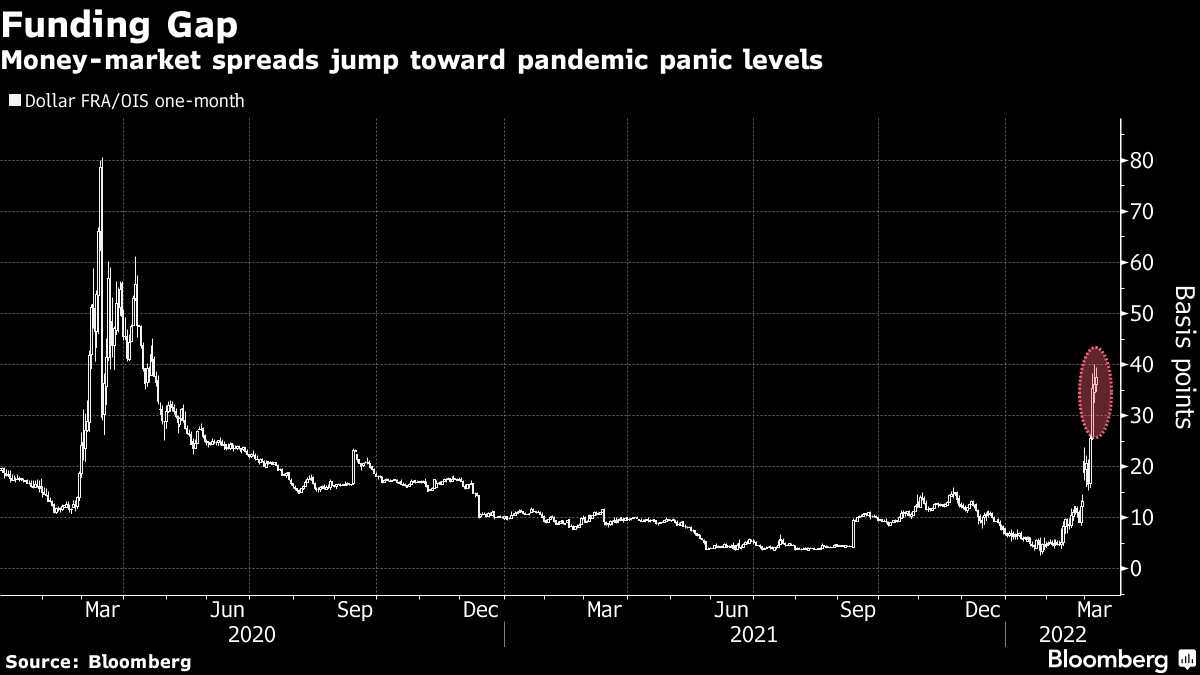
Mainly, there is a commodity crisis. Commodities are collateral and collateral is money.

Graphic: Via Bloomberg. The “FRA/OIS, a key gauge of interbank funding risk, as of the close on Monday.” Click here to listen to Zoltan Pozsar’s Bloomberg conversation on Russia, Gold, and the U.S. dollar.

“[E]very crisis occurs at the intersection of funding and collateral markets and that, in the presently unfolding crisis, commodities are collateral, and more precisely, Russian commodities are like subprime collateral and all other stuff is prime.”

Pozsar explains that instability in commodity prices feeds into financial instability as margin calls trigger the failure of commodity traders and (potentially) commodity exchanges.

Graphic: Via Bloomberg. Commodity price rises solicit margin calls.

“Again, commodity correlations are at 1, which is never a good thing,” he says. “The Fed and other central banks will be able to provide liquidity backstops, … but those will be Band-Aid solutions.”

Liquidity is the manifestation of a larger problem – the Russian-non-Russian commodities basis – and its resolve portends a “regime shift” which Pozsar posits China will be at the front of.

“When this crisis (and war) is over, the U.S. dollar should be much weaker and, on the flip side, the renminbi much stronger, backed by a basket of commodities.”

MUFG Securities’ (NYSE: MUFG) George Goncalves makes a similar point, drawing parallels to the early days of 2008. 

“The situation in Europe is precarious enough on its own, but if conditions worsen in a highly connected financial system, balance sheets may get curtailed via haircuts,” Concalves wrote

“Meanwhile there is an eerily similar pattern to the current action in [short-term interest rates] and oil prices to the early summer of 2008. Recall, in response to inflation and central bank hawkishness, markets priced in nearly 150bps in hikes in 2008 before GFC cracked.”

Positioning: Based on metrics often quoted in this morning letter, buying support appears to be cooling. Overlaying options positioning metrics, the returns distribution is skewed positive, still.

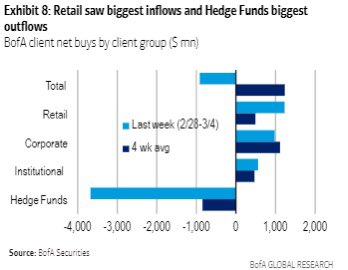
This is in opposition to some of the reporting by large outlets. The narrative is along the lines of institutional investors offloading equities to retail.

Graphic: Via Bank of America Corporation (NYSE: BAC).

According to statements by The Ambrus Group’s Kris Sidial, “This is partially a byproduct of the long equity firms that have programs that are designed to exit when Cboe Volatility Index (INDEX: VIX) gets over a certain level and equities drop under a certain percentage.”

Graphic: Via Pat Hennessy. “ES goes +2%, -2%, +3%, -3% in 14 hours! Yes – the close/close move was weak, but the intraday moves were massive – IMO enough to support a 37 VIX. Strange to see vols so soft given intraday realized + close on lows.”

“There is no doubt about it that we have noticed heavier institutional flow throughout the day over the last two weeks. However, there are still large institutions that are putting cash to work in equities. Ironically a rotation out of some European equities into U.S., [and] there is also a good amount of buyback flow that is projected to hit some areas in U.S equities.

Pursuant to remarks in the fundamental section (and Sidial’s note on the heavier institutional flow), we saw some noteworthy put buying in products like the cash-settled Nasdaq 100 (INDEX: NDX) and iShares iBoxx $ Inv Grade Corporate Bond ETF (NYSE: LQD).

Graphic: Via SHIFT. Buying closer strikes. Selling farther strikes.

Whether these are hedges, the replacement of existing linear short positions, or speculation on the downside, it all plays into this negative gamma environment markets are in.

When customers demand downside (put) protection (a negative delta, positive gamma trade that has its gains multiplied to the downside), counterparties sell underlying futures and stock to hedge their positive delta, negative gamma trade which has the effect of pressuring markets.

The compression of volatility (via passage of FOMC) or removal of counterparty negative exposure (via OPEX) may serve to alleviate some of this pressure. Until then, participants can expect the options landscape to add to market volatility.

Technical: As of 6:45 AM ET, Wednesday’s regular session (9:30 AM – 4:00 PM ET), in the S&P 500, will likely open in the upper part of a positively skewed overnight inventory, inside of prior-range and -value, suggesting a limited potential for immediate directional opportunity.

In the best case, the S&P 500 trades higher; activity above the $4,248.25 overnight high (ONH) puts in play the $4,285.50 high volume area (HVNode). Initiative trade beyond the HVNode could reach as high as the $4,319.00 untested point of control (VPOC) and $4,346.75 high volume area (HVNode), or higher.

In the worst case, the S&P 500 trades lower; activity below the $4,248.25 ONH puts in play the $4,227.75 HVNode. Initiative trade beyond the $4,227.75 HVNode could reach as low as the $4,177.25 HVNode and $4,138.75 ONL, or lower.

Click here to load today’s key levels into the web-based TradingView charting platform. Note that all levels are derived using the 65-minute timeframe. New links are produced, daily.
Graphic: 65-minute profile chart of the Micro E-mini S&P 500 Futures.

Definitions

Overnight Rally Highs (Lows): Typically, there is a low historical probability associated with overnight rally-highs (lows) ending the upside (downside) discovery process.

Volume Areas: A structurally sound market will build on areas of high volume (HVNodes). Should the market trend for long periods of time, it will lack sound structure, identified as low volume areas (LVNodes). LVNodes denote directional conviction and ought to offer support on any test. 

If participants were to auction and find acceptance into areas of prior low volume (LVNodes), then future discovery ought to be volatile and quick as participants look to HVNodes for favorable entry or exit.

POCs: POCs are valuable as they denote areas where two-sided trade was most prevalent in a prior day session. Participants will respond to future tests of value as they offer favorable entry and exit.

About

After years of self-education, strategy development, mentorship, and trial-and-error, Renato Leonard Capelj began trading full-time and founded Physik Invest to detail his methods, research, and performance in the markets.

Capelj is also a Benzinga finance and technology reporter interviewing the likes of Shark Tank’s Kevin O’Leary, JC2 Ventures’ John Chambers, FTX’s Sam Bankman-Fried, and ARK Invest’s Catherine Wood, as well as a SpotGamma contributor developing insights around impactful options market dynamics.

Disclaimer

Physik Invest does not carry the right to provide advice.

In no way should the materials herein be construed as advice. Derivatives carry a substantial risk of loss. All content is for informational purposes only.
Categories
Commentary

Daily Brief For February 9, 2022

Editor’s Note: The Daily Brief is a free glimpse into the prevailing fundamental and technical drivers of U.S. equity market products. Join the 200+ that read this report daily, below!

What Happened

Overnight, equity index futures broke the confines of tight consolidation. 

As stated some commentaries ago, the odds pointed to a continued counter-trend rally; volatility compression, coupled with metrics that point to buying support, was to bolster follow-through.

Ahead is data on Wholesale Inventories (10:00 AM ET), as well as Fed-speak by Governor Michelle Bowman (10:30 AM ET) and President Loretta Mester (12:00 PM ET).

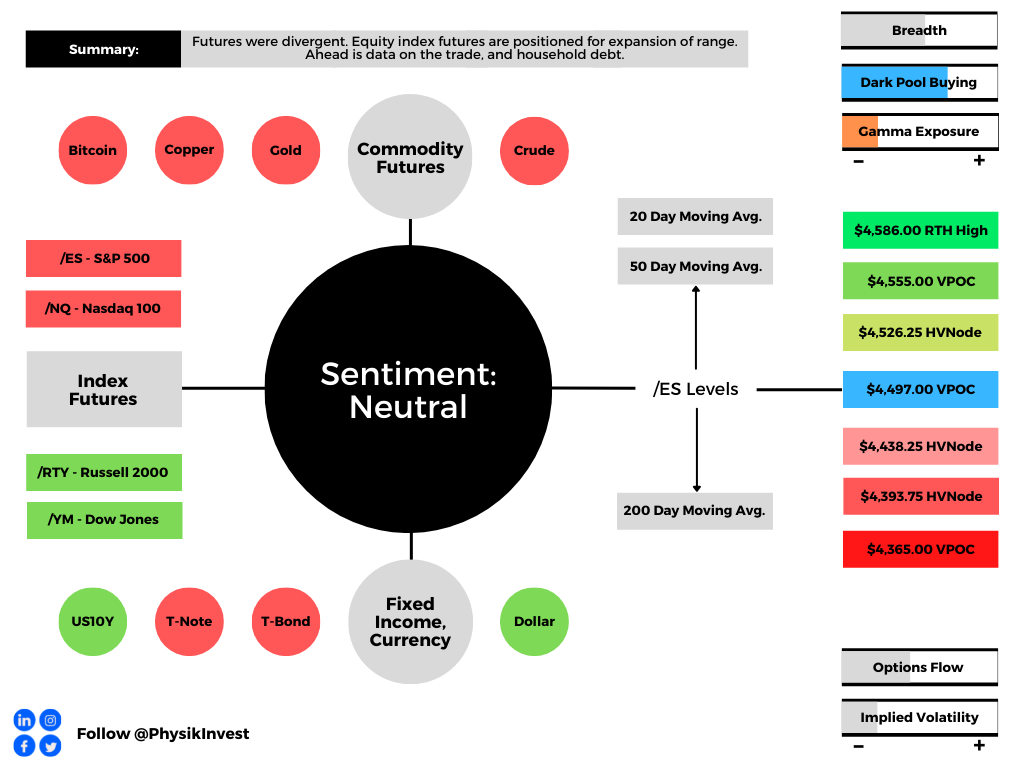
Graphic updated 6:30 AM ET. Sentiment Risk-On if expected /ES open is above the prior day’s range. /ES levels are derived from the profile graphic at the bottom of the following section. Levels may have changed since initially quoted; click here for the latest levels. SqueezeMetrics Dark Pool Index (DIX) and Gamma (GEX) calculations are based on where the prior day’s reading falls with respect to the MAX and MIN of all occurrences available. A higher DIX is bullish. At the same time, the lower the GEX, the more (expected) volatility. Learn the implications of volatility, direction, and moneyness. SHIFT data used for S&P 500 (INDEX: SPX) options activity. Note that options flow is sorted by the call premium spent; if more positive, then more was spent on call options. Breadth reflects a reading of the prior day’s NYSE Advance/Decline indicator. VIX reflects a current reading of the CBOE Volatility Index (INDEX: VIX) from 0-100.

What To Expect

Fundamental: Equity indices resolve higher in the face of hawkishness from the Federal Reserve (Fed) and data showing slowing growth at home and abroad.

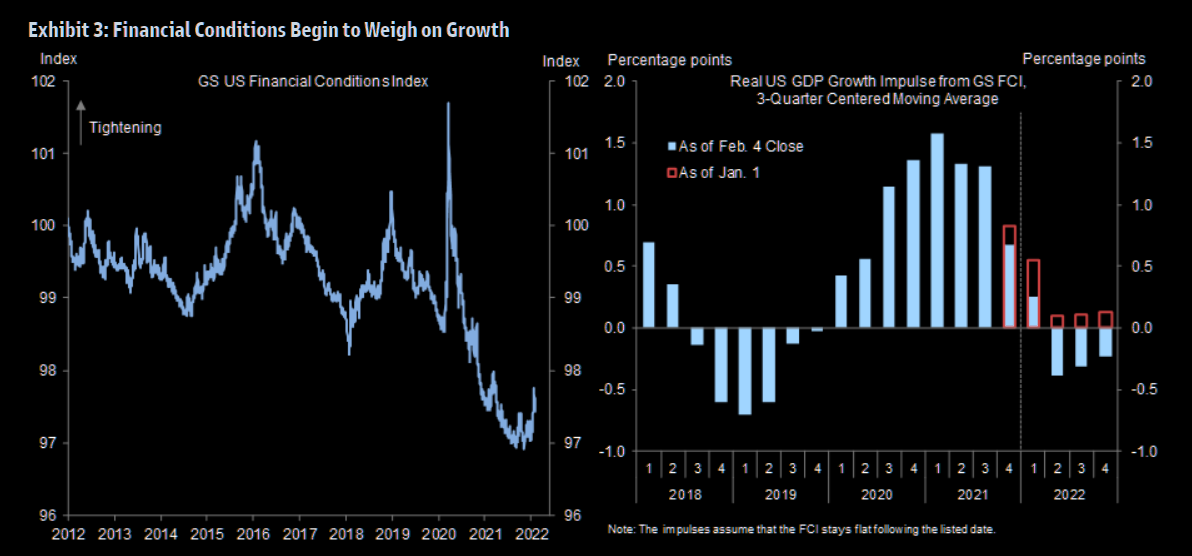
“Fiscal policy is turning more restrictive, the Q4 inventory boost is now behind us, and the financial conditions impulse will go from sharply positive in 2021 to (at least) modestly negative in 2022,” Goldman Sachs Group Inc (NYSE: GS) strategists explain. 

“For these reasons, our 2022 GDP forecast of 2¼% on a Q4/Q4 basis is 0.8pp below the latest Bloomberg consensus and 1.8pp below the FOMC’s last published forecast (as of the December meeting).”

Graphic: Via Goldman Sachs. Retrieved through The Market Ear.

At the same time, according to Moody’s Corporation (NYSE: MCO), the Fed has not pushed “against market expectations for three to four rate hikes this year.” 

Instead, Chair Jerome Powell “signaled the central bank will have zero tolerance for any upside surprises in inflation.”

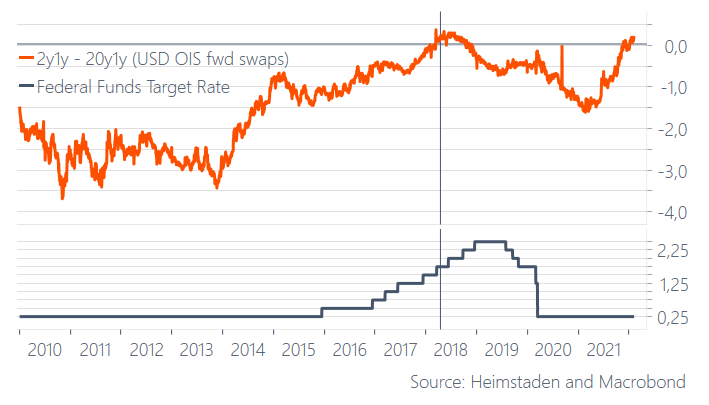
To note, though, the consensus expectation – five rate hikes or more – is ahead of itself, according to Andreas Steno Larsen of Heimstaden. 

“Direct transfers and fiscal deficits are behind the current inflation spikes,” he explains. “If they were the root causes of inflation, they will also turn into the root causes of disinflation again during H2-2022.”

Steno Larsen adds that the 20y1y and 2y1y curve is inverted, “as it was when the 2015-2018 hiking cycle was very mature,” and only three hikes occurred after inversion.

Graphic: “Good luck hiking 6-7 times this year, … 3-4 max,” via Steno Larsen

The net effect, according to Steno Larsen, is that long bond yields will likely not rise over the next quarters; rate-sensitive technology and innovation products may rebound while cyclical assets may suffer.

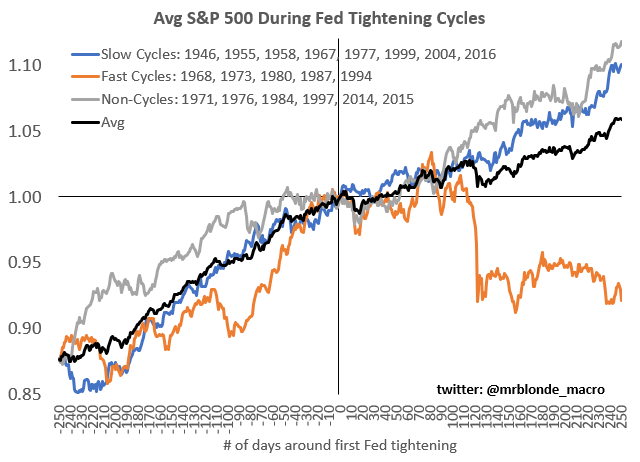
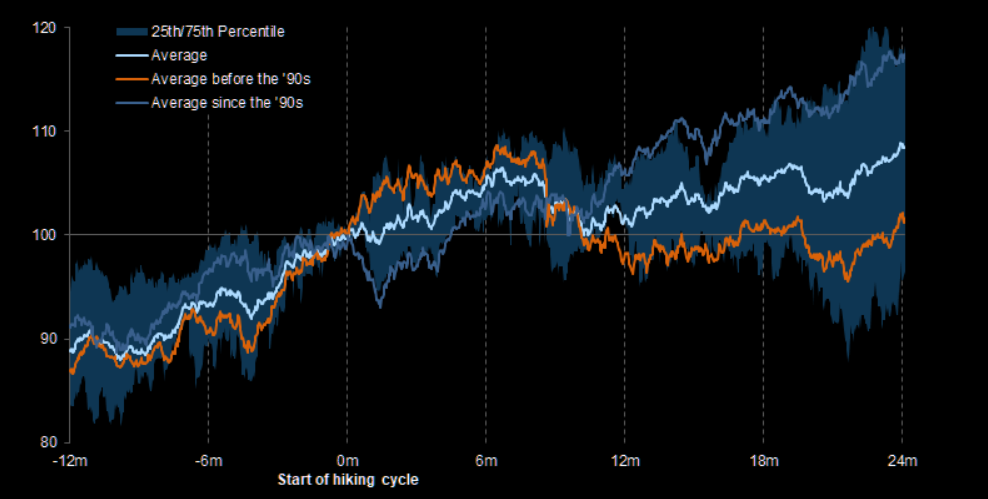
In line with the above comments is the average S&P 500 trend into Fed tightening cycles. 

Graphic: Retrieved from Callum Thomas’ Weekly S&P 500 ChartStorm newsletter.

Positioning: Ranges compressed as participants committed capital to bets on lower volatility.

Such bets (expressed via the selling of protection on both sides of the market) left counterparties warehousing the other side (long puts and calls). 

In hedging this exposure on a move higher, the counterparties increased +delta exposure is offset via the addition in -delta (sell futures)

In hedging this exposure on a move lower, the counterparties increased -delta exposure is offset via the addition of +delta (buy futures).

Moreover, as (1) participants continue to bet on lower ranges and (2) time and volatility trend to zero for the expiries most open interest is concentrated in, gamma, the sensitivity of options to changes in underlying price (delta) increases. 

What that means is that counterparties’ near-the-money exposure to options delta rises and portends increased liquidity (e.g., the counterparty will buy futures into weakness and sell futures into strength).

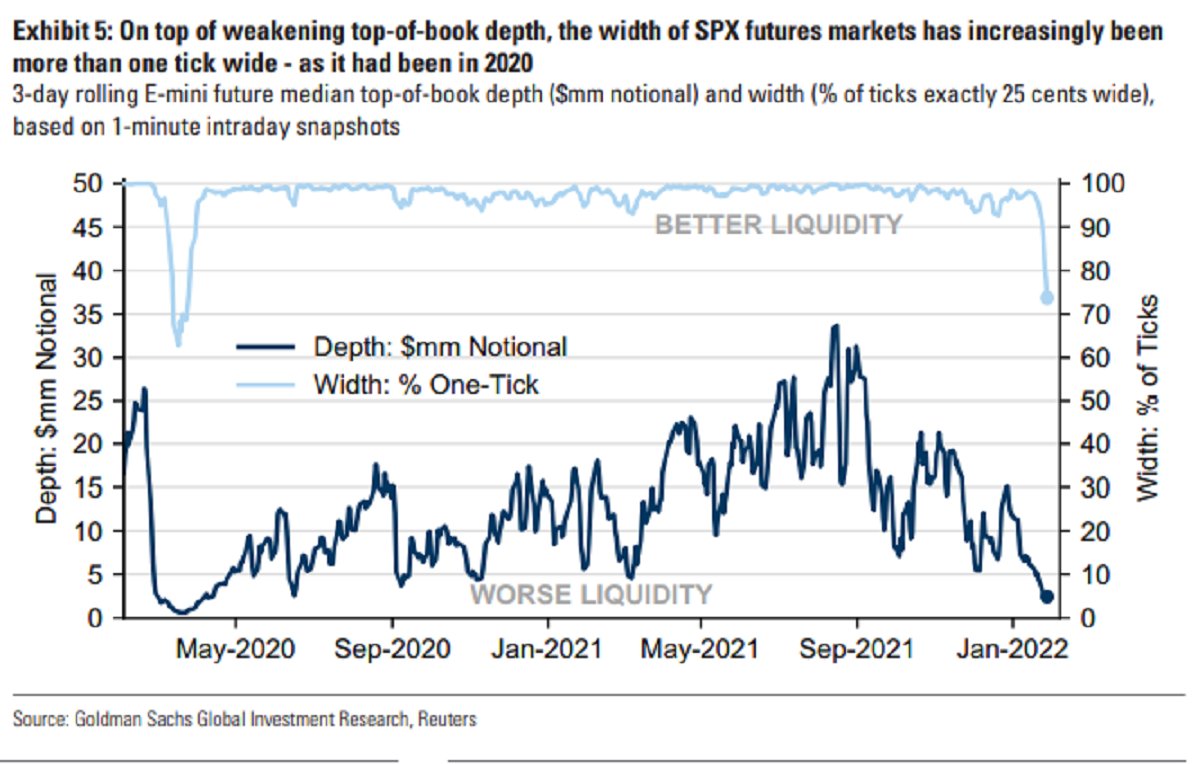
Given a lower liquidity environment, these hedging flows therefore have a bigger impact.

Graphic: Via SpotGamma, “gamma flows increasingly important in a lower liquidity environment. If the counterparty is taking on more exposure to positive gamma, then their addition of liquidity to hedge may suppress ranges.”

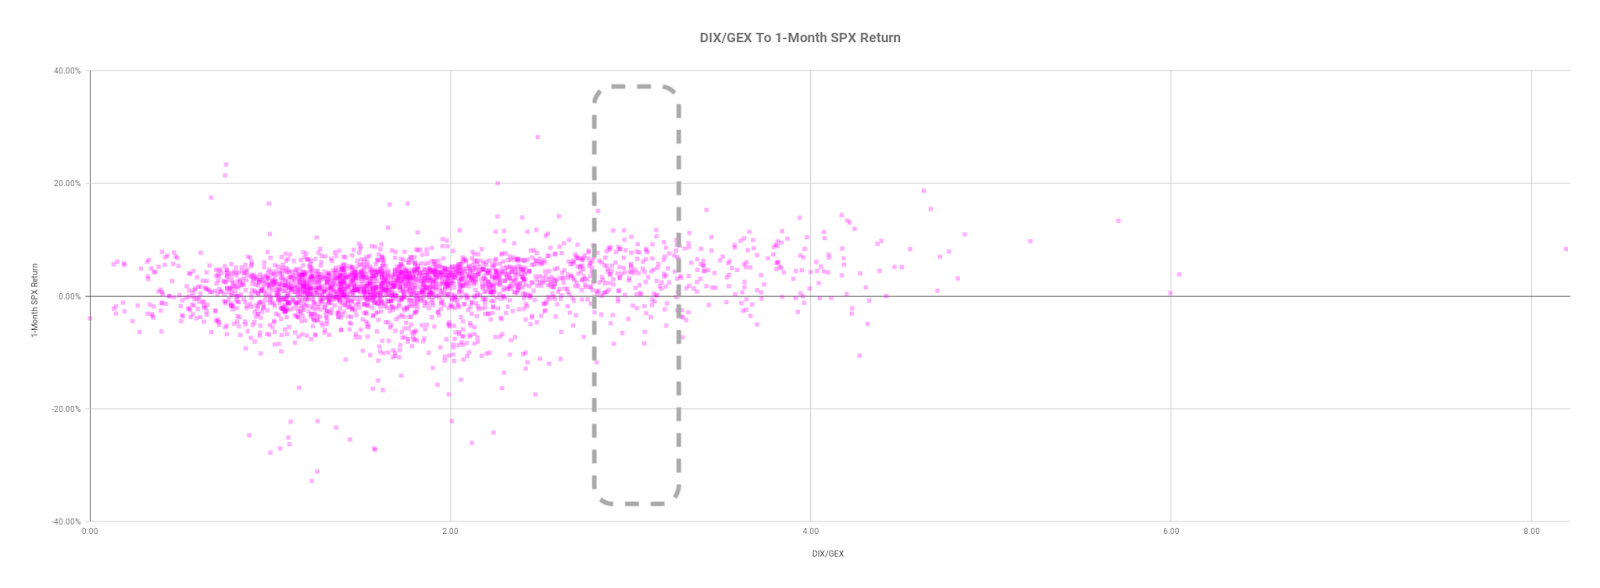
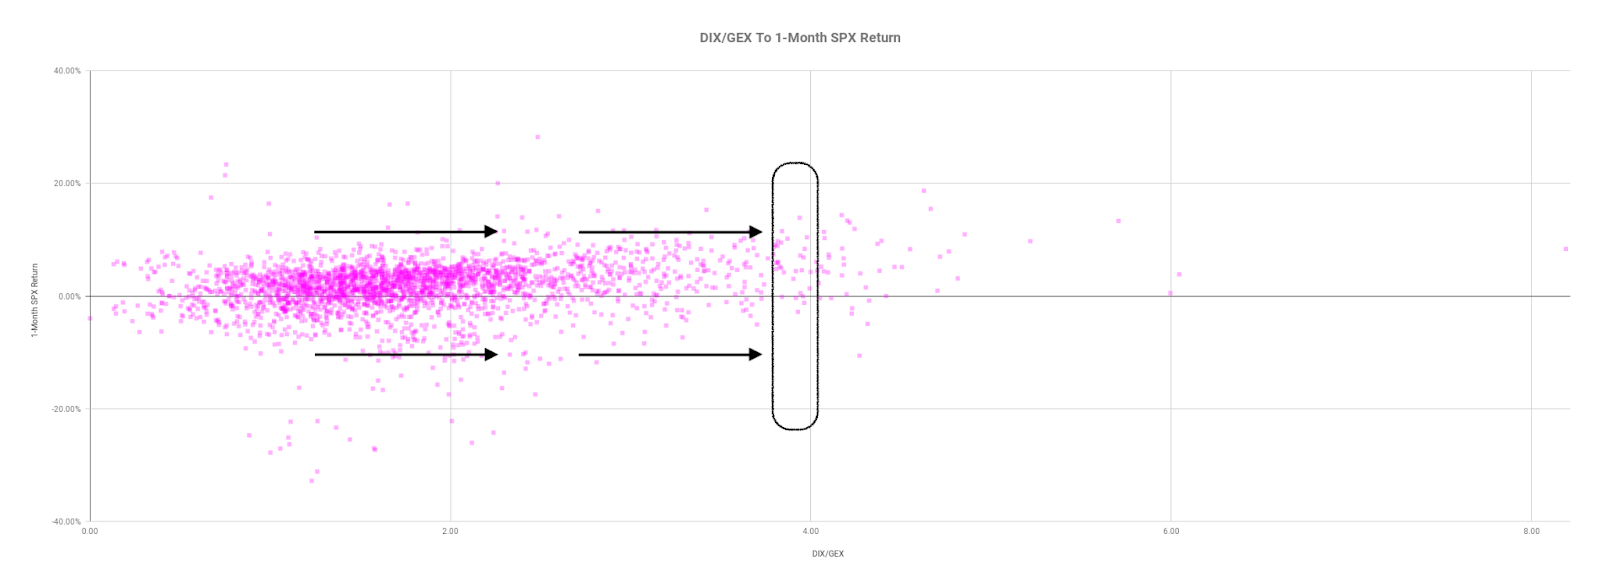
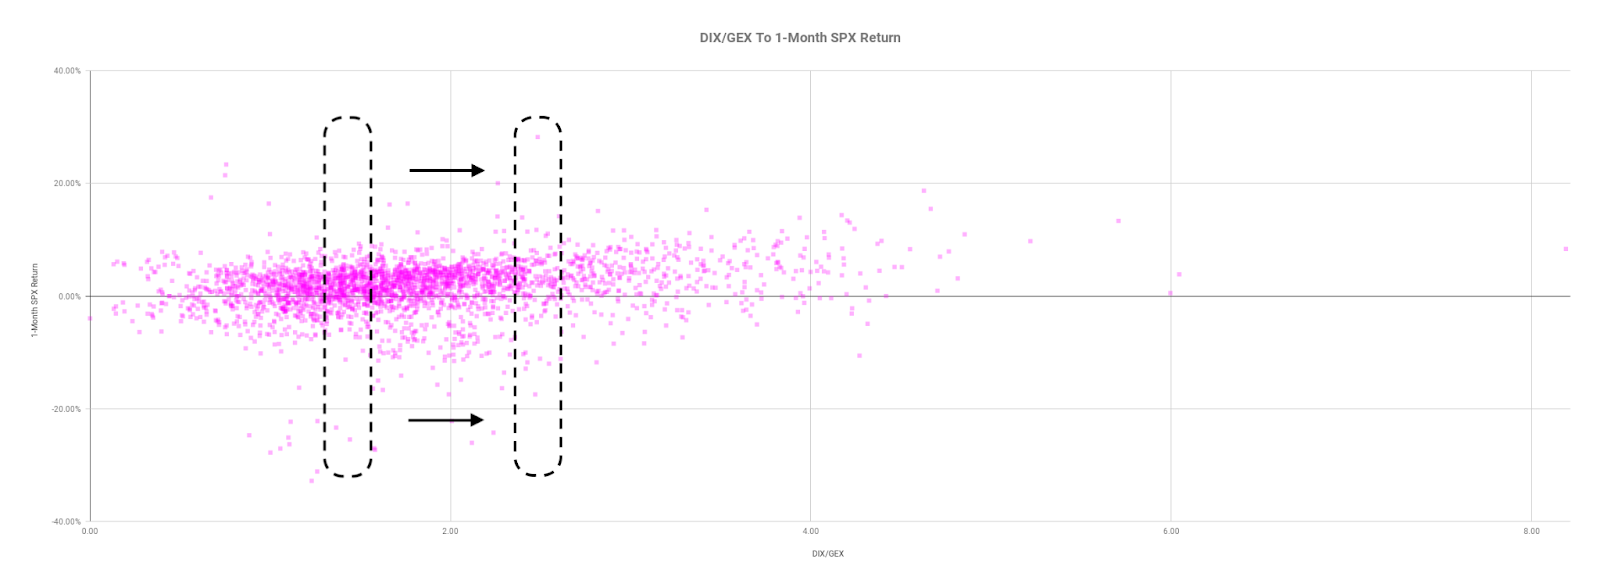
The resolve of this consolidation, coupled with decaying out-of-the-money protection and supportive hedging flows with respect to time (charm) and volatility (vanna), and buying proxies, point to “[m]odest bullishness on the 1-month timeframe.”

Graphic: Data via SqueezeMetrics. Graph via Physik Invest.

Technical: As of 6:30 AM ET, Wednesday’s regular session (9:30 AM – 4:00 PM ET), in the S&P 500, will likely open in the upper part of a positively skewed overnight inventory, outside of prior-range and -value, suggesting a potential for immediate directional opportunity.

Balance-Break + Gap Scenarios: A change in the market (i.e., the transition from two-time frame trade, or balance, to one-time frame trade, or trend) is occurring.

Monitor for acceptance (i.e., more than 1-hour of trade) outside of the balance area. 

Leaving value behind on a gap-fill or failing to fill a gap (i.e., remaining outside of the prior session’s range) is a go-with indicator. 

Rejection (i.e., return inside of balance) portends a move to the opposite end of the balance.

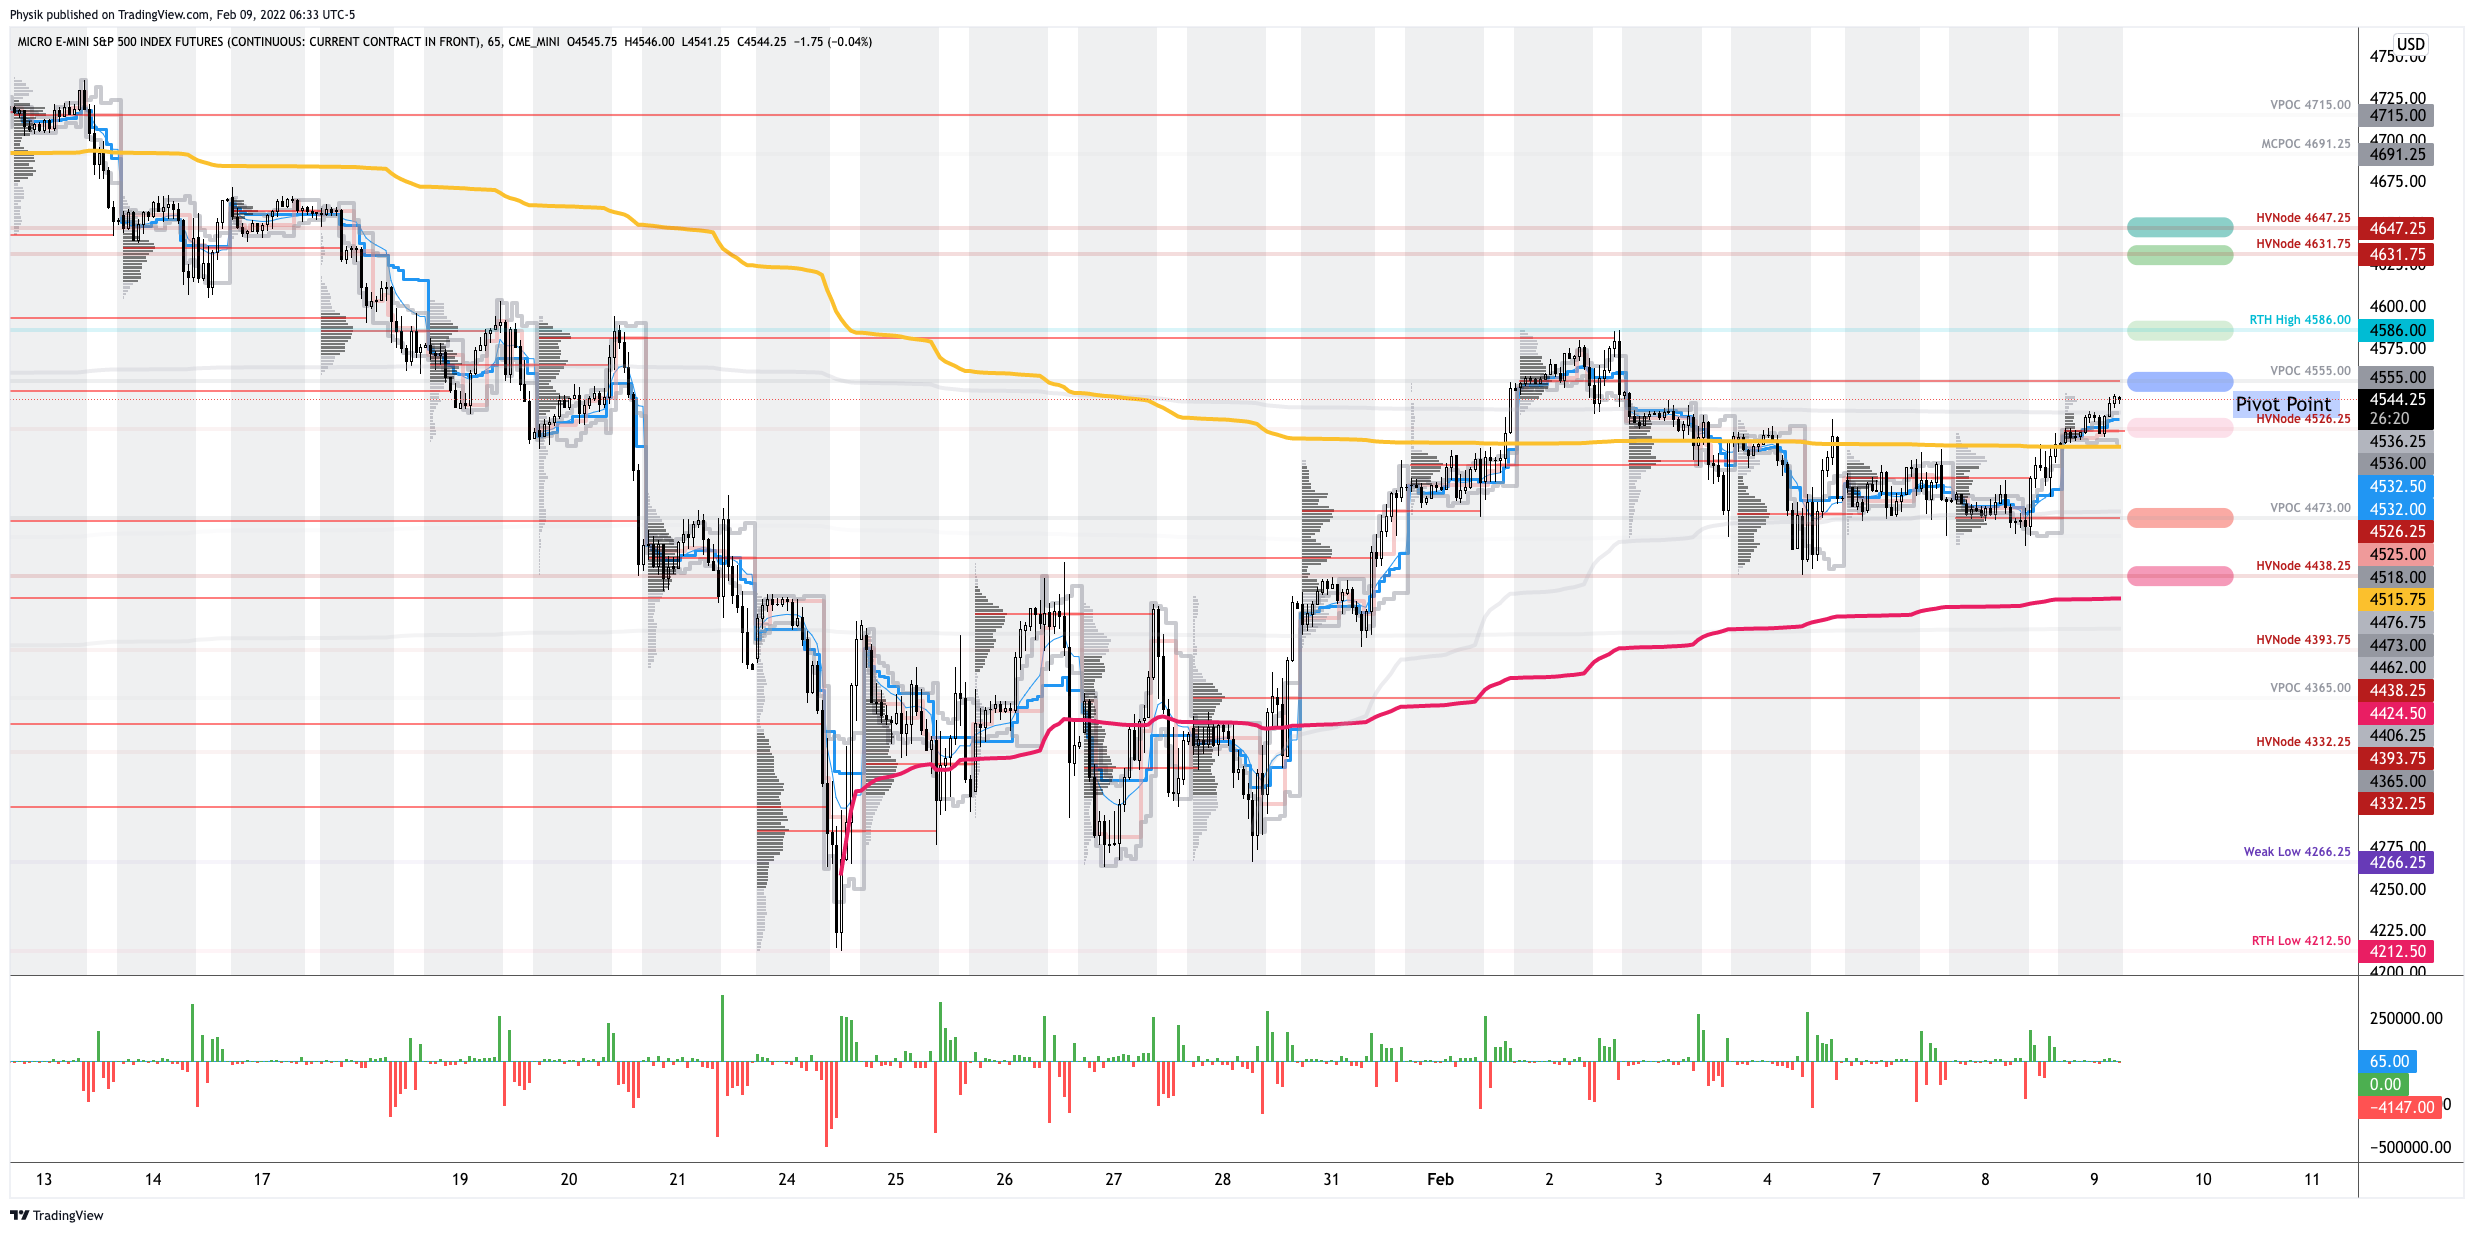
In the best case, the S&P 500 trades higher; activity above the $4,555.00 untested point of control (VPOC) puts in play the $4,586.00 regular trade high (RTH High). Initiative trade beyond the RTH High could reach as high as the $4,631.75 and $4,647.25 HVNode, or higher.

In the worst case, the S&P 500 trades lower; activity below the $4,555.00 VPOC puts in play the $4,526.25 HVNode. Initiative trade beyond the $4,526.25 HVNode could reach as low as the $4,473.00 VPOC and $4,438.25 HVNode, or lower.

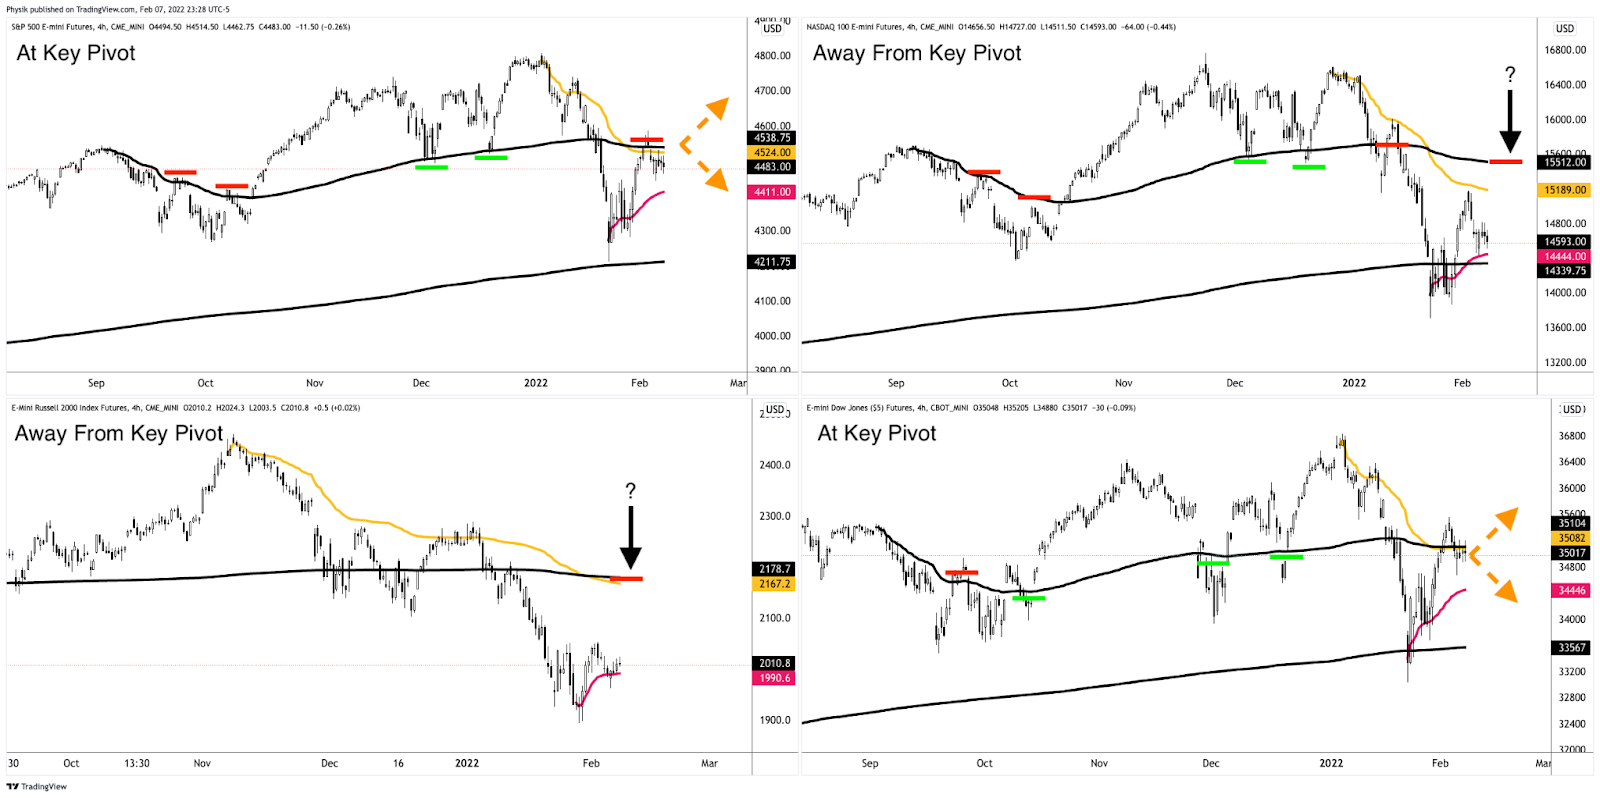
Consideration: All equity index products have resolved tight consolidation’s higher. The Nasdaq 100 and Russell 2000 are the furthest away from clear areas of resistance. 

On the other hand, the S&P 500 and Dow Jones Industrial Average have little in the way of higher prices.

Graphic: Updated 2/8/2022. Anchored Volume Weighted Average Price (VWAP) analysis via Physik Invest. Notice Dow Jones Industrial Average (bottom right) and S&P 500 (top left) strength, as well as Nasdaq 100 (top right) and Russell 2000 (bottom left) weakness. Key pivots marked off.
Click here to load today’s key levels into the web-based TradingView charting platform. Note that all levels are derived using the 65-minute timeframe. New links are produced, daily.
Graphic: 65-minute profile chart of the Micro E-mini S&P 500 Futures.

What People Are Saying

Definitions

Volume Areas: A structurally sound market will build on areas of high volume (HVNodes). Should the market trend for long periods of time, it will lack sound structure, identified as low volume areas (LVNodes). LVNodes denote directional conviction and ought to offer support on any test. 

If participants were to auction and find acceptance into areas of prior low volume (LVNodes), then future discovery ought to be volatile and quick as participants look to HVNodes for favorable entry or exit.

POCs: POCs are valuable as they denote areas where two-sided trade was most prevalent in a prior day session. Participants will respond to future tests of value as they offer favorable entry and exit.

About

After years of self-education, strategy development, mentorship, and trial-and-error, Renato Leonard Capelj began trading full-time and founded Physik Invest to detail his methods, research, and performance in the markets.

Capelj is also a Benzinga finance and technology reporter interviewing the likes of Shark Tank’s Kevin O’Leary, JC2 Ventures’ John Chambers, FTX’s Sam Bankman-Fried, and ARK Invest’s Catherine Wood, as well as a SpotGamma contributor developing insights around impactful options market dynamics.

Disclaimer

Physik Invest does not carry the right to provide advice.

In no way should the materials herein be construed as advice. Derivatives carry a substantial risk of loss. All content is for informational purposes only.
Categories
Commentary

Daily Brief For February 8, 2022

Editor’s Note: The Daily Brief is a free glimpse into the prevailing fundamental and technical drivers of U.S. equity market products. Join the 200+ that read this report daily, below!

What Happened

Overnight, equity index futures were divergent and weighed by the tech- and growth-heavy Nasdaq 100. Most commodity and bond products were much weaker, also. 

This stocks down, bonds down dynamic points to a continued deleveraging. 

Notwithstanding, sideways after a fast move lower, is not a bad thing. It’s one of the better cases to have given certain mechanics with respect to the options market, for instance.

Ahead is data on international trade (8:30 AM ET) and real household debt (11:00 AM ET).

Graphic updated 6:20 AM ET. Sentiment Neutral if expected /ES open is inside of the prior day’s range. /ES levels are derived from the profile graphic at the bottom of the following section. Levels may have changed since initially quoted; click here for the latest levels. SqueezeMetrics Dark Pool Index (DIX) and Gamma (GEX) calculations are based on where the prior day’s reading falls with respect to the MAX and MIN of all occurrences available. A higher DIX is bullish. At the same time, the lower the GEX, the more (expected) volatility. Learn the implications of volatility, direction, and moneyness. SHIFT data used for S&P 500 (INDEX: SPX) options activity. Note that options flow is sorted by the call premium spent; if more positive, then more was spent on call options. Breadth reflects a reading of the prior day’s NYSE Advance/Decline indicator. VIX reflects a current reading of the CBOE Volatility Index (INDEX: VIX) from 0-100.

What To Expect

Fundamental: Ranges, at the index level, have tightened markedly since the January sell-off culminating in a cross-market deleveraging cascade.

The situation is different at the single-stock level. There are a couple of factors behind this.

For one, ARK Invest’s Catherine Wood recently made an interesting point suggesting events of today are the exact opposite of the events leading into the tech-and-telecom bust.

“During the tech-and-telecom bubble, … investors were falling all over each other, trying to one-up each other, to get a bigger tech position, because tech in the indexes had moved to 35%. We saw many portfolios with 40%, 50% tech.”

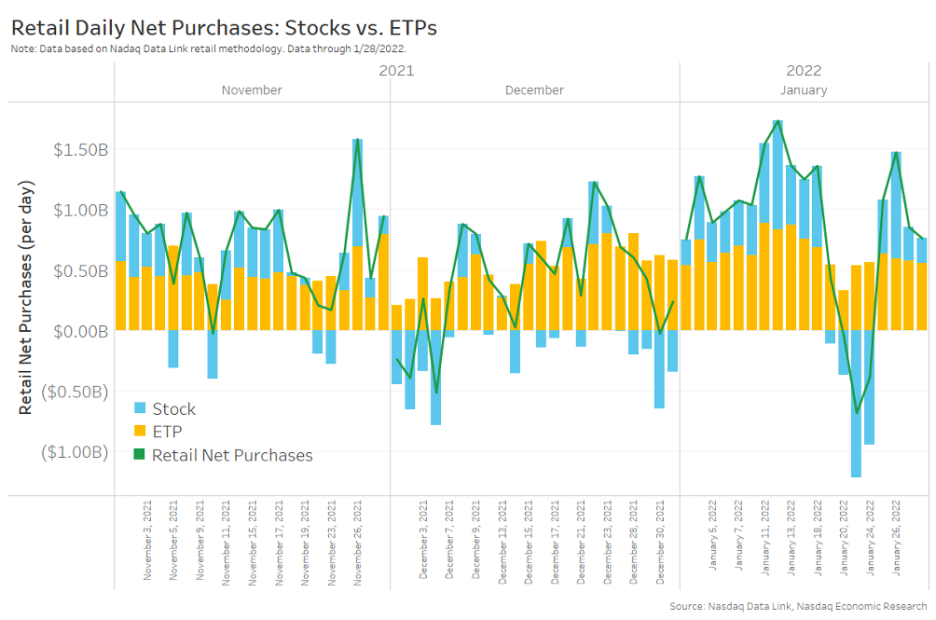
Basically, Wood thinks that investors are dumping single-stocks for index exposure. The below data supports this.

“We think that decision is going to prove to be just as incorrect as the decision to move en masse in the late 90s.”

Graphic: Per Nasdaq, “we’ve seen patches of retail selling of stocks that have mostly lasted for less than a week (blue bars in Chart 2). Interestingly, ETFs (yellow bars) remained net buy every single day, albeit at lower levels than usual in the last week of January.”

There is also the increasing demand for positive delta (long) exposure in the indexes as participants hedge their negative delta (short) exposure in the single stocks.

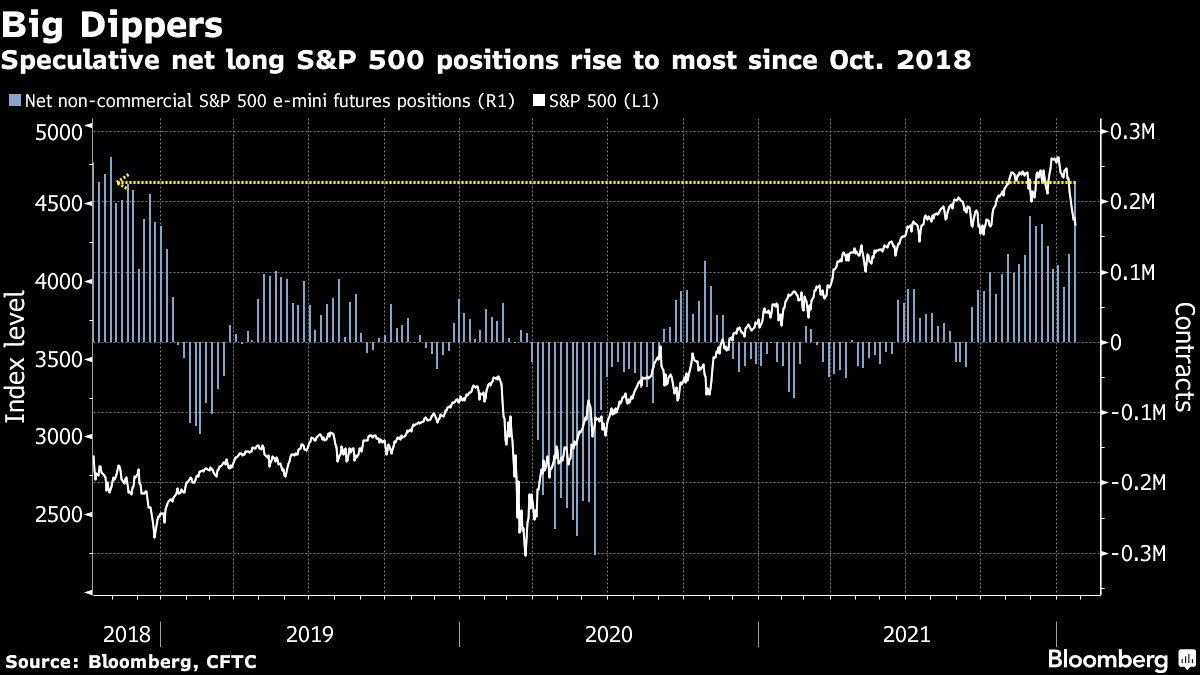
Graphic: Via Bloomberg.

Then, there is also the supply and demand for options protection, at the index level. 

Mainly, the indexes are where the world will hedge and so the effects of dealers re-hedging their risks to decaying options protection provide markets a sort of passive buying support.

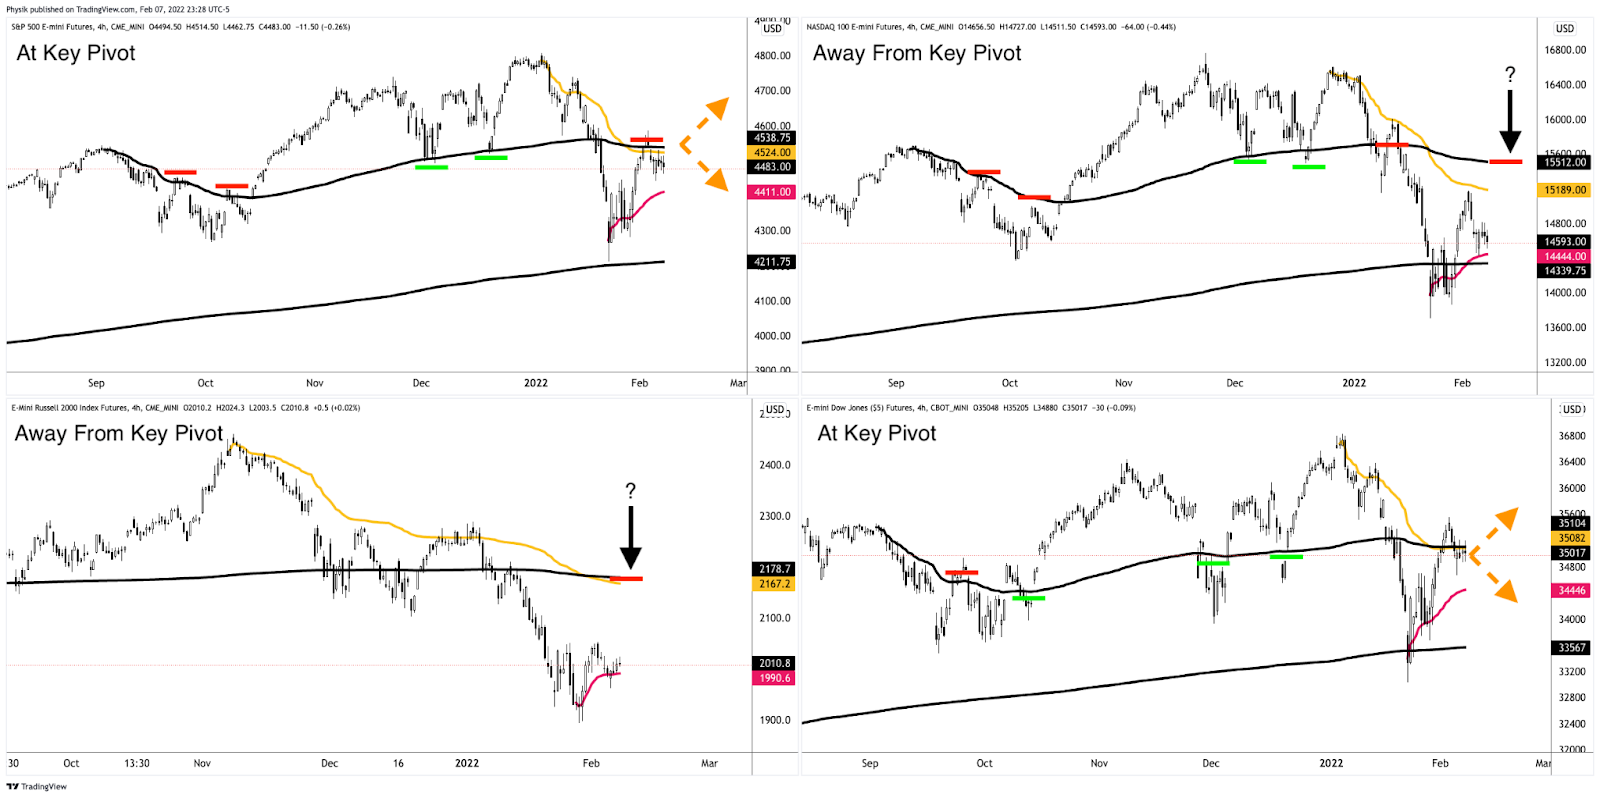
The S&P 500, which carries a more liquid derivatives complex and less exposure to tech- and growth-heavy constituents (when compared to the Nasdaq 100 and Russell 2000), appears stronger, but not as strong as the Dow Jones Industrial Average, a clear beneficiary of the rotation out of growth- and innovation-names to value- and cyclical-type stocks.

Graphic: Anchored Volume Weighted Average Price (VWAP) analysis via Physik Invest. Notice Dow Jones Industrial Average (bottom right) and S&P 500 (top left) strength, as well as Nasdaq 100 (top right) and Russell 2000 (bottom left) weakness. Key pivots marked off.

All the last-mentioned point is trying to make is the following: try hard enough and you’ll find an explanation for anything. 

Sometimes, though, a focus on the simplest of explanations (e.g., demand for assets that perform better in higher rate environments) may suffice in navigating volatility.

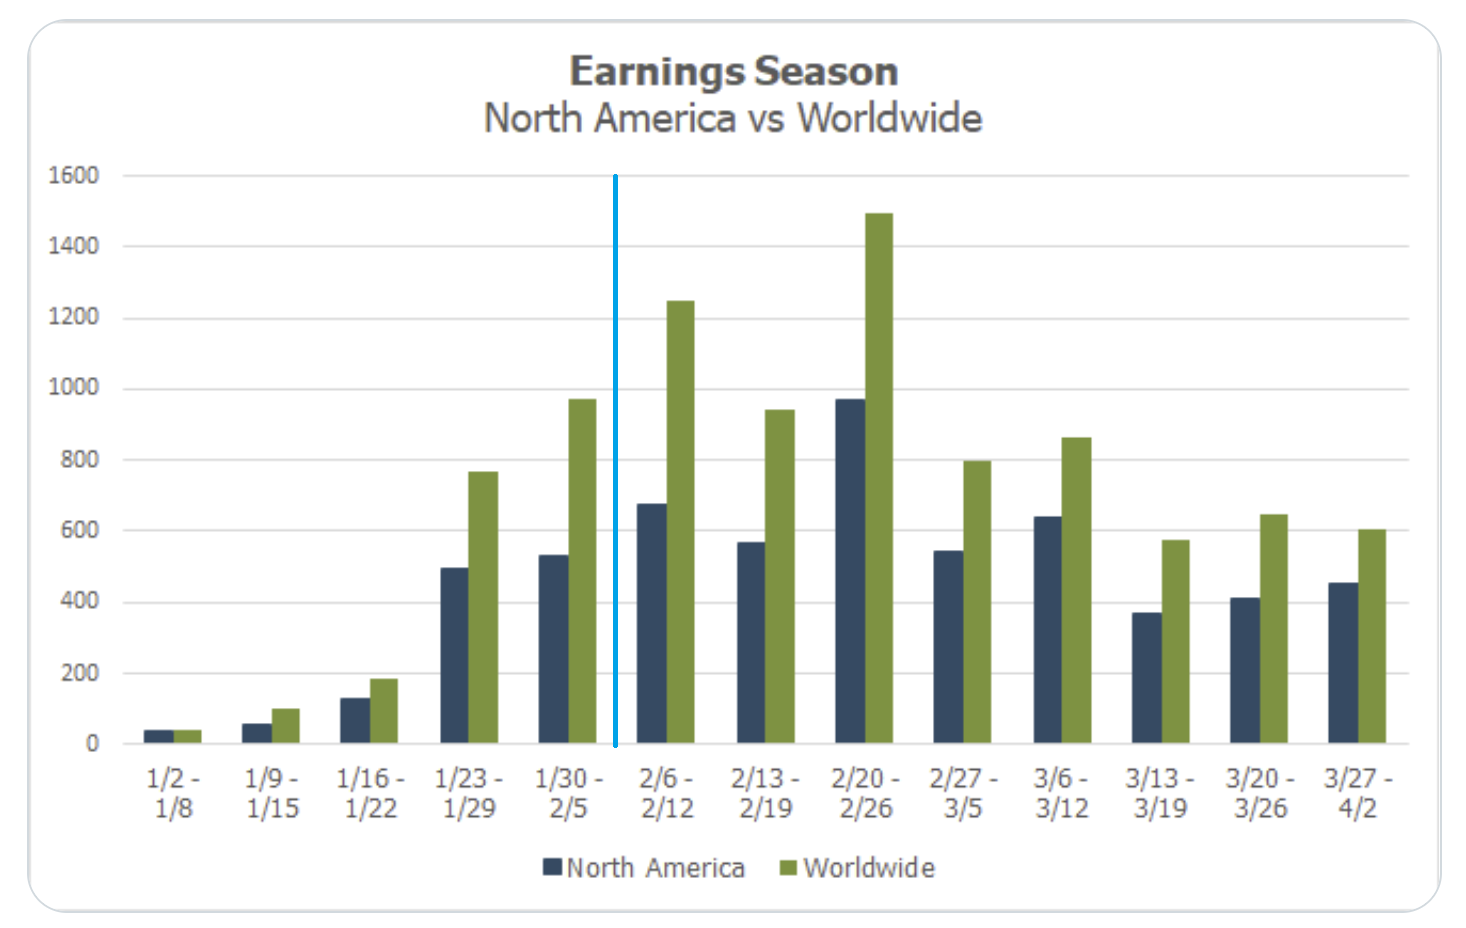
Going forward, despite many index heavy-weights reporting, the earnings season is set to accelerate over the coming weeks, and equity index futures traders have positioned themselves (as evidenced by tight, sideways trade) to react to new information accordingly.

Graphic: Via @MikeZaccardi. Retrieved from Callum Thomas.

Per JPMorgan Chase & Co (NYSE: JPM) strategists, the bull thesis remains intact. 

The pace of economic growth is to stabilize in 2022 and the Federal Reserve is unlikely to move further into the hawkish territory.

We’re “Continuously seeing gains for earnings. Consensus projections for 2022 will most likely prove too low again,” JPM explains. “P/E multiples are elevated, but not equity yields vs credit & bond yields. We expect further, mild and benign, P/E compression in 2022. Overall, the picture is favorable, post the recent de-risking.”

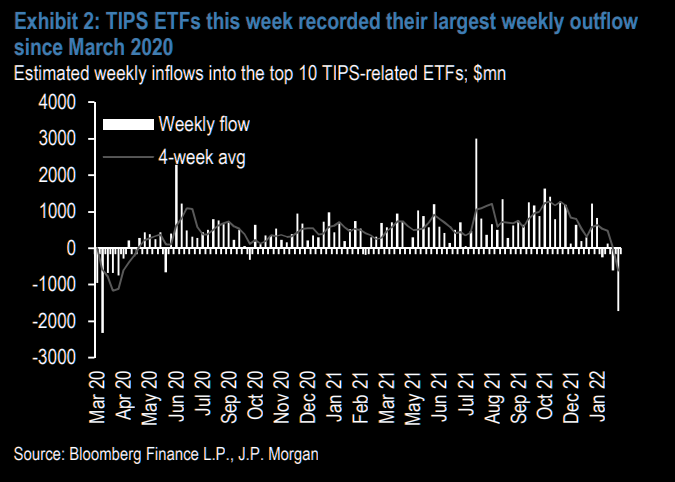
Graphic: Via The Market Ear. As money supply (which played a part in increased CPI figures) is slated to fall, there have been large outflows from Treasury Inflation-Protected Securities. @MacroAlf notes that these are some of the largest outflows “since the pandemic crash in March 2020. CPI might be 7% today, but markets are forward-looking.”

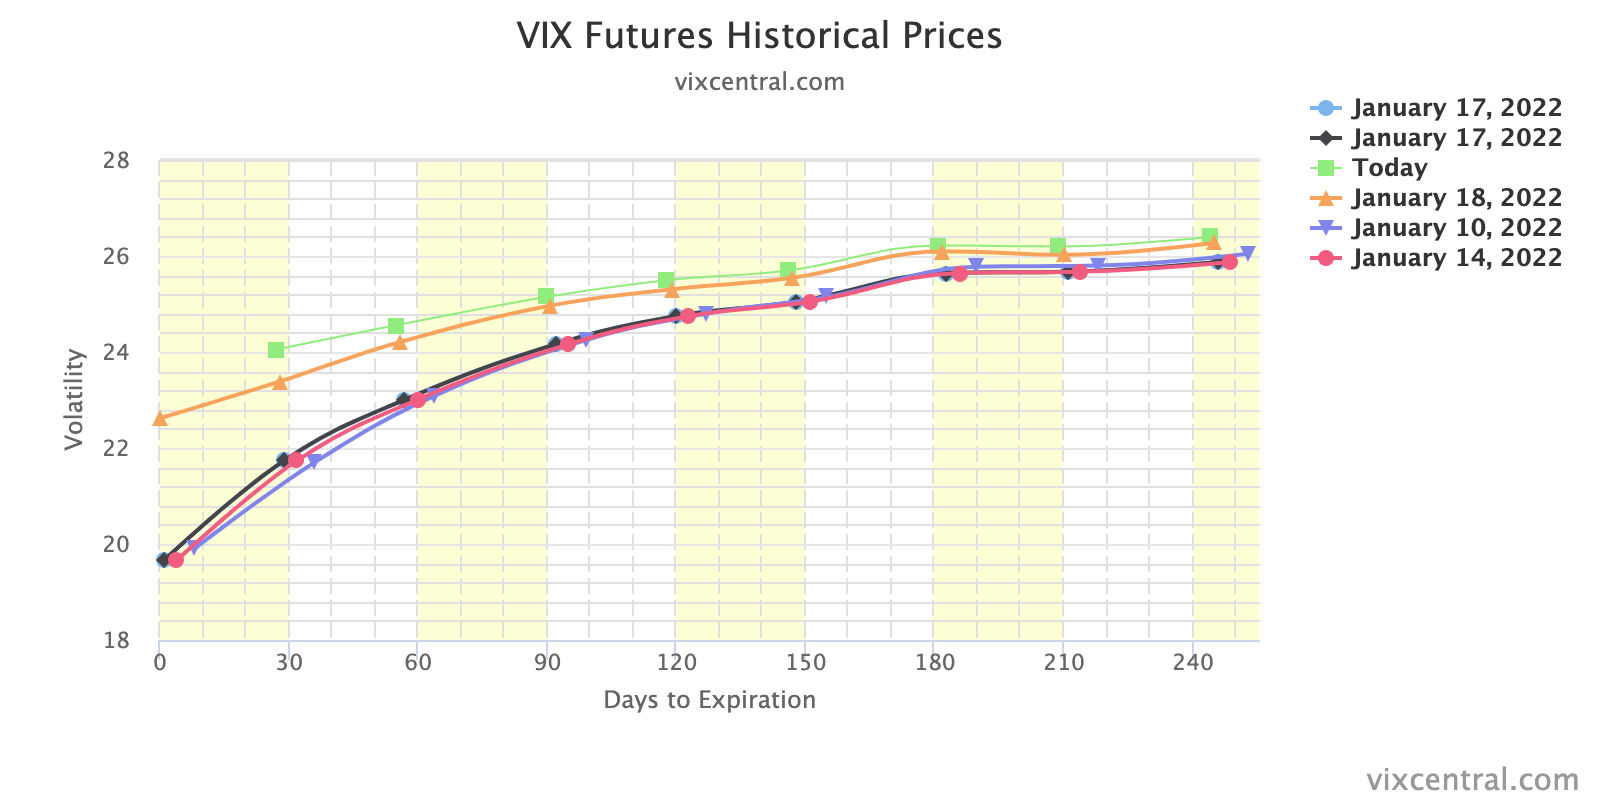
Positioning: Though markets will tend toward instability so long as volatility is heightened and products (especially the index constituents) remain in negative gamma, the dip lower and demand for protection may serve to prime the market for upside (when volatility starts to compress again and counterparties unwind hedges thus supporting any attempt higher).

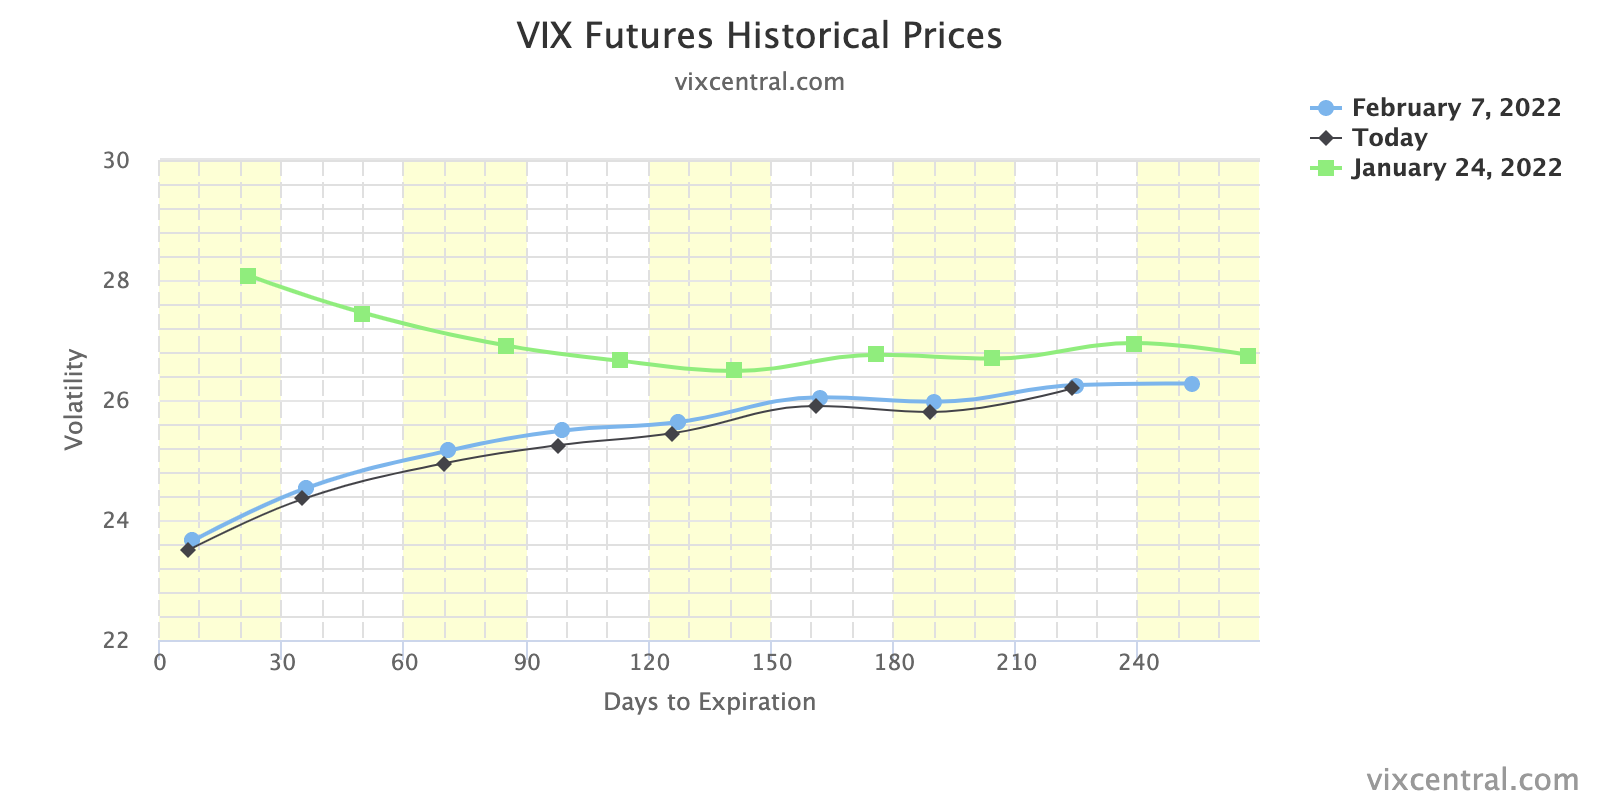
Graphic: VIX term structure compresses markedly at the front end affecting most shorter-dated options more sensitive to the effects of direction and volatility.

“Failure to expand the range, lower, on the index level, at least, likely invokes supportive dealer hedging flows with respect to time (‘charm’) and volatility (‘vanna’),” SpotGamma adds.

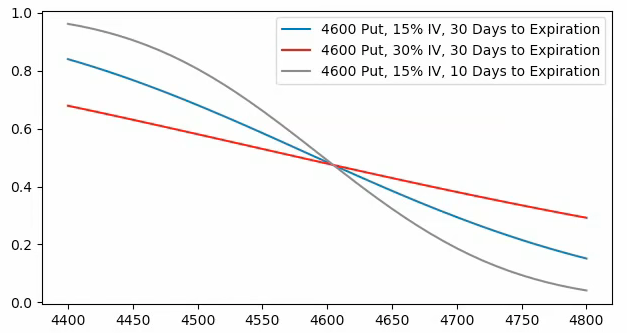
Graphic: Via SpotGamma. “SPX prices X-axis. Option delta Y-axis. When the factors of implied volatility and time change, hedging ratios change. For instance, if SPX is at $4,700.00 and IV jumps 15% (all else equal), the dealer may sell an additional 0.2 deltas to hedge their exposure to the addition of a positive 0.2 delta. The graphic is for illustrational purposes, only.”

Taking into account options positioning, versus buying pressure (measured via short sales or liquidity provision on the market-making side), metrics point to “[m]odest bullishness on the 1-month timeframe.”

Technical: As of 6:20 AM ET, Tuesday’s regular session (9:30 AM – 4:00 PM ET), in the S&P 500, will likely open in the lower part of a negatively skewed overnight inventory, inside of prior-range and -value, suggesting a limited potential for immediate directional opportunity.

Balance-Break Scenarios: A change in the market (i.e., the transition from two-time frame trade, or balance, to one-time frame trade, or trend) may soon occur.

Monitor for acceptance (i.e., more than 1-hour of trade) outside of the balance area. Rejection (i.e., return inside of balance) portends a move to the opposite end of the balance.

In the best case, the S&P 500 trades higher; activity above the $4,497.00 untested point of control (VPOC) puts in play the $4,526.25 high volume area (HVNode). Initiative trade beyond the HVNode could reach as high as the $4,555.00 VPOC and $4,586.00 RTH High (regular trade high), or higher.

In the worst case, the S&P 500 trades lower; activity below the $4,497.00 VPOC puts in play the $4,438.25 HVNode. Initiative trade beyond the $4,438.25 HVNode could reach as low as the $4,393.75 HVNode and $4,365.00 VPOC, or lower.

Click here to load today’s key levels into the web-based TradingView charting platform. Note that all levels are derived using the 65-minute timeframe. New links are produced, daily.
Graphic: 65-minute profile chart of the Micro E-mini S&P 500 Futures.

Definitions

Volume Areas: A structurally sound market will build on areas of high volume (HVNodes). Should the market trend for long periods of time, it will lack sound structure, identified as low volume areas (LVNodes). LVNodes denote directional conviction and ought to offer support on any test. 

If participants were to auction and find acceptance into areas of prior low volume (LVNodes), then future discovery ought to be volatile and quick as participants look to HVNodes for favorable entry or exit.

POCs: POCs are valuable as they denote areas where two-sided trade was most prevalent in a prior day session. Participants will respond to future tests of value as they offer favorable entry and exit.

Volume-Weighted Average Prices (VWAPs): A metric highly regarded by chief investment officers, among other participants, for quality of trade. Additionally, liquidity algorithms are benchmarked and programmed to buy and sell around VWAPs.

About

After years of self-education, strategy development, mentorship, and trial-and-error, Renato Leonard Capelj began trading full-time and founded Physik Invest to detail his methods, research, and performance in the markets.

Capelj is also a Benzinga finance and technology reporter interviewing the likes of Shark Tank’s Kevin O’Leary, JC2 Ventures’ John Chambers, FTX’s Sam Bankman-Fried, and ARK Invest’s Catherine Wood, as well as a SpotGamma contributor developing insights around impactful options market dynamics.

Disclaimer

Physik Invest does not carry the right to provide advice.

In no way should the materials herein be construed as advice. Derivatives carry a substantial risk of loss. All content is for informational purposes only.
Categories
Commentary

Daily Brief For January 20, 2022

The Daily Brief is a free glimpse into the prevailing fundamental and technical drivers of U.S. equity market products. Join the 200+ that read this report daily, below!

What Happened

Overnight, equity index futures auctioned upward, into the prior day’s range, after some overnight exploration, lower. 

As explained better below, some positioning metrics suggest a bottom (at least near-term) may be in the making.

Ahead is data on jobless claims and manufacturing (8:30 AM ET), as well as home sales (10:00 AM ET).

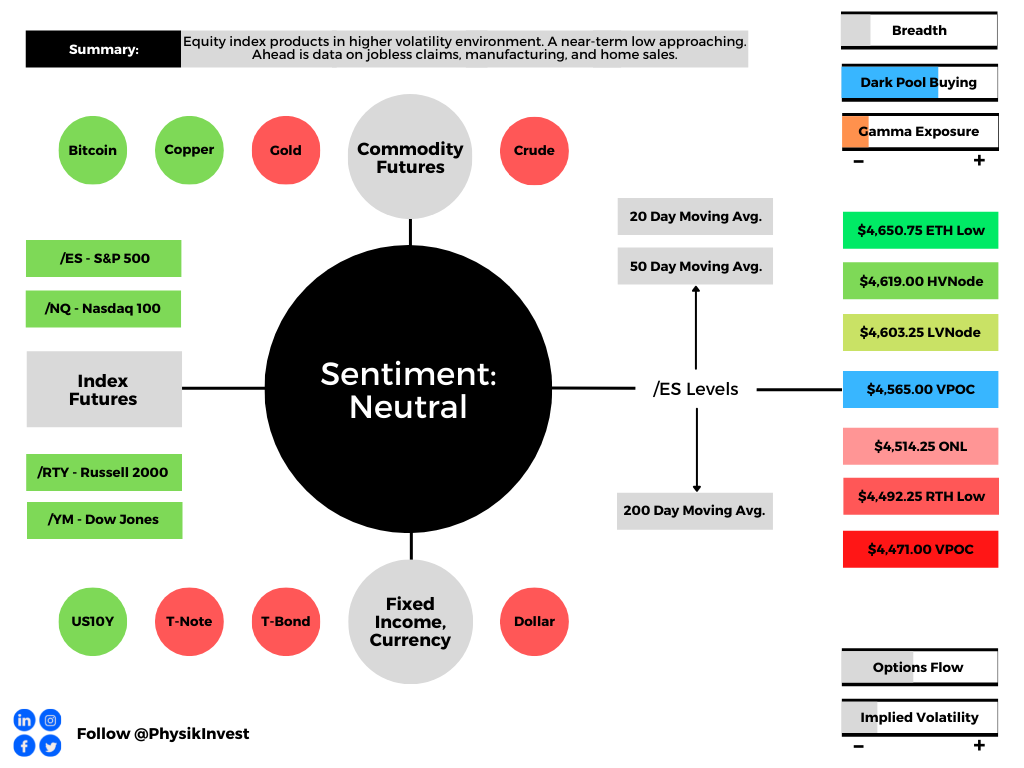
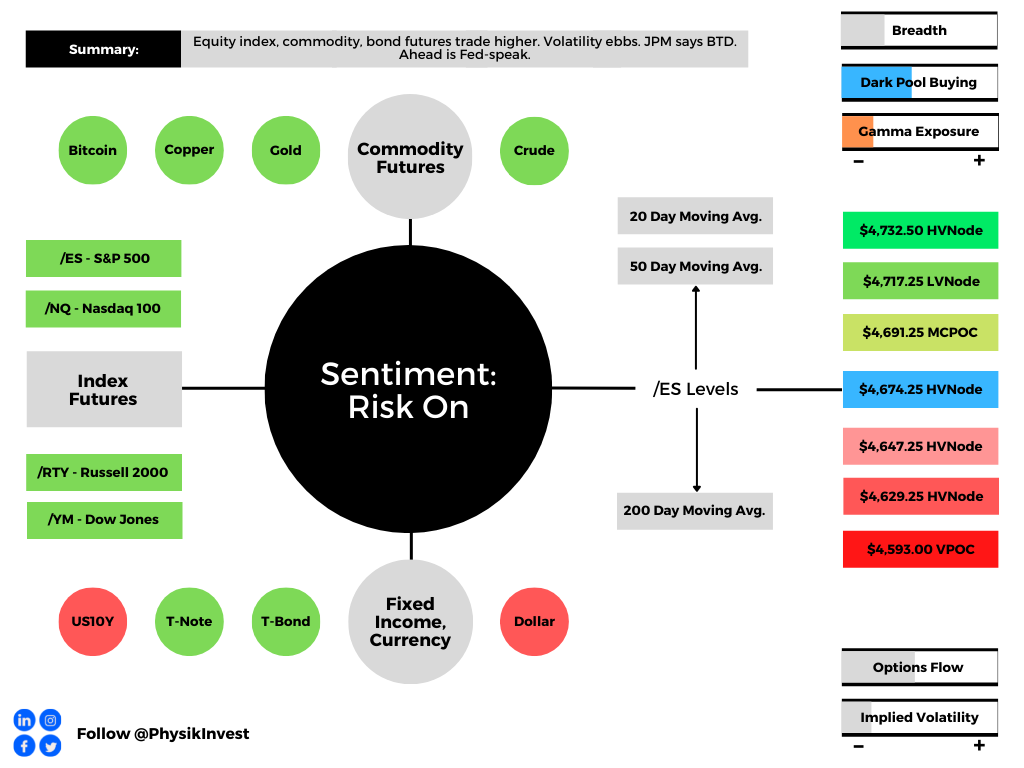
Graphic updated 6:40 AM ET. Sentiment Neutral if expected /ES open is inside of the prior day’s range. /ES levels are derived from the profile graphic at the bottom of the following section. Levels may have changed since initially quoted; click here for the latest levels. SqueezeMetrics Dark Pool Index (DIX) and Gamma (GEX) calculations are based on where the prior day’s reading falls with respect to the MAX and MIN of all occurrences available. A higher DIX is bullish. At the same time, the lower the GEX, the more (expected) volatility. Learn the implications of volatility, direction, and moneyness. SHIFT data used for S&P 500 (INDEX: SPX) options activity. Note that options flow is sorted by the call premium spent; if more positive, then more was spent on call options. Breadth reflects a reading of the prior day’s NYSE Advance/Decline indicator. VIX reflects a current reading of the CBOE Volatility Index (INDEX: VIX) from 0-100.

What To Expect

Fundamental: The prevailing narrative facing market participants in recent trade is centered around the prospects of contractionary monetary policy in the face of strong economic and earnings growth, as well as cooling inflation while “excess supply” of goods/services builds.

This, as Bloomberg puts it well, “threatens to inject more volatility across a range of assets.” 

As a result, the benefits afforded to holders of diversified portfolios are less.

“If current, priced in, inflation and growth expectations are exactly realized we predict that risk premiums on 30-year yields will increase by 15bp and equity risk premium by 30bp,” which would, according to Damped Spring Advisors, “generate a 2% headwind on long bond prices and a 10% headwind for equity prices.”

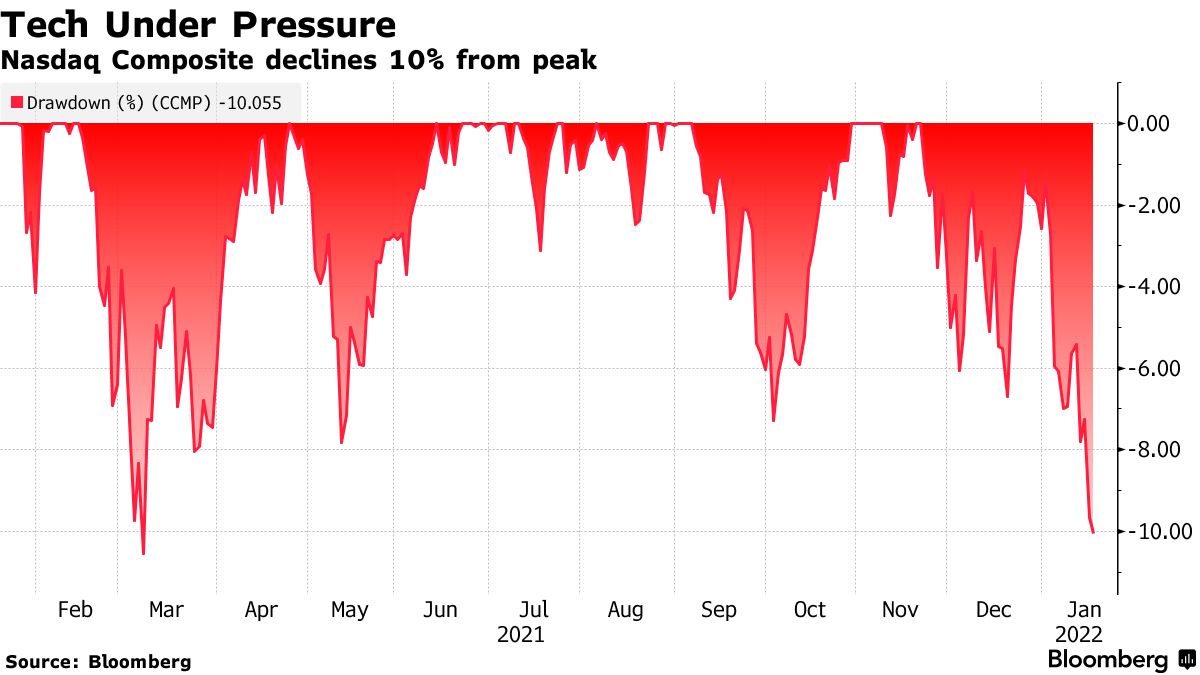
Participants are pricing in these expectations, selling heavy the rate-sensitive products, and pushing the Nasdaq into correction territory, yesterday.

Graphic: Per Bloomberg, “The rout pushed the Nasdaq Composite over the threshold into correction territory.”

“Right now you have people waiting before they go and buy back in,” said Jamie Cox, managing partner at Harris Financial Group.

“You have a Fed meeting coming up, so there’s not going to be a lot of movement anywhere until the Fed meeting is over with. You look around, there’s not a lot of problems in the economy, what you have is just the question of, ‘does all this add up to a faster rate hiking cycle that we anticipate?’ And I don’t think so. I think it’s not likely.”

Moreover, unlike the U.S., counterparts elsewhere, in China and Europe, for example, are not looking to tighten as quickly.

“If major economies slam on the brakes or take a U-turn in their monetary policies, there would be serious negative spillovers,” said Chinese President Xi Jinping. 

“They would present challenges to global economic and financial stability, and developing countries would bear the brunt of it.”

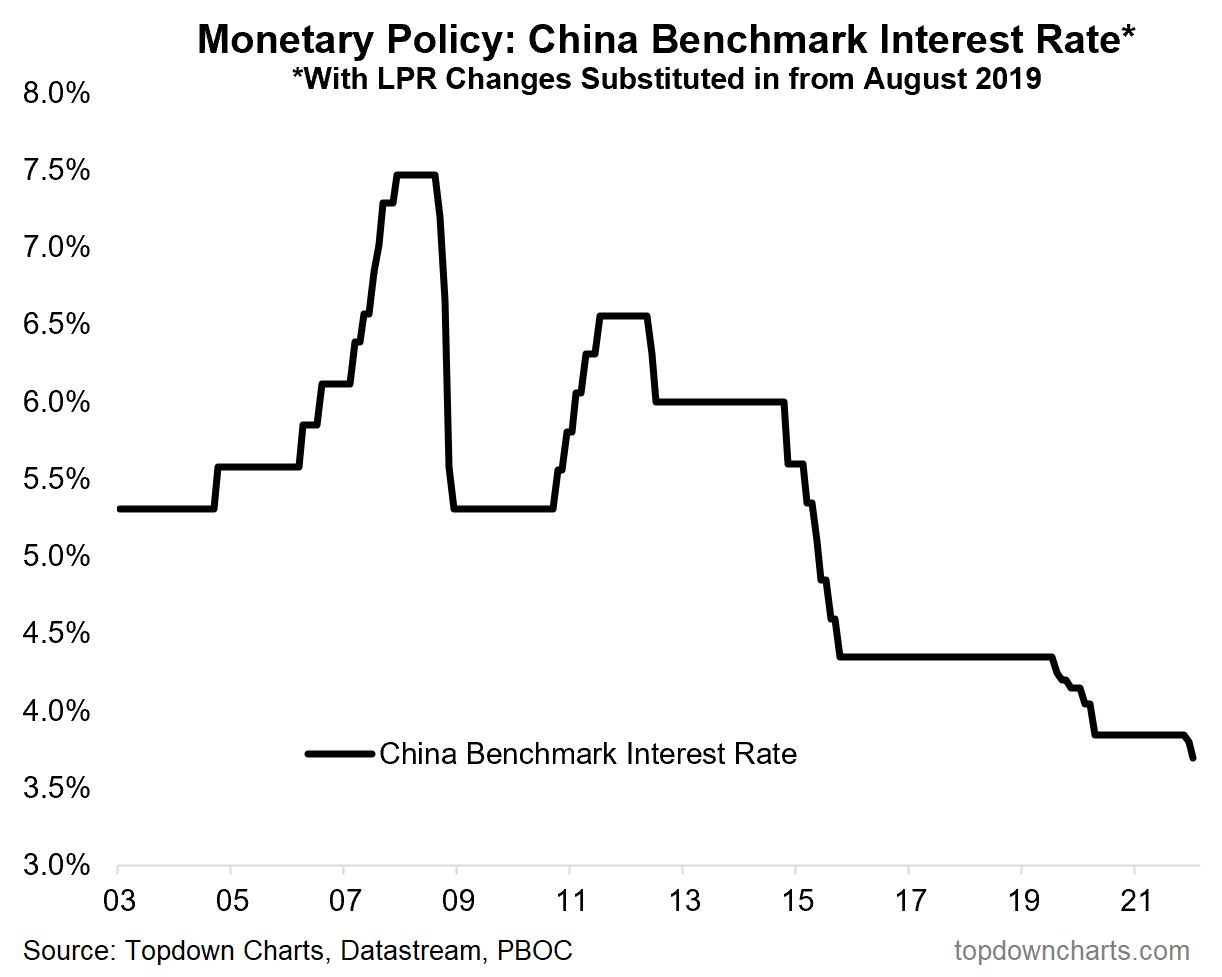
For context, China cut its benchmark interest rate to 3.70% (10 basis points), “cement[ing] the pivot to easing.”

Graphic: Per Topdown Charts, “China cuts benchmark interest rate -10bps to 3.70%. i.e. the 1-year LPR [Loan Prime Rate].  n.b. the PBOC also cut the 5-year loan prime rate by -5bps to 4.6%.”

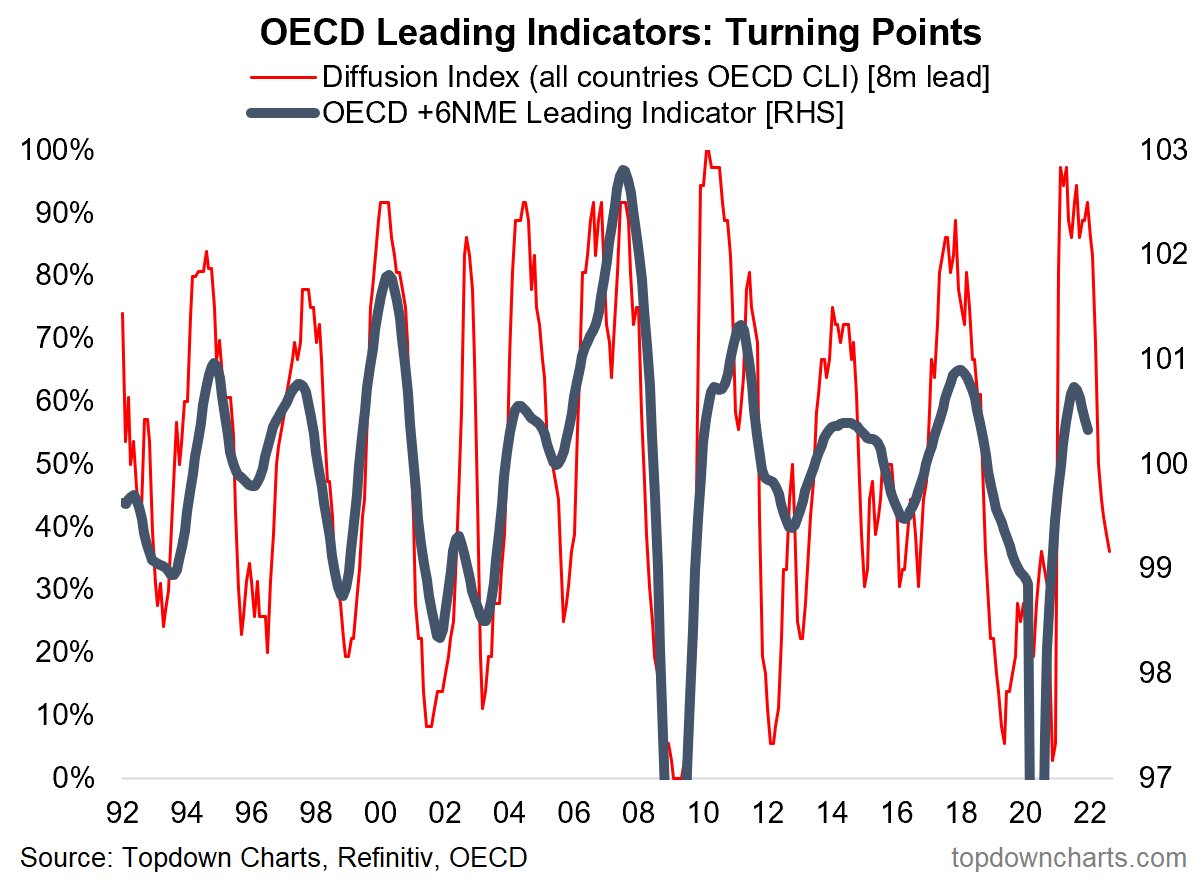
Though this move away from tightening in China is good for assets in that country, emerging markets, and commodities, according to Callum Thomas, an economic slowdown there may foreshadow what is to come in other parts of the world.

Obviously, in saying that plainly, we’re discounting China’s clampdown on its housing and financial sector, but the data seems to suggest the “reopening [and] stimulus-driven global economic rebound may be losing steam headed into 2022.”

Graphic: Per Topdown Charts, OECD leading indicator down sharply from highs.

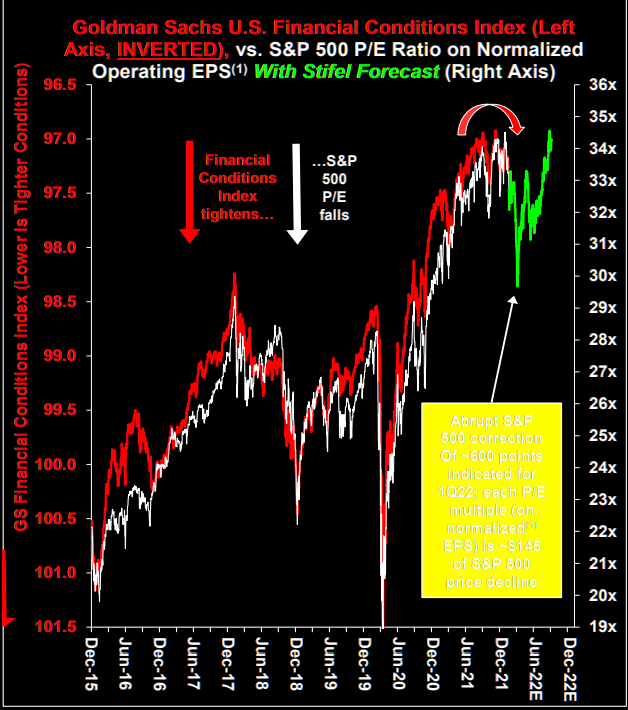
Stifel Financial Corporation’s (NYSE: SF) Barry Bannister provides us with the implications of tighter U.S. financial conditions: a correction down to $4,200.00 in the S&P 500, near-term.

And, with that, post-correction, equities risk the 3rd bubble in 100 years if the “Fed loses its nerve and cancels much of the tightening plan.”

Graphic: From The Market Ear.

As an aside, to temper some of the bearishness in the above section of the newsletter, here is a chart of S&P 500 returns during Federal Reserve hiking cycles.

Graphic: Via Goldman Sachs Group Inc (NYSE: GS), from The Market Ear.

Positioning: Despite elevated measures of implied volatility like the Cboe Volatility Index (INDEX: VIX), the VIX term structure remains upward sloping, albeit less so than before.

Graphic: VIX term structure shifts higher. The flows associated with hedging protection in the S&P complex ought to pressure the market, should this term structure continue higher.

This is as the unwind of large long-delta positions in heavily weighted index constituents, pre-monthly options expiry (OPEX), alongside demand for downside (put) protection, is finally feeding into the large index products.

Graphic: SpotGamma’s (beta) Hedging Impact Of Real-Time Options (HIRO) indicator suggests Negative options delta trades likely had dealers selling the S&P 500 and Nasdaq 100 ETFs, yesterday.

Moreover, further flattening or inversion of the VIX term structure would clearly coincide with destabilizing demand for protection (as a result of the counterparty supplying protection selling underlying to hedge).

Thus, any expansion in volatility (which could be construed as demand for protection), likely coincides with further weakness.

Notwithstanding, though conditions could worsen, if we take into account options positioning, versus buying pressure (measured via short sales or liquidity provision on the market-making side), metrics remain positively skewed, even more so than before. 

Some sort of bottom (at least near-term) may be in the making.

Graphic: Data SqueezeMetrics. Graph via Physik Invest.

Technical: As of 6:40 AM ET, Thursday’s regular session (9:30 AM – 4:00 PM ET), in the S&P 500, will likely open in the upper part of a positively skewed overnight inventory, inside of prior-range and -value, suggesting a limited potential for immediate directional opportunity.

Spike Scenario In Play: Spike’s mark the beginning of a break from value. Spikes higher (lower) are validated by trade at or above (below) the spike base (i.e., the origin of the spike).

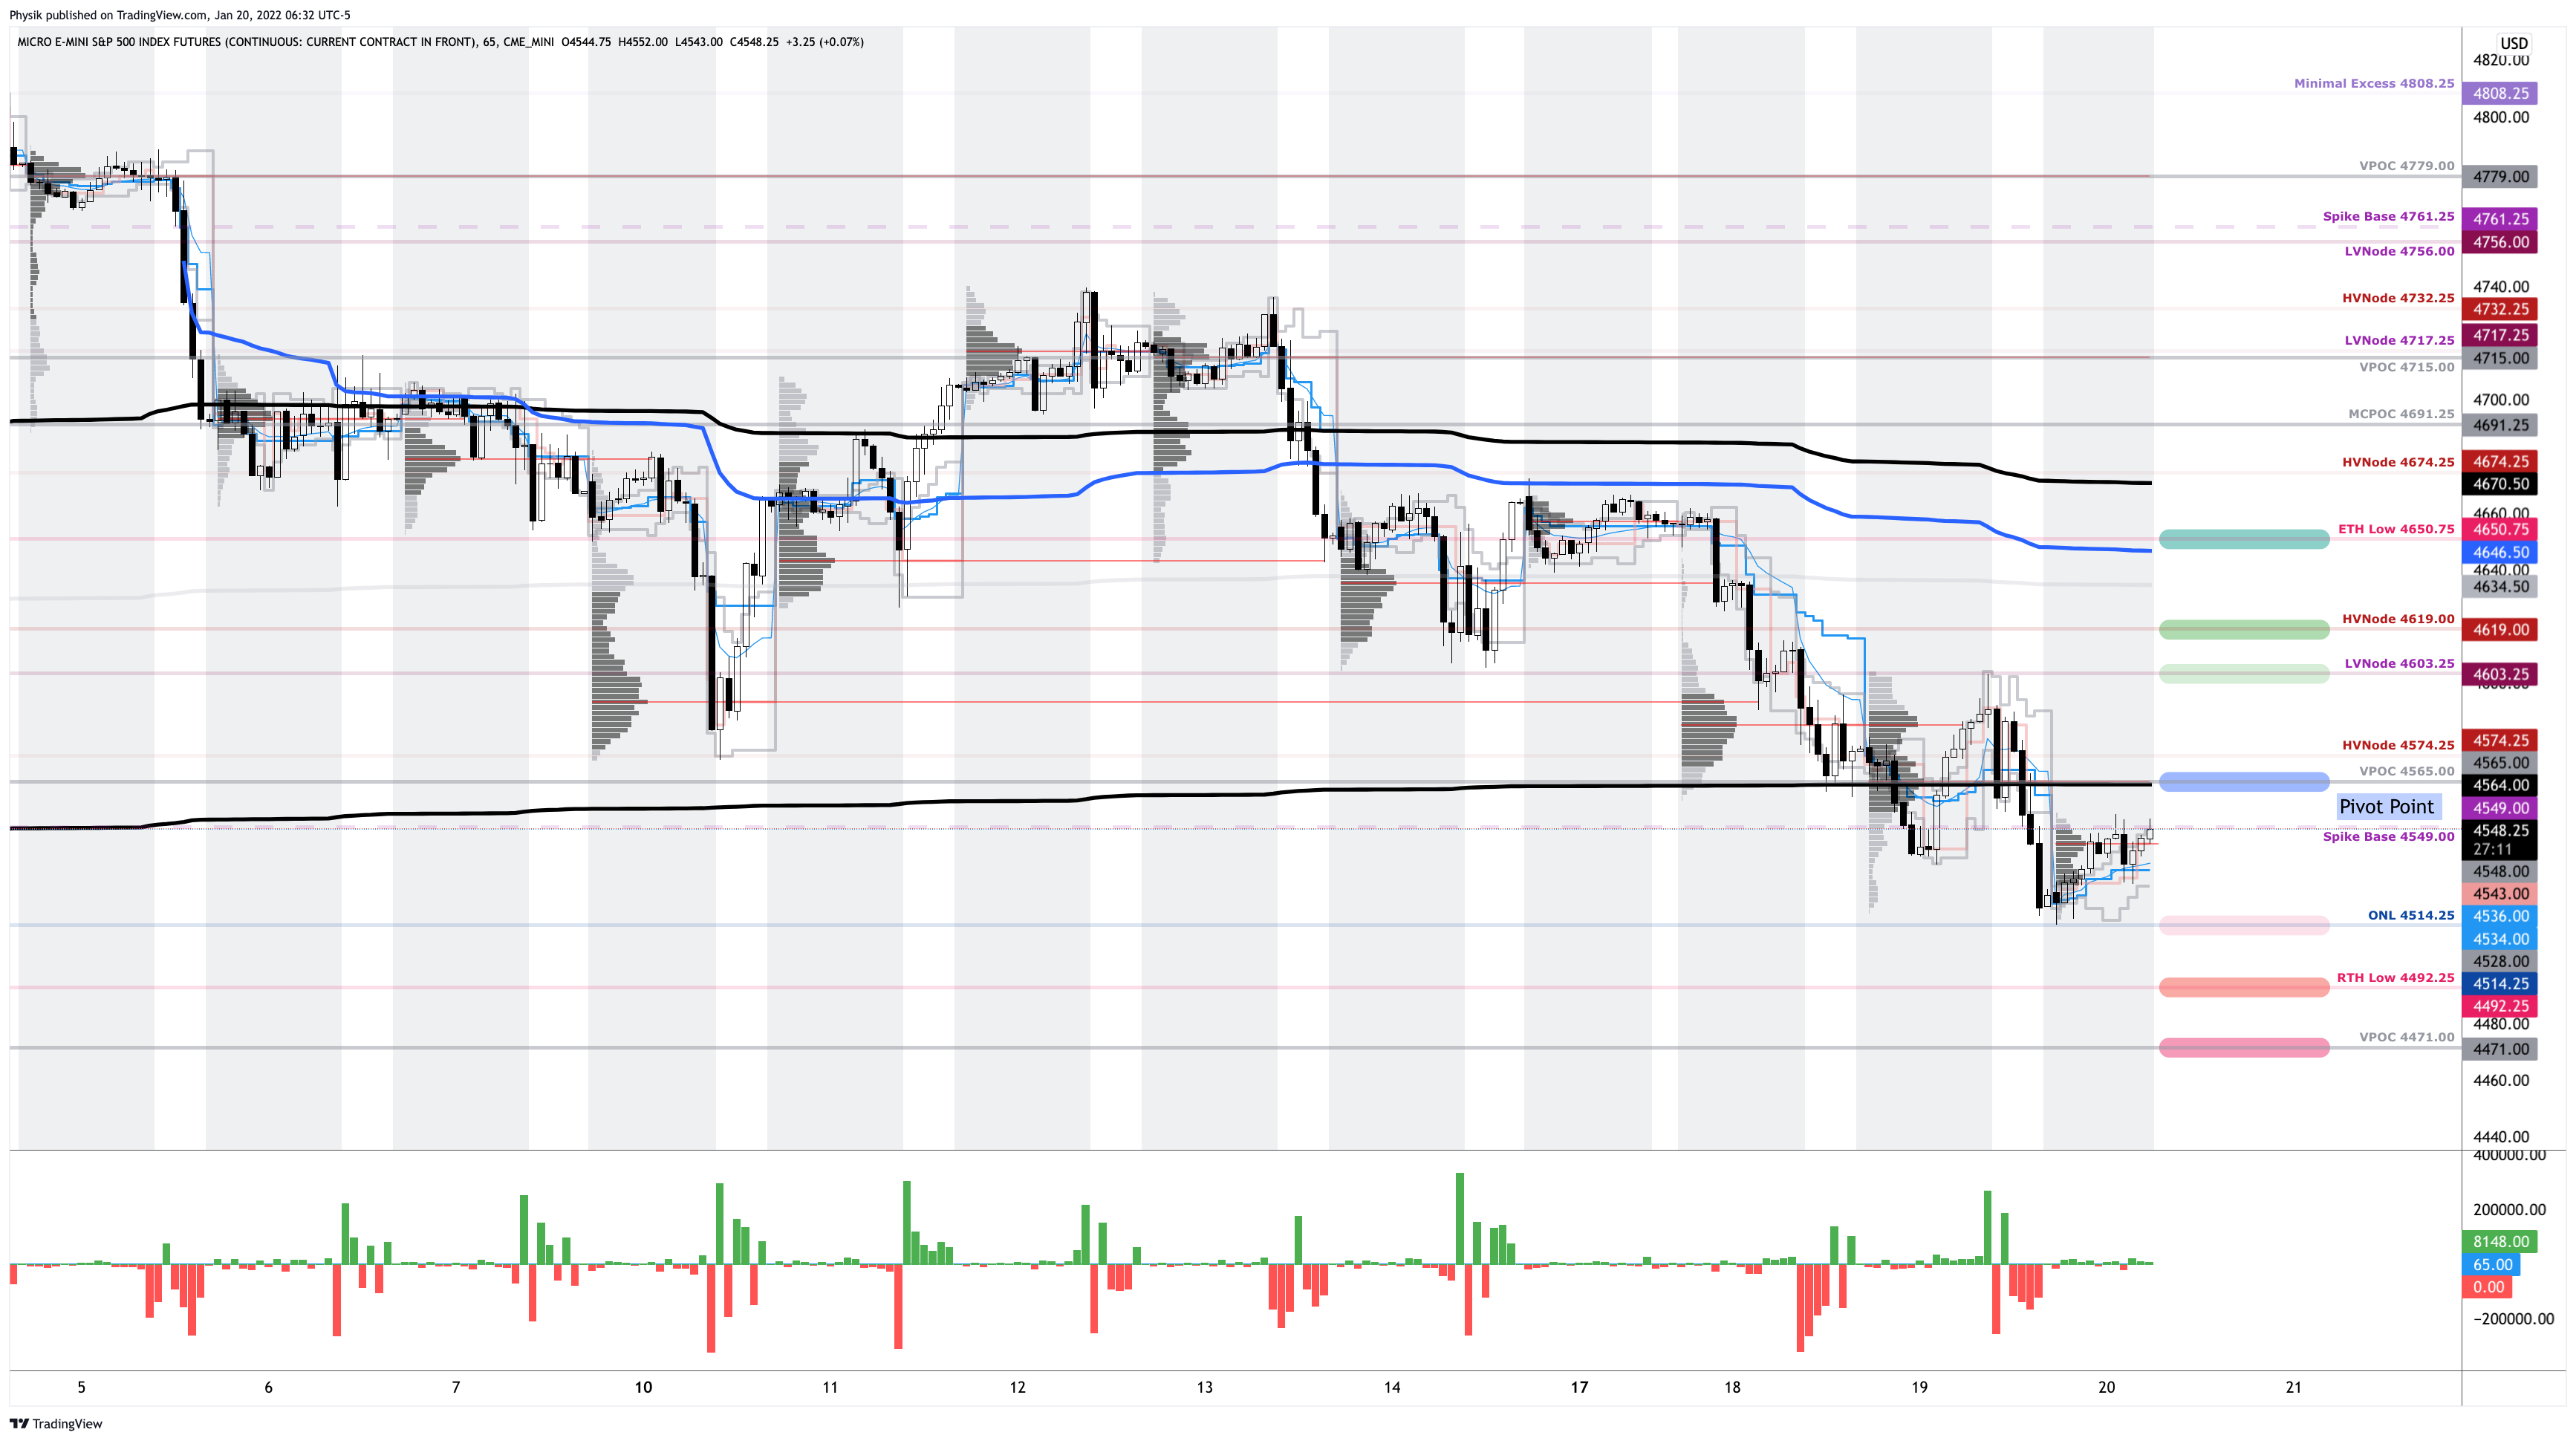
The spike base is at $4,549.00. Above bullish. Below bearish.

In the best case, the S&P 500 trades higher; activity above the $4,565.00 untested point of control (VPOC) puts in play the $4,603.25 low volume area (LVNode). Initiative trade beyond the LVNode could reach as high as the $4,619.00 HVNode and $4,650.75 extended trade low (ETH Low), or higher.

In the worst case, the S&P 500 trades lower; activity below the $4,565.00 VPOC puts in play the $4,514.25 overnight low (ONL). Initiative trade beyond the ONL could reach as low as the $4,492.25 regular trade low (RTH Low) and $4,471.00 VPOC, or lower.

Click here to load today’s key levels into the web-based TradingView charting platform. Note that all levels are derived using the 65-minute timeframe. New links are produced, daily.
Graphic: 65-minute profile chart of the Micro E-mini S&P 500 Futures.

Definitions

Overnight Rally Highs (Lows): Typically, there is a low historical probability associated with overnight rally-highs (lows) ending the upside (downside) discovery process.

Volume Areas: A structurally sound market will build on areas of high volume (HVNodes). Should the market trend for long periods of time, it will lack sound structure, identified as low volume areas (LVNodes). LVNodes denote directional conviction and ought to offer support on any test. 

If participants were to auction and find acceptance into areas of prior low volume (LVNodes), then future discovery ought to be volatile and quick as participants look to HVNodes for favorable entry or exit.

POCs: POCs are valuable as they denote areas where two-sided trade was most prevalent in a prior day session. Participants will respond to future tests of value as they offer favorable entry and exit.

MCPOCs: POCs are valuable as they denote areas where two-sided trade was most prevalent over numerous day sessions. Participants will respond to future tests of value as they offer favorable entry and exit.

Options Expiration (OPEX): Traditionally, option expiries mark an end to pinning (i.e, the theory that market makers and institutions short options move stocks to the point where the greatest dollar value of contracts will expire) and the reduction dealer gamma exposure.

About

After years of self-education, strategy development, mentorship, and trial-and-error, Renato Leonard Capelj began trading full-time and founded Physik Invest to detail his methods, research, and performance in the markets.

Capelj is also a Benzinga finance and technology reporter interviewing the likes of Shark Tank’s Kevin O’Leary, JC2 Ventures’ John Chambers, FTX’s Sam Bankman-Fried, and ARK Invest’s Catherine Wood, as well as a SpotGamma contributor developing insights around impactful options market dynamics.

Disclaimer

Physik Invest does not carry the right to provide advice.

In no way should the materials herein be construed as advice. Derivatives carry a substantial risk of loss. All content is for informational purposes only.
Categories
Commentary

Daily Brief For January 11, 2022

The Daily Brief is a free glimpse into the prevailing fundamental and technical drivers of U.S. equity market products. Join the 200+ that read this report daily, below!

What Happened

Overnight, equity index, commodity, and bond futures were sideways to higher. This is ahead of important Fed-speak; Federal Reserve Chair Jerome Powell speaks at 10:00 AM ET.

Graphic updated 6:40 AM ET. Sentiment Risk-On if expected /ES open is above the prior day’s range. /ES levels are derived from the profile graphic at the bottom of the following section. Levels may have changed since initially quoted; click here for the latest levels. SqueezeMetrics Dark Pool Index (DIX) and Gamma (GEX) calculations are based on where the prior day’s reading falls with respect to the MAX and MIN of all occurrences available. A higher DIX is bullish. At the same time, the lower the GEX, the more (expected) volatility. Learn the implications of volatility, direction, and moneyness. SHIFT data used for S&P 500 (INDEX: SPX) options activity. Note that options flow is sorted by the call premium spent; if more positive, then more was spent on call options. Breadth reflects a reading of the prior day’s NYSE Advance/Decline indicator. VIX reflects a current reading of the CBOE Volatility Index (INDEX: VIX) from 0-100.

What To Expect

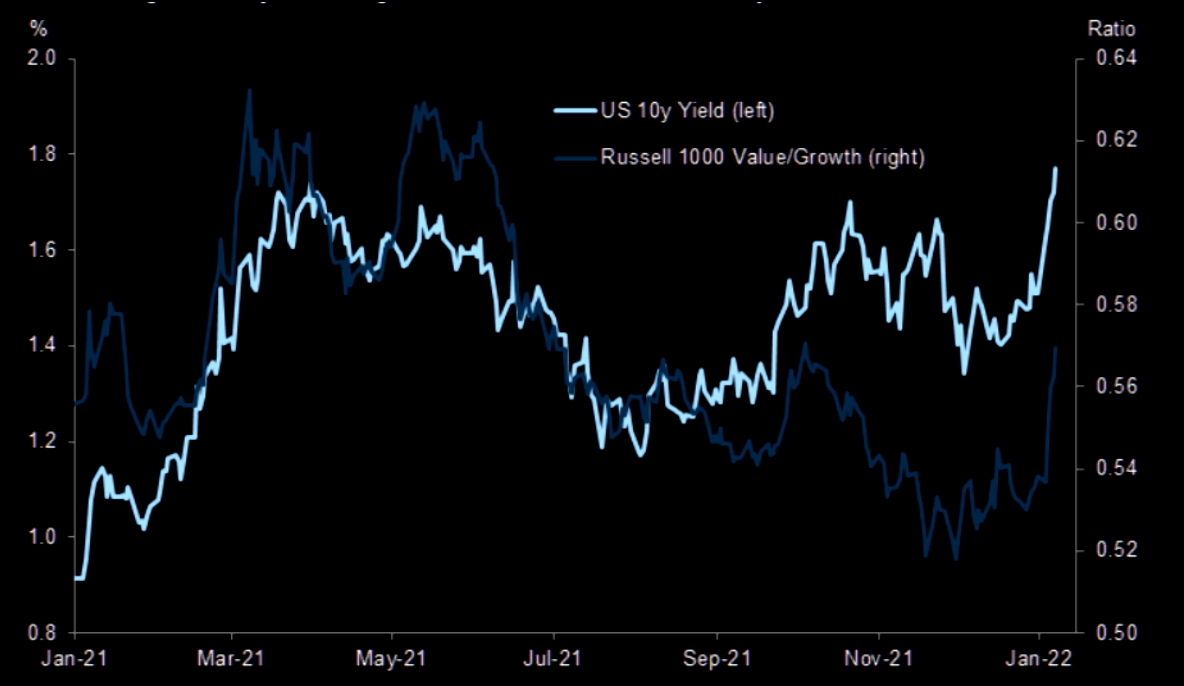
Fundamental: JPMorgan Chase & Co (NYSE: JPM) strategists led by Marko Kolanovic noted, yesterday, that the selloff is overdone, arguing higher rates would not derail the bull market. 

Graphic: Interest rates relative to Russell 1000 Value/Growth. Via The Market Ear, “Higher bond yields and growth-to-value rotation within equities.”

“The pullback in risk assets in reaction to the Fed minutes is arguably overdone,” Kolanovic said. “Policy tightening is likely to be gradual and at a pace, that risk assets should be able to handle, and is occurring in an environment of strong cyclical recovery.”

An analysis of equity market performance in the face of past rate spikes, suggests Kolanovic’s comments aren’t out of line. 

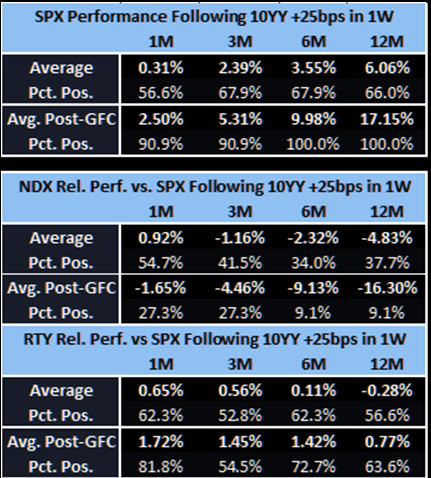
“We found that while SPX tends to see returns slow in the short term, the NDX and RTY actually tend to outperform on a 1M basis,” Jefferies Group says on S&P 500 (SPX), Nasdaq 100 (NDX), and Russell 2000 (RTY) performance post major rate spikes.

“Looking further out, the NDX (naturally) is the only of the three that flags. The SPX trends back toward its historical return profile and the RTY actually tends to beat the SPX in the intermediate to longer-term”.

Graphic: Taken The Market Ear. Original source Jefferies Group.

Beyond asset price support from a recovering economy, strong growth in business profits, rents, and other income, Moody’s Corporation (NYSE: MCO) believes another reason “financial markets are brushing off QT is that there will still be a lot of excess liquidity—a little less than $1 trillion— when the central bank’s balance sheet does begin to decline.”

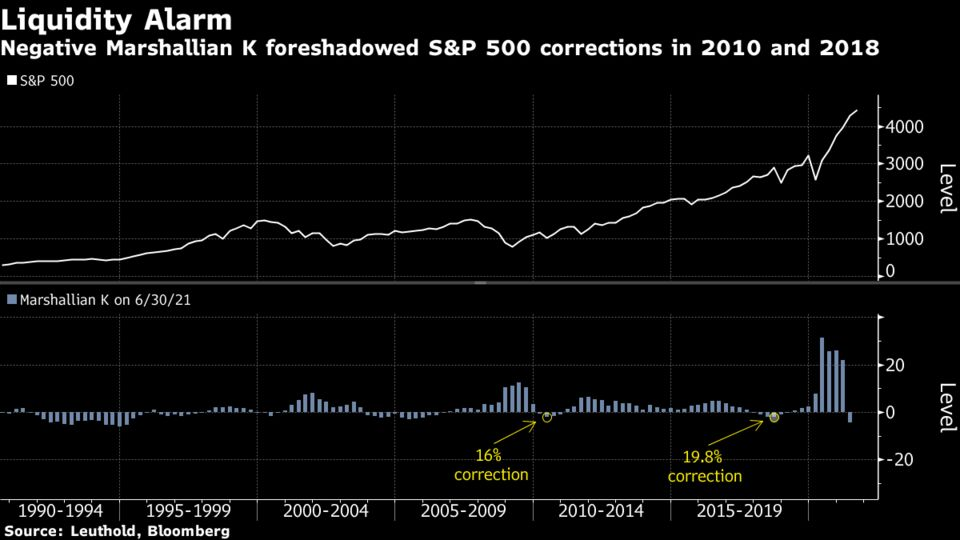
This excess liquidity is to shrink, naturally, as the economy grows quicker than the M2 money supply; the Marshallian K – the difference between year-over-year growth in M2 money supply and GDP – which had turned negative late last year (and prompted concerns around liquidity and its impact on the equity market) is now positive.

Graphic: Marshallian K had turned negative late last year. According to Bloomberg, “While stocks kept rising during frequent negative Marshallian K readings in the 1990s, the pattern since the 2008 global financial crisis — a period when the central bank was in what Ramsey calls a “perpetual crisis mode” — begs for caution.”

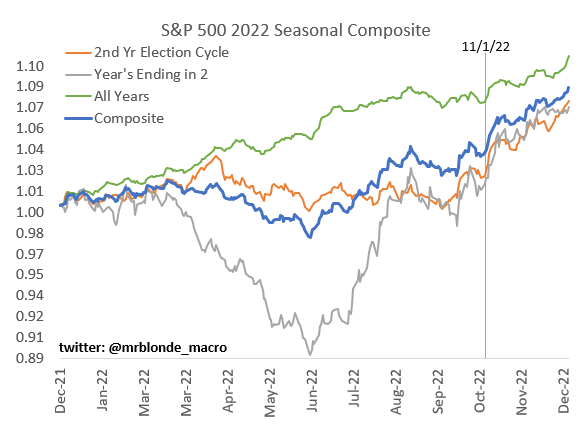
Notwithstanding, according to Callum Thomas, “[t]he election cycle + decennial cycle (i.e. that ‘years ending in 2’ line) suggest some challenging months ahead… (as opposed to the usual unconditional seasonal pattern).”

Graphic: Taken from Callum Thomas. Source: @mrblonde_macro.

Positioning: Heading into Monday’s session, the broader market was set to experience increased two-way volatility.

That happened. The S&P 500 and Nasdaq 100 explored lower but ended higher yesterday.

What’s next? There’s been a noticeable shift in relative strength. The Nasdaq 100 has firmed, relative to its counterparts, and overnight activity built on yesterday’s end-of-day advance.

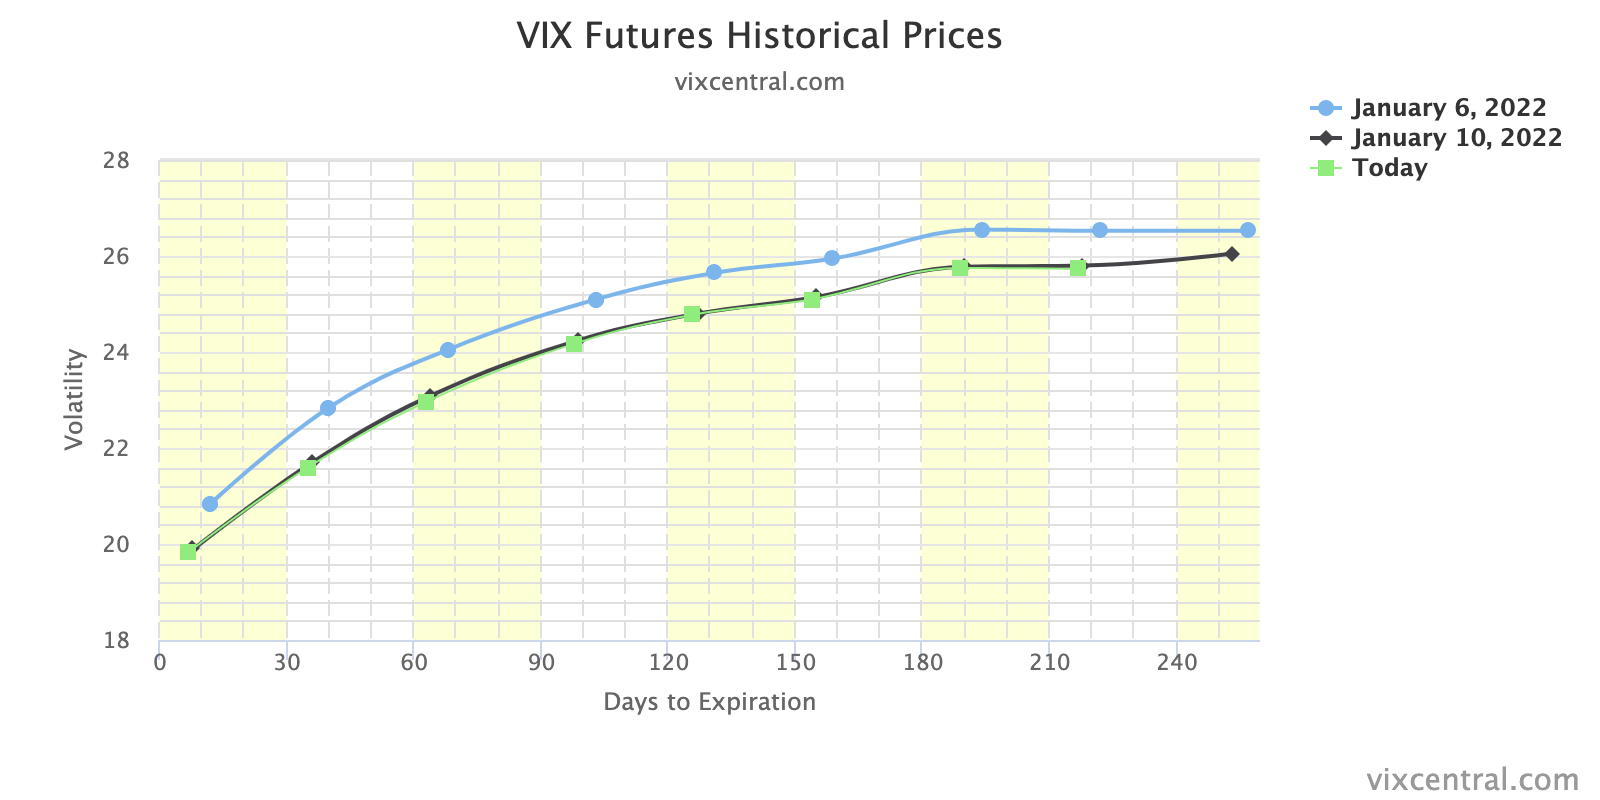
At the same time, the VIX term structure, a good gauge of fear, remained upward sloping and volatility (via the Cboe Volatility Index) compressed suggesting a reduction in the demand for protection. 

Graphic: Visualizing the compression in volatility.

All that means is that the opposite of what was expected heading into yesterday happened.

Recall, in demanding downside protection (buying a put), customers indirectly take liquidity as the counterparties hedge their short put exposure by selling underlying. 

Higher implied volatility marks up options delta (exposure to direction) and this leads to more selling, as hedging pressures exacerbate weakness.

Alongside yesterday’s end-of-day rally, lower implied volatility marked down options delta (exposure to direction). This lead to buying by the counterparty.

We can maintain the notion that despite markets tending toward instability so long as volatility is heightened and products (especially some constituents) remain in negative gamma, the dip lower and demand for protection may serve to prime the market for upside (when volatility starts to compress again and counterparties unwind hedges thus supporting any attempt higher).

“Failure to expand the range, lower, on the index level, at least, likely invokes supportive dealer hedging flows with respect to time (‘charm’) and volatility (‘vanna’),” SpotGamma.

Technical: As of 6:40 AM ET, Tuesday’s regular session (9:30 AM – 4:00 PM ET), in the S&P 500, will likely open in the upper part of a positively skewed overnight inventory, outside of prior-range and -value, suggesting a potential for immediate directional opportunity.

Gap Scenarios: Gaps ought to fill quickly. Should they not, that’s a signal of strength; do not fade. Leaving value behind on a gap-fill or failing to fill a gap (i.e., remaining outside of the prior session’s range) is a go-with indicator.

Auctioning and spending at least 1-hour of trade back in the prior range suggests a lack of conviction; in such a case, do not follow the direction of the most recent initiative activity.

In the best case, the S&P 500 trades higher; activity above the $4,674.25 high volume area (HVNode) puts in play the $4,691.25 micro composite point of control (MCPOC). Initiative trade beyond the MCPOC could reach as high as the $4,717.25 low volume area (LVNode) and $4,732.50 HVNode, or higher.

In the worst case, the S&P 500 trades lower; activity below the $4,674.25 HVNode puts in play the $4,647.25 HVNode. Initiative trade beyond the latter could reach as low as the $4,629.25 HVNode and $4,593.00 untested point of control (VPOC), or lower.

Click here to load today’s key levels into the web-based TradingView charting platform. Note that all levels are derived using the 65-minute timeframe. New links are produced, daily.
Graphic: 65-minute profile chart of the Micro E-mini S&P 500 Futures.

What People Are Saying

Definitions

Volume Areas: A structurally sound market will build on areas of high volume (HVNodes). Should the market trend for long periods of time, it will lack sound structure, identified as low volume areas (LVNodes). LVNodes denote directional conviction and ought to offer support on any test. 

If participants were to auction and find acceptance into areas of prior low volume (LVNodes), then future discovery ought to be volatile and quick as participants look to HVNodes for favorable entry or exit.

POCs: POCs are valuable as they denote areas where two-sided trade was most prevalent in a prior day session. Participants will respond to future tests of value as they offer favorable entry and exit.

MCPOCs: POCs are valuable as they denote areas where two-sided trade was most prevalent over numerous day sessions. Participants will respond to future tests of value as they offer favorable entry and exit.

About

After years of self-education, strategy development, mentorship, and trial-and-error, Renato Leonard Capelj began trading full-time and founded Physik Invest to detail his methods, research, and performance in the markets.

Capelj is also a Benzinga finance and technology reporter interviewing the likes of Shark Tank’s Kevin O’Leary, JC2 Ventures’ John Chambers, FTX’s Sam Bankman-Fried, and ARK Invest’s Catherine Wood, as well as a SpotGamma contributor developing insights around impactful options market dynamics.

Disclaimer

Physik Invest does not carry the right to provide advice.

In no way should the materials herein be construed as advice. Derivatives carry a substantial risk of loss. All content is for informational purposes only.
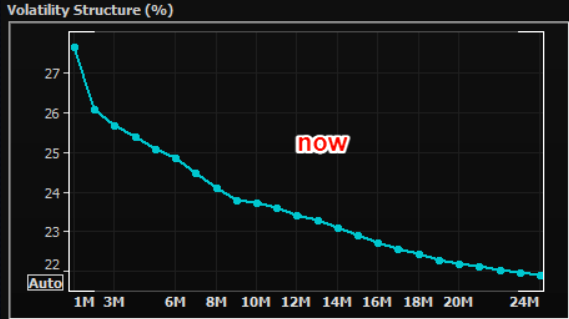
Categories
Commentary

Daily Brief For January 6, 2022

The Daily Brief is a free glimpse into the prevailing fundamental and technical drivers of U.S. equity market products. Join the 200+ that read this report daily, below!

What Happened

Equity index futures were lower on some hawkish commentary from the Federal Reserve.

Ahead is data on jobless claims and trade deficit (8:30 AM ET), the ISM services index, factory orders, and core capital goods orders (10:00 AM ET), as well as Fed-speak (1:15 PM ET).

Graphic updated 6:30 AM ET. Sentiment Risk-Off if expected /ES open is below the prior day’s range. /ES levels are derived from the profile graphic at the bottom of the following section. Levels may have changed since initially quoted; click here for the latest levels. SqueezeMetrics Dark Pool Index (DIX) and Gamma (GEX) calculations are based on where the prior day’s reading falls with respect to the MAX and MIN of all occurrences available. A higher DIX is bullish. At the same time, the lower the GEX, the more (expected) volatility. Learn the implications of volatility, direction, and moneyness. SHIFT data used for S&P 500 (INDEX: SPX) options activity. Note that options flow is sorted by the call premium spent; if more positive, then more was spent on call options. Breadth reflects a reading of the prior day’s NYSE Advance/Decline indicator. VIX reflects a current reading of the CBOE Volatility Index (INDEX: VIX) from 0-100.

What To Expect

Fundamental: Yesterday, participants were provided further clarity around the Federal Reserve’s intent to hike interest rates and taper the pace of asset buying. 

“At first blush, the December FOMC minutes read hawkish, and the market reaction supports this,” said Cliff Hodge, chief investment officer for Cornerstone Wealth. 

“The fact that FOMC participants are discussing faster and more aggressive rate hikes, alongside a faster pace of balance sheet normalization than the last hiking, indicate that the Fed put for the stock market has been repriced lower.”

The news coincided with a fast move higher in Treasury yields and weakness in the growth- and innovation-heavy Nasdaq-100. 

Graphic: Via The Market Ear, JPMorgan Chase & Co analyzes sector and yield correlations.

This is as higher rates have the potential to decrease the present value of future earnings making stocks, especially those that are high growth, less attractive.

Recall yesterday’s commentary touching on the implications of tight monetary frameworks and less liquidity, so to speak. 

In short, easy monetary frameworks pushed participants out the risk curve. 

As a result, removal of liquidity, in the face of increased exposure to risk across different assets, can result in “hedging and de-leveraging cascades that affect the stability of all markets,” as well put in one article I recently wrote.

“These derivatives are incredibly embedded in how the tail reacts and there’s not enough liquidity, given the leverage, if the Fed were to taper,” is one way to put it, additionally.

Positioning: Wednesday’s session unwound some of the single-stock bullishness that fed into S&P 500, itself. 

Recall that Monday saw the selling of upside (call) and downside (put) protection. Tuesday saw more of the former, and that promoted some of the reversion, for lack of better phrasing.

Heading into Wednesday, volatility continued compressing. This is all the while the counterparty to the aforementioned trade was taking on more exposure to positive delta. 

Why? Well, with any price rise, gamma (or how an option’s delta is expected to change given a change in the underlying) is added to the delta. 

Counterparties are to offset gamma by adding liquidity (as can be approximated with thickening of book depth, below) to the market (i.e., buy dips, sell rips).

Therefore, as stated, yesterday, the continued compression of volatility would serve to bolster any price rise as “hedging vanna and charm flows, and whatnot will push the markets higher.”

The tone changed, however. According to SpotGamma data (click here to learn more about access), customers sold upside (call) and bought downside (put) protection. The demand for puts accelerated after the release of FOMC minutes as can be seen via the chart, below.

Graphic: SpotGamma’s Hedging Impact of Real-Time Options (HIRO) indicator suggested negative options delta trades in SPY likely had dealers selling into the close.

That demand for protection coincided with an expansion in volatility; all else equal, higher implied volatility marks up options delta (exposure to direction).

Graphic: SHIFT Search confirms SpotGamma data.

With put buying, for instance, customers are indirectly taking liquidity and destabilizing the market as the market maker short the put will sell underlying to neutralize directional risk.

Higher implied volatility, higher delta, more selling. Hedging exacerbated weakness at the index and single-stock level, yesterday.

Graphic: SqueezeMetrics details the implications of customer activity in the options market, on the underlying’s order book.

Taking into account the aforementioned positioning, versus buying pressure (measured via short sales or liquidity provision on the market-making side), positioning metrics remain positively skewed, better than before.

Graphic: Data SqueezeMetrics. Graph via Physik Invest.

Though the dip lower and demand for protection may serve to prime the market for upside (when volatility starts to compress again and counterparties unwind hedges thus supporting any attempt higher), markets will tend toward instability so long as volatility is heightened and the market remains in short-gamma territory.

Technical: As of 6:30 AM ET, Thursday’s regular session (9:30 AM – 4:00 PM ET), in the S&P 500, will likely open in the middle part of a negatively skewed overnight inventory, just outside of prior-range and -value, suggesting a potential for immediate directional opportunity.

Spike Scenario In Play: Spike’s mark the beginning of a break from value. Spikes higher (lower) are validated by trade at or above (below) the spike base (i.e., the origin of the spike).

Spike base is at $4,761.25. Above, bullish. Below, bearish.

In the best case, the S&P 500 trades higher; activity above the $4,691.25 micro composite point of control (MCPOC) puts in play the $4,717.25 low volume area (LVNode). Initiative trade beyond the LVNode could reach as high as the $4,732.50 high volume area (HVNode) and $4,756.00 LVNode, or higher.

In the worst case, the S&P 500 trades lower; activity below the $4,691.25 MCPOC puts in play the $4,674.25 HVNode. Initiative trade beyond the latter could reach as low as the $4,647.25 HVNode and $4,623.00 point of control (POC), or lower.

Click here to load today’s key levels into the web-based TradingView charting platform. Note that all levels are derived using the 65-minute timeframe. New links are produced, daily.
Graphic: 65-minute profile chart of the Micro E-mini S&P 500 Futures.

What People Are Saying

Definitions

Volume Areas: A structurally sound market will build on areas of high volume (HVNodes). Should the market trend for long periods of time, it will lack sound structure, identified as low volume areas (LVNodes). LVNodes denote directional conviction and ought to offer support on any test. 

If participants were to auction and find acceptance into areas of prior low volume (LVNodes), then future discovery ought to be volatile and quick as participants look to HVNodes for favorable entry or exit.

DIX: For every buyer is a seller (usually a market maker). Using DIX — which is derived from short sales (i.e., liquidity provision on the market-making side) — we can measure buying pressure.

Gamma: Gamma is the sensitivity of an option to changes in the underlying price. Dealers that take the other side of options trades hedge their exposure to risk by buying and selling the underlying. When dealers are short-gamma, they hedge by buying into strength and selling into weakness. When dealers are long-gamma, they hedge by selling into strength and buying into weakness. The former exacerbates volatility. The latter calms volatility.

Vanna: The rate at which the delta of an option changes with respect to volatility.

Charm: The rate at which the delta of an option changes with respect to time.

Options: If an option buyer was short (long) stock, he or she would buy a call (put) to hedge upside (downside) exposure. Option buyers can also use options as an efficient way to gain directional exposure.

POCs: POCs are valuable as they denote areas where two-sided trade was most prevalent in a prior day session. Participants will respond to future tests of value as they offer favorable entry and exit.

MCPOCs: POCs are valuable as they denote areas where two-sided trade was most prevalent over numerous day sessions. Participants will respond to future tests of value as they offer favorable entry and exit.

About

After years of self-education, strategy development, mentorship, and trial-and-error, Renato Leonard Capelj began trading full-time and founded Physik Invest to detail his methods, research, and performance in the markets.

Capelj is also a Benzinga finance and technology reporter interviewing the likes of Shark Tank’s Kevin O’Leary, JC2 Ventures’ John Chambers, FTX’s Sam Bankman-Fried, and ARK Invest’s Catherine Wood, as well as a SpotGamma contributor developing insights around impactful options market dynamics.

Disclaimer

Physik Invest does not carry the right to provide advice.

In no way should the materials herein be construed as advice. Derivatives carry a substantial risk of loss. All content is for informational purposes only.
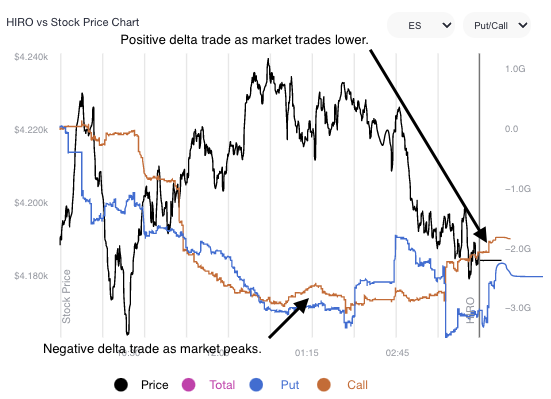
Categories
Commentary

Daily Brief For January 5, 2022

The Daily Brief is a free glimpse into the prevailing fundamental and technical drivers of U.S. equity market products. Join the 200+ that read this report daily, below!

What Happened

Overnight, equity indices auctioned sideways to lower after a failed balance-area breakout resulted in a rotation back toward the most accepted (or traded at) price levels over two weeks.

Ahead is data on ADP National Employment Report (8:15 AM ET), Markit Services PMI (9:45 AM ET), and FOMC minutes (2:00 PM ET).

Graphic updated 6:30 AM ET. Sentiment Neutral if expected /ES open is inside of the prior day’s range. /ES levels are derived from the profile graphic at the bottom of the following section. Levels may have changed since initially quoted; click here for the latest levels. SqueezeMetrics Dark Pool Index (DIX) and Gamma (GEX) calculations are based on where the prior day’s reading falls with respect to the MAX and MIN of all occurrences available. A higher DIX is bullish. At the same time, the lower the GEX, the more (expected) volatility. Learn the implications of volatility, direction, and moneyness. SHIFT data used for S&P 500 (INDEX: SPX) options activity. Note that options flow is sorted by the call premium spent; if more positive, then more was spent on call options. Breadth reflects a reading of the prior day’s NYSE Advance/Decline indicator. VIX reflects a current reading of the CBOE Volatility Index (INDEX: VIX) from 0-100.

What To Expect

Fundamental: Today, participants ought to get further clarity around the timing of the Federal Reserve’s first interest-rate hike and its taper to the pace of asset buying.

The central bank doubled the pace of tapering in mid-December, setting the stage for rate hikes, later in 2022.

According to Bloomberg, expected are three quarter-percentage-point increases in the key federal funds rate target in 2022. 

Graphic: The “annual rate of change in the Fed Funds rate” via topdowncharts.com.

This expectation has coincided with a move higher in Treasury yields and weakness in the growth- and innovation-heavy Nasdaq 100. 

Recall that inflation and rates move inverse to each other. In defending against the pressures of inflation, higher rates have the potential to decrease the present value of future earnings making stocks, especially those that are high growth, less attractive.

Graphic: Via Bloomberg, “Fed Chair Jerome Powell at his press conference after last month’s meeting said that policy makers eventually ‘expect a gradual pace of policy firming.’ They don’t anticipate raising rates before ending the taper process, but could hike before reaching full employment, he added.”

Moreover, a concern is that “[t]he minutes could hint at a quicker start to shrinking the balance sheet than after the prior tapering.”

With the equity market rallying on the back of easy monetary frameworks and max liquidity, markets diverged from fundamentals.

Reductions in the balance sheet (i.e., removal of liquidity) may help prick the bubble. 

Additionally, with the use of leveraged products trending higher than in the past, cross-asset correlations increase with volatility and stress. This may result in “hedging and de-leveraging cascades that affect the stability of all markets,” as well put in one article I recently wrote.

In other words, the response by customers, as well as the dynamics of dealers’ risk exposure to direction and volatility, can cause violent crash dynamics to transpire, further cutting into liquidity, and aiding an unraveling.

“It’s not a coincidence that the mid-February to mid-March 2020 downturn literally started the day after February expiration and ended the day of March quarterly expiration,” Kai Volatility’s Cem Karsan once told me. “These derivatives are incredibly embedded in how the tail reacts and there’s not enough liquidity, given the leverage, if the Fed were to taper.”

See the graphic below for implications of customers’ demands for downside protection.

Graphic: SqueezeMetrics details the implications of customer activity in the options market, on the underlying’s order book. For instance, in selling a put, customers add liquidity and stabilize the market. How? The market maker long the put will buy (sell) the underlying to neutralize directional risk as price falls (rises).

Positioning: Pursuant to some of the comments made in yesterday’s commentary, expected is a continued compression in volatility. 

Monday saw the selling of upside (call) and downside (put) protection. Tuesday saw more of the former, and that promoted some of the reversion, for lack of better phrasing, seen yesterday.

Recall that the participant on the other side of this dominant trade is taking on more exposure to positive delta. 

Why? Well, with any price rise, gamma (or how an option’s delta is expected to change given a change in the underlying) is added to the delta. Counterparties are to offset gamma by adding liquidity (as can be approximated with thickening of book depth, below) to the market (i.e., buy dips, sell rips).

Graphic: Analysis of book depth for the E-mini S&P 500 futures contract, via CME Group Inc’s (NASDAQ: CME) Liquidity Tool. For more on the implications of participants’ options positioning and dealer hedging, read here.

The continued compression of volatility will only serve to bolster any price rise as “hedging vanna and charm flows, and whatnot will push the markets higher.”

Were participants to reach for downside protection, markets will tend toward instability. Not seeing this yet.

Graphic: The “Biggest tail risk to SPX isn’t any macro data/virus/war but its own options market.”

Technical: As of 6:40 AM ET, Wednesday’s regular session (9:30 AM – 4:00 PM ET), in the S&P 500, will likely open in the middle part of a negatively skewed overnight inventory, inside of prior-range and -value, suggesting a limited potential for immediate directional opportunity.

Balance (Two-Timeframe Or Bracket) Scenarios: Rotational trade that denotes current prices offer favorable entry and exit. Balance-areas make it easy to spot a change in the market (i.e., the transition from two-time frame trade, or balance, to one-time frame trade, or trend). 

Modus operandi is responsive trade (i.e., fade the edges), rather than initiative trade (i.e., play the break).

In the best case, the S&P 500 trades higher; activity above the $4,783.75 micro composite point of control (MCPOC) puts in play the $4,808.25 minimal excess high. Initiative trade beyond the $4,808.25 figure could reach as high as the $4,814.00 and $4,832.25 extension, or higher.

In the worst case, the S&P 500 trades lower; activity below the $4,783.75 MCPOC puts in play the $4,756.00 low volume area (LVNode). Initiative trade beyond the LVNode could reach as low as the $4,732.50 high volume area (HVNode) and $4,717.25 LVNode, or lower.

Considerations: The aforementioned trade in the S&P 500 marks a potential willingness to continue balance, and it is built on poor structure, a dynamic that adds to technical instability.

On a liquidation that finds acceptance (i.e., more than 30-minutes of trade at a particular price level) below $4,756.00, there is increased potential for a fast move lower to $4,732.50 or lower.

This is as there has been a persistence of responses to technical levels; weaker-handed participants (which seldom defend retests) are carrying a heavier hand in recent discovery.

With that, any penetration of low-volume pockets – voids like gaps that can be seen on a chart – there ought to be follow-through as the participants that were most active at those levels run for the exits.

Click here to load today’s key levels into the web-based TradingView charting platform. Note that all levels are derived using the 65-minute timeframe. New links are produced, daily.
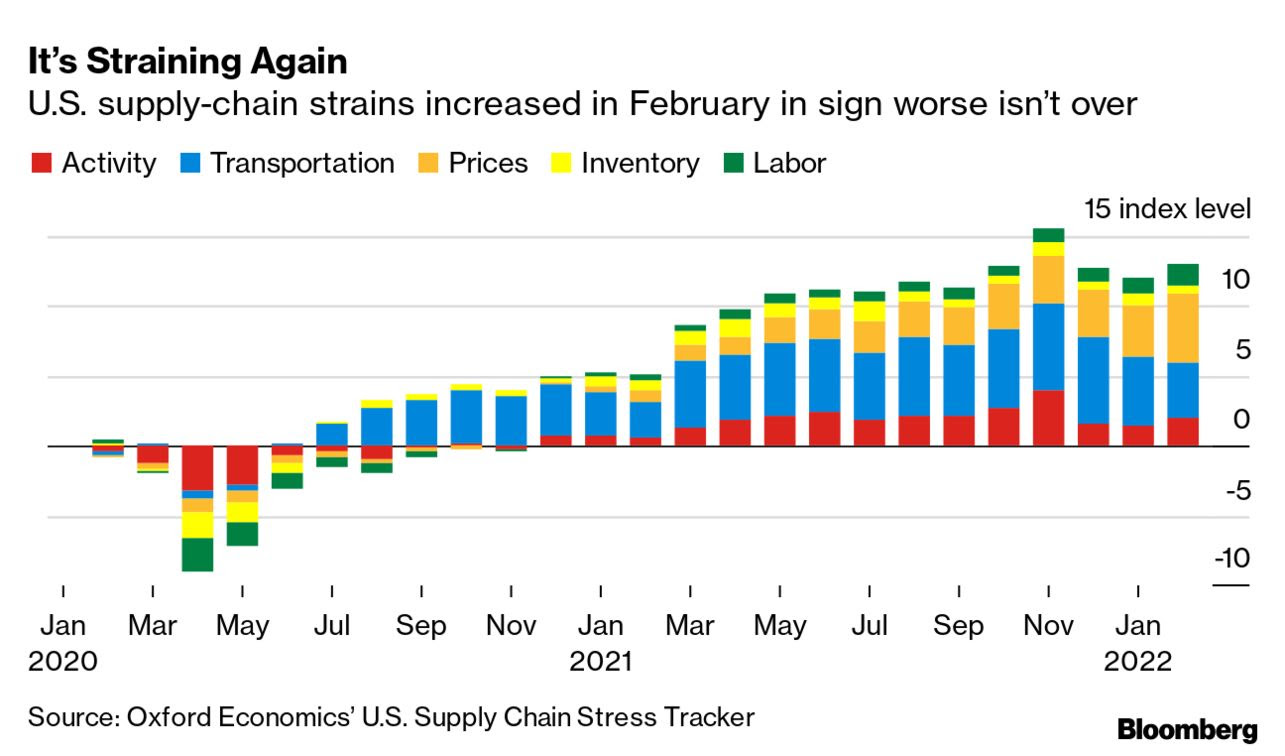
Graphic: 65-minute profile chart of the Micro E-mini S&P 500 Futures.

What People Are Saying

Definitions

Volume Areas: A structurally sound market will build on areas of high volume (HVNodes). Should the market trend for long periods of time, it will lack sound structure, identified as low volume areas (LVNodes). LVNodes denote directional conviction and ought to offer support on any test. 

If participants were to auction and find acceptance into areas of prior low volume (LVNodes), then future discovery ought to be volatile and quick as participants look to HVNodes for favorable entry or exit.

Gamma: Gamma is the sensitivity of an option to changes in the underlying price. Dealers that take the other side of options trades hedge their exposure to risk by buying and selling the underlying. When dealers are short-gamma, they hedge by buying into strength and selling into weakness. When dealers are long-gamma, they hedge by selling into strength and buying into weakness. The former exacerbates volatility. The latter calms volatility.
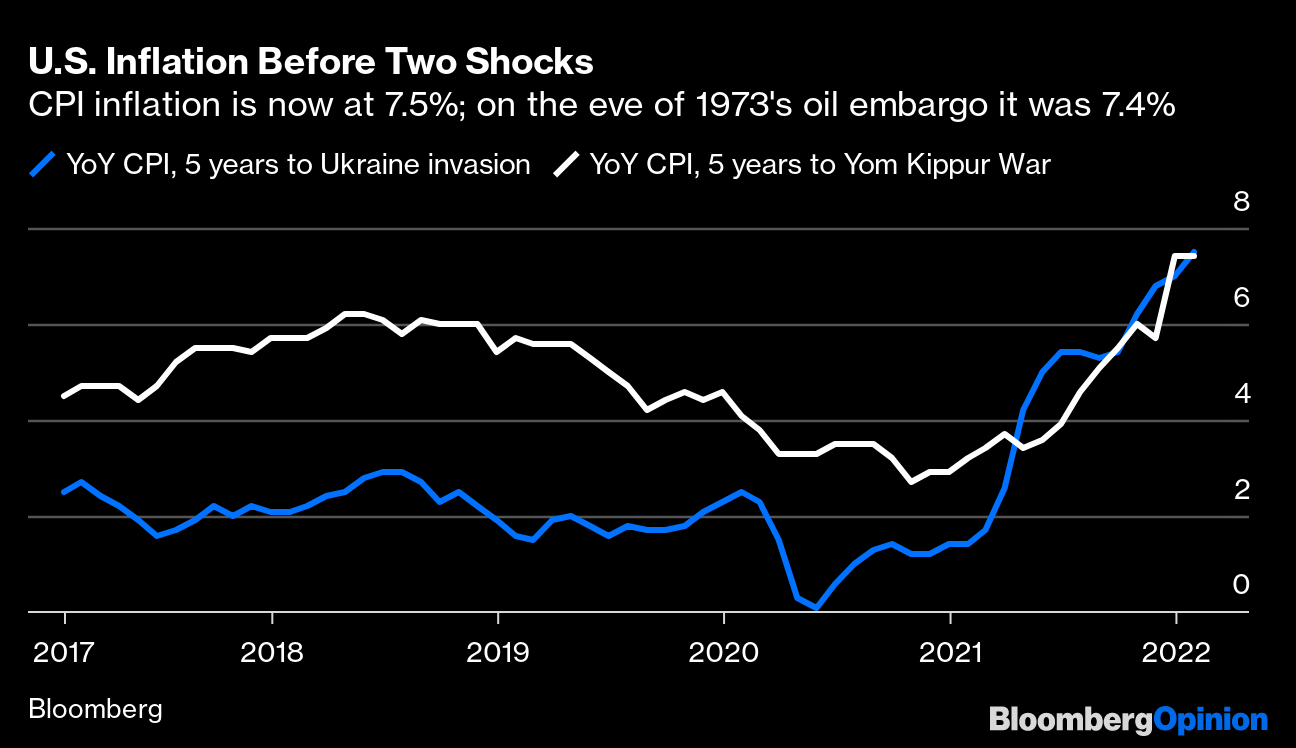
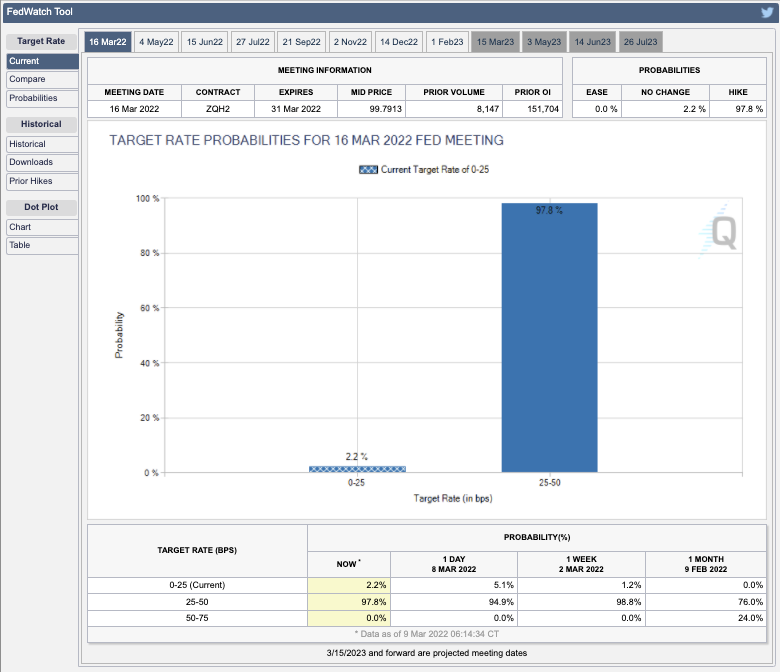
Vanna: The rate at which the delta of an option changes with respect to volatility.
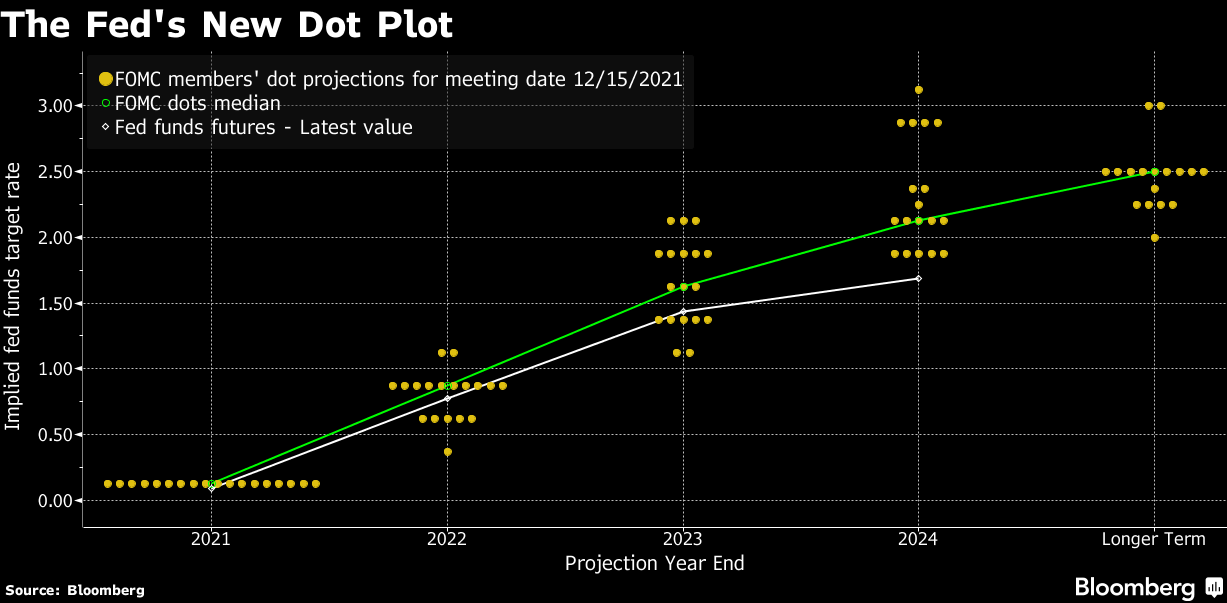
Charm: The rate at which the delta of an option changes with respect to time.
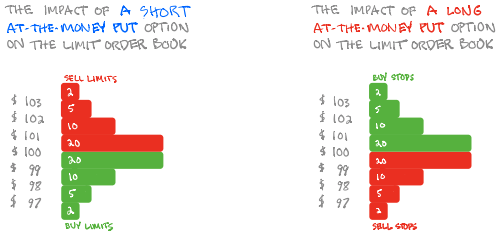
Options: If an option buyer was short (long) stock, he or she would buy a call (put) to hedge upside (downside) exposure. Option buyers can also use options as an efficient way to gain directional exposure.

MCPOCs: POCs are valuable as they denote areas where two-sided trade was most prevalent over numerous day sessions. Participants will respond to future tests of value as they offer favorable entry and exit.

Excess: A proper end to price discovery; the market travels too far while advertising prices. Responsive, other-timeframe (OTF) participants aggressively enter the market, leaving tails or gaps which denote unfair prices.

About

After years of self-education, strategy development, mentorship, and trial-and-error, Renato Leonard Capelj began trading full-time and founded Physik Invest to detail his methods, research, and performance in the markets.

Capelj is also a Benzinga finance and technology reporter interviewing the likes of Shark Tank’s Kevin O’Leary, JC2 Ventures’ John Chambers, FTX’s Sam Bankman-Fried, and ARK Invest’s Catherine Wood, as well as a SpotGamma contributor developing insights around impactful options market dynamics.

Disclaimer

Physik Invest does not carry the right to provide advice.

In no way should the materials herein be construed as advice. Derivatives carry a substantial risk of loss. All content is for informational purposes only.