Categories
Commentary

Daily Brief For December 2, 2021

What Happened

Overnight, equity index futures steadied at the prior day’s lows

There were signs of a shift in relative strength as the Russell 2000’s extended-day recovery outpaced that of the S&P 500 and (now) weaker Nasdaq 100. 

At the same time, yields on the ten-year rose while volatility came in. Still, the VIX futures term structure remained higher, a clear indication of stress, in the face of demand for protection.

Ahead is data on jobless claims (8:30 AM ET) with Fed-speak scattered throughout the day.
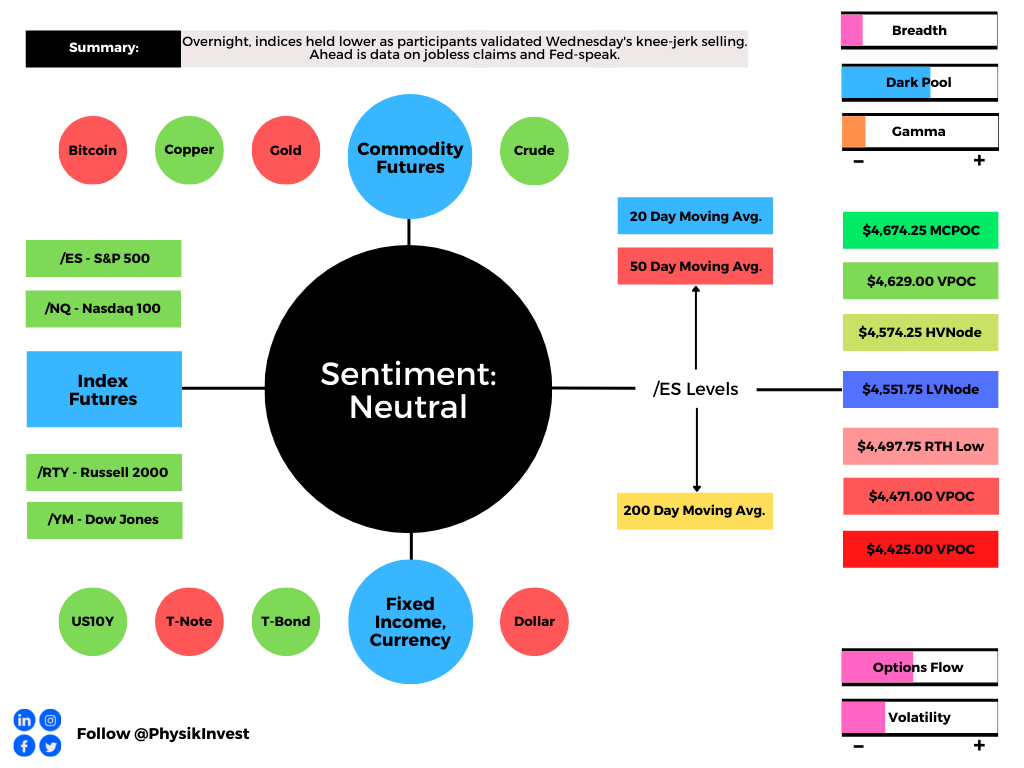
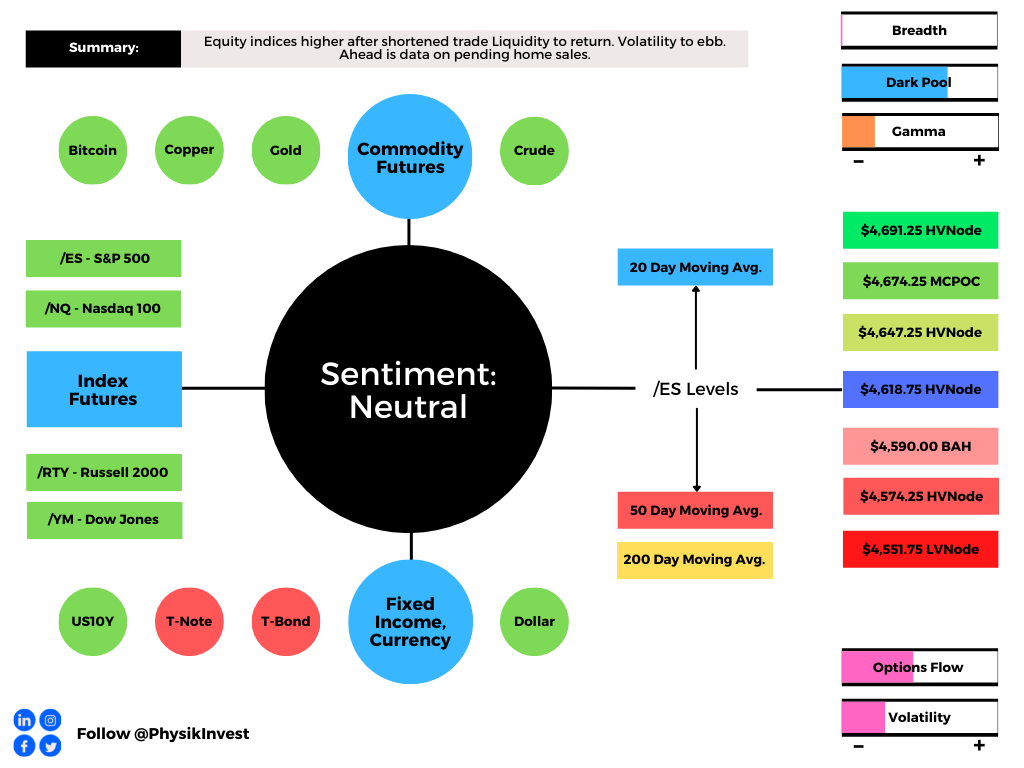
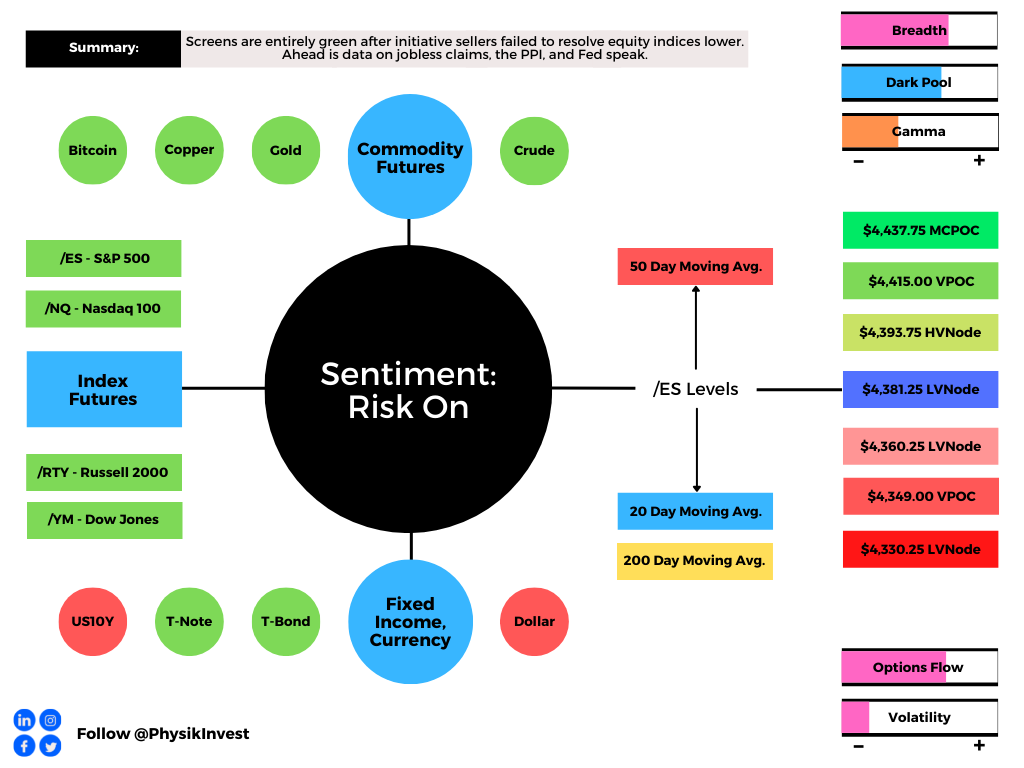
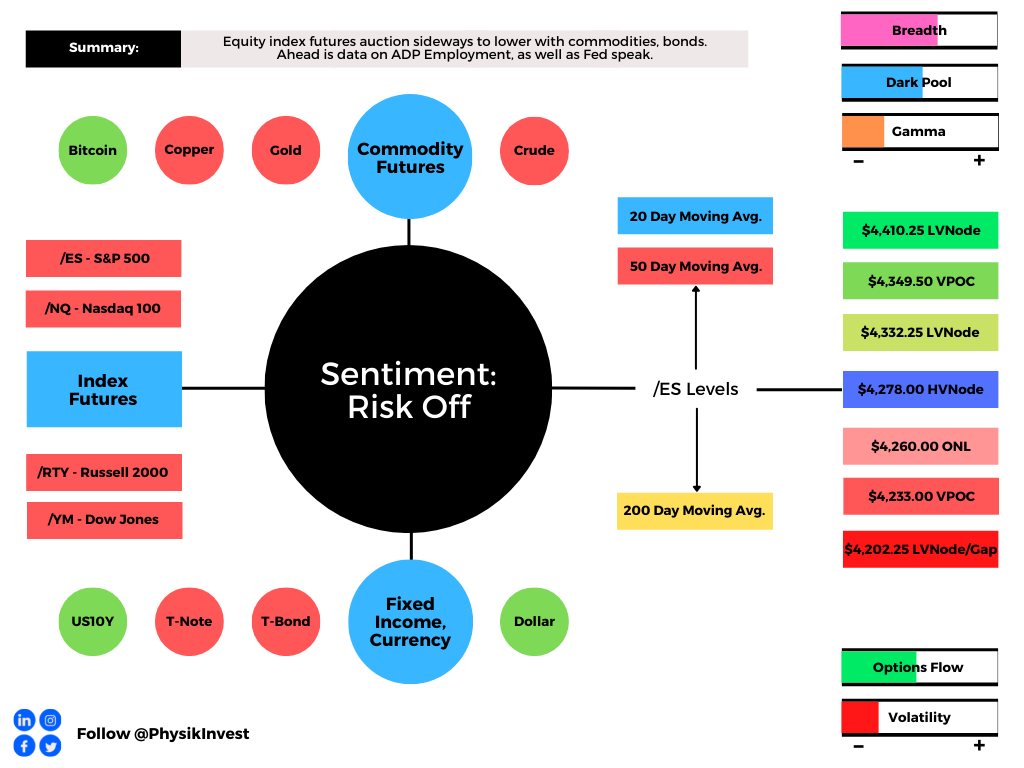
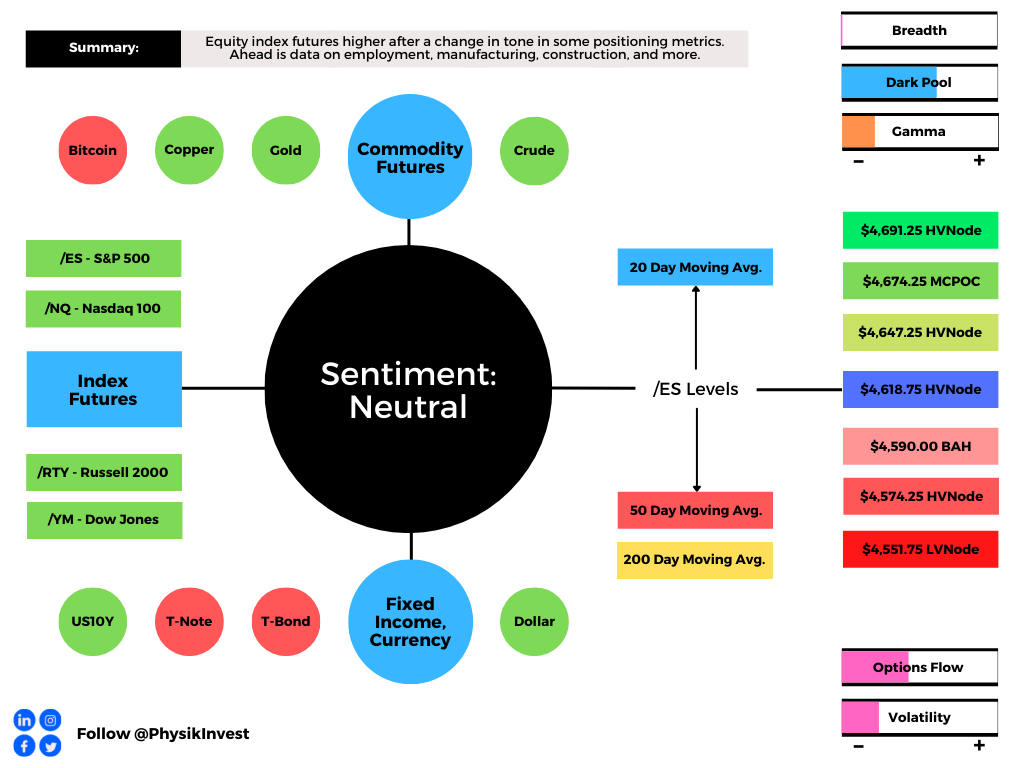
Graphic updated 6:40 AM ET. Sentiment Neutral if expected /ES open is inside of the prior day’s range. /ES levels are derived from the profile graphic at the bottom of the following section. Levels may have changed since initially quoted; click here for the latest levels. SqueezeMetrics Dark Pool Index (DIX) and Gamma (GEX) calculations are based on where the prior day’s reading falls with respect to the MAX and MIN of all occurrences available. A higher DIX is bullish. At the same time, the lower the GEX, the more (expected) volatility. Learn the implications of volatility, direction, and moneyness. SHIFT data used for S&P 500 (INDEX: SPX) options activity. Note that options flow is sorted by the call premium spent; if more positive then more was spent on call options. Breadth reflects a reading of the prior day’s NYSE Advance/Decline indicator. VIX reflects a current reading of the CBOE Volatility Index (INDEX: VIX) from 0-100.

What To Expect

On nonparticipatory breadth and weak market liquidity metrics, the worst-case outcome occurred, evidenced by the S&P 500’s spike away from the value (i.e., the prices at which 70% of the day’s volume occurred).

The knee-jerk selling, which coincided with news that a COVID-19 variant was spotted in the U.S., broke the S&P 500 out of a short-term consolidation (i.e., balance) area. 

The developing balance was a result of participants looking for new information to base a directional move. With new information, participants chose downside price exploration.

Adding, the knee-jerk selling and associated price action left behind poor structure (i.e., participants will look to validate [or invalidate] the move, spending time below [or above] the ~$4,574.25 spike base). Caution is warranted on overnight validation of the spike. 
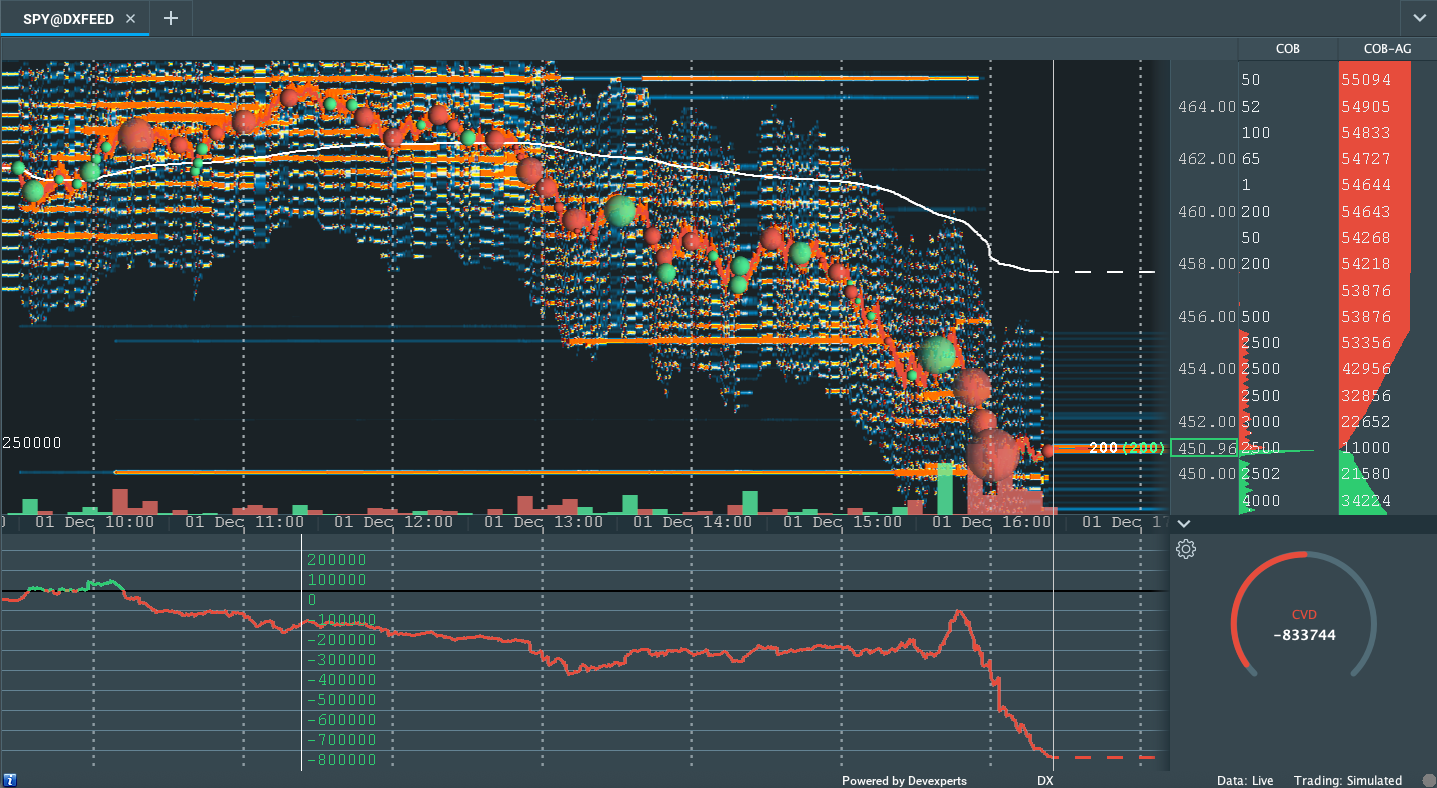
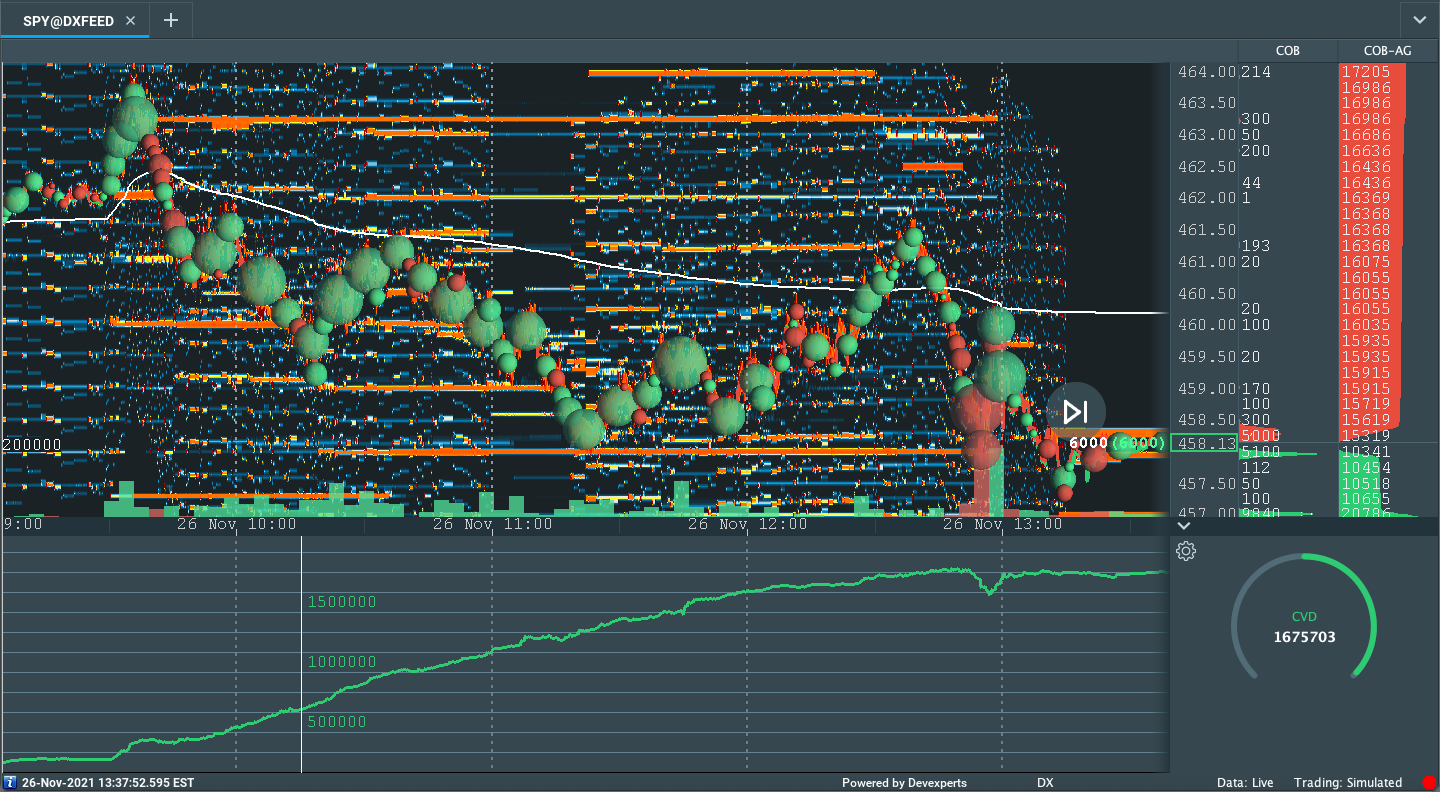
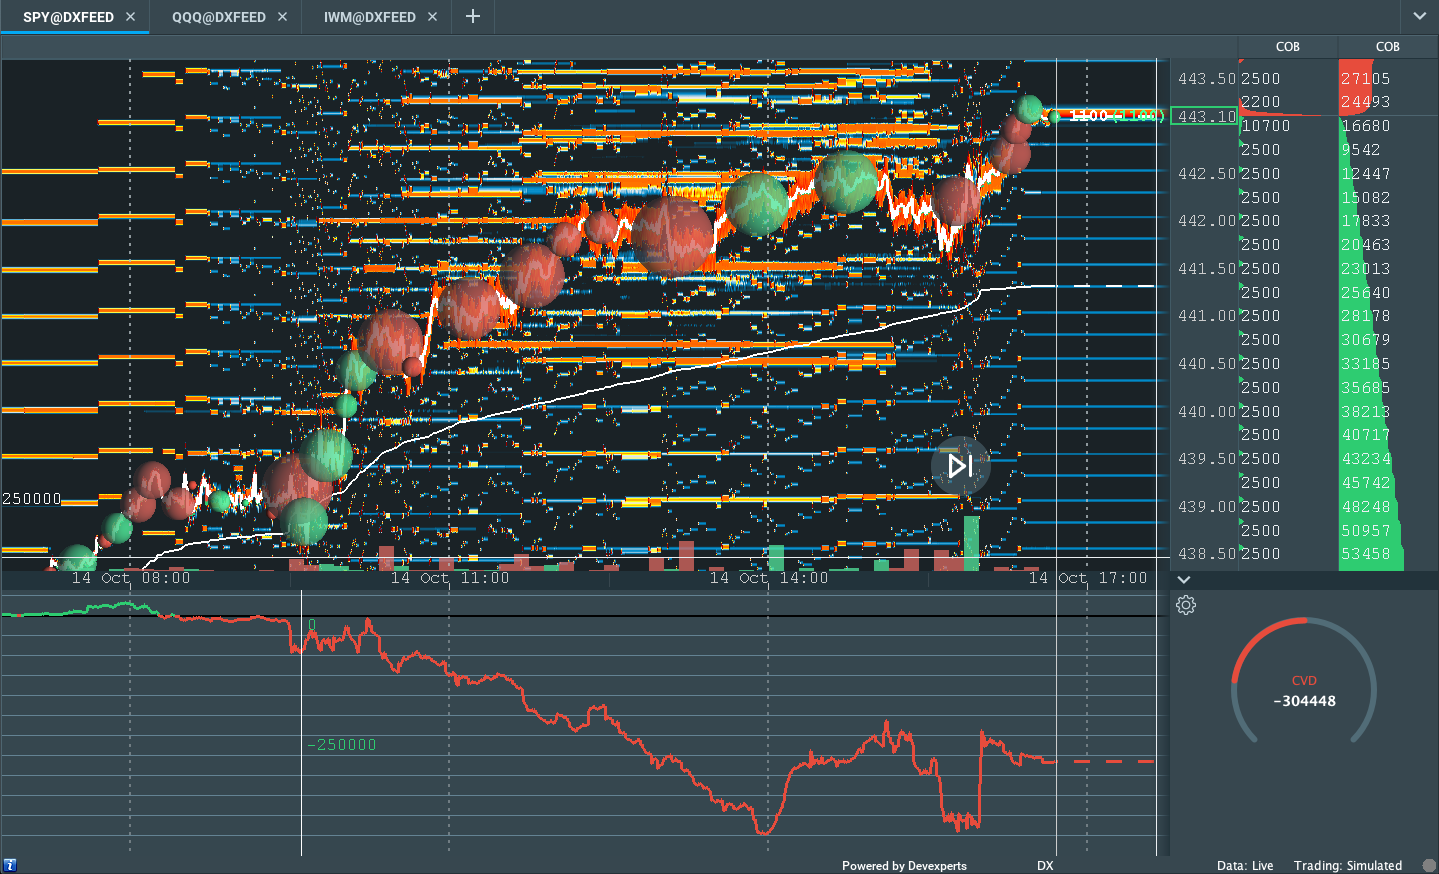
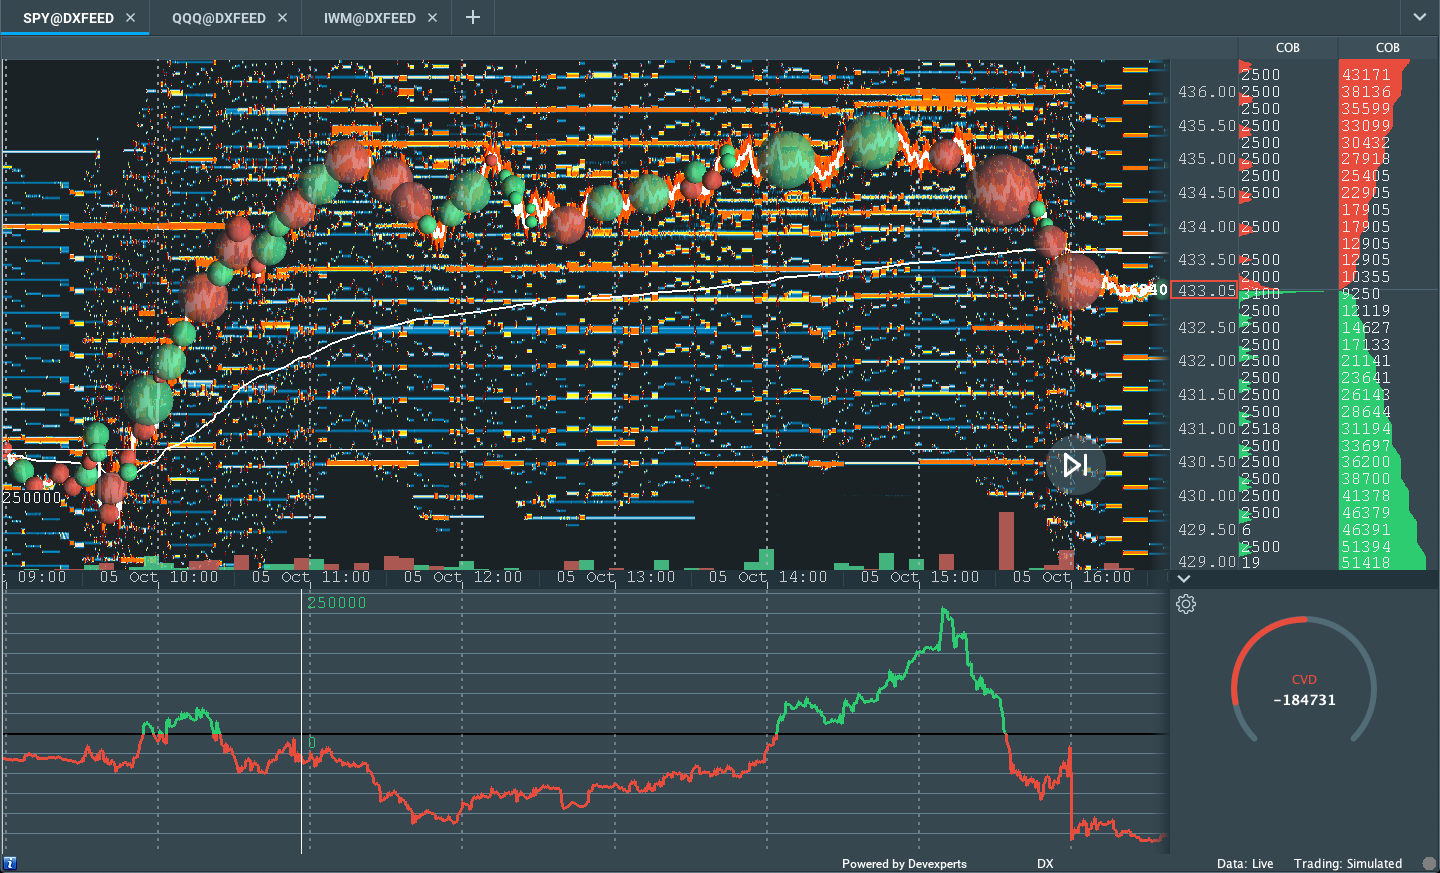
Graphic: Supportive delta (i.e., committed selling as measured by volume delta or buying and selling power as calculated by the difference in volume traded at the bid and offer) in SPDR S&P 500 ETF Trust (NYSE: SPY), one of the largest ETFs that track the S&P 500 index, via Bookmap. The readings are supportive of initiative trade (i.e., directional trade that suggests current prices offer unfavorable entry and exit; the market is seeking balance).

Context: A resurgence in COVID-19, a change in tone with respect to monetary policy, and last-minute tax-selling, in the face of seasonally-bullish buybacks and new month inflows.

The implications of these themes on price are contradictory. 

As stated, yesterday, the Federal Reserve’s Jerome Powell unexpectedly changed his tone around inflation, becoming more open to a faster taper in bond-buying and rate hikes. 

This is as policymakers look to tame price readings without inhibiting economic growth; fears of the aforementioned change in tone were clearly spotted by the bond market’s pricing of risk, so to speak, diverging from that of the equity market, weeks before current volatility.
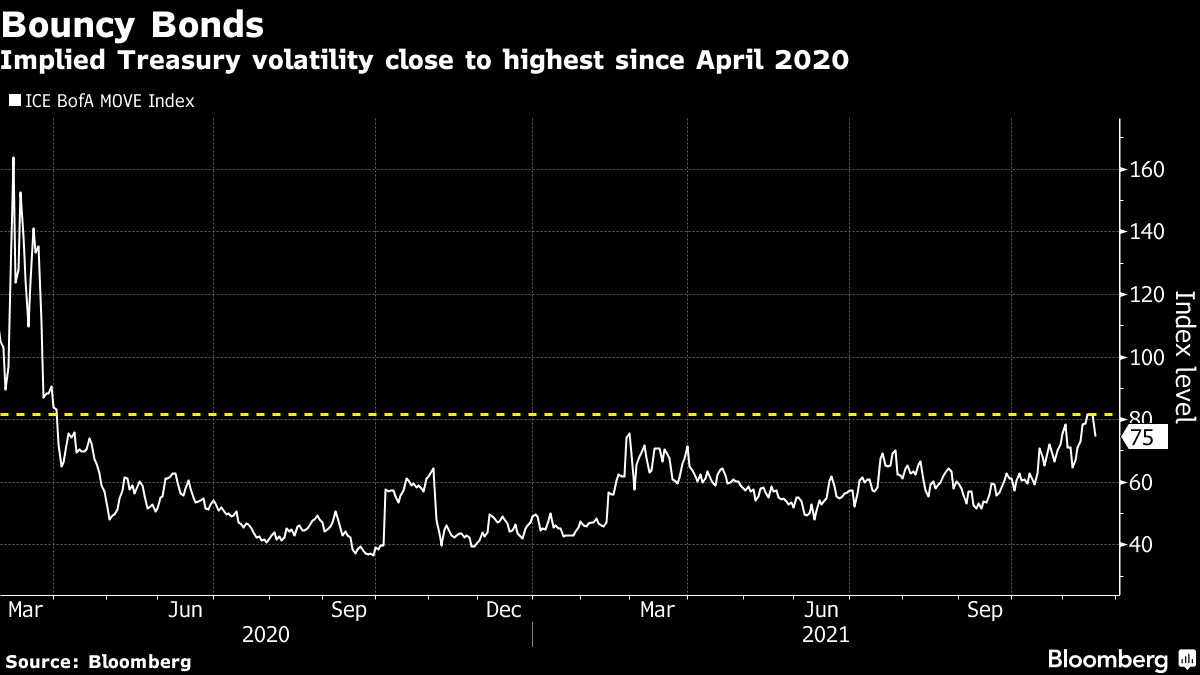
Graphic: “The ICE BofA MOVE Index, which measures implied volatility for Treasuries, is close to the steepest level since April 2020,” via Bloomberg.

Rising rates, among other factors, have the potential to decrease the present value of future earnings, thereby making stocks, especially those that are high growth, less attractive to own.

As the market is a forward-looking mechanism, the implications of this are staggering. 

Prevailing monetary frameworks and max liquidity promoted a large divergence in price from fundamentals. The growth of passive investing – the effect of increased moneyness among nonmonetary assets – and derivatives trading imply a lot of left-tail risks.
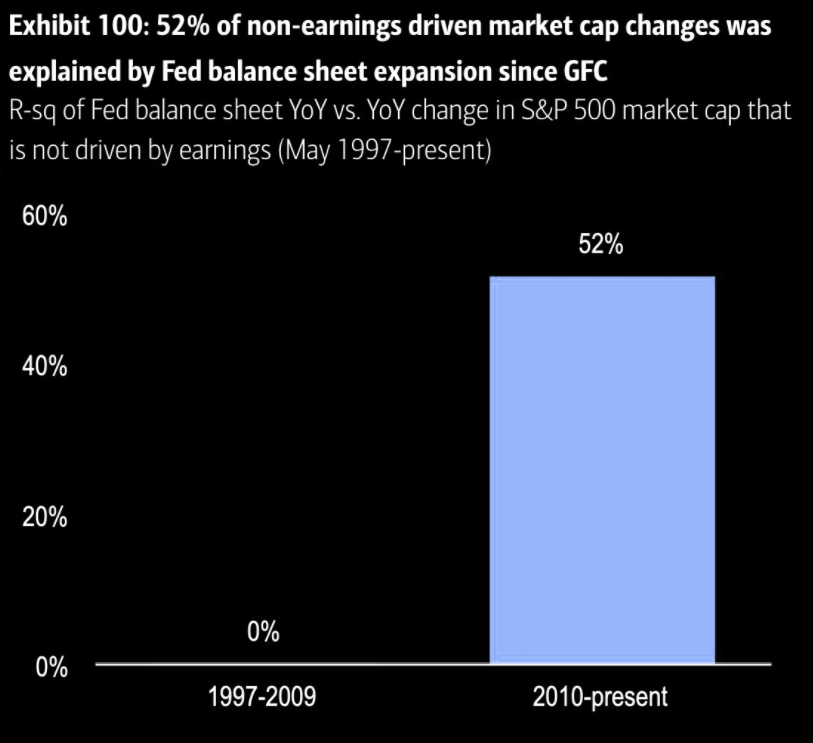
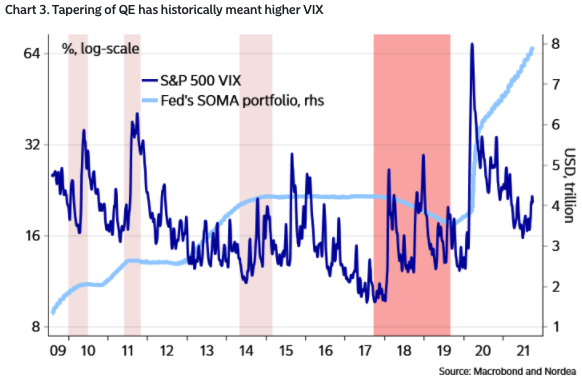
Graphic: Via The Market Ear, “Bank of America estimates that corporate earnings used to explain half of equity market returns up to the financial crisis, but since then they only explain 21%. Meanwhile, changes to the Fed’s balance sheet explain 52% of market returns since 2010, it estimates. Buy what the FED buys. Sell what the FED stops buying.”

As Kai Volatility’s Cem Karsan once told me: “There’s this constant structural positioning that naturally drives markets higher as long as volatility is compressed,” or there is supply.

“At the end of the day, though, the higher you go, the further off the ground you are and the more tail risk.”

Eventually, the fear on the part of bond market participants fed into equity market positioning; breadth weakened for weeks into November’s large monthly options expiration, after which the absence of sticky and supportive hedging flows finally freed the market for directional resolve. 

Couple that with participants being “underexposed to downside put protection,” according to SpotGamma, there was an expectation that there could be a rough re-pricing of tail risk as participants, en masse, sought after highly “convex” downside options which had the counterparties to those trades exacerbating underlying price movement.

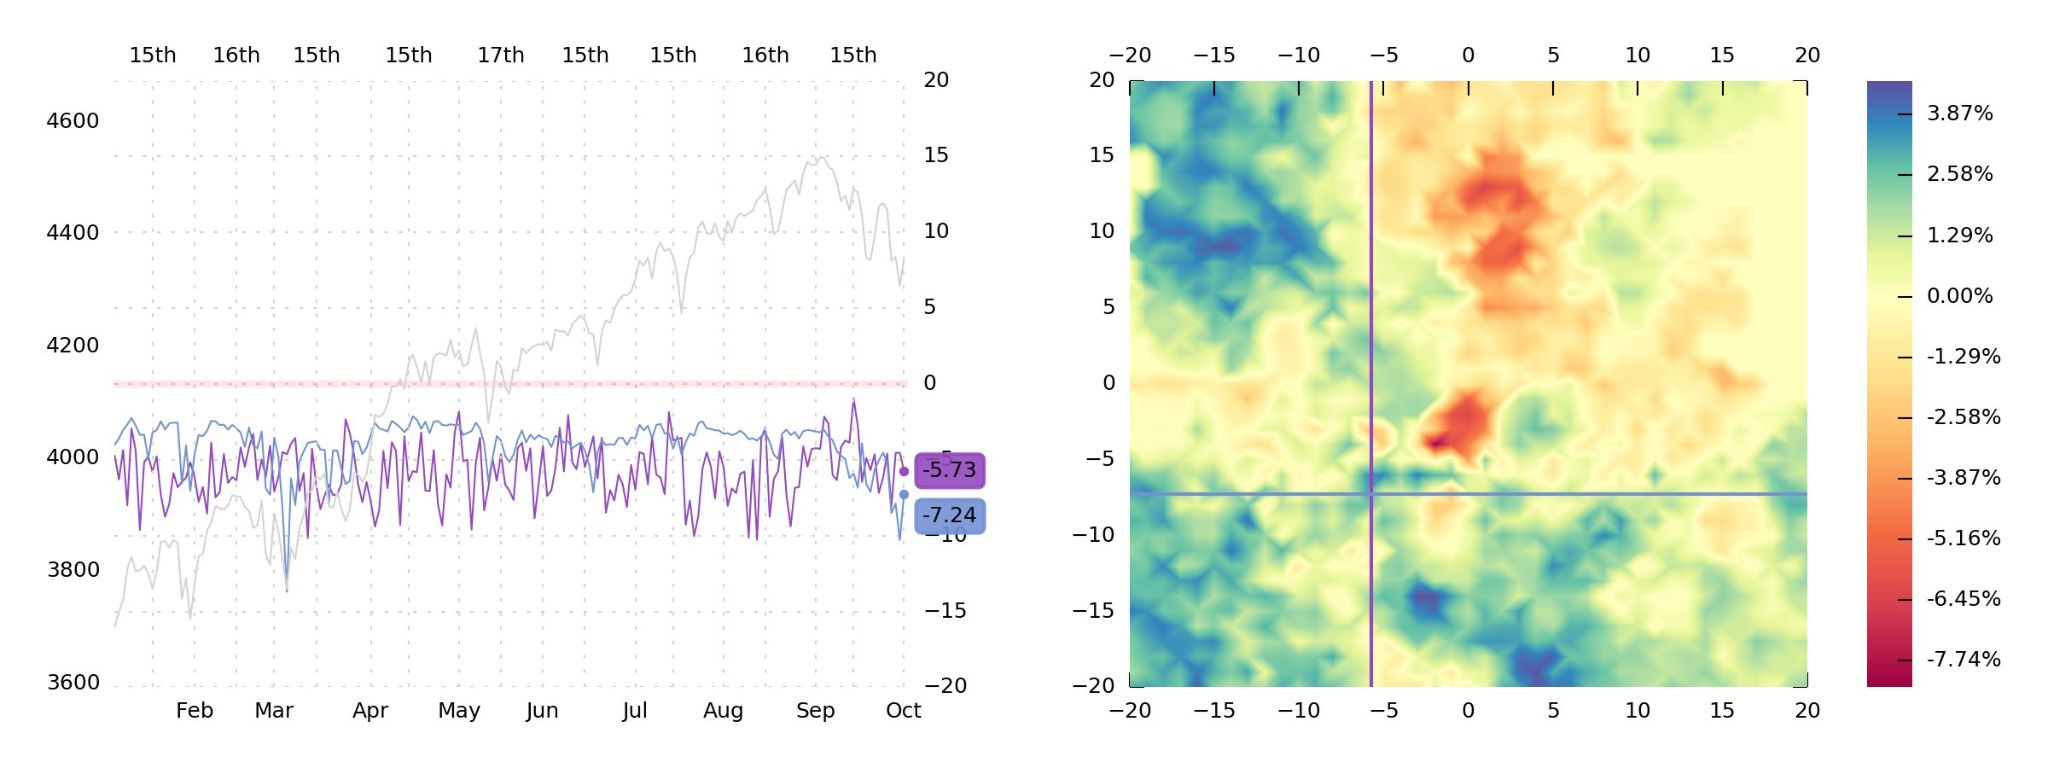
Per the VIX term structure graphic below, there is tons of movement in the front-end, a sign that participants are concentrating activity in shorter-dated tenors where the sensitivity of options to direction is higher.
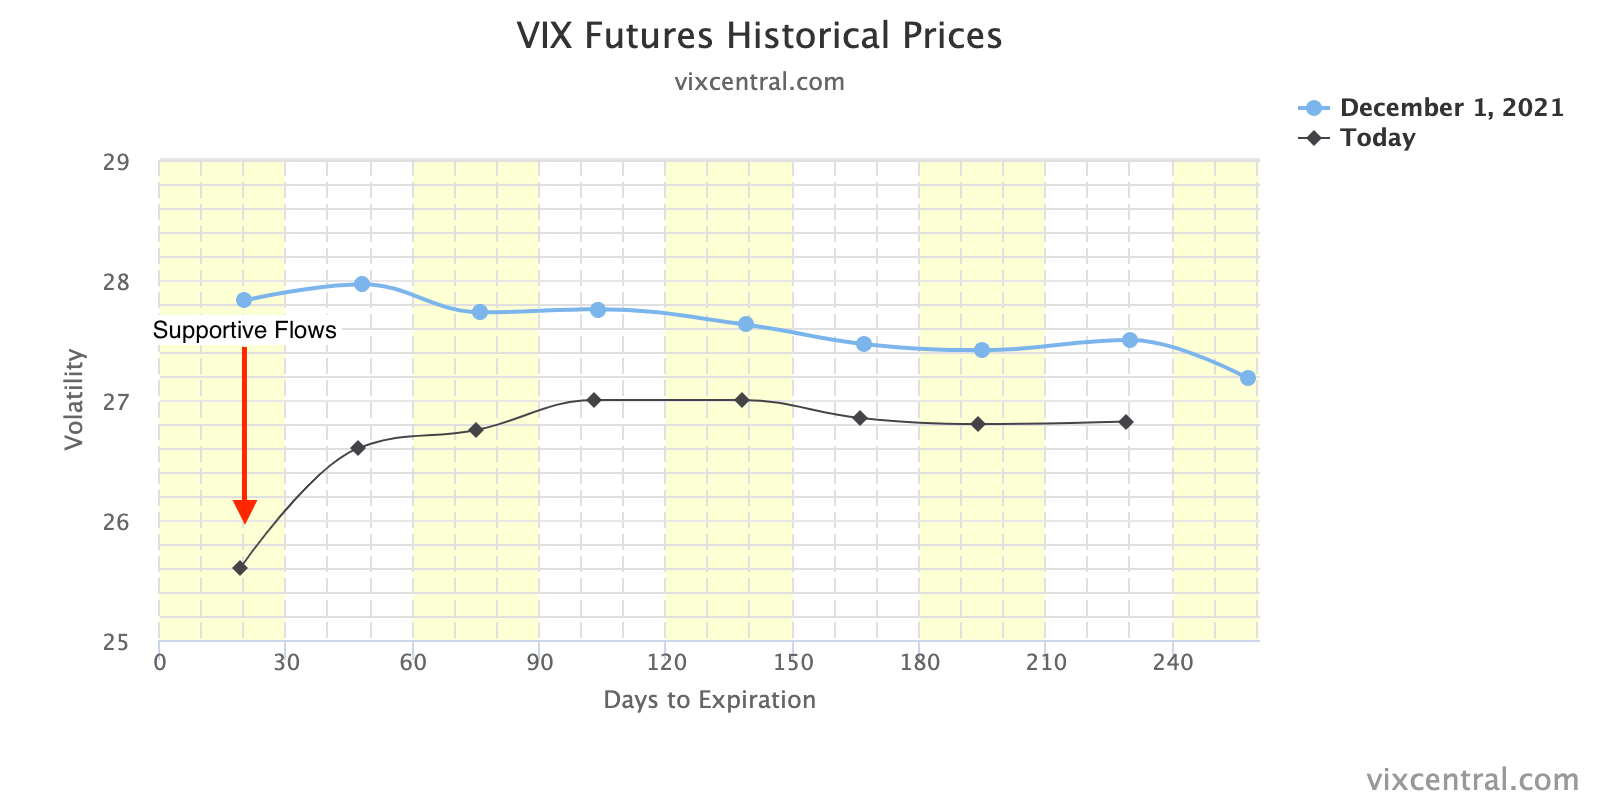
Graphic: VIX term structure. 

So long as this dynamic remains, participants can expect instability.

In assuaging fears, however, Moody’s Corporation (NYSE: MCO) put out research that found “information about the variant and the policy actions taken to date do not yet support a material shift” in forecasts.

This is as S&P Global Inc (NYSE: SPGI), despite lowering growth forecasts a touch, expects GDP to reach a 37-year high in 2021. With odds that it will likely take the next few weeks to find out more with respect to the severity of new COVID-19 variants, attention moves to “cyclicals, commodities, and reopening themes,” according to JPMorgan Chase & Co’s (NYSE: JPM) Marko Kolanovic. 
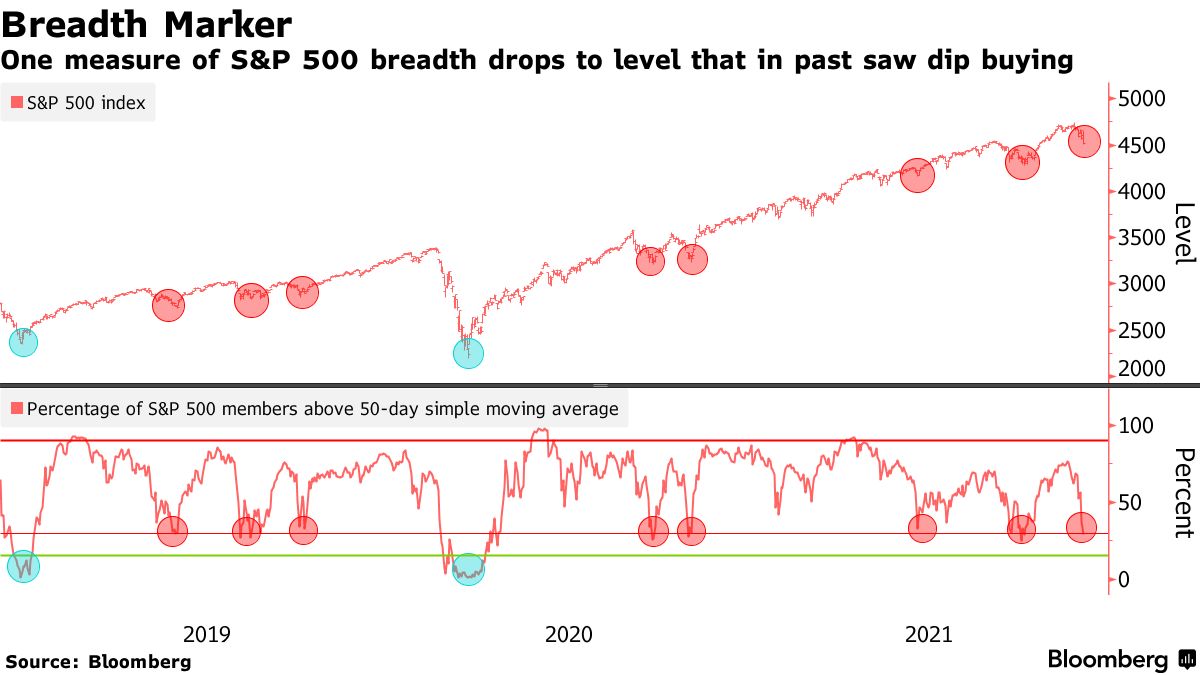
Graphic: Via Bloomberg, “there is ‘plenty of liquidity available to drive stock prices higher as dip-buyers enter the market,’” strategists at Yardeni Research, wrote.

Expectations: As of 6:40 AM ET, Thursday’s regular session (9:30 AM – 4:00 PM ET), in the S&P 500, will likely open in the lower part of a positively skewed overnight inventory, inside of prior-range and -value, suggesting a limited potential for immediate directional opportunity.

Spike Rules In Play: Spike’s mark the beginning of a break from value. Spikes higher (lower) are validated by trade at or above (below) the spike base (i.e., the origin of the spike).

In the best case, the S&P 500 trades sideways or higher; activity above the $4,551.75 low volume area (LVNode) puts in play the $4,574.25 high volume area (HVNode). Initiative trade beyond the HVNode could reach as high as the $4,629.00 untested point of control (VPOC) and $4,674.25 micro composite point of control (MCPOC), or higher.

In the worst case, the S&P 500 trades lower; activity below the $4,551.75 low volume area (LNVode) puts in play the $4,497.75 regular-trade low (RTH Low). Initiative trade beyond the RTH Low could reach as low as the $4,471.00 and $4,425.00 VPOC, or lower.

Click here to load today’s updated key levels into the web-based TradingView charting platform. Note that all levels are derived using the 65-minute timeframe. New links are produced, daily.
Graphic: 65-minute profile chart of the Micro E-mini S&P 500 Futures. Learn about the profile.

Charts To Watch

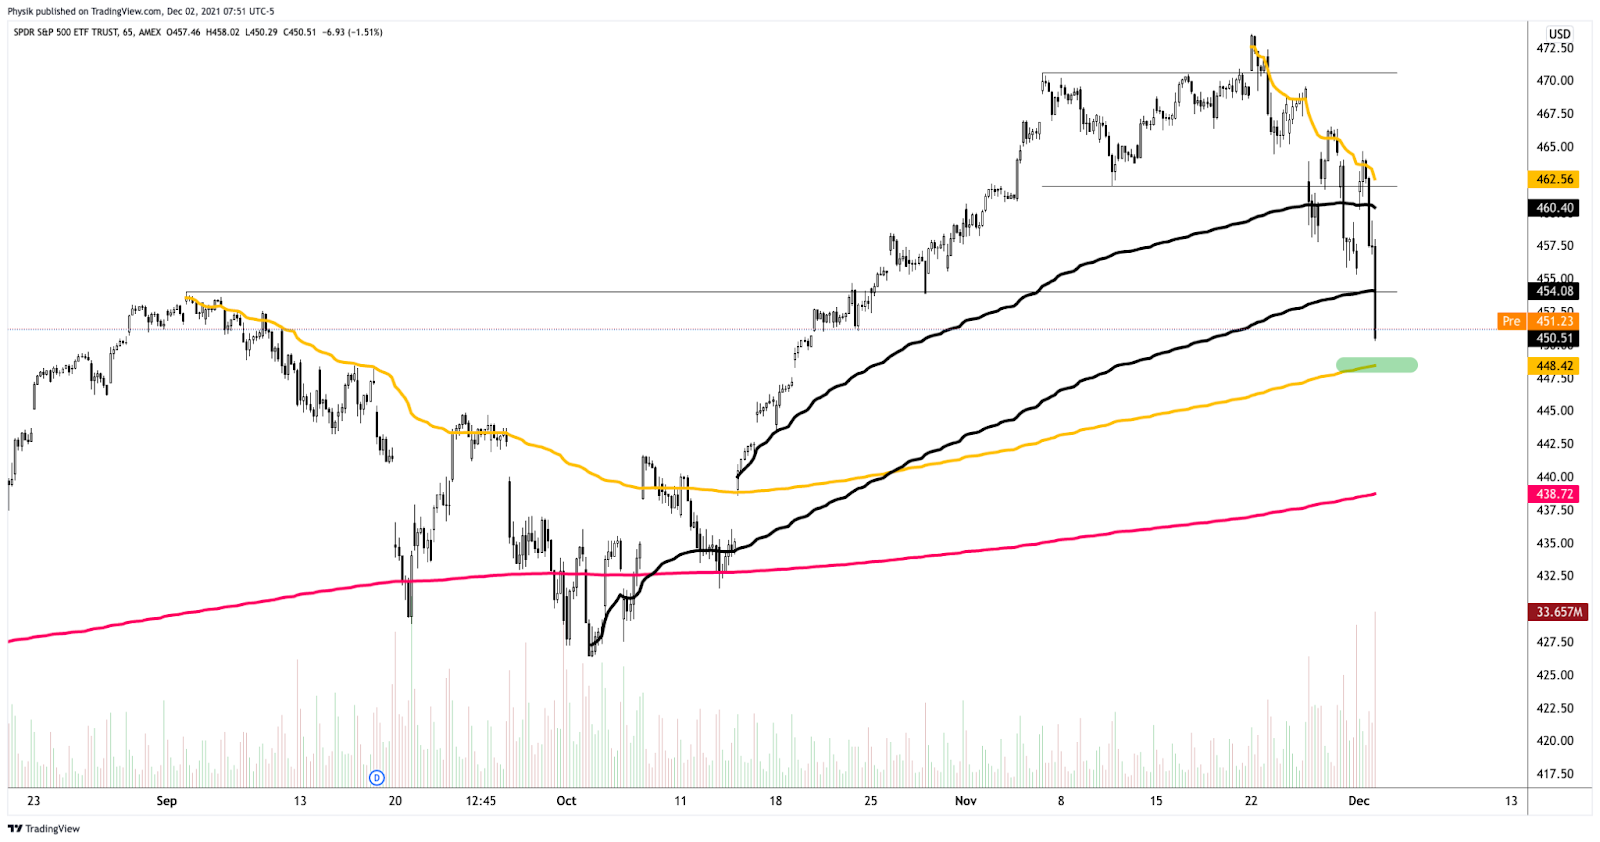
Graphic: (NYSE: SPY). (S~$448, $438 and R~$454, $460). S is for support. R is for resistance.

Definitions

Volume Areas: A structurally sound market will build on areas of high volume (HVNodes). Should the market trend for long periods of time, it will lack sound structure, identified as low volume areas (LVNodes). LVNodes denote directional conviction and ought to offer support on any test. 

If participants were to auction and find acceptance into areas of prior low volume (LVNodes), then future discovery ought to be volatile and quick as participants look to HVNodes for favorable entry or exit.

POCs: POCs are valuable as they denote areas where two-sided trade was most prevalent in a prior day session. Participants will respond to future tests of value as they offer favorable entry and exit.

MCPOCs: POCs are valuable as they denote areas where two-sided trade was most prevalent over numerous day sessions. Participants will respond to future tests of value as they offer favorable entry and exit.

Options Expiration (OPEX): Traditionally, option expiries mark an end to pinning (i.e, the theory that market makers and institutions short options move stocks to the point where the greatest dollar value of contracts will expire) and the reduction dealer gamma exposure.

Price Discovery (One-Timeframe Or Trend): Elongation and range expansion denotes a market seeking new prices to establish value, or acceptance (i.e., more than 30-minutes of trade at a particular price level). 

Balance (Two-Timeframe Or Bracket): Rotational trade that denotes current prices offer favorable entry and exit. Balance-areas make it easy to spot a change in the market (i.e., the transition from two-time frame trade, or balance, to one-time frame trade, or trend). 

Modus operandi is responsive trade (i.e., fade the edges), rather than initiative trade (i.e., play the break).

Value-Area Placement: Perception of value unchanged if value overlapping (i.e., inside day). Perception of value has changed if value not overlapping (i.e., outside day). Delay trade in the former case.

About

After years of self-education, strategy development, and trial-and-error, Renato Leonard Capelj began trading full-time and founded Physik Invest to detail his methods, research, and performance in the markets.

Additionally, Capelj is a Benzinga finance and technology reporter interviewing the likes of Shark Tank’s Kevin O’Leary, JC2 Ventures’ John Chambers, and ARK Invest’s Catherine Wood, as well as a SpotGamma contributor, developing insights around impactful options market dynamics.

Disclaimer

At this time, Physik Invest does not manage outside capital and is not licensed. In no way should the materials herein be construed as advice. Derivatives carry a substantial risk of loss. All content is for informational purposes only.

Categories
Commentary

Daily Brief For December 1, 2021

What Happened

Overnight, equity index futures traded sideways to higher, led by the once-weak Russell 2000. 

The shift in relative strength is one obvious change in tone in the face of hawkish news from the Federal Reserve (Fed) and COVID-19 uncertainty. 

Ahead is data on ADP employment (8:15 AM ET), Markit manufacturing PMI (9:45 AM ET), ISM manufacturing index, construction spending, as well as testimony by Federal Reserve’s Jerome Powell and Treasury Secretary Janet Yellen (10:00 AM ET). 

Later is a release of the Beige Book (2:00 PM ET).

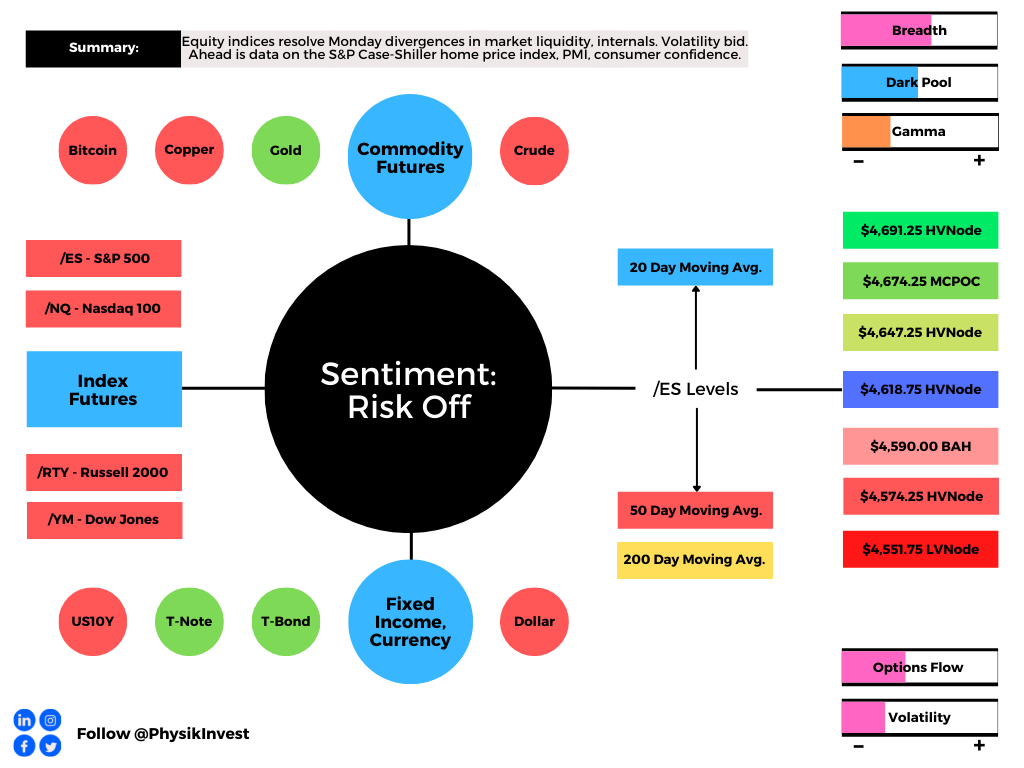
Graphic updated 6:30 AM ET. Sentiment Neutral if expected /ES open is inside of the prior day’s range. /ES levels are derived from the profile graphic at the bottom of the following section. Levels may have changed since initially quoted; click here for the latest levels. SqueezeMetrics Dark Pool Index (DIX) and Gamma (GEX) calculations are based on where the prior day’s reading falls with respect to the MAX and MIN of all occurrences available. A higher DIX is bullish. At the same time, the lower the GEX, the more (expected) volatility. Learn the implications of volatility, direction, and moneyness. SHIFT data used for S&P 500 (INDEX: SPX) options activity. Note that options flow is sorted by the call premium spent; if more positive then more was spent on call options. Breadth reflects a reading of the prior day’s NYSE Advance/Decline indicator. VIX reflects a current reading of the CBOE Volatility Index (INDEX: VIX) from 0-100.

What To Expect

On lackluster breadth and supportive market liquidity metrics, the worst-case outcome occurred, evidenced by an expansion of the S&P 500’s range, as well as increased participation at lower prices, as evidenced by lower value (i.e., the prices at which 70% of the day’s volume occurred).

Though yesterday marked a willingness to continue the trend lower, there are some caveats.

The first of which comes back to simple market profile principles. Value ended on the day overlapping lower. This suggests balance and an unchanged perception of value from Friday. 

This dynamic ties into what was discussed yesterday. Given a push-pull environment between the big indices (i.e., strength in Nasdaq 100 versus weakness in Russell 2000), in the face of lackluster breadth and market liquidity metrics, there were increased odds of sideways trade; “participants were likely to base for a directional move in anticipation of new information.”

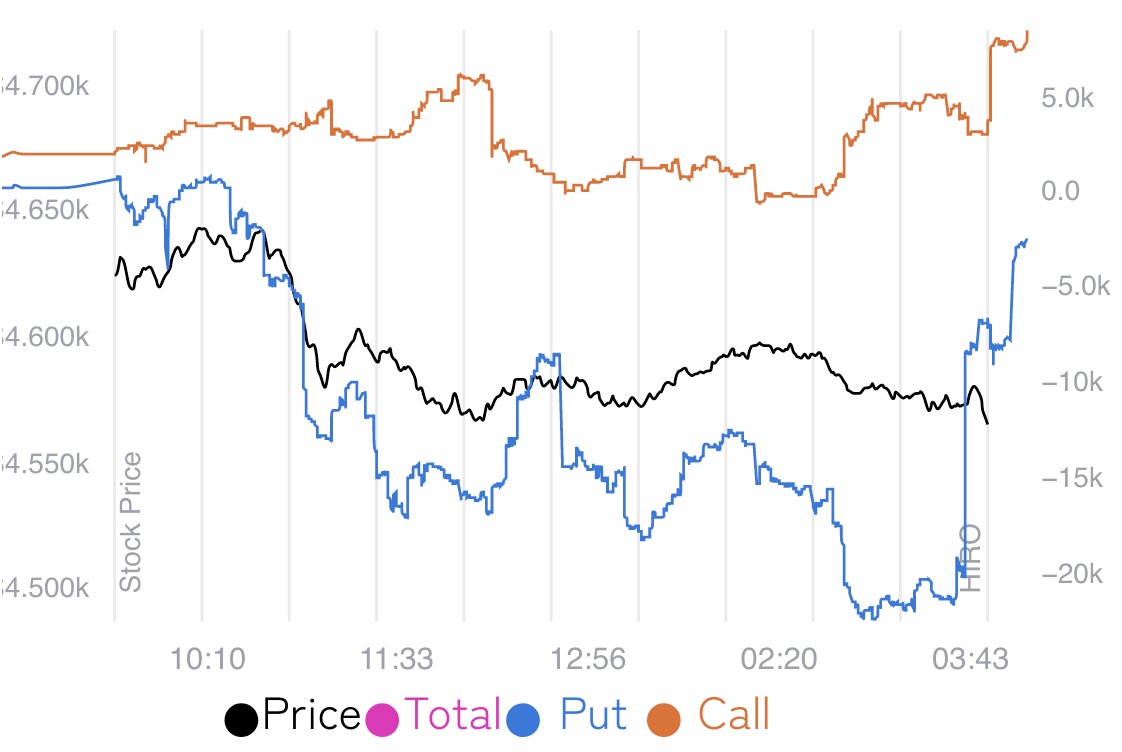
Second, according to SpotGamma, “in the face of a massive -$8bn market-on-close order, dealers likely were covering their hedges to customers’ short-delta options exposure.”

The implications of the latter are staggering. Let’s unpack, below.

Graphic: SpotGamma’s Hedging Impact of Real-Time Options (HIRO) indicator shows positive options delta trades firing off, which likely had dealers buying stock/futures into the close.

Context: The Fed’s Powell changed his tone around inflation, yesterday, becoming more open to a faster taper in bond-buying and rate hikes. 

As Bloomberg’s John Authers put it: “This looks like inconsistency, and it also looks to some as if Powell has lost his nerve — just as he did three years ago, when the stock market’s horrified reaction to his statement that the Fed’s balance sheet would be reduced ‘on autopilot,’ meaning ever tighter money, prompted a U-turn. In market lore, the ‘Christmas Eve Massacre’ of a cathartic stock sell-off was followed by the ‘Powell Pivot.’”

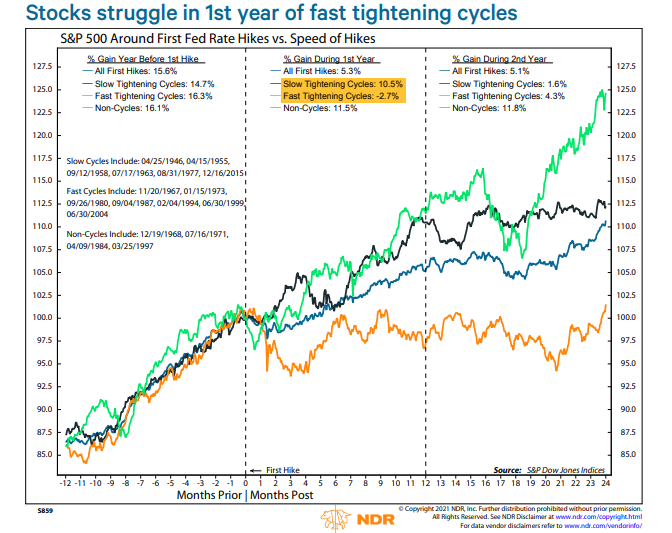
Graphic: S&P 500 performance in tightening cycles via Ned Davis Research. 

Stocks have recovered markedly, since the news. 

At the outset, as we typically see with news, selling appeared knee-jerk; a b-shaped profile distribution suggested long liquidation (i.e., [1] participants who bought the dip, Friday, were unable to gather the financial and/or emotional wherewithal to defend a retest of local lows and [2] capitulation on the part of larger other time frame participants, potentially).

In regards to the latter, if funds were to sell the market, they would do so methodically, into strength, throughout a session.

Couple the aforementioned with a decline in volatility (despite S&P 500 prices reaching lower lows), it’s clear as to why I started off the commentary suggesting an “obvious change in tone.”

Last week, we saw the market enter into a destabilizing environment characterized by counterparties to options trades selling into weakness and buying into strength. 

Note: Options are so important. Volatility is a growing asset class. Its implications can’t be discounted (e.g., index pinned in the face of single-stock volatility and declining correlations).

After a brief exit from that environment, on Tuesday the market made another attempt lower. With options activity most concentrated in shorter-dated tenors where the sensitivity of options to direction is higher, then the expectation was that we would realize more volatility. 

That happened.

However, volatility, despite spiking, failed to breach Friday levels; in such a case, the short-dated, out-of-the-money protection participants were initially demanding bled.

Given decreased exposure to risk, at least for those participants (e.g., dealers) warehousing this risk, associated hedging flows (i.e., the buy-back of short stock/futures hedges) came onto the market. 

This is clearly visualized by SpotGamma’s HIRO indicator, above. 

In conclusion, should participants continue to markdown volatility, as well as commit more capital to the call side, fears will have been assuaged.

In such a case, the odds of a seasonally-aligned rally, into Christmas, are supported.

Expectations: As of 6:30 AM ET, Wednesday’s regular session (9:30 AM – 4:00 PM ET), in the S&P 500, will likely open in the upper part of a positively skewed overnight inventory, inside of prior-range and -value, suggesting a limited potential for immediate directional opportunity.

Developing Balance Scenario: Rotational trade that denotes current prices offer favorable entry and exit. Balance-areas make it easy to spot a change in the market (i.e., the transition from two-time frame trade, or balance, to one-time frame trade, or trend). 

Modus operandi is responsive trade (i.e., fade the edges), rather than initiative trade (i.e., play the break).

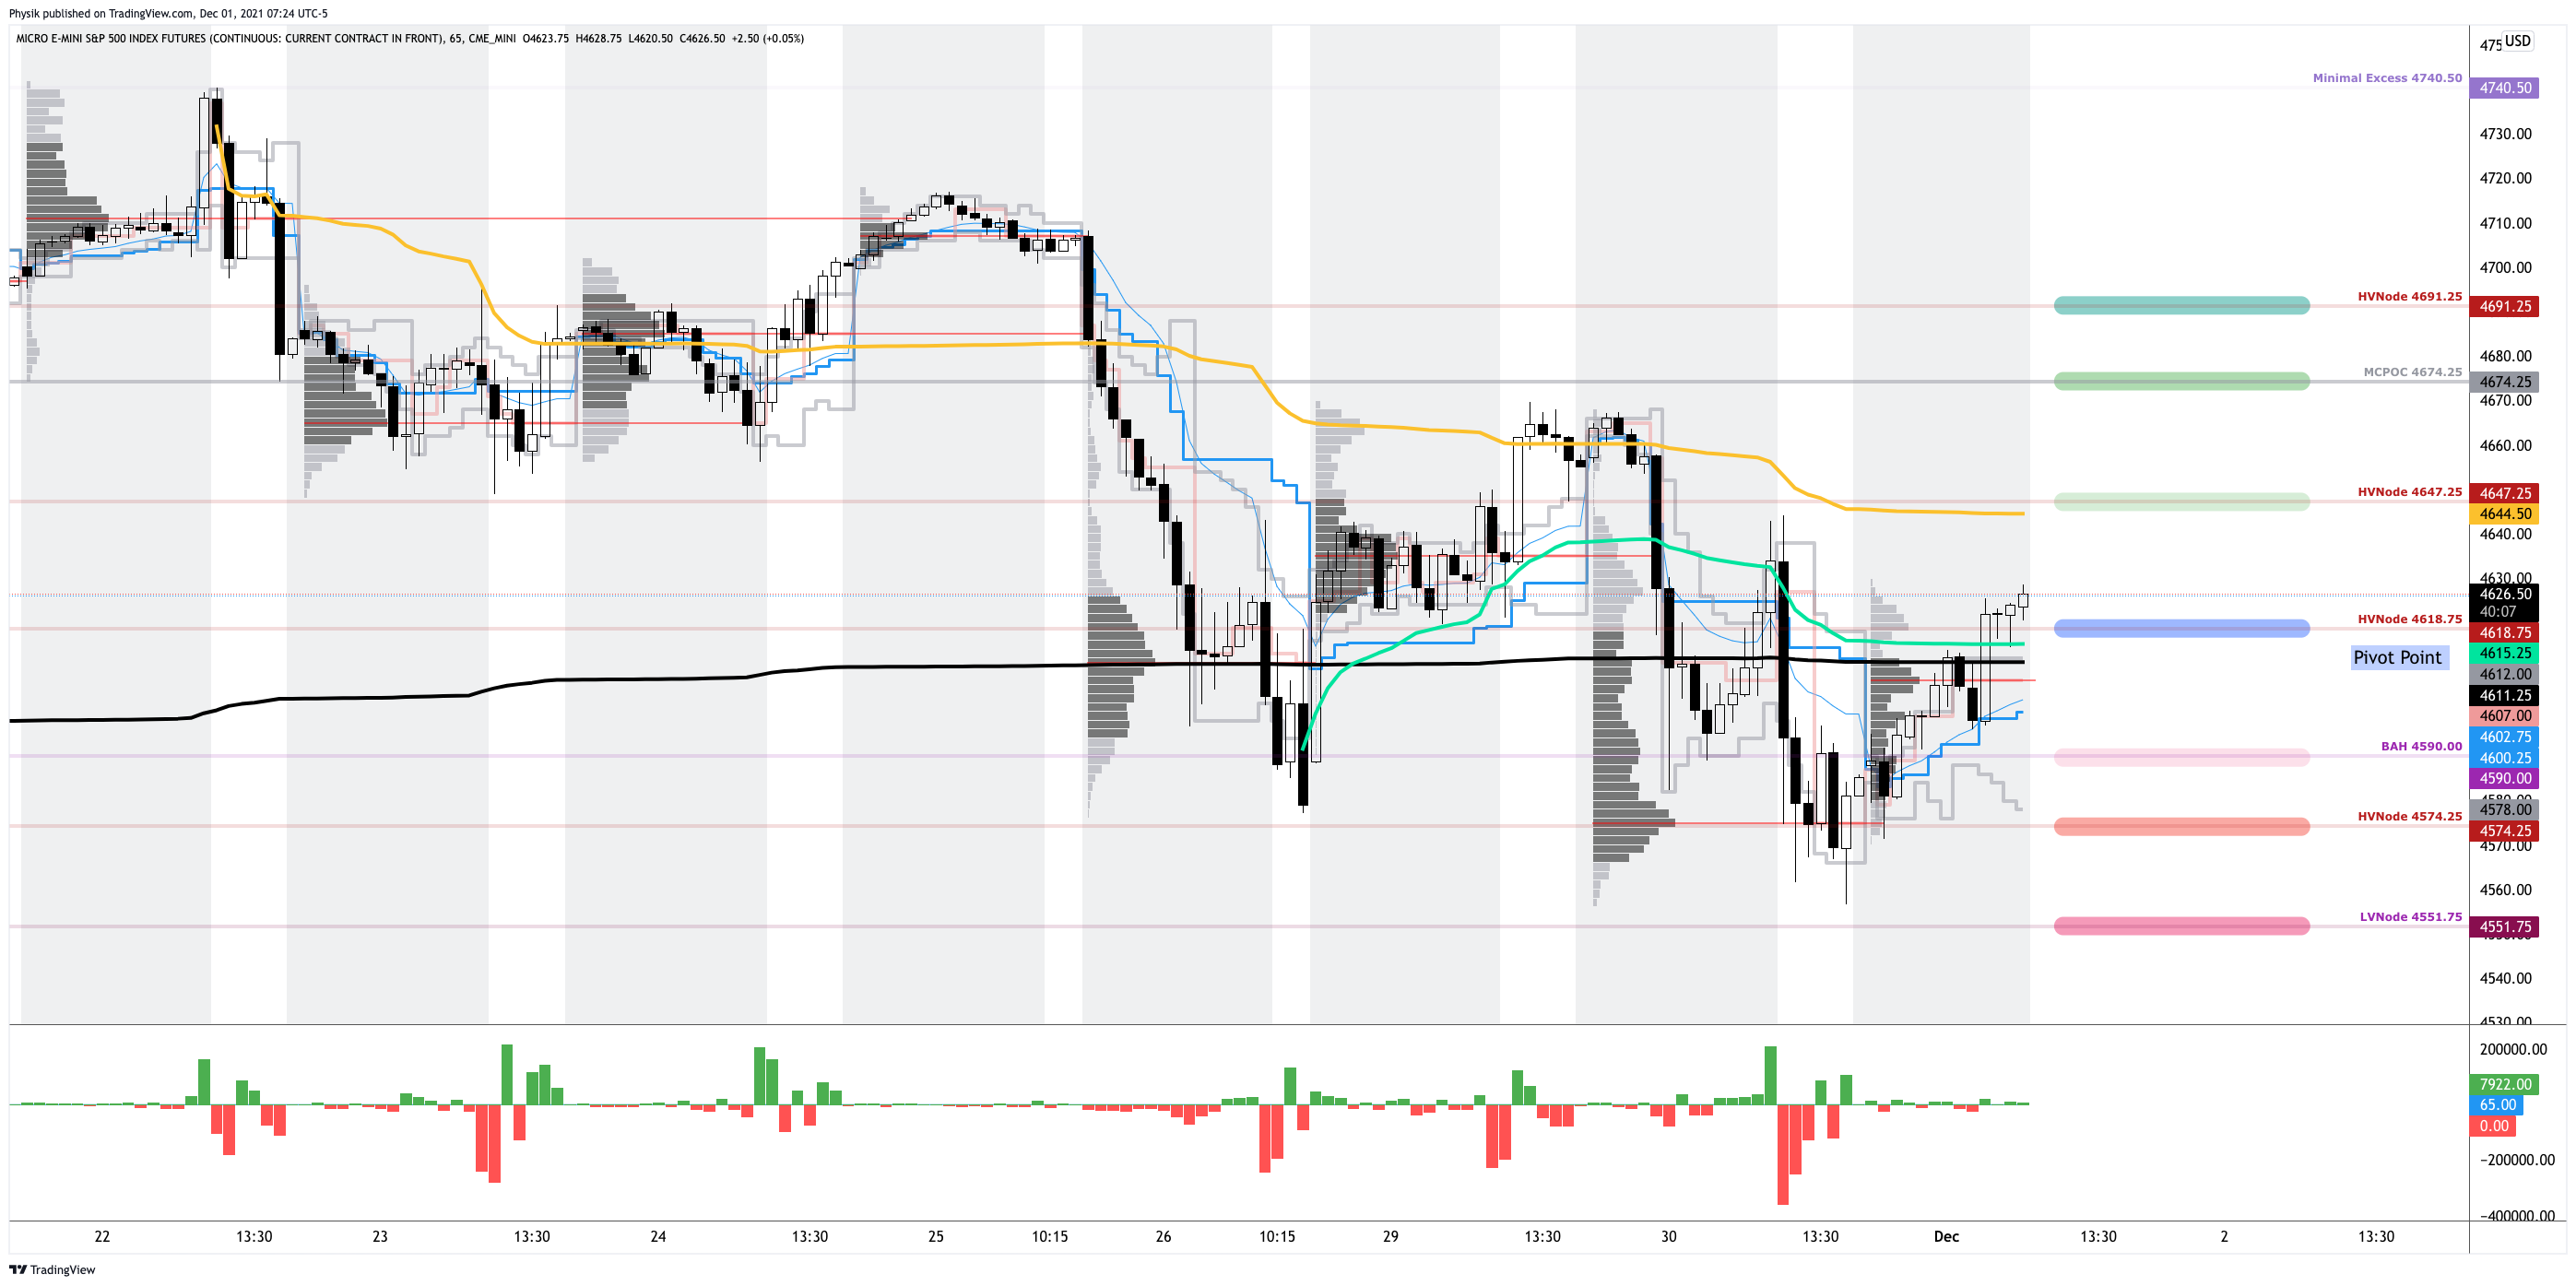
In the best case, the S&P 500 trades sideways or higher; activity above the $4,618.75 high volume area (HVNode) puts in play the $4,647.25 HVNode. Initiative trade beyond the latter HVNode could reach as high as the $4,674.25 micro composite point of control (MCPOC) and $4,691.25 HVNode, or higher.

In the worst case, the S&P 500 trades lower; activity below the $4,618.75 HVNode puts in play the $4,590.00 balance boundary (BAH). Initiative trade beyond the BAH could reach as low as the $4,574.25 HVNode and $4,551.75 LVNode, or lower.

Click here to load today’s updated key levels into the web-based TradingView charting platform. Note that all levels are derived using the 65-minute timeframe. New links are produced, daily.
Graphic: 65-minute profile chart of the Micro E-mini S&P 500 Futures. Learn about the profile.

Charts To Watch

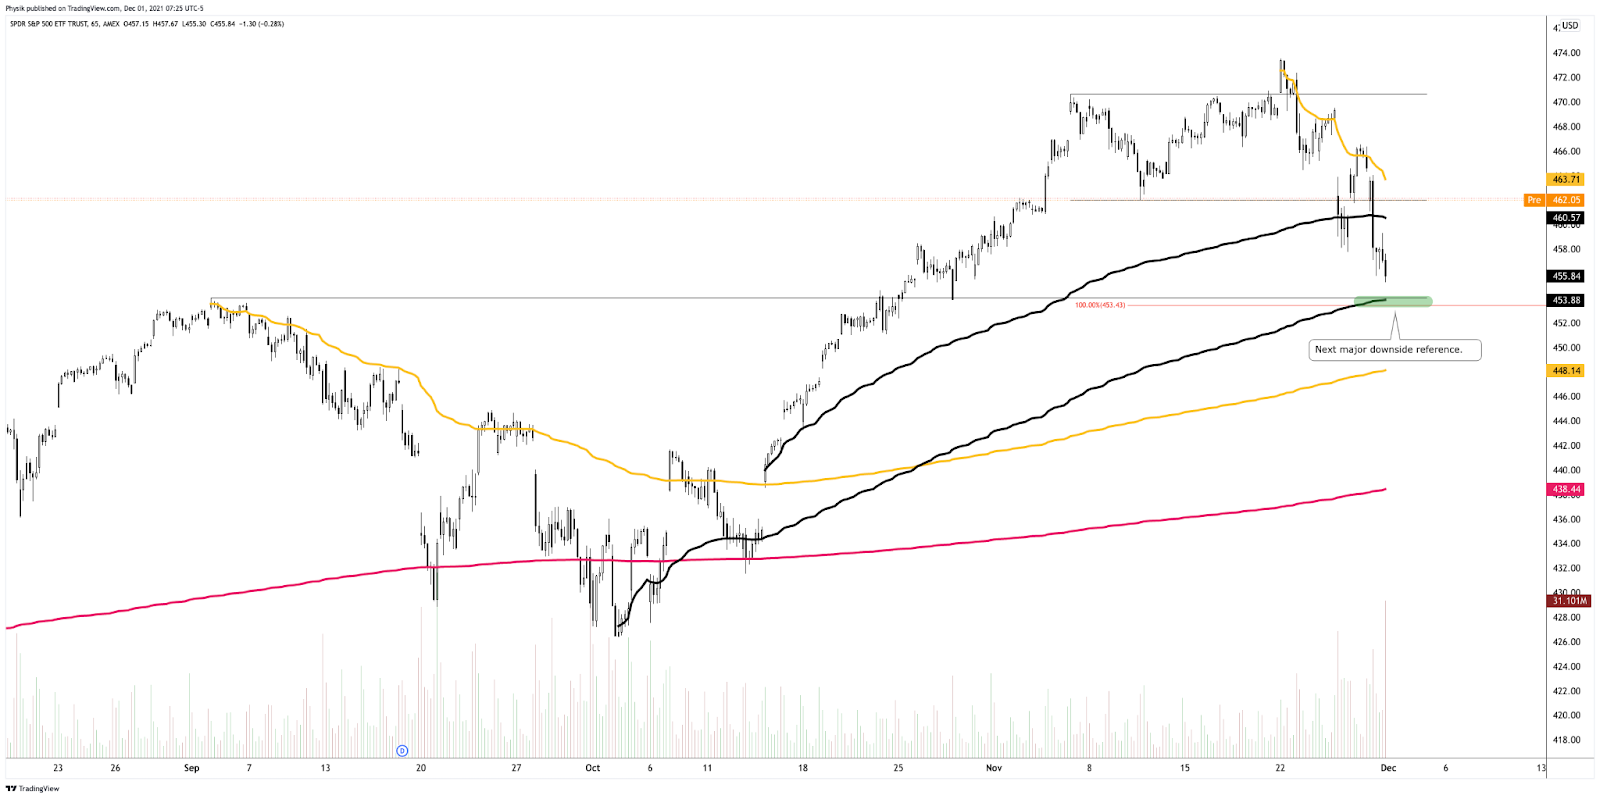
Graphic: (NYSE: SPY). (S~$454, R~$463). S is for support. R is for resistance.

What People Are Saying

Volume Areas: A structurally sound market will build on areas of high volume (HVNodes). Should the market trend for long periods of time, it will lack sound structure, identified as low volume areas (LVNodes). LVNodes denote directional conviction and ought to offer support on any test. 

If participants were to auction and find acceptance into areas of prior low volume (LVNodes), then future discovery ought to be volatile and quick as participants look to HVNodes for favorable entry or exit.

MCPOCs: POCs are valuable as they denote areas where two-sided trade was most prevalent over numerous day sessions. Participants will respond to future tests of value as they offer favorable entry and exit.

Definitions

About

After years of self-education, strategy development, and trial-and-error, Renato Leonard Capelj began trading full-time and founded Physik Invest to detail his methods, research, and performance in the markets.

Additionally, Capelj is a Benzinga finance and technology reporter interviewing the likes of Shark Tank’s Kevin O’Leary, JC2 Ventures’ John Chambers, and ARK Invest’s Catherine Wood, as well as a SpotGamma contributor, developing insights around impactful options market dynamics.

Disclaimer

At this time, Physik Invest does not manage outside capital and is not licensed. In no way should the materials herein be construed as advice. Derivatives carry a substantial risk of loss. All content is for informational purposes only.
Categories
Commentary

Daily Brief For November 30, 2021

What Happened

Overnight, equity index futures auctioned sideways to lower. The Russell 2000 led the decline while the Nasdaq 100 buoyed the S&P 500 as yields were a touch lower.

Though volatility is bid, related metrics suggest the removal of fear and added market stability. 

In short, conditions aren’t as bad as they were, Friday. 

Ahead is data on the S&P Case-Shiller Home Price Index (9:00 AM ET), Chicago PMI (9:45 AM ET), Consumer Confidence (10:00 AM ET). Scheduled also is testimony by Federal Reserve and Treasury members (10:00 AM and 1:00 PM ET).

Graphic updated 6:30 AM ET. Sentiment Risk-Off if expected /ES open is below the prior day’s range. /ES levels are derived from the profile graphic at the bottom of the following section. Levels may have changed since initially quoted; click here for the latest levels. SqueezeMetrics Dark Pool Index (DIX) and Gamma (GEX) calculations are based on where the prior day’s reading falls with respect to the MAX and MIN of all occurrences available. A higher DIX is bullish. At the same time, the lower the GEX, the more (expected) volatility. Learn the implications of volatility, direction, and moneyness. SHIFT data used for S&P 500 (INDEX: SPX) options activity. Note that options flow is sorted by the call premium spent; if more positive then more was spent on call options. Breadth reflects a reading of the prior day’s NYSE Advance/Decline indicator. VIX reflects a current reading of the CBOE Volatility Index (INDEX: VIX) from 0-100.

What To Expect

On lackluster intraday breadth and divergent market liquidity metrics, the best case outcome occurred, yesterday, evidenced by a decisive move away from intraday value (i.e., the price levels at which 70% of the day’s volume occurred), into an area of resting liquidity that coincided with a volume-weighted average price (VWAP), anchored from the start of the decline. 

To note, VWAPs are metrics highly regarded by chief investment officers, among other participants, for quality of trade. Additionally, liquidity algorithms are benchmarked and programmed to buy and sell around VWAPs.

Moreover, given the divergences (one is pictured below), we can surmise that Monday’s recovery was responsively sold. 

Given the push and pull between the big indices, as well as lackluster breadth and market liquidity metrics, there is increased potential for sideways trade; participants are likely to base for a directional move in anticipation of new information in regards to dynamics like COVID-19, monetary policy evolution, and the like.

Graphic: Divergent delta (i.e., non-committed buying as measured by volume delta or buying and selling power as calculated by the difference in volume traded at the bid and offer) in SPDR S&P 500 ETF Trust (NYSE: SPY), one of the largest ETFs that track the S&P 500 index, via Bookmap. The readings are supportive of responsive trade (i.e., rotational trade that suggests current prices offer favorable entry and exit; the market is attempting to bracket/balance).

Context: Keeping it to the point, today.

There is less fear coming into Tuesday’s session than there was Friday. 

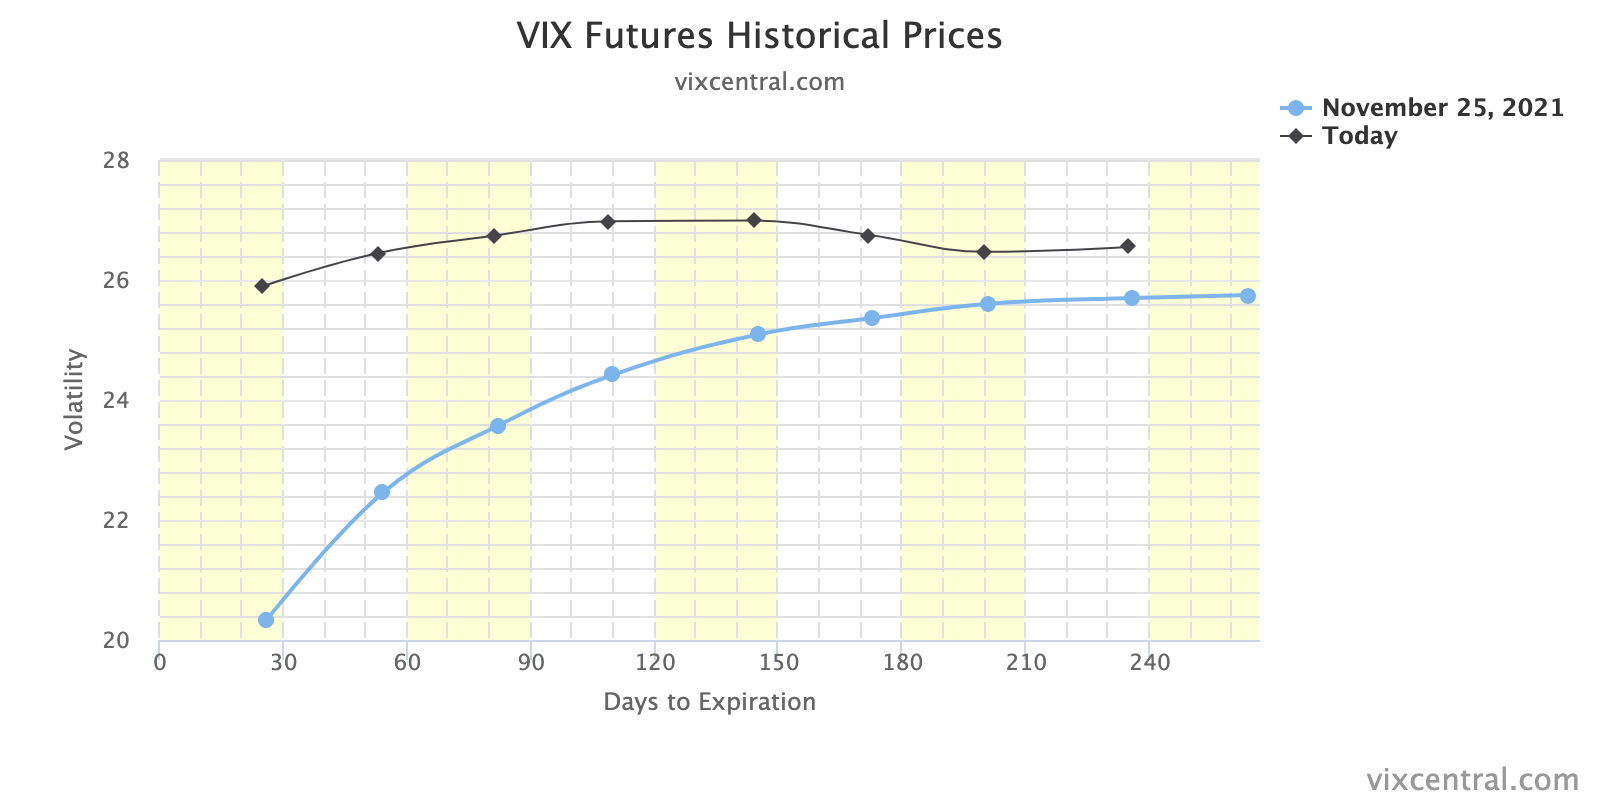
This dynamic is most clearly visualized with the VIX futures term structure which is much less flat, so to speak, than it was. 

Graphic: VIX term structure.

Though one could surmise that there is less risk of instability, as a result, rather, we should think about it as the demand for protection through time. The demand has cooled.

In building on that, we saw the market enter into a destabilizing environment characterized by counterparties to options trades selling into weakness and buying into strength. 

After a brief exit from that environment, Monday, an overnight liquidation has us on the cusp of re-entry. With options activity most concentrated in shorter-dated tenors where the sensitivity of options to direction is higher, if we will, then the expectation is that we realize more volatility.

That’s not to say that the market must trade lower. No. Instead, sideways trade as investors seek more information (in regards to COVID-19, monetary policy moderation, and the like) to base a directional move is just as likely. 

In that case, the short-dated, out-of-the-money protection that was demanded will quickly evaporate; associated hedging flows (i.e., the buy-back of short stock/futures hedges) ought to support the market. 

Should participants’ fears be assuaged, the aforementioned flows could play into a seasonally-aligned rally into Christmas. 

For that thesis to not play out, there would have to be increased participation below $4,600.00 in the S&P 500 (i.e., value, internals, market liquidity must support downside price discovery).

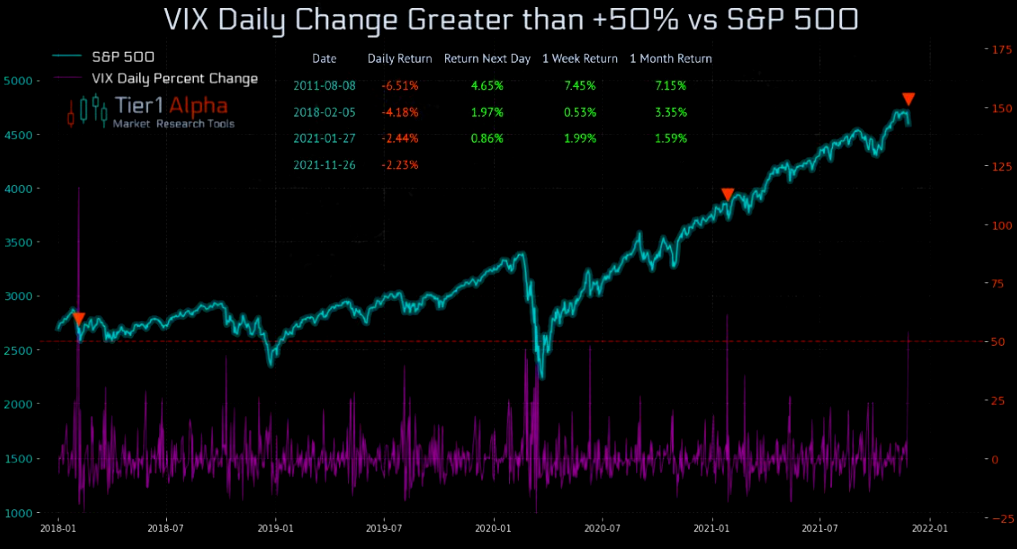
Graphic: Daily changes in the CBOE Volatility Index (INDEX: VIX) greater than 50% precede positive S&P 500 performance.

Expectations: As of 6:30 AM ET, Tuesday’s regular session (9:30 AM – 4:00 PM ET), in the S&P 500, will likely open in the lower part of a negatively skewed overnight inventory, outside of prior-range and -value, suggesting a potential for immediate directional opportunity.

Gap Scenarios: Gaps ought to fill quickly. Should they not, that’s a signal of strength; do not fade. Leaving value behind on a gap-fill or failing to fill a gap (i.e., remaining outside of the prior session’s range) is a go-with indicator.

Auctioning and spending at least 1-hour of trade back in the prior range suggests a lack of conviction; in such a case, do not follow the direction of the most recent initiative activity.

In the best case, the S&P 500 trades sideways or higher; activity above the $4,618.75 high volume area (HVNode) puts in play the $4,647.25 HVNode. Initiative trade beyond the latter HVNode could reach as high as the $4,674.25 micro composite point of control (MCPOC) and $4,691.25 HVNode, or higher.

In the worst case, the S&P 500 trades lower; activity below the $4,618.75 HVNode puts in play the $4,590.00 balance boundary (BAH). Initiative trade beyond the BAH could reach as low as the $4,574.25 HVNode and $4,551.75 LVNode, or lower.

Click here to load today’s updated key levels into the web-based TradingView charting platform. Note that all levels are derived using the 65-minute timeframe. New links are produced, daily.
Graphic: 65-minute profile chart of the Micro E-mini S&P 500 Futures. Learn about the profile.

Charts To Watch

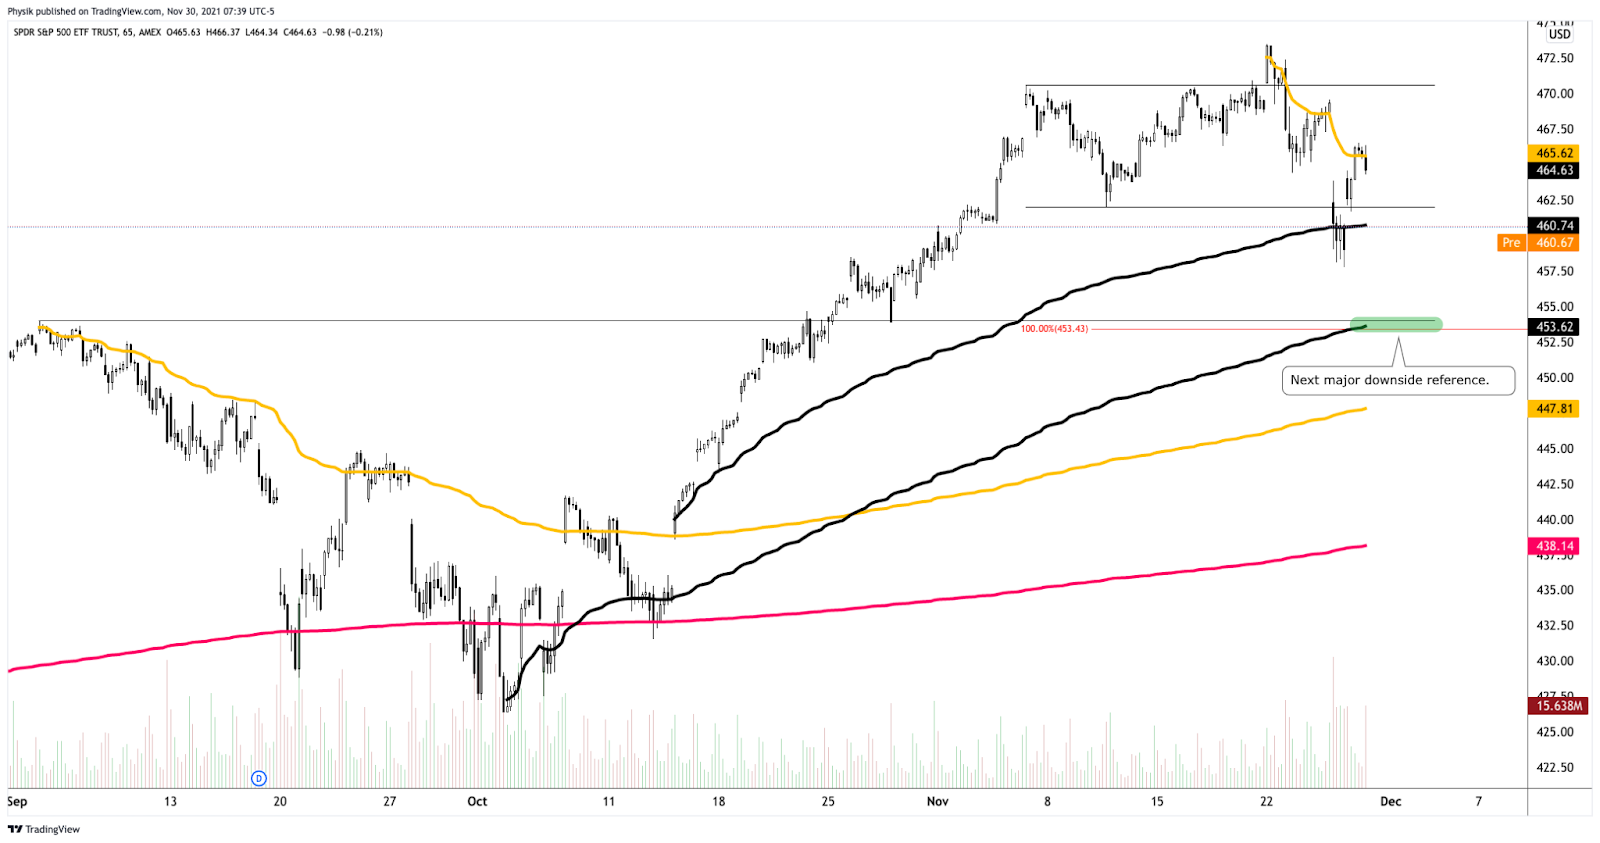
Graphic: (NYSE: SPY). (S~$453, R~$465). S is for support. R is for resistance.

Definitions

Volume Areas: A structurally sound market will build on areas of high volume (HVNodes). Should the market trend for long periods of time, it will lack sound structure, identified as low volume areas (LVNodes). LVNodes denote directional conviction and ought to offer support on any test. 

If participants were to auction and find acceptance into areas of prior low volume (LVNodes), then future discovery ought to be volatile and quick as participants look to HVNodes for favorable entry or exit.

MCPOCs: POCs are valuable as they denote areas where two-sided trade was most prevalent over numerous day sessions. Participants will respond to future tests of value as they offer favorable entry and exit.

Responsive Buying (Selling): Buying (selling) in response to prices below (above) an area of recent price acceptance.

Balance (Two-Timeframe Or Bracket): Rotational trade that denotes current prices offer favorable entry and exit. Balance-areas make it easy to spot a change in the market (i.e., the transition from two-time frame trade, or balance, to one-time frame trade, or trend). 

Modus operandi is responsive trade (i.e., fade the edges), rather than initiative trade (i.e., play the break).

Value-Area Placement: Perception of value unchanged if value overlapping (i.e., inside day). Perception of value has changed if value not overlapping (i.e., outside day). Delay trade in the former case.

Rates: Low rates have to potential to increase the present value of future earnings making stocks, especially those that are high growth, more attractive. To note, inflation and rates move inversely to each other. Low rates stimulate demand for loans (i.e., borrowing money is more attractive).

About

After years of self-education, strategy development, and trial-and-error, Renato Leonard Capelj began trading full-time and founded Physik Invest to detail his methods, research, and performance in the markets.

Additionally, Capelj is a Benzinga finance and technology reporter interviewing the likes of Shark Tank’s Kevin O’Leary, JC2 Ventures’ John Chambers, and ARK Invest’s Catherine Wood, as well as a SpotGamma contributor, developing insights around impactful options market dynamics.

Disclaimer

At this time, Physik Invest does not manage outside capital and is not licensed. In no way should the materials herein be construed as advice. Derivatives carry a substantial risk of loss. All content is for informational purposes only.
Categories
Commentary

Daily Brief For November 29, 2021

What Happened

Overnight, equity index futures auctioned sideways to higher as participants looked to take back nearly all of Friday’s shortened holiday trading range. 

According to some metrics, the SPDR S&P 500 ETF Trust (NYSE: SPY), one of the largest ETFs that track the S&P 500 index, experienced one of its most illiquid days, Friday.

At the same time, the CBOE Volatility Index (INDEX: VIX) closed up nearly 50% while the VIX futures term structure settled in backwardation amidst a re-pricing of tail-risk, so to speak.

Moreover, ahead is data on Pending Home Sales (10:00 AM ET).

Graphic updated 5:50 AM ET. Sentiment Neutral if expected /ES open is inside of the prior day’s range. /ES levels are derived from the profile graphic at the bottom of the following section. Levels may have changed since initially quoted; click here for the latest levels. SqueezeMetrics Dark Pool Index (DIX) and Gamma (GEX) calculations are based on where the prior day’s reading falls with respect to the MAX and MIN of all occurrences available. A higher DIX is bullish. At the same time, the lower the GEX, the more (expected) volatility. Learn the implications of volatility, direction, and moneyness. SHIFT data used for S&P 500 (INDEX: SPX) options activity. Note that options flow is sorted by the call premium spent; if more positive then more was spent on call options. Breadth reflects a reading of the prior day’s NYSE Advance/Decline indicator. VIX reflects a current reading of the CBOE Volatility Index (INDEX: VIX) from 0-100.

What To Expect

Despite the lackluster intraday breadth and divergent market liquidity metrics, the worst-case outcome occurred, Friday, evidenced by downside expansion of range and separation of value.

Coming into the session, the experiences associated with ‘Volmageddon’ came to mind; the VIX was up nearly 40.00%, a concern given the exuberance of past weeks and options positioning, as well as a decline in correlations, and unsupportive breadth.

Tempering the fall were divergences; the Russell 2000 was down nearly 4.00% before Friday’s U.S. open while the S&P 500 was off about 2.00% or so, buoyed by the Nasdaq 100 which was only down about 1.00% amidst an 8% dip in the ten-year yield.

The divergence persisted with the S&P 500 closing firmly below its 20-day simple moving average, a visual level often acted on by short-term, technically-driven participants who generally are unable to defend retests.

Graphic: Divergent delta (i.e., non-committed selling as measured by volume delta or buying and selling power as calculated by the difference in volume traded at the bid and offer) in SPDR S&P 500 ETF Trust (NYSE: SPY), one of the largest ETFs that track the S&P 500 index.

Context: A resurgence in the COVID-19 coronavirus as an improvement in macroeconomic conditions prompts a hawkish shift from the Federal Reserve (Fed). 

“Many risky asset tailwinds in 2021 are turning into at least mild headwinds in 2022,” Nordea says. “Economic growth should decelerate, liquidity conditions are deteriorating, profit margins should be under pressure from rising costs and question marks regarding the Fed/ECB put will arise due to elevated inflation indicators. To us, this spells higher volatility.”

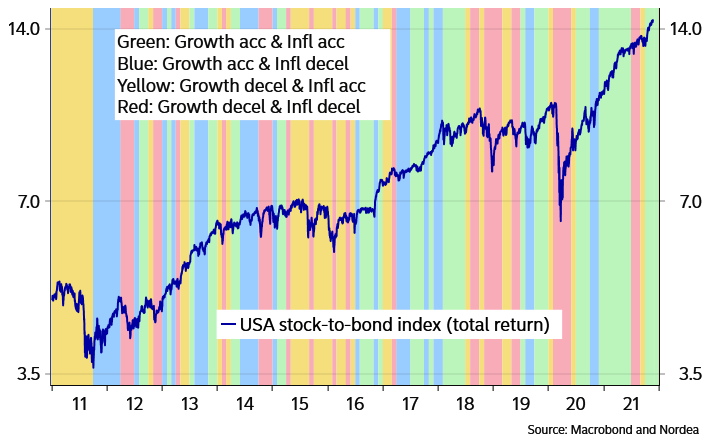
Moreover, for the past two years, almost, equities rallied amidst an acceleration in growth, which is typically correlated with equity outperformance over bonds.

Graphic: Accelerating growth correlates with equity outperformance over bonds.

At the same time, there’s been an insatiable appetite for stocks, according to Bloomberg, with investors pouring “almost $900 billion into equity exchange-traded and long-only funds in 2021 — exceeding the combined total from the past 19 years.”

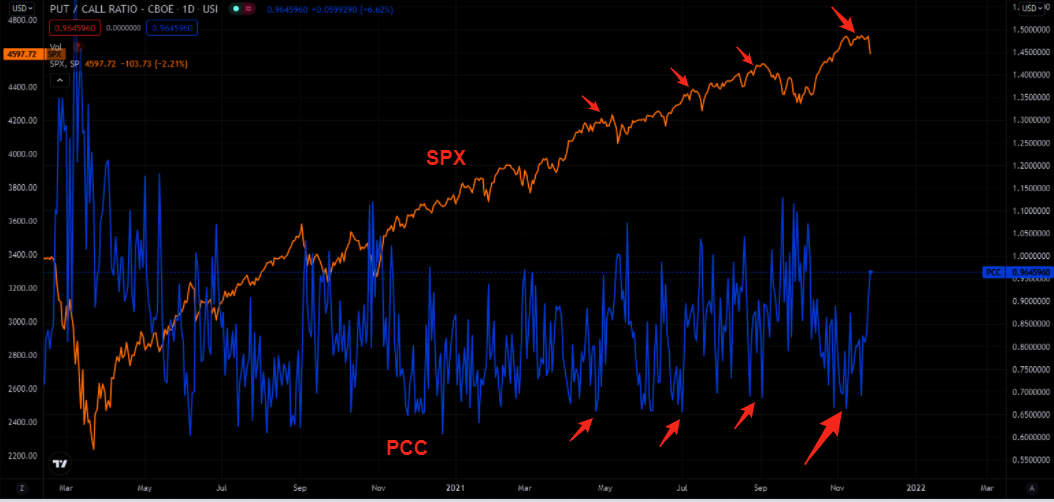
This appetite for risk fed into the activity of some high-flyers like Tesla Inc (NASDAQ: TSLA) with customers, at least in the past weeks, opting to aggressively sell puts and buy calls heading into the November monthly options expiration (OPEX).

Graphic: Per The Market Ear, participants were hating on downside protection for weeks.

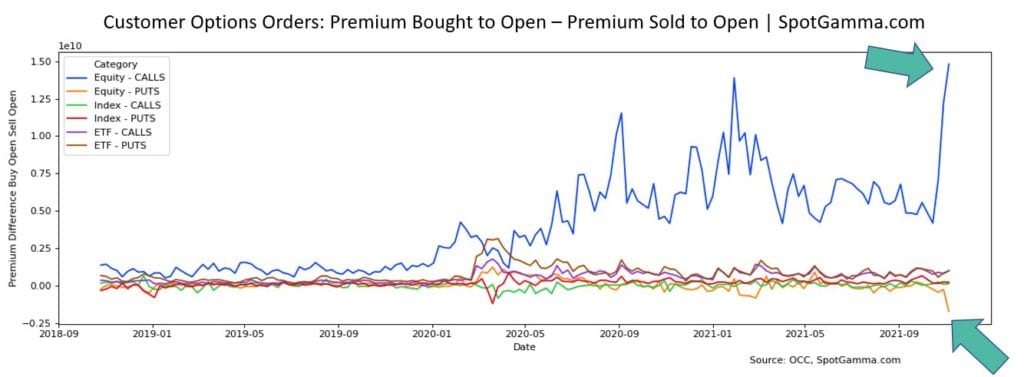
Unfortunately, (1) after OPEX, the absence of sticky and supportive hedging flows freed the broader market for directional resolve, and (2) according to SpotGamma, in light of recent exuberance, “participants [were] underexposed to downside put protection.”

Graphic: Customers took on significant leverage in their purchase and sale of options, via SpotGamma.

What this meant was that after OPEX’s unpinning and increase in correlation, fundamental contexts were to matter more.

Therefore, the Fed’s “increased openness to accelerat[e] the taper pace” and hike rates, alongside fresh travel restrictions on a new COVID-19 variant, as well as holiday illiquidity, resulted in a rough re-pricing of tail risk as participants sought after those highly “convex” options which had counterparties exacerbating underlying price movement.

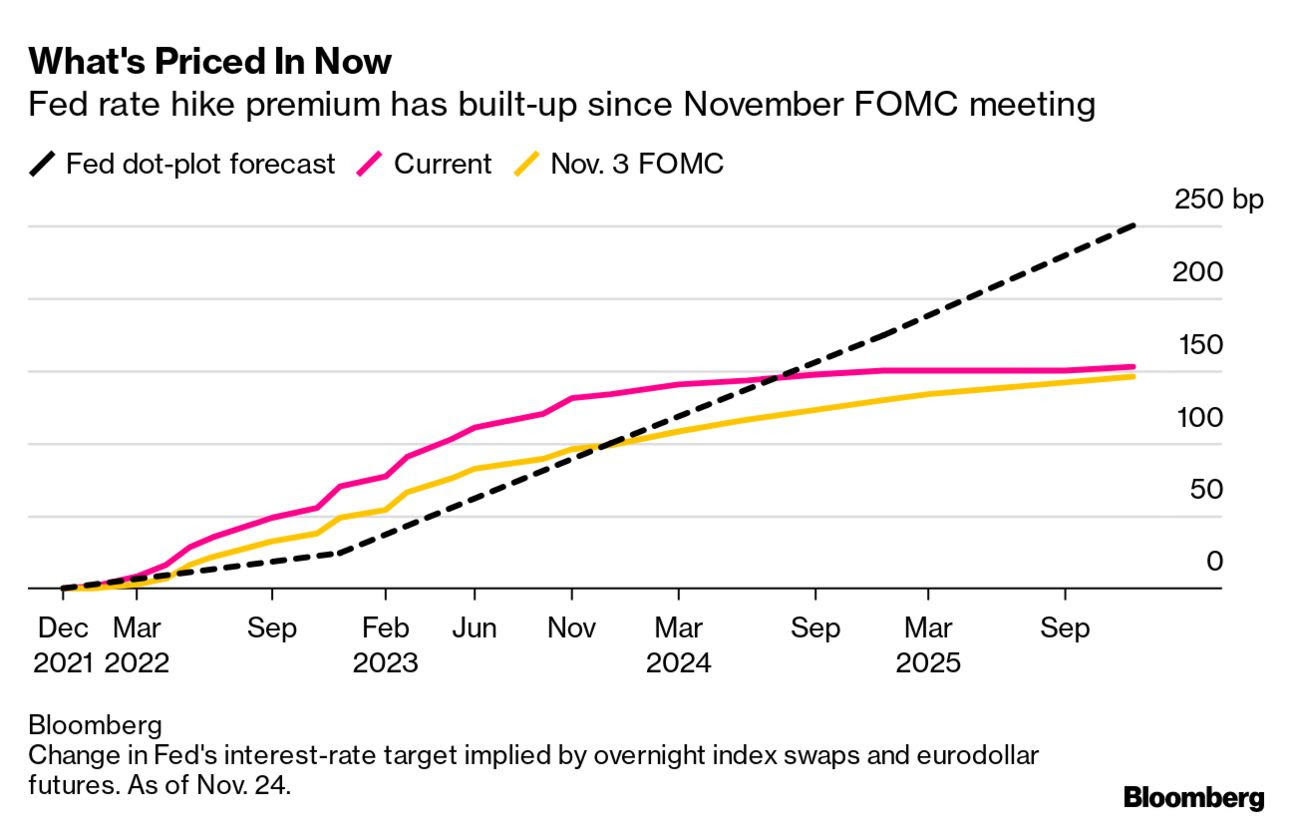
Graphic: According to Bloomberg, markets price “a full quarter-point rate hike into the June Fed meeting with a second by September and a third by December.”

To elaborate, in short, was volatility to pick up, those participants (who were once exuberant) were likely to reach for protection forcing dealers to reflexively hedge in a destabilizing manner. 

Dealers is the term used to describe those participants that take the other side and warehouse customer options risk, at least in the case where orders can’t be matched between customers.

With that, as volatility rose and customers demanded protection, counterparties hedged by selling into weakness. The conditions worsened when much of the activity was concentrated in shorter-dated tenors where the sensitivity of options to direction is higher if we will.

Graphic: VIX term structure. Backwardation signals an entry into an unstable environment.

Once that short-dated protection rolls off the table (and/or is monetized), dealers will reverse and support the market, buying to close their existing stock/futures hedges.

This flow is stabilizing and may play into a seasonally-aligned rally into Christmas as participants see defenses rolled out against the new COVID-19 variant, and the positive effects of pro-cyclical inflation and economic growth, improvements in global trade, and continuity at the Fed, among other dynamics, play out.

We see participants opportunistically buying the dip, already, via metrics like DIX that’s derived from liquidity provision on the market-making side.

Expectations: As of 6:00 AM ET, Monday’s regular session (9:30 AM – 4:00 PM ET), in the S&P 500, will likely open in the middle part of a positively skewed overnight inventory, inside of prior-range and -value, suggesting a limited potential for immediate directional opportunity.

In the best case, the S&P 500 trades sideways or higher; activity above the $4,618.75 high volume area (HVNode) puts in play the $4,647.25 HVNode. Initiative trade beyond the latter HVNode could reach as high as the $4,674.25 micro composite point of control (MCPOC) and $4,691.25 HVNode, or higher.

In the worst case, the S&P 500 trades lower; activity below the $4,618.75 HVNode puts in play the $4,590.00 balance boundary (BAH). Initiative trade beyond the BAH could reach as low as the $4,574.25 HVNode and $4,551.75 LVNode, or lower.

Click here to load today’s updated key levels into the web-based TradingView charting platform. Note that all levels are derived using the 65-minute timeframe. New links are produced, daily.
Graphic: 65-minute profile chart of the Micro E-mini S&P 500 Futures. Learn about the profile.

Charts To Watch

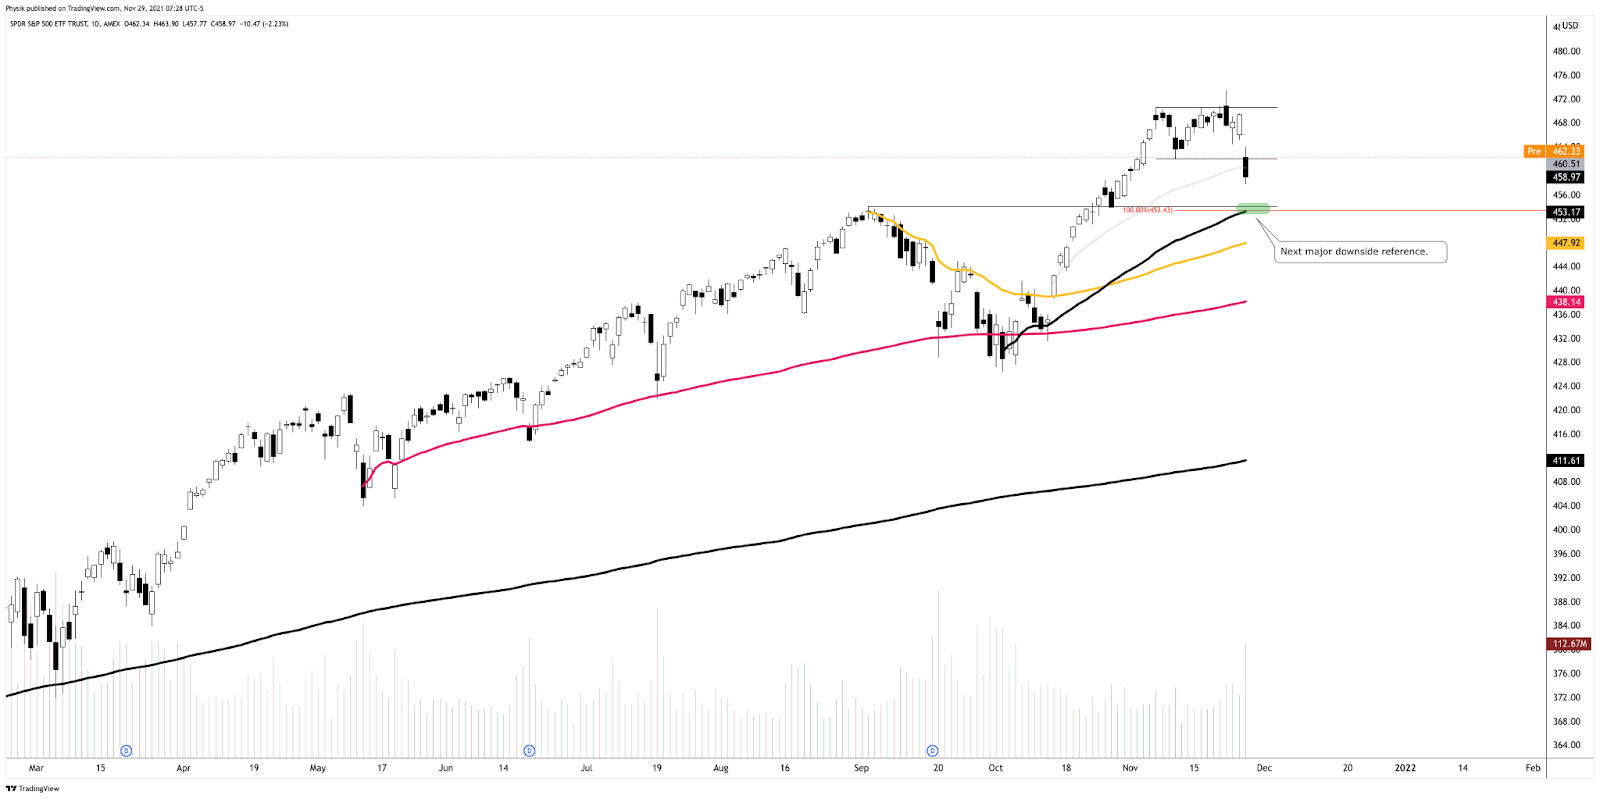
Graphic: (NYSE: SPY). (S~$460 and $453). S is for support.
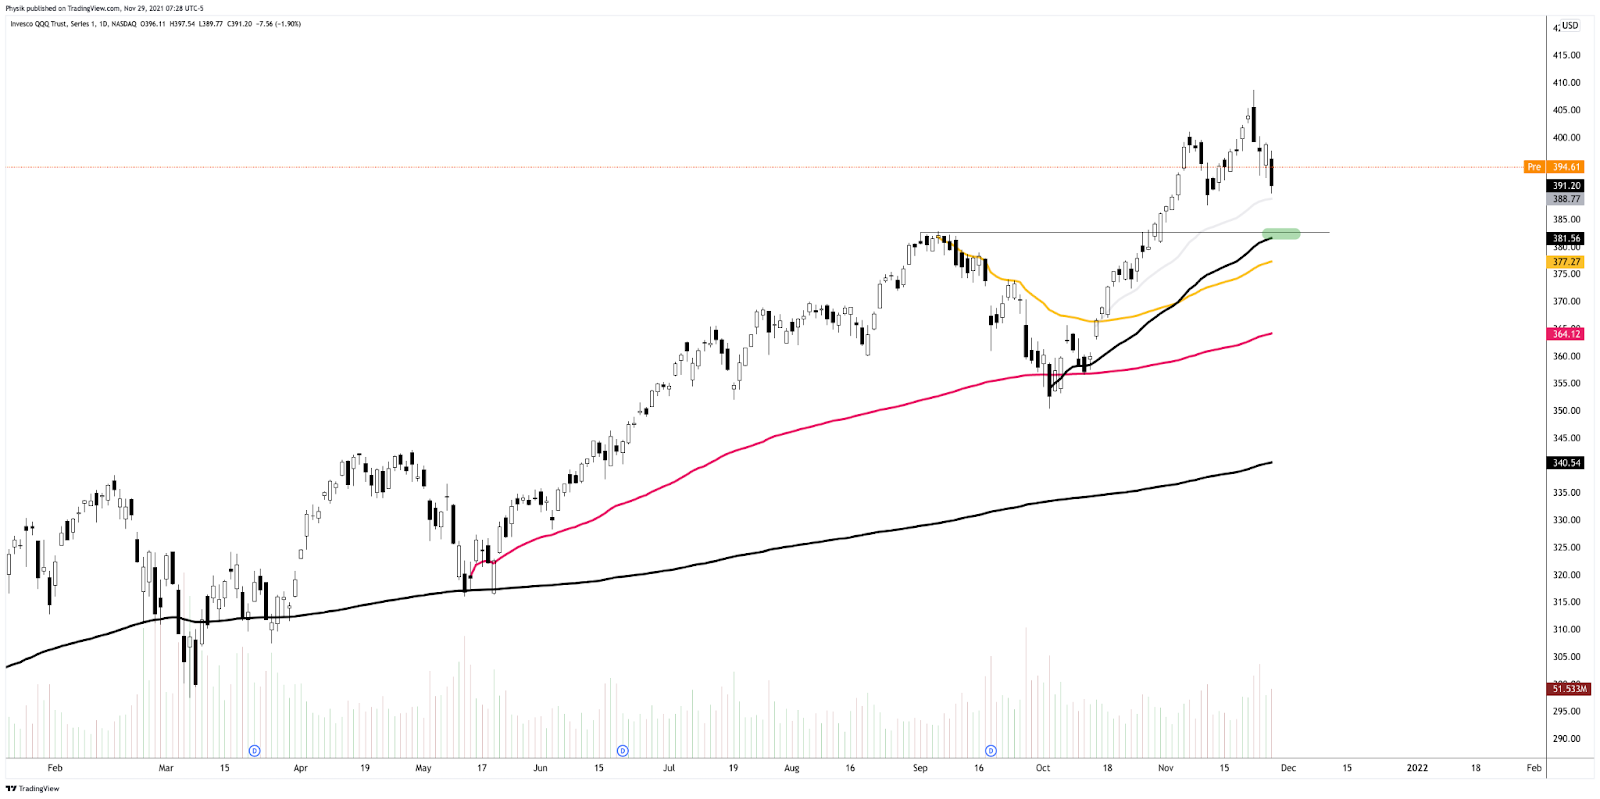
Graphic: (NASDAQ: QQQ). (S~$389 and $381). S is for support.
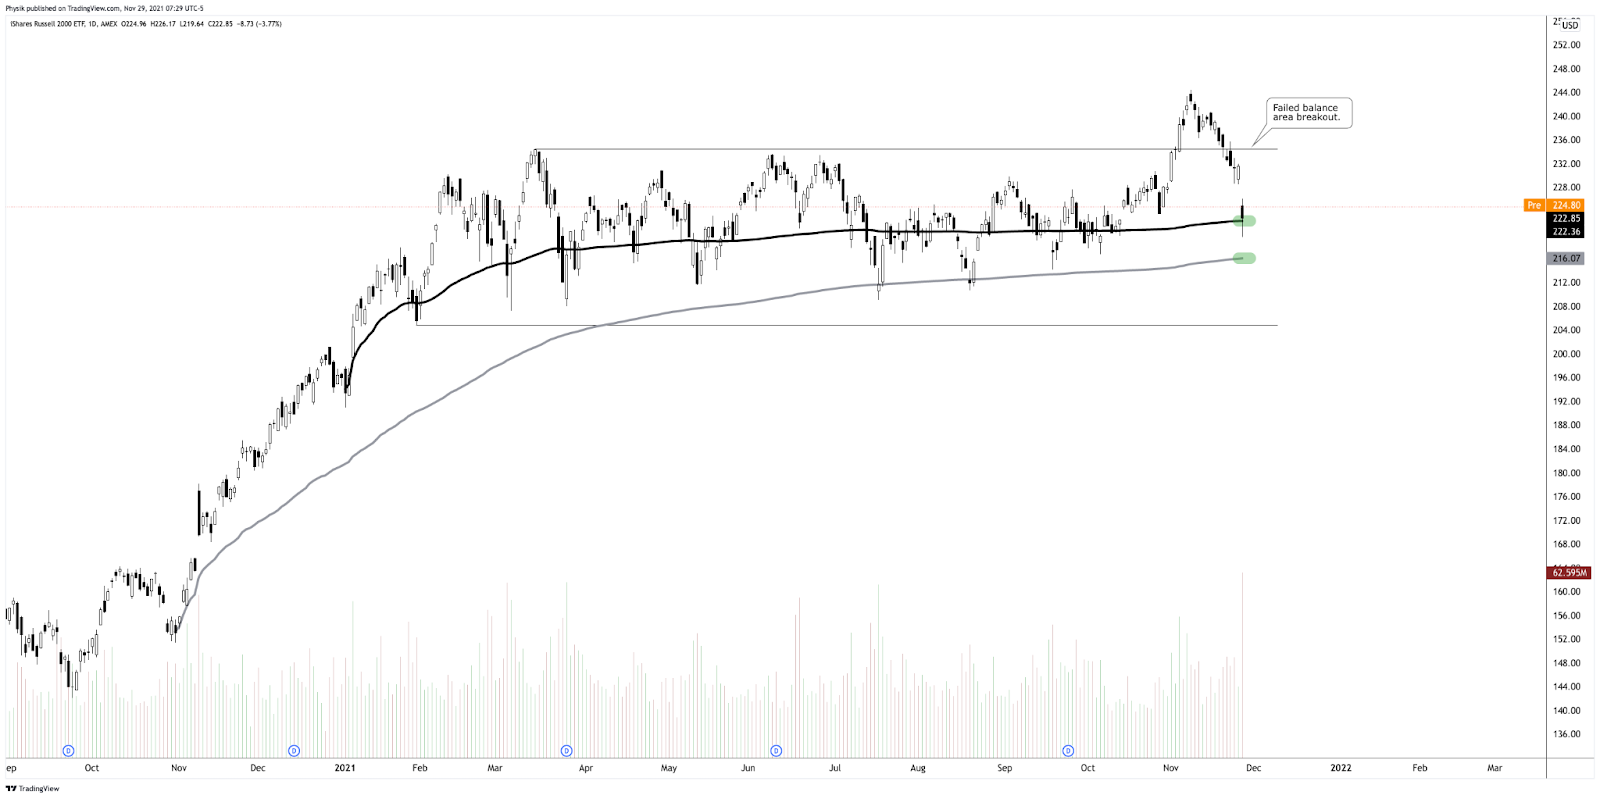
Graphic: (NYSE: IWM). (S~$222 and $216). S is for support.

What People Are Saying

Definitions

Overnight Rally Highs (Lows): Typically, there is a low historical probability associated with overnight rally-highs (lows) ending the upside (downside) discovery process.

Volume Areas: A structurally sound market will build on areas of high volume (HVNodes). Should the market trend for long periods of time, it will lack sound structure, identified as low volume areas (LVNodes). LVNodes denote directional conviction and ought to offer support on any test. 

If participants were to auction and find acceptance into areas of prior low volume (LVNodes), then future discovery ought to be volatile and quick as participants look to HVNodes for favorable entry or exit.

Gamma: Gamma is the sensitivity of an option to changes in the underlying price. Dealers that take the other side of options trades hedge their exposure to risk by buying and selling the underlying. When dealers are short-gamma, they hedge by buying into strength and selling into weakness. When dealers are long-gamma, they hedge by selling into strength and buying into weakness. The former exacerbates volatility. The latter calms volatility.

POCs: POCs are valuable as they denote areas where two-sided trade was most prevalent in a prior day session. Participants will respond to future tests of value as they offer favorable entry and exit.

MCPOCs: POCs are valuable as they denote areas where two-sided trade was most prevalent over numerous day sessions. Participants will respond to future tests of value as they offer favorable entry and exit.

Options Expiration (OPEX): Traditionally, option expiries mark an end to pinning (i.e, the theory that market makers and institutions short options move stocks to the point where the greatest dollar value of contracts will expire) and the reduction dealer gamma exposure.

Rates: Low rates have to potential to increase the present value of future earnings making stocks, especially those that are high growth, more attractive. To note, inflation and rates move inversely to each other. Low rates stimulate demand for loans (i.e., borrowing money is more attractive).

About

After years of self-education, strategy development, and trial-and-error, Renato Leonard Capelj began trading full-time and founded Physik Invest to detail his methods, research, and performance in the markets.

Additionally, Capelj is a Benzinga finance and technology reporter interviewing the likes of Shark Tank’s Kevin O’Leary, JC2 Ventures’ John Chambers, and ARK Invest’s Catherine Wood, as well as a SpotGamma contributor, developing insights around impactful options market dynamics.

Disclaimer

At this time, Physik Invest does not manage outside capital and is not licensed. In no way should the materials herein be construed as advice. Derivatives carry a substantial risk of loss. All content is for informational purposes only.
Categories
Commentary

Daily Brief For November 4, 2021

Abstract

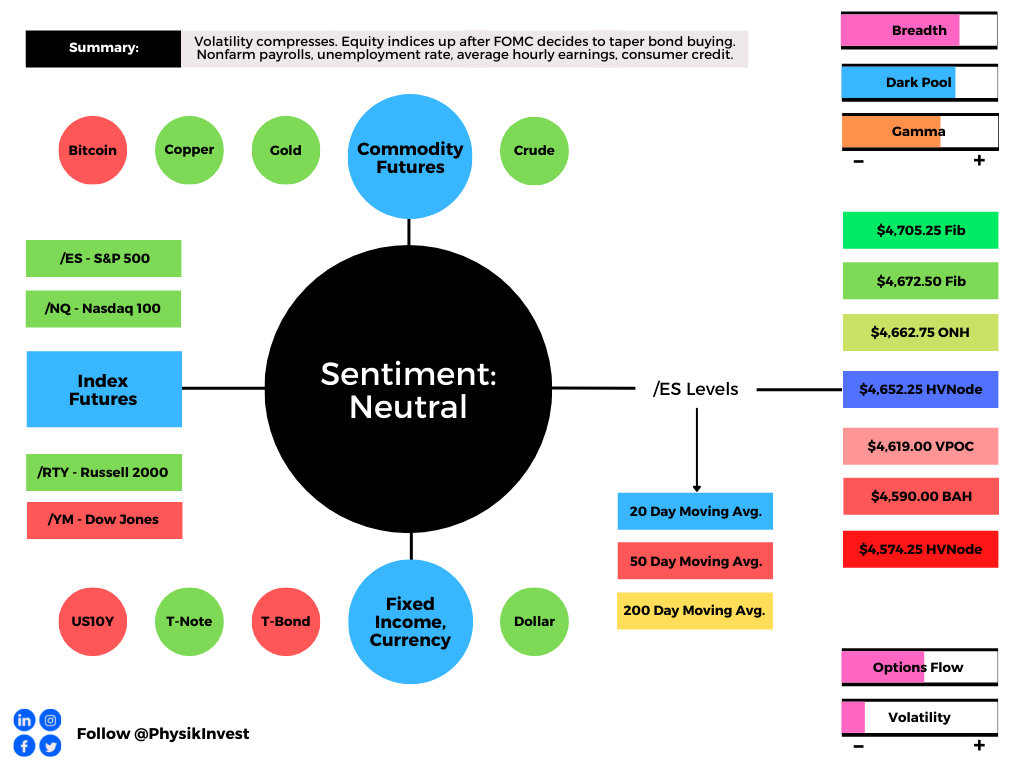
Equity index futures higher. Commodities were mostly higher. Bonds mixed. Volatility compressed.

Ahead is a heavier day of economic releases, in the face of fundamental narratives and positioning metrics that support intraday price stability.

What Happened

Overnight, equity index futures auctioned sideways to higher alongside the Federal Open Market Committee’s decision to taper bond buying and hold rate hikes.

Ahead is data on nonfarm payrolls, unemployment rate, and average hourly earnings (8:30 AM ET), as well as consumer credit (3:00 PM ET).

Graphic updated 6:30 AM ET. Sentiment Neutral if expected /ES open is inside of the prior day’s range. /ES levels are derived from the profile graphic at the bottom of the following section. Levels may have changed since initially quoted; click here for the latest levels. SqueezeMetrics Dark Pool Index (DIX) and Gamma (GEX) calculations are based on where the prior day’s reading falls with respect to the MAX and MIN of all occurrences available. A higher DIX is bullish. At the same time, the lower the GEX, the more (expected) volatility. Learn the implications of volatility, direction, and moneyness. SHIFT data used for S&P 500 (INDEX: SPX) options activity. Note that options flow is sorted by the call premium spent; if more positive then more was spent on call options. Breadth reflects a reading of the prior day’s NYSE Advance/Decline indicator. VIX reflects a current reading of the CBOE Volatility Index (INDEX: VIX) from 0-100.

What To Expect

Action: On supportive intraday breadth and market liquidity metrics, the best case outcome occurred, evidenced by a spike away from an area of balanced, sideways trade in S&P 500 (INDEX: SPX) (ETF: SPY) (FUTURE: /ES).

Intent: As also evidenced by the separation of value (i.e., the area where 70% of the day’s trade occurred), the spike marks a potential willingness to continue the trend.

Validation: Continued sideways to higher trade, above the $4,627.00 level (a prior all-time high), validates the market’s prevailing intent to markup in the face of new information.

Consideration: Poor structure left behind prior initiative trade (as evidenced by the presence of numerous gaps and p-shaped emotional, multiple-distribution profile structures which denote short-covering and a lack of material, new-money buying) adds to technical instability.

This is a remark, which has been made in the last several commentaries, remains valid; post-FOMC, should the market crack, participants will likely look to check old value (i.e., revisit, repair, and strengthen) these pockets of low-volume, feverishly.

Graphic: Supportive delta (i.e., committed buying as measured by volume delta or buying and selling power as calculated by the difference in volume traded at the bid and offer) in SPDR S&P 500 ETF Trust (NYSE: SPY), one of the largest ETFs that track the S&P 500 index, via Bookmap. The readings are supportive of initiative trade (i.e., directional trade that suggests old prices were not favorable to entry and exit; the market is not in balance).

Context: The aforementioned trade is happening in the context of the FOMC’s decision to taper bond purchases and not raise interest rates.

The implications of this are, as evidenced by a near-vertical price rise, seen as positive

To elaborate, Bloomberg’s John Authers writes: “In 2013, the bond market threw a tantrum at the mere mention of a taper. Real financial conditions had sharply tightened before the Fed could eventually start withdrawing stimulus. This time, real yields are no higher than they were on New Year’s Day. People are still prepared to lend money to the government on the assumption that they will get a return a full percentage point below the inflation rate.”

On the topic of interest rates, “the Fed will warn us in advance – which in effect means that a rate rise should be penciled in for next July’s meeting, or June at the earliest.”

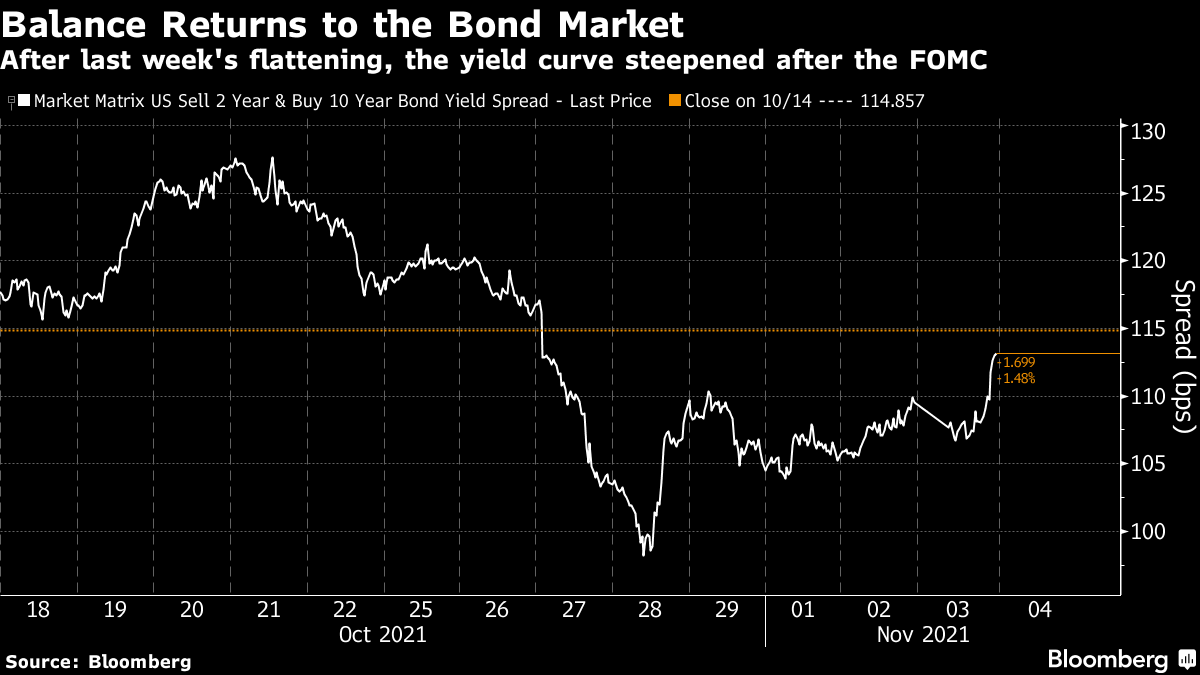
Graphic: Per Bloomberg, “Last week saw a dramatic flattening, in an implicit bet that the Fed was going to hike rates in the near term, and choke off growth in the longer term. The curve had already started to steepen by the end of last week, and it regained more ground after the Federal Open Market Committee and Jerome Powell’s press conference.”

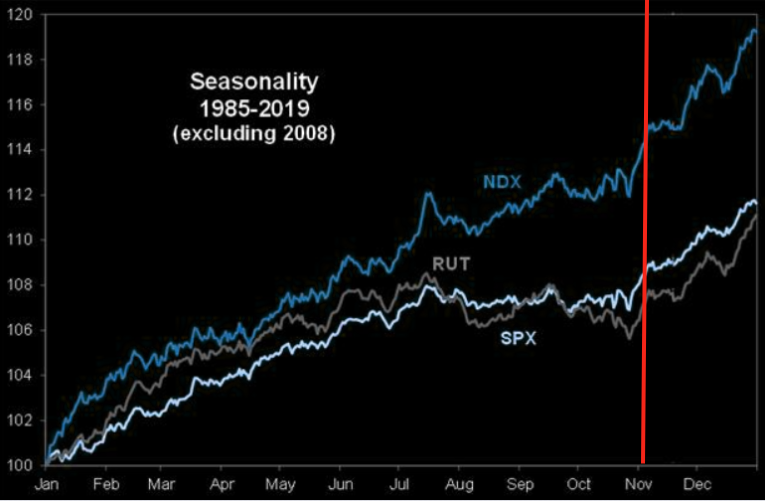
In terms of positioning, the CBOE Volatility Index (INDEX: VIX) was lower, while the VIX futures term structure came in a bit. To put it simply, participants were assuaged of their fears; the post-FOMC compression in volatility plays into an end-of-year, seasonally-aligned, rally supported by the flows typically associated with decaying, options hedges, according to SpotGamma.

Graphic: Goldman Sachs Group (NYSE: GS) charts S&P 500 seasonality. Taken from The Market Ear.

Expectations: As of 6:30 AM ET, Thursday’s regular session (9:30 AM – 4:00 PM ET), in the S&P 500, will likely open near the middle part of a positively skewed overnight inventory, just outside of prior-range and -value, suggesting a potential for directional opportunity.

Spike Scenarios Apply: Spikes mark the beginning of a break from value. Spikes higher (lower) are validated by trade at or above (below) the spike base (i.e., the origin of the spike). The spike reference to go by is $4,627.00, a prior all-time high.

In the best case, the S&P 500 trades sideways or higher; activity above the $4,652.25 high volume area (HVNode) puts in play the $4,662.75 overnight high (ONH). Initiative trade beyond the ONH could reach as high as the $4,672.50 and $4,705.25 Fibonacci, or higher.

In the worst case, the S&P 500 trades lower; activity below the $4,652.25 HVNode puts in play the $4,619.00 untested point of control (VPOC). Initiative trade beyond the VPOC could reach as low as the $4,590.00 balance area high (BAH) and $4,574.25 HVNode, or lower.

Click here to load today’s updated key levels into the web-based TradingView charting platform. Note that all levels are derived using the 65-minute timeframe. New links are produced, daily.
Graphic: 65-minute profile chart of the Micro E-mini S&P 500 Futures. Learn about the profile.

What People Are Saying

Definitions

Overnight Rally Highs (Lows): Typically, there is a low historical probability associated with overnight rally-highs (lows) ending the upside (downside) discovery process.

Volume Areas: A structurally sound market will build on areas of high volume (HVNodes). Should the market trend for long periods of time, it will lack sound structure, identified as low volume areas (LVNodes). LVNodes denote directional conviction and ought to offer support on any test. 

If participants were to auction and find acceptance into areas of prior low volume (LVNodes), then future discovery ought to be volatile and quick as participants look to HVNodes for favorable entry or exit.

POCs: POCs are valuable as they denote areas where two-sided trade was most prevalent in a prior day session. Participants will respond to future tests of value as they offer favorable entry and exit.

Balance (Two-Timeframe Or Bracket): Rotational trade that denotes current prices offer favorable entry and exit. Balance-areas make it easy to spot a change in the market (i.e., the transition from two-time frame trade, or balance, to one-time frame trade, or trend). 

Modus operandi is responsive trade (i.e., fade the edges), rather than initiative trade (i.e., play the break).

Value-Area Placement: Perception of value unchanged if value overlapping (i.e., inside day). Perception of value has changed if value not overlapping (i.e., outside day). Delay trade in the former case.

About

After years of self-education, strategy development, and trial-and-error, Renato Leonard Capelj began trading full-time and founded Physik Invest to detail his methods, research, and performance in the markets.

Additionally, Capelj is a Benzinga finance and technology reporter interviewing the likes of Shark Tank’s Kevin O’Leary, JC2 Ventures’ John Chambers, and ARK Invest’s Catherine Wood, as well as a SpotGamma contributor, developing insights around impactful options market dynamics.

Disclaimer

At this time, Physik Invest does not manage outside capital and is not licensed. In no way should the materials herein be construed as advice. Derivatives carry a substantial risk of loss. All content is for informational purposes only.
Categories
Commentary

Daily Brief For October 22, 2021

Editor’s Note: Due to travel commitments, the Daily Brief will not be sent 10/25-10/27.

Apologies and have a great weekend!

Market Commentary

Out of sync with bonds, equity index futures were mostly sideways to higher. Commodities were higher. Volatility compressed.

  • Ahead is manufacturing, services PMI.
  • Participants discover uncharted prices.
  • Options positioning presented tailwind.

What Happened: U.S. stock index futures, less the Nasdaq 100, auctioned sideways to higher overnight as participants looked to discover new prices.

Ahead is data on manufacturing and services PMI (9:45 AM ET), as well as Fed-speak (10:00 and 11:00 AM ET).

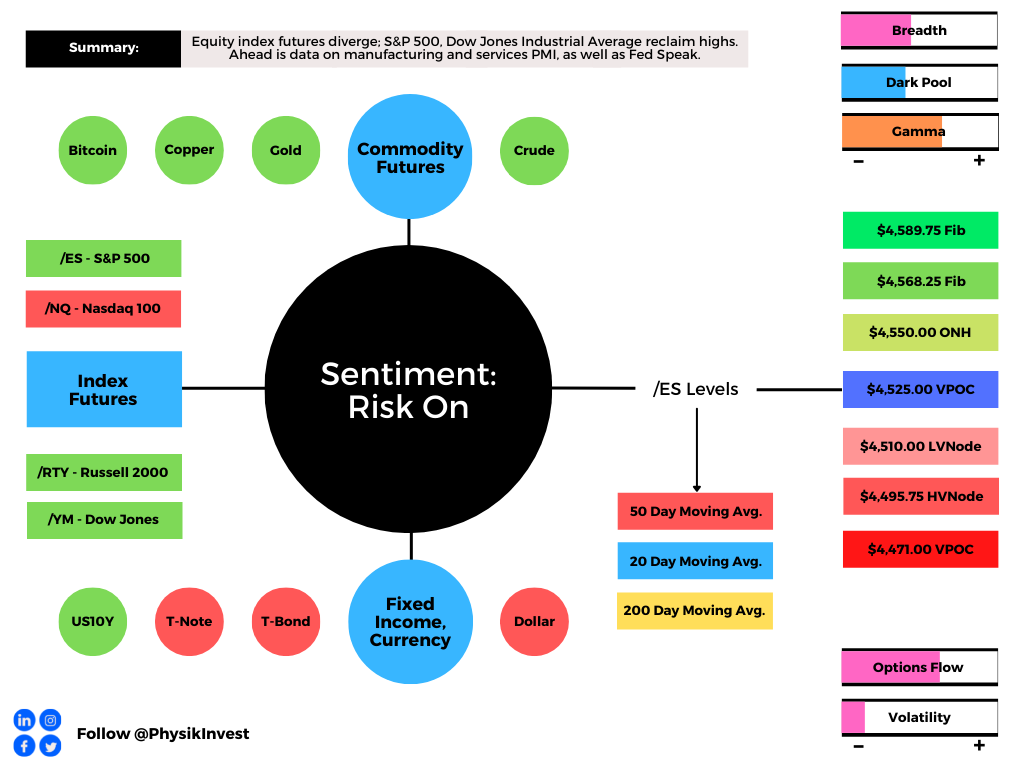
Graphic updated 6:40 AM ET. Sentiment Risk-On if expected /ES open is above the prior day’s range. /ES levels are derived from the profile graphic at the bottom of the following section. Levels may have changed since initially quoted; click here for the latest levels. SqueezeMetrics Dark Pool Index (DIX) and Gamma (GEX) calculations are based on where the prior day’s reading falls with respect to the MAX and MIN of all occurrences available. A higher DIX is bullish. At the same time, the lower the GEX, the more (expected) volatility. SHIFT data used for S&P 500 (INDEX: SPX) options activity. Note that options flow is sorted by the call premium spent; if more positive then more was spent on call options. Breadth reflects a reading of the prior day’s NYSE Advance/Decline indicator. VIX reflects a current reading of the CBOE Volatility Index (INDEX: VIX) from 0-100.

What To Expect: As of 6:30 AM ET, Friday’s regular session (9:30 AM – 4:00 PM EST) in the S&P 500 will likely open on a small gap, just outside of prior-range and -value, suggesting a potential for immediate directional opportunity.

Gap Scenarios: Gaps ought to fill quickly. Should they not, that’s a signal of strength; do not fade. Leaving value behind on a gap-fill or failing to fill a gap (i.e., remaining outside of the prior session’s range) is a go-with indicator.

Auctioning and spending at least 1-hour of trade back in the prior range suggests a lack of conviction; in such a case, do not follow the direction of the most recent initiative activity.

During the prior day’s regular trade, on light volume, nonparticipatory intraday breadth, and supportive market liquidity metrics, the best case outcome occurred, evidenced by upside resolve, above flattened day timeframe profile structures, or ledges.

This activity comes after prior sessions left behind numerous gaps and emotional, multiple-distribution profile structures.

Further, Thursday’s overnight gap in range, below value, set indices up for what is called the cave-fill process (characterized by repair and strengthening of low volume areas).

The day timeframe activity rejected lower prices; participants auctioned to new highs in both regular and overnight trade, putting in play a recovery of the un-adjusted overnight high (ONH) at $4,550.00.

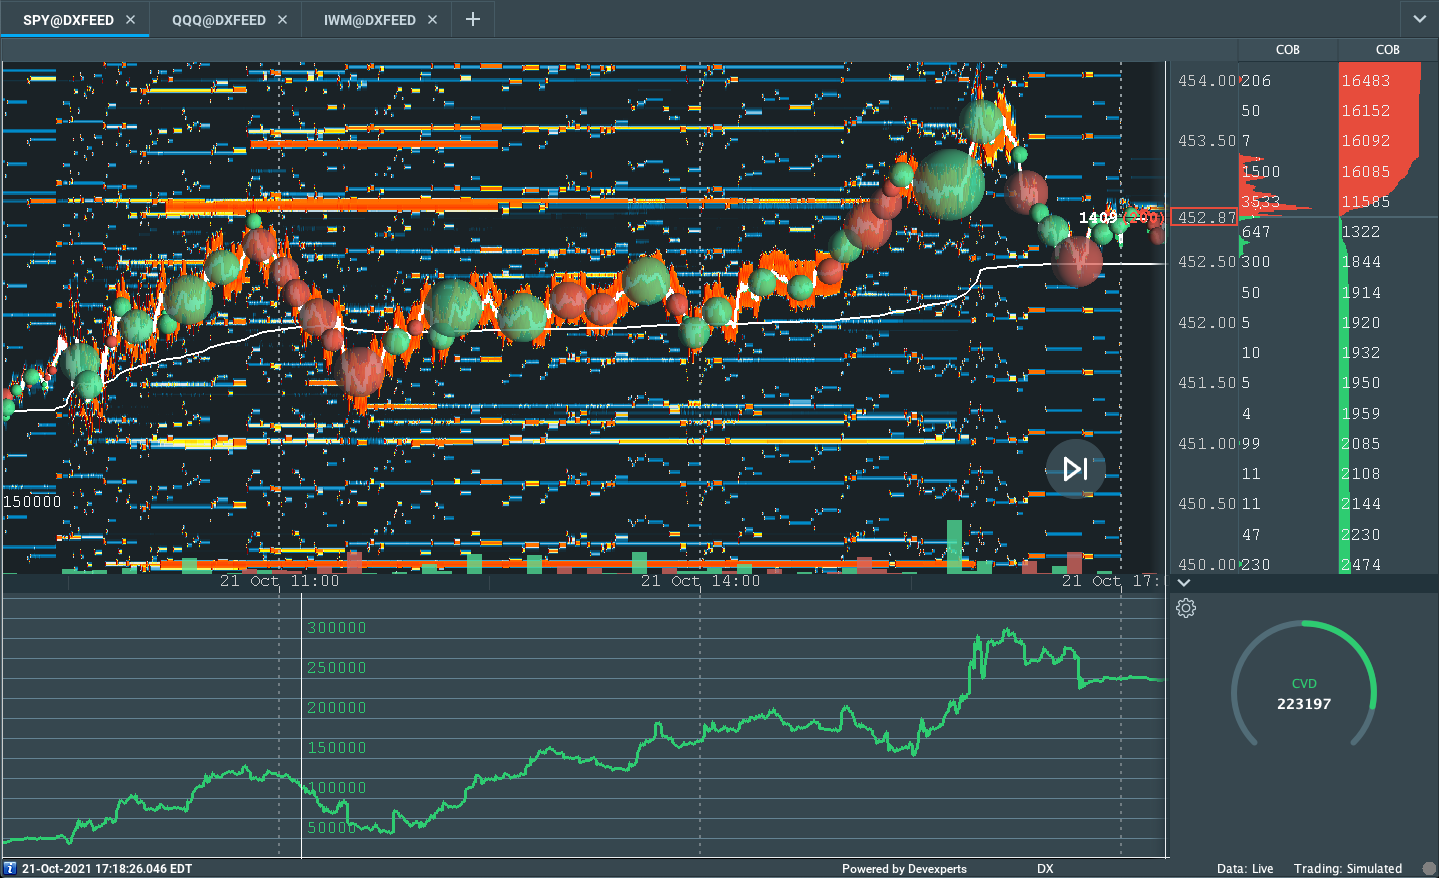
Graphic: Supportive delta (i.e., committed buying as measured by volume delta or buying and selling power as calculated by the difference in volume traded at the bid and offer) in SPDR S&P 500 ETF Trust (NYSE: SPY), one of the largest ETFs that track the S&P 500 index, via Bookmap. The readings are supportive of initiative trade.

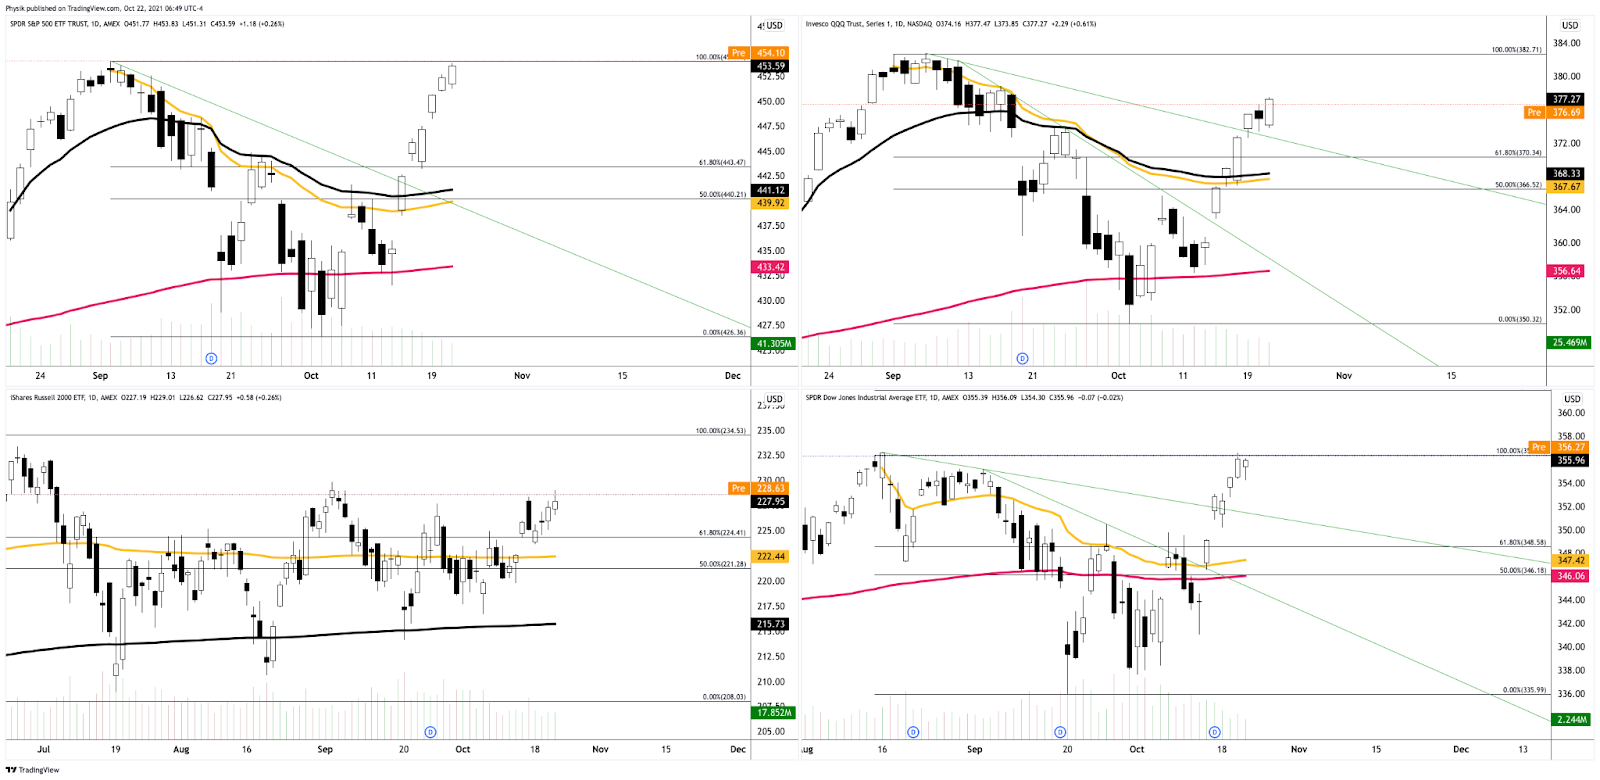
Zooming out, we see that though the Nasdaq 100 firmed this week, it did not recover as much ground as its peers, the S&P 500 and Dow Jones Industrial Average, both of which are trading at or above their all-time high figures. 

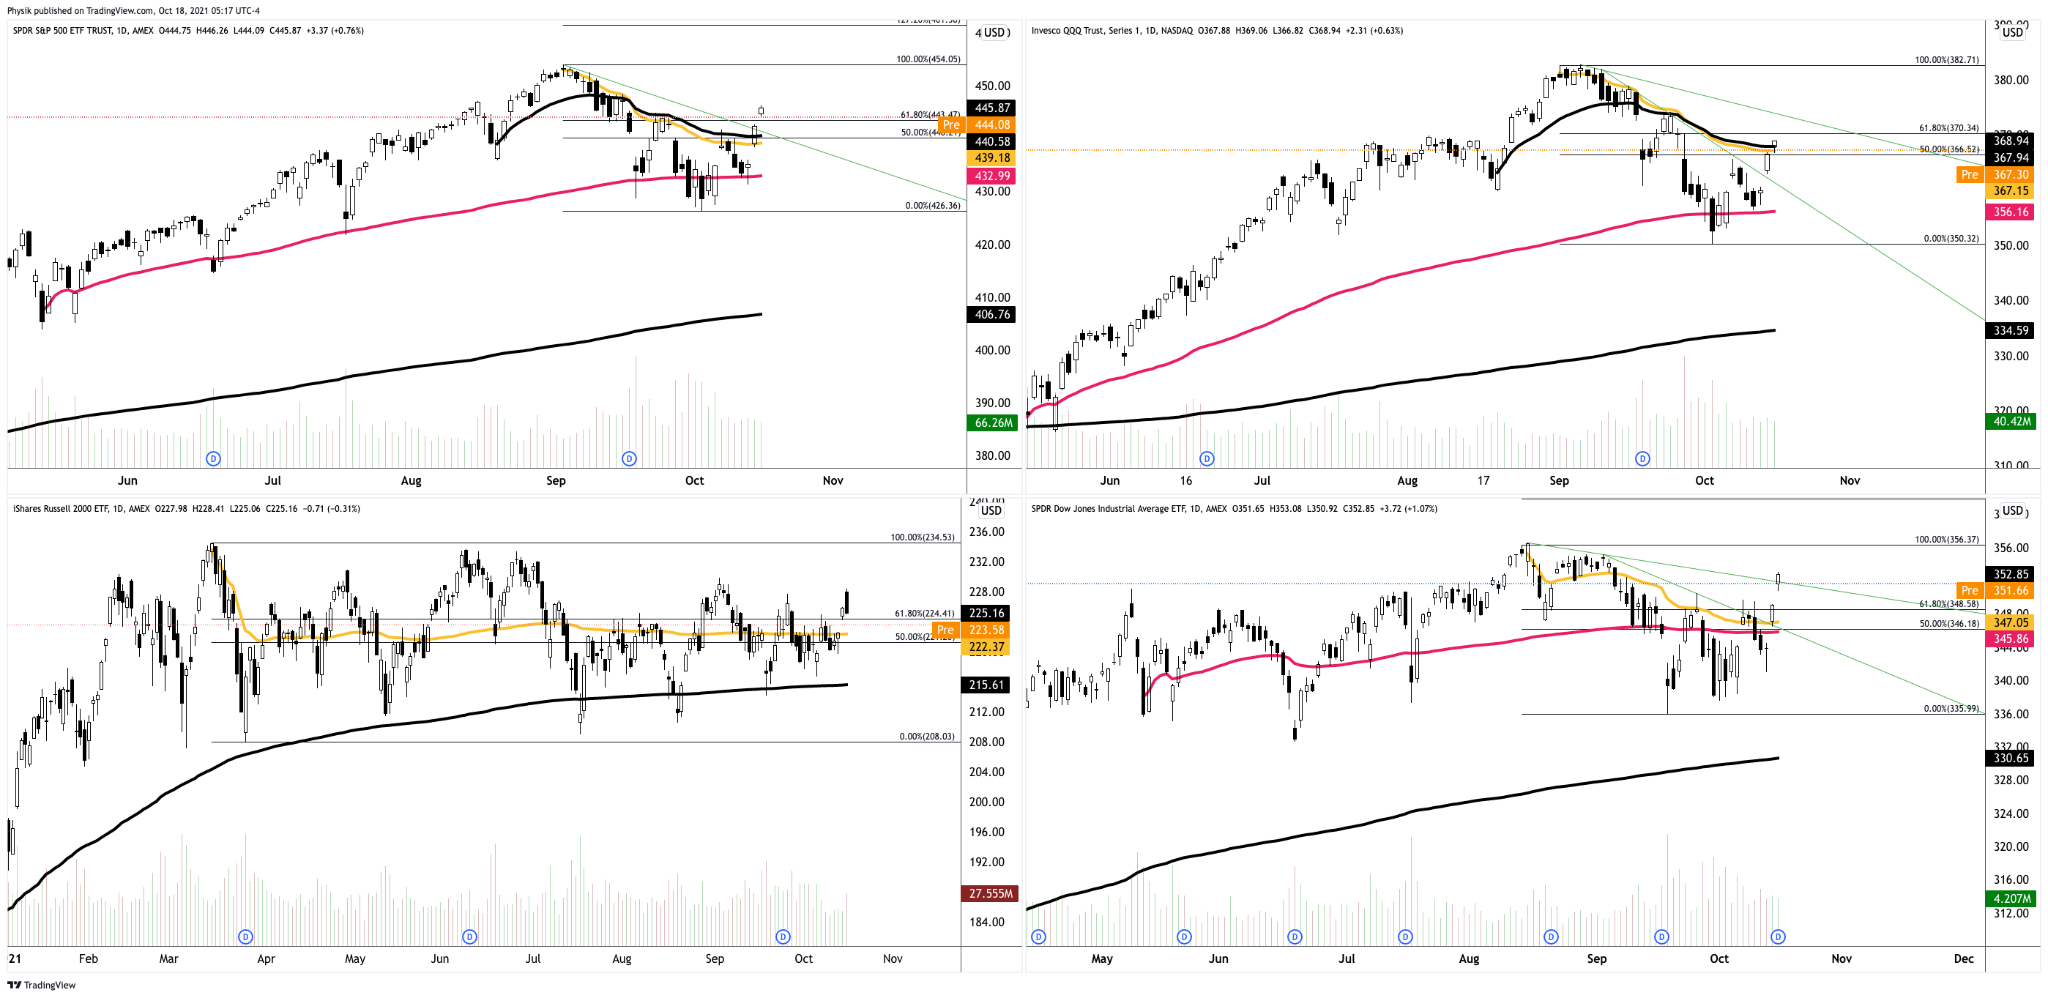
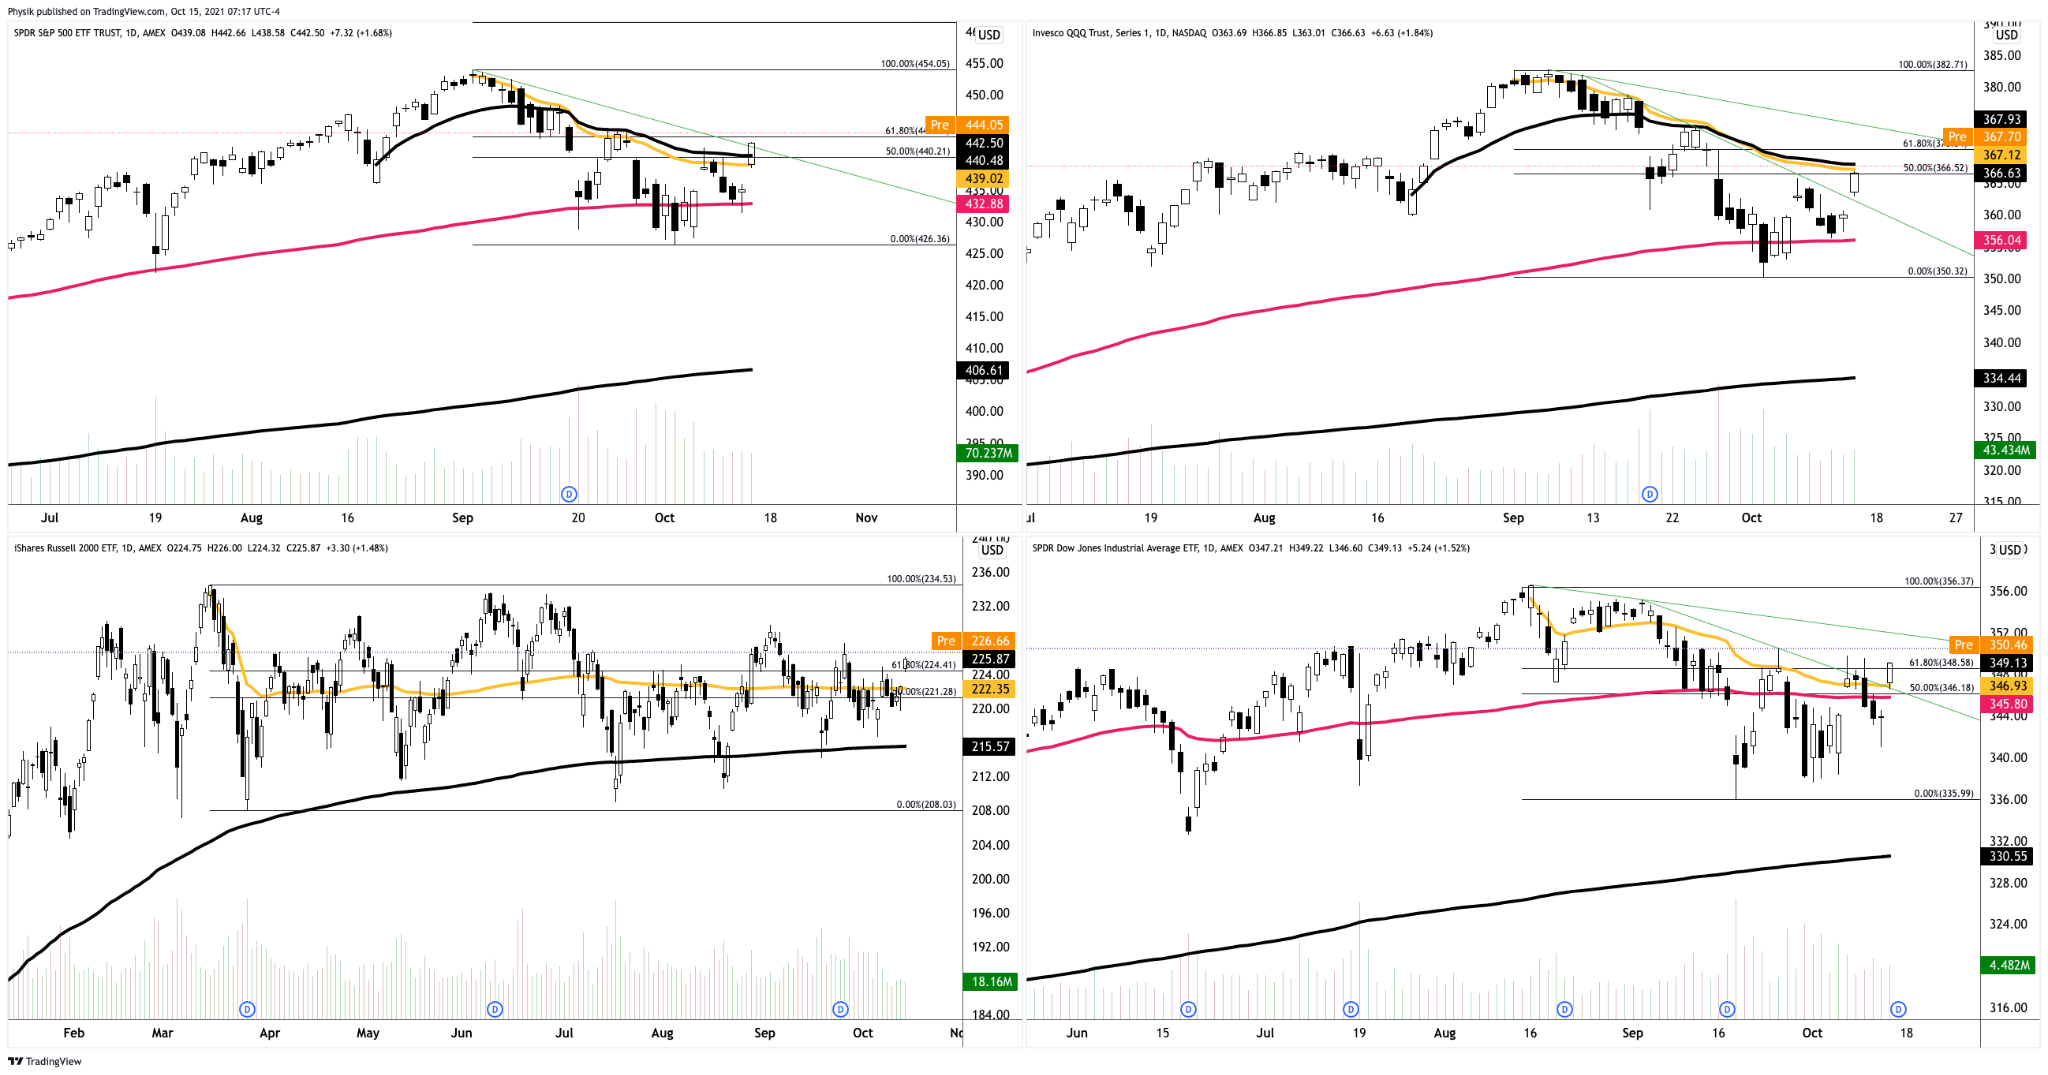
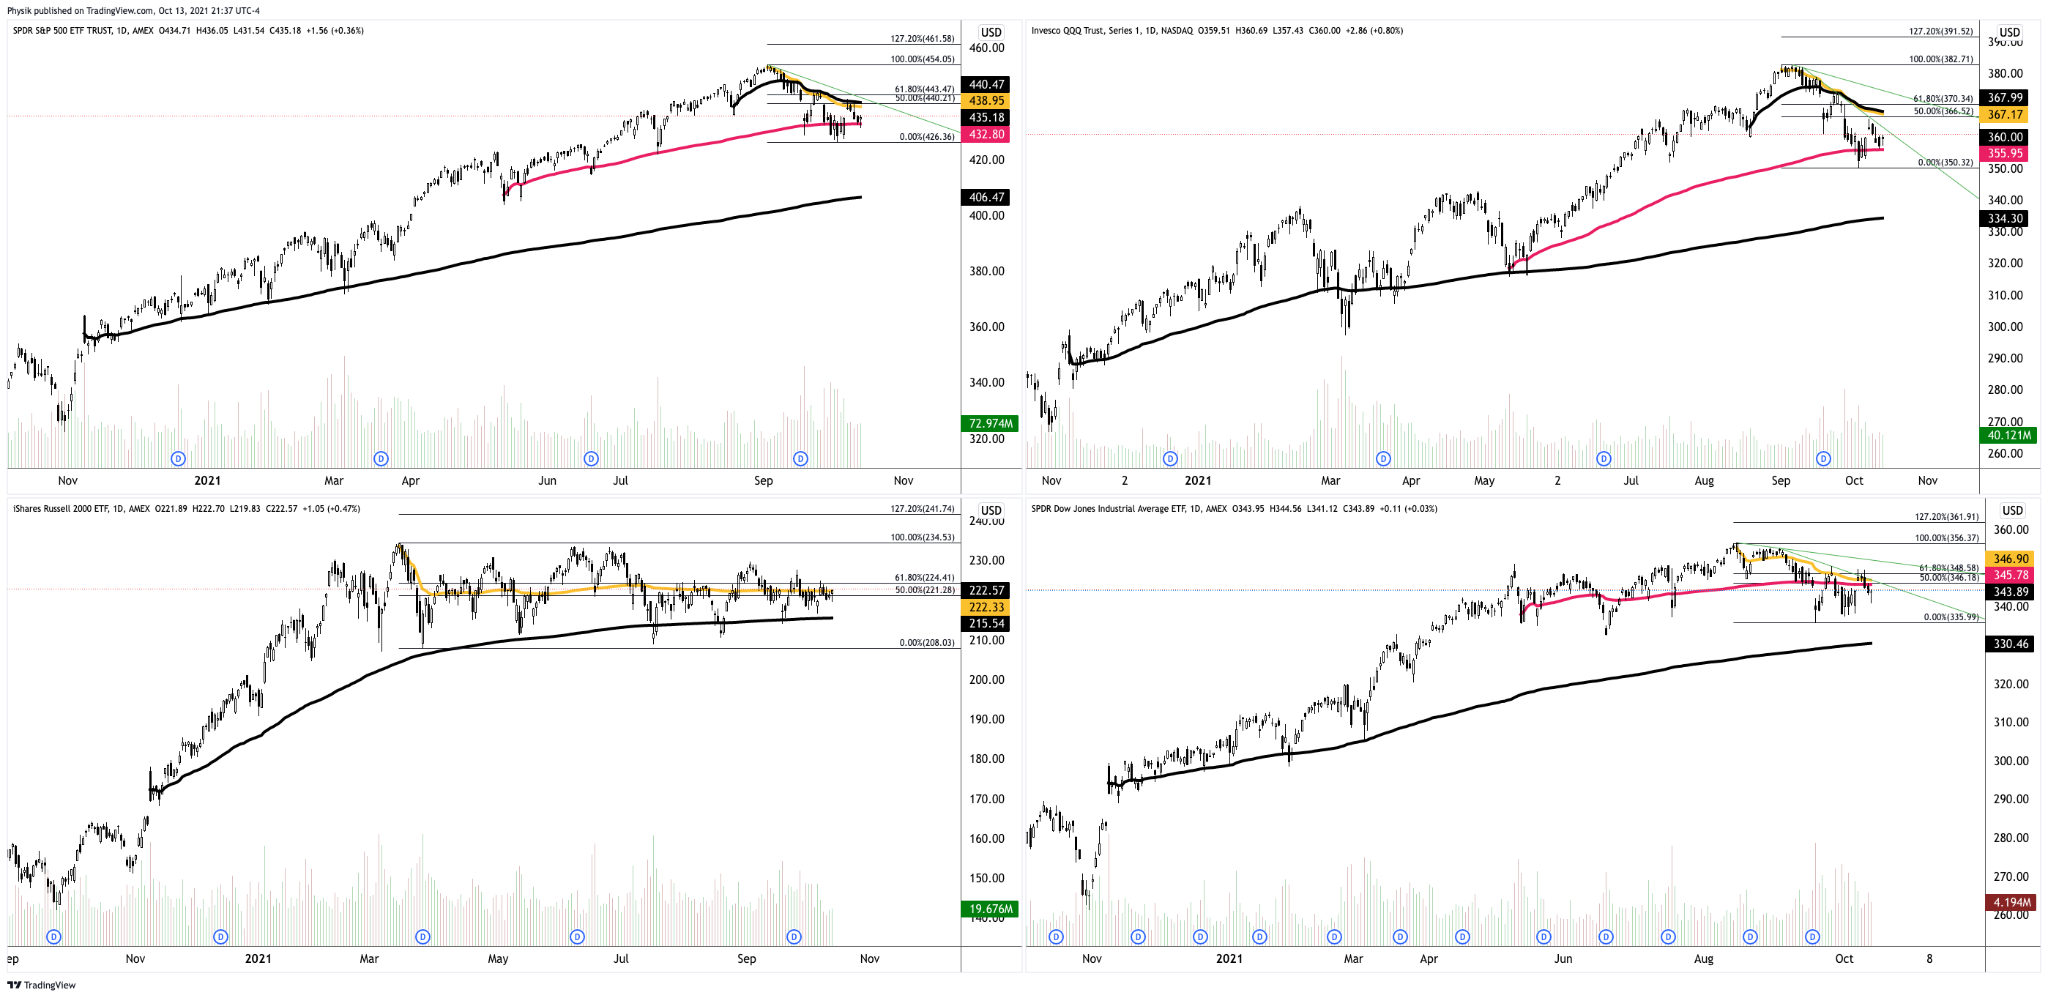
Graphic: SPDR S&P 500 ETF (NYSE: SPY) top left, Invesco QQQ Trust Series 1 (NASDAQ: QQQ) top right, iShares Russell 2000 ETF (NYSE: IWM) bottom left, SPDR Dow Jones Industrial Average ETF Trust (NYSE: DIA) bottom right.

This recovery has been swift and built on relatively poor – low volume – structures that ought to offer minimal support; what this simply means is that higher prices need validation.

Note: Value is defined by where 70% of the day’s trade happened, the bulk of where volume is. 

Think of the absence of high volume structures, on the way up, leaving no value to base off of. If prices are followed by value, that means that they are supported. If there is an open above (below) value, a market will auction lower (higher) in search of buyers (sellers). After auctioning too far from value, the response by higher timeframe participants will introduce single-print buying and selling tails as those participants look to take advantage of higher (lower) prices to sell (buy). 

Please read this excerpt from Mind Over Markets, for additional context.

Further, the aforementioned trade is happening in the context of improving breadth amidst a seasonally bullish cycle of contributions, rebalancing, and earnings, as well as the risks associated with a taper in asset purchases and a hike in rates.

In terms of positioning, the CBOE Volatility Index (INDEX: VIX) was lower, while the VIX futures term structure settled in contango; supply at the front end of the curve, alongside the long-gamma environment, signals a potential for near-term equity market stability.

According to SpotGamma analyses, this is where the so-called vanna (i.e., inflows as a result of options sliding down their term structure) dynamic comes to dominate. Adding, we look for increased interest in options strikes that are higher in price and further out in time.

Moreover, for today, participants may make use of the following frameworks.

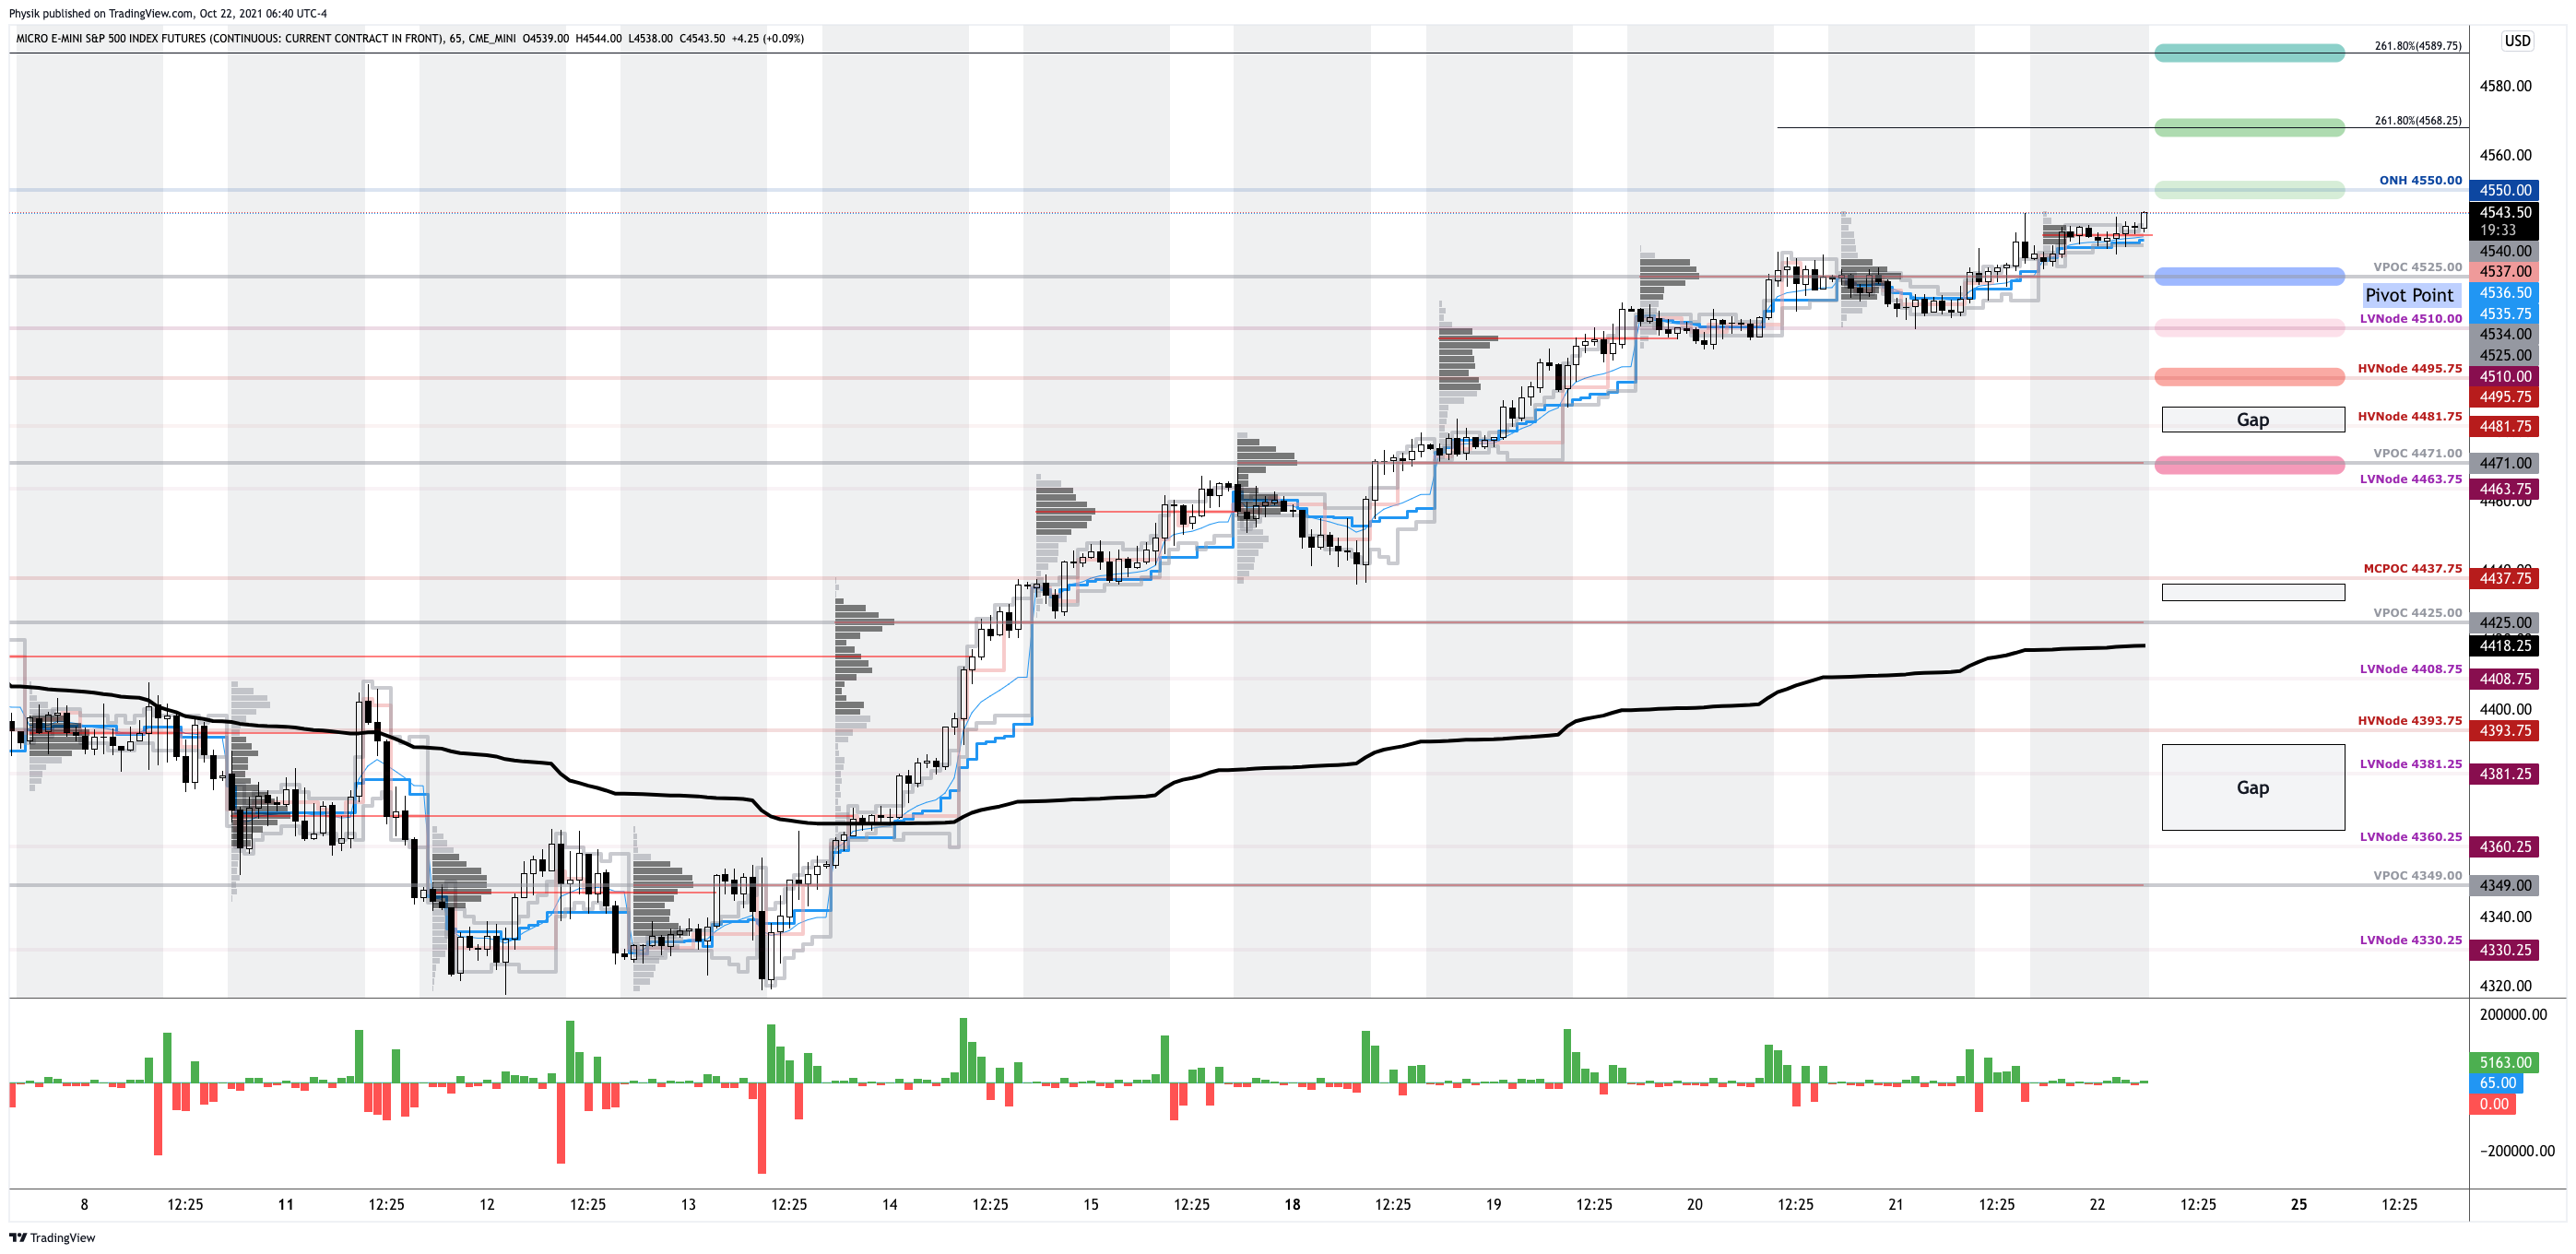
In the best case, the S&P 500 trades sideways or higher; activity above the $4,525.00 untested point of control (VPOC) puts in play the $4,550.00 overnight high (ONH). Initiative trade beyond the ONH could reach as high as the $4,568.25 and $4,589.75 Fibonacci extensions, or higher.

In the worst case, the S&P 500 trades lower; activity below the $4,525.00 VPOC puts in play the $4,510.00 low volume area (LVNode). Initiative trade beyond the LVNode could reach as low as the $4,495.75 high volume area (HVNode) and $4,471.00 VPOC, or lower.

Click here to load today’s updated real-time key levels into the web-based TradingView charting platform. Please note that all levels are derived using the 65-minute timeframe.
Graphic: 65-minute profile chart of the Micro E-mini S&P 500 Futures updated 6:30 AM ET.

Definitions

Cave-Fill Process: Widened the area deemed favorable to transact at by an increased share of participants. This is a good development.

Overnight Rally Highs (Lows): Typically, there is a low historical probability associated with overnight rally-highs (lows) ending the upside (downside) discovery process.

Volume Areas: A structurally sound market will build on areas of high volume (HVNodes). Should the market trend for long periods of time, it will lack sound structure, identified as low volume areas (LVNodes). LVNodes denote directional conviction and ought to offer support on any test. 

If participants were to auction and find acceptance into areas of prior low volume (LVNodes), then future discovery ought to be volatile and quick as participants look to HVNodes for favorable entry or exit.

POCs: POCs are valuable as they denote areas where two-sided trade was most prevalent in a prior day session. Participants will respond to future tests of value as they offer favorable entry and exit.

Excess: A proper end to price discovery; the market travels too far while advertising prices. Responsive, other-timeframe (OTF) participants aggressively enter the market, leaving tails or gaps which denote unfair prices.

Ledges: Flattened area on the profile which suggests responsive participants are in control, or initiative participants lack the confidence to continue the discovery process. The ledge will either hold and force participants to liquidate (cover) their positions, or crack and offer support (resistance).

Volume-Weighted Average Prices (VWAPs): A metric highly regarded by chief investment officers, among other participants, for quality of trade. Additionally, liquidity algorithms are benchmarked and programmed to buy and sell around VWAPs.

News And Analysis

U.K. consumer confidence falls amidst cheerless news.

Growth digitalization of finance intensifying competition.

Supply issues could haunt the holidays after sales rise.

Substantial progress toward Fed’s mandates. Tapering?

Think everything’s expensive now? Wait there is more.

Big jump in home sales – impressive considering supply.

Biden: U.S. would defend Taiwan from attack by China.

Online wager, engagement key to sports betting growth.

What People Are Saying

About

After years of self-education, strategy development, and trial-and-error, Renato Leonard Capelj began trading full-time and founded Physik Invest to detail his methods, research, and performance in the markets. 

Additionally, Capelj is a finance and technology reporter. Some of his biggest works include interviews with leaders such as John Chambers, founder and CEO, JC2 Ventures, Kevin O’Leary, businessman and Shark Tank host, Catherine Wood, CEO and CIO, ARK Invest, among others.

Disclaimer

At this time, Physik Invest does not manage outside capital and is not licensed. In no way should the materials herein be construed as advice. Derivatives carry a substantial risk of loss. All content is for informational purposes only.

Categories
Commentary

Daily Brief For October 18, 2021

Market Commentary

In sync with bonds, equity index futures were sideways to lower, overnight. Commodities were mixed. Volatility expanded.

  • More support for an EOY run-up.
  • Ahead is a light day for releases.
  • Positioned for sideways balance.

What Happened: U.S. stock index futures auctioned sideways to lower overnight alongside conflicting narratives.

Ahead is data on industrial production and capacity utilization (9:15 AM ET), as well as the National Association of Home Builders Index (10:00 AM ET).

Graphic updated 6:00 AM ET. Sentiment Neutral if expected /ES open is inside of the prior day’s range. Sentiment Risk-On if expected /ES open is above the prior day’s range. Sentiment Risk-Off if expected /ES open is below the prior day’s range. /ES levels are derived from the profile graphic at the bottom of the following section. Levels may have changed since initially quoted; click here for the latest levels. SqueezeMetrics Dark Pool Index (DIX) and Gamma (GEX) calculations are based on where the prior day’s reading falls with respect to the MAX and MIN of all occurrences available. A higher DIX is bullish. At the same time, the lower the GEX, the more (expected) volatility. SHIFT data used for S&P 500 (INDEX: SPX) options activity. Note that options flow is sorted by the call premium spent; if more positive then more was spent on call options. Breadth reflects a reading of the prior day’s NYSE Advance/Decline indicator. VIX reflects a current reading of the CBOE Volatility Index (INDEX: VIX) from 0-100.

What To Expect: As of 6:00 AM ET, Monday’s regular session (9:30 AM – 4:00 PM EST) in the S&P 500 may open inside of prior-range and -value, suggesting a limited potential for immediate directional opportunity.

Adding, during the prior day’s regular trade, on lackluster intraday breadth and market liquidity metrics, the best case outcome occurred, evidenced by an expansion of range above the $4,437.75 micro composite point of control (MCPOC), to a new overnight high (ONH) at $4,469.75.

Coupled with that dynamic is the presence of numerous gaps and p-shaped emotional, multiple-distribution profile structures (i.e., old-money shorts covering); participants will likely look to revisit, repair, and strengthen – build out areas of high volume (HVNodes) via the cave-fill process – these areas of low volume (LVNodes). 

Graphic: Unsupportive delta (i.e., non-committed buying and selling as measured by volume delta or buying and selling power as calculated by the difference in volume traded at the bid and offer) in SPDR S&P 500 ETF Trust (NYSE: SPY), one of the largest ETFs that track the S&P 500 index, via Bookmap. The readings are supportive of responsive trade or balance (i.e., rotational trade that suggests current prices offer favorable entry and exit).

Zooming out, we saw the Nasdaq 100 firming, relative to its peers, last week, a significant change in tone.

Given where the S&P 500’s price is in relation to the yellow anchored volume-weighted average price (VWAP), the average buyer, since the all-time high, holds a winning position; sideways-to-higher trade, above the upward sloping trendline, as well as the 50.00% and 61.8% retracements, likely puts in play a recovery of the all-time high.

Graphic: SPDR S&P 500 ETF (NYSE: SPY) top left, Invesco QQQ Trust Series 1 (NASDAQ: QQQ) top right, iShares Russell 2000 ETF (NYSE: IWM) bottom left, SPDR Dow Jones Industrial Average ETF Trust (NYSE: DIA) bottom right.

Further, the aforementioned trade is happening in the context of improving breadth amidst a seasonally bullish cycle of contributions, rebalancing, and earnings, as well as the risks associated with a taper in asset purchases and a hike in rates.

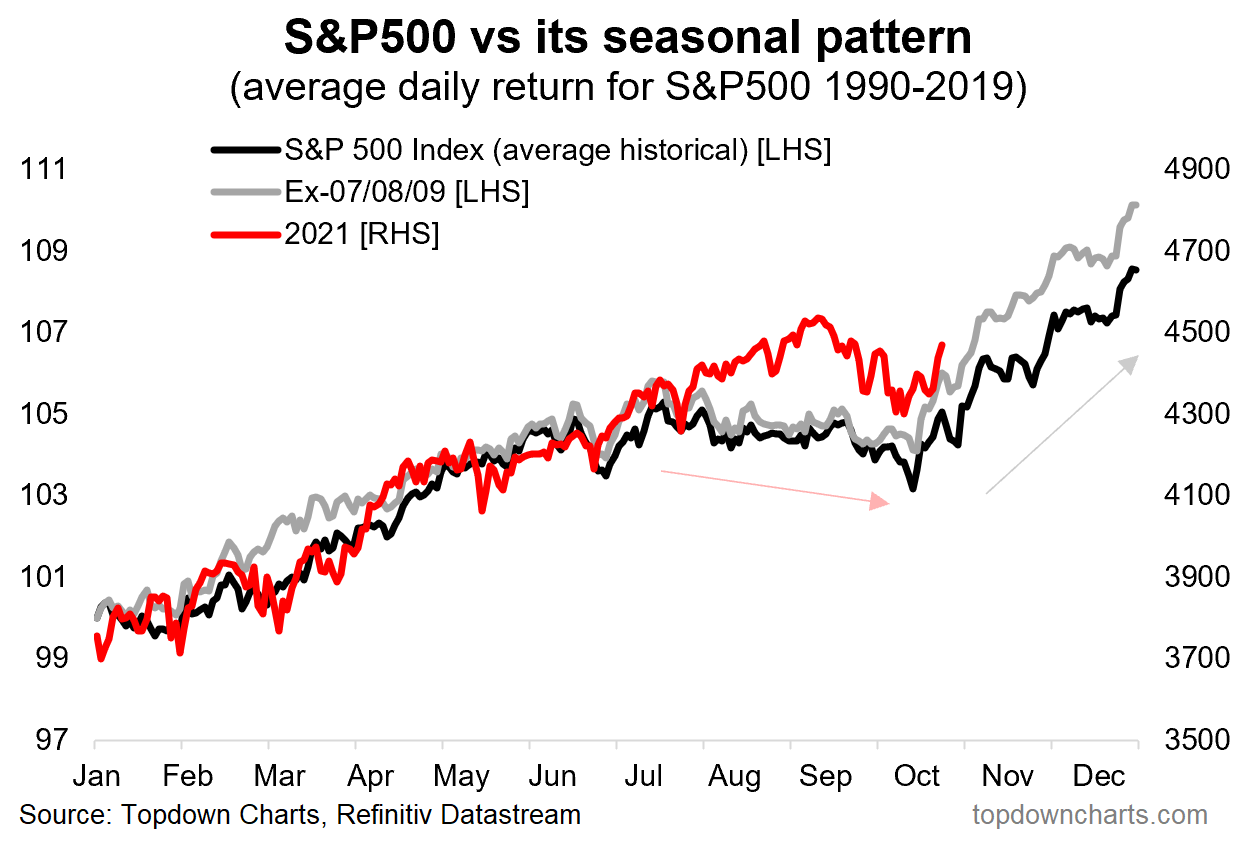
Graphic: S&P 500 seasonality via @topdowncharts

According to a TS Lombard note featured by The Market Ear, the odds are that a tightening in monetary policy should not douse the bullish narrative:

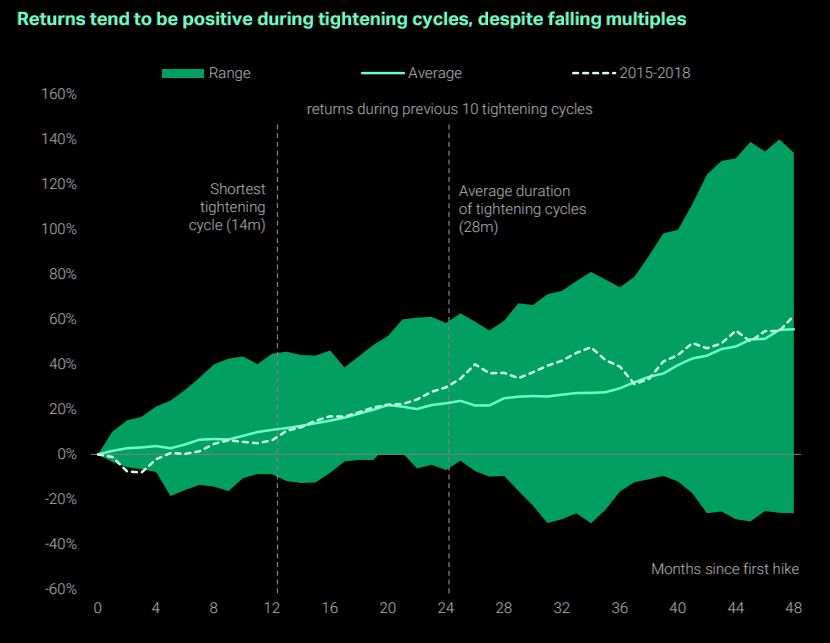
“Tightening monetary policy cycles have historically been positive for stocks. The exceptions were in the 1970s, when inflation was counter-cyclical and the Fed tightened despite slowing growth. In ‘regular’ cycles the Fed raises rates only when the economy (and corporate earnings) warrants a tighter policy stance. What is interesting is that positive returns happen despite falling P/E multiples. Higher rates tend to lead to falling valuations, but earnings growth is typically strong enough to compensate for the derating. Since multiples are still much higher than normal, favouring Growth (faster EPS growth) over Value (slower EPS growth) is a good strategy at this stage.”

Graphic: TS Lombard’s analysis of tightening cycles, via The Market Ear.

In terms of positioning, the CBOE Volatility Index (INDEX: VIX) was higher, overnight, while the VIX futures term structure was in contango; supply at the front end of the curve, alongside the long-gamma environment, signals a potential for near-term equity market stability.

To note, according to SpotGamma models, last week’s near-vertical price rise was responsively sold as dealers looked to hedge their increasing positive directional market exposure; going forward, hedging pressures may dampen volatility, potentially setting the market up for balance (i.e., sideways trade) as participants muster the conviction to initiate the next leg.

Moreover, for today, participants may make use of the following frameworks.

In the best case, the S&P 500 trades sideways or higher; activity above the $4,437.75 MCPOC puts in play the $4,463.75 low volume area (LVNode). Initiative trade beyond the LVNode could reach as high as the $4,481.75 high volume area (HVNode) and $4,510.00 LVNode, or higher.

In the worst case, the S&P 500 trades lower; activity below the $4,437.75 MCPOC puts in play the $4,425.00 untested point of control (VPOC). Initiative trade beyond the VPOC could reach as low as the $4,393.75 HVNode and $4,349.00 VPOC, or lower.

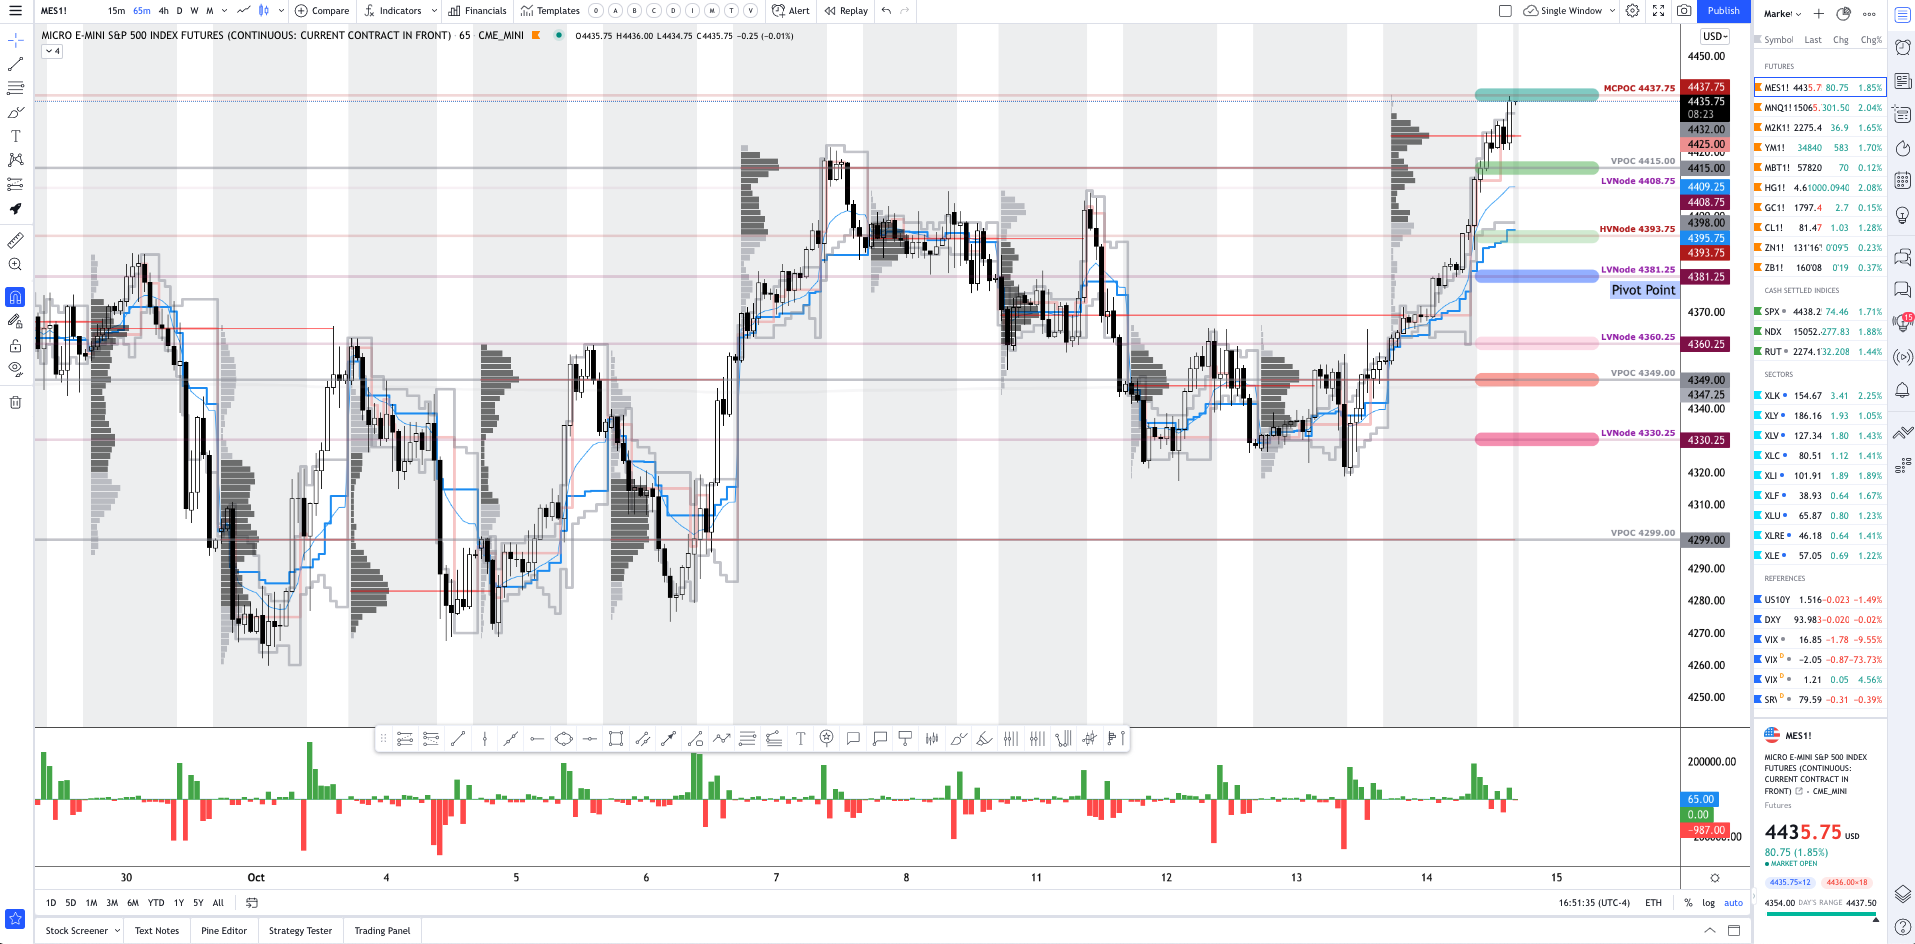
Click here to load today’s updated real-time key levels into the web-based TradingView charting platform. Please note that all levels are derived using the 65-minute timeframe.
Graphic: 65-minute profile chart of the Micro E-mini S&P 500 Futures updated 5:15 AM ET.

Definitions

Overnight Rally Highs (Lows): Typically, there is a low historical probability associated with overnight rally-highs (lows) ending the upside (downside) discovery process.

Cave-Fill Process: Widened the area deemed favorable to transact at by an increased share of participants. This is a good development.

Volume Areas: A structurally sound market will build on areas of high volume (HVNodes). Should the market trend for long periods of time, it will lack sound structure, identified as low volume areas (LVNodes). LVNodes denote directional conviction and ought to offer support on any test. 

If participants were to auction and find acceptance into areas of prior low volume (LVNodes), then future discovery ought to be volatile and quick as participants look to HVNodes for favorable entry or exit.

Gamma: Gamma is the sensitivity of an option to changes in the underlying price. Dealers that take the other side of options trades hedge their exposure to risk by buying and selling the underlying. When dealers are short-gamma, they hedge by buying into strength and selling into weakness. When dealers are long-gamma, they hedge by selling into strength and buying into weakness. The former exacerbates volatility. The latter calms volatility.

POCs: POCs are valuable as they denote areas where two-sided trade was most prevalent in a prior day session. Participants will respond to future tests of value as they offer favorable entry and exit.

MCPOCs: POCs are valuable as they denote areas where two-sided trade was most prevalent over numerous day sessions. Participants will respond to future tests of value as they offer favorable entry and exit.

Inversion Of VIX Futures Term Structure: Longer-dated VIX expiries are less expensive; is a warning of elevated near-term risks for equity market stability.

Balance (Two-Timeframe Or Bracket): Rotational trade that denotes current prices offer favorable entry and exit. Balance-areas make it easy to spot a change in the market (i.e., the transition from two-time frame trade, or balance, to one-time frame trade, or trend). 

Modus operandi is responsive trade (i.e., fade the edges), rather than initiative trade (i.e., play the break).

More On Volume-Weighted Average Prices (VWAPs): A metric highly regarded by chief investment officers, among other participants, for quality of trade. Additionally, liquidity algorithms are benchmarked and programmed to buy and sell around VWAPs.

Rates: Low rates have to potential to increase the present value of future earnings making stocks, especially those that are high growth, more attractive. To note, inflation and rates move inversely to each other. Low rates stimulate demand for loans (i.e., borrowing money is more attractive). In conjunction with the rapid recovery, lower rates may solicit hawkish commentary as policymakers look to inhibit inflation.

News And Analysis

Forbearances declining faster, plans drop by 10%.

Morgan Stanley CEO is calling for Fed rate hiking.

Analysts warn that 60/40 portfolio will be battered.

Moody’s: Fundamental siding with Fed on inflation.

S&P Global: Data on job gains has come up short.

Global energy turning to fossil fuels amid demand.

How the asset management industry got disrupted.

What People Are Saying

About

After years of self-education, strategy development, and trial-and-error, Renato Leonard Capelj began trading full-time and founded Physik Invest to detail his methods, research, and performance in the markets. 

Additionally, Capelj is a finance and technology reporter. Some of his biggest works include interviews with leaders such as John Chambers, founder and CEO, JC2 Ventures, Kevin O’Leary, businessman and Shark Tank host, Catherine Wood, CEO and CIO, ARK Invest, among others.

Disclaimer

At this time, Physik Invest does not manage outside capital and is not licensed. In no way should the materials herein be construed as advice. Derivatives carry a substantial risk of loss. All content is for informational purposes only.
Categories
Commentary

Daily Brief For October 15, 2021

Editor’s Note: Yesterday, it came to my attention that the top-most graphic quoted outdated levels. Great time for that to happen, knowing that all upside levels came into play, haha!

My apologies for failing to update that graphic, properly. In the future, if you have concerns over levels, scroll to the bottom where you see the text: “Click here to load today’s updated real-time key levels.” By clicking, you will be directed to a real-time, updated TradingView chart.

If any other questions (or you simply want to stay in touch throughout the session), email me at renato@physikinvest.com. Happy trading!

Market Commentary

Equity index futures trade sideways to higher with most commodities. Volatility ebbs.

  • Strong balance sheets, investment, labor.
  • Ahead: Retail sales, sentiment, and more.
  • Positioning for responsive trade, balance.

What Happened: U.S. stock index futures auctioned sideways to higher overnight alongside reports the economy will be supported by consumer balance sheets, business investment, and a healthy labor market.

Ahead is data on retail sales, the Import Price Index, the Empire State Index (8:30 AM ET), University of Michigan consumer sentiment and business inventories (10:00 AM ET), as well as Fed-speak by John Williams (12:20 PM ET). 

Graphic updated 6:00 AM ET. Sentiment Risk-On if expected /ES open is above the prior day’s range. /ES levels are derived from the profile graphic at the bottom of the following section. Levels may have changed since initially quoted; click here for the latest levels. SqueezeMetrics Dark Pool Index (DIX) and Gamma (GEX) calculations are based on where the prior day’s reading falls with respect to the MAX and MIN of all occurrences available. A higher DIX is bullish. At the same time, the lower the GEX, the more (expected) volatility. SHIFT data used for S&P 500 (INDEX: SPX) options activity. Note that options flow is sorted by the call premium spent; if more positive then more was spent on call options. Breadth reflects a reading of the prior day’s NYSE Advance/Decline indicator. VIX reflects a current reading of the CBOE Volatility Index (INDEX: VIX) from 0-100.

What To Expect: As of 6:30 AM ET, Friday’s regular session (9:30 AM – 4:00 PM EST) in the S&P 500 will likely open outside of prior-range and -value, suggesting a potential for immediate directional opportunity.

Gap Scenarios: Gaps ought to fill quickly. Should they not, that’s a signal of strength; do not fade. Leaving value behind on a gap-fill or failing to fill a gap (i.e., remaining outside of the prior session’s range) is a go-with indicator.

Auctioning and spending at least 1-hour of trade back in the prior range suggests a lack of conviction; in such a case, do not follow the direction of the most recent initiative activity.

Adding, during the prior day’s regular trade, on strong intraday breadth and divergent market liquidity metrics, the best case outcome occurred

After numerous sessions of a minimum separation in value (i.e., the area where 70% of the day’s volume occurred) failed to support downside price discovery, equity index futures established a rounded bottom before initiative buyers expanded range and value the opposite way.

In light of the recovery process, the S&P 500 – as evidenced by p-shaped emotional, multiple-distribution profile structures – finished, yesterday, just short of the $4,437.75 micro composite point of control (MCPOC) as momentum faded at key areas of resting liquidity.

Graphic: Screenshot of conditions, end-of-day Thursday. Equity indices, commodities, and bonds ended sideways to higher. The Nasdaq 100 led the S&P 500, Russell 2000, and Dow Jones Industrial Average, a clear change in tone. All key levels to the upside, yesterday, came into play; the $4,437.75 micro-composite point of control (MCPOC), which corresponded with resting market liquidity, marked an end to the discovery process.

In other words, the near-vertical price rise was sold responsively. This activity comes after participants saw days of responsive buying into the dip, earlier this week.

Taken together, the status quo remains responsive trade as participants look to balance (i.e., build out a base) ahead of new information. Once new information comes to light, participants will have a base to resolve and build on, directionally, into the end of this year.

Graphic: Divergent delta (i.e., non-committed buying as measured by volume delta or buying and selling power as calculated by the difference in volume traded at the bid and offer) in SPDR S&P 500 ETF Trust (NYSE: SPY), one of the largest ETFs that track the S&P 500 index, via Bookmap. The readings are supportive of responsive trade or balance (i.e., rotational trade that suggests current prices offer favorable entry and exit).

Zooming out, we see the Nasdaq 100 coming into trend, Fibonacci, and volume-weighted average price (VWAP) resistance. This dynamic, alongside poor structure and divergent market liquidity metrics, promotes the responsive trade thesis.

Graphic: SPDR S&P 500 ETF (NYSE: SPY) top left, Invesco QQQ Trust Series 1 (NASDAQ: QQQ) top right, iShares Russell 2000 ETF (NYSE: IWM) bottom left, SPDR Dow Jones Industrial Average ETF Trust (NYSE: DIA) bottom right. Spending more than a few hours of trade above trend, VWAP (yellow), and the 61.80% Fibonacci retracement suggest good odds of upside continuation.

Further, the aforementioned trade is happening in the context of a seasonally bullish cycle of rebalancing and earnings, as well as the risks associated with a taper in asset purchases and a hike in rates.

“The economy is being supported by robust consumer balance sheets, rebounding business investment and a healthy labor market,” adds Hugh Gimber, global strategist at J.P. Morgan Asset Management.

In terms of positioning, coming into October 14, according to SpotGamma, the decay of customers’ long put hedges implied those taking the other side – dealers who warehouse short put risk – would cover their underlying hedges, bolstering the violent move higher.

“[T]his was a vanna/charm type rally back into major resistance. Said another way: we see this as a short cover rally, and the market is unstable.” 

Moreover, for today, participants may make use of the following frameworks.

In the best case, the S&P 500 trades sideways or higher; activity above the $4,437.75 MCPOC puts in play the $4,463.75 low volume area (LVNode). Initiative trade beyond the LVNode could reach as high as the $4,481.75 high volume area (HVNode) and $4,510.00 LVNode, or higher.

In the worst case, the S&P 500 trades lower; activity below the $4,437.75 MCPOC puts in play the $4,425.00 untested point of control (VPOC). Initiative trade beyond the VPOC could reach as low as the $4,393.75 HVNode and $4,349.00 VPOC, or lower.

Click here to load today’s updated real-time key levels into the web-based TradingView charting platform. Please note that all levels are derived using the 65-minute timeframe.
Graphic: 65-minute profile chart of the Micro E-mini S&P 500 Futures updated 6:30 AM ET.

Definitions

Volume Areas: A structurally sound market will build on areas of high volume (HVNodes). Should the market trend for long periods of time, it will lack sound structure, identified as low volume areas (LVNodes). LVNodes denote directional conviction and ought to offer support on any test. 

If participants were to auction and find acceptance into areas of prior low volume (LVNodes), then future discovery ought to be volatile and quick as participants look to HVNodes for favorable entry or exit.

Short Covering: The profile shape suggests participants were “too” short and had poor location.

POCs: POCs are valuable as they denote areas where two-sided trade was most prevalent in a prior day session. Participants will respond to future tests of value as they offer favorable entry and exit.

MCPOCs: POCs are valuable as they denote areas where two-sided trade was most prevalent over numerous day sessions. Participants will respond to future tests of value as they offer favorable entry and exit.

Options Expiration (OPEX): Option expiries mark an end to pinning (i.e, the theory that market makers and institutions short options move stocks to the point where the greatest dollar value of contracts will expire worthless) and the reduction dealer gamma exposure.

Price Discovery (One-Timeframe Or Trend): Elongation and range expansion denotes a market seeking new prices to establish value, or acceptance (i.e., more than 30-minutes of trade at a particular price level). 

Balance (Two-Timeframe Or Bracket): Rotational trade that denotes current prices offer favorable entry and exit. Balance-areas make it easy to spot a change in the market (i.e., the transition from two-time frame trade, or balance, to one-time frame trade, or trend). 

Modus operandi is responsive trade (i.e., fade the edges), rather than initiative trade (i.e., play the break).

Value-Area Placement: Perception of value unchanged if value overlapping (i.e., inside day). Perception of value has changed if value not overlapping (i.e., outside day). Delay trade in the former case.

More On Volume-Weighted Average Prices (VWAPs): A metric highly regarded by chief investment officers, among other participants, for quality of trade. Additionally, liquidity algorithms are benchmarked and programmed to buy and sell around VWAPs.

Rates: Low rates have to potential to increase the present value of future earnings making stocks, especially those that are high growth, more attractive. To note, inflation and rates move inversely to each other. Low rates stimulate demand for loans (i.e., borrowing money is more attractive). In conjunction with the rapid recovery, lower rates may solicit hawkish commentary as policymakers look to inhibit inflation.

News And Analysis

Upgrades outpace downgrades for second consecutive quarter.

‘Prick this bubble’: Morgan Stanley’s CEO calling for rate hikes.

Bitcoin futures frenzy erupts as day traders pile into ETF plays.

Global energy squeeze triggers unusual decline at U.S. oil hub.

China broke its Evergrande silence and said risks are in check.

JPMorgan Chase suggests more M&A could be on the horizon.

What People Are Saying

About

After years of self-education, strategy development, and trial-and-error, Renato Leonard Capelj began trading full-time and founded Physik Invest to detail his methods, research, and performance in the markets. 

Additionally, Capelj is a finance and technology reporter. Some of his biggest works include interviews with leaders such as John Chambers, founder and CEO, JC2 Ventures, Kevin O’Leary, businessman and Shark Tank host, Catherine Wood, CEO and CIO, ARK Invest, among others.

Disclaimer

At this time, Physik Invest does not manage outside capital and is not licensed. In no way should the materials herein be construed as advice. Derivatives carry a substantial risk of loss. All content is for informational purposes only.
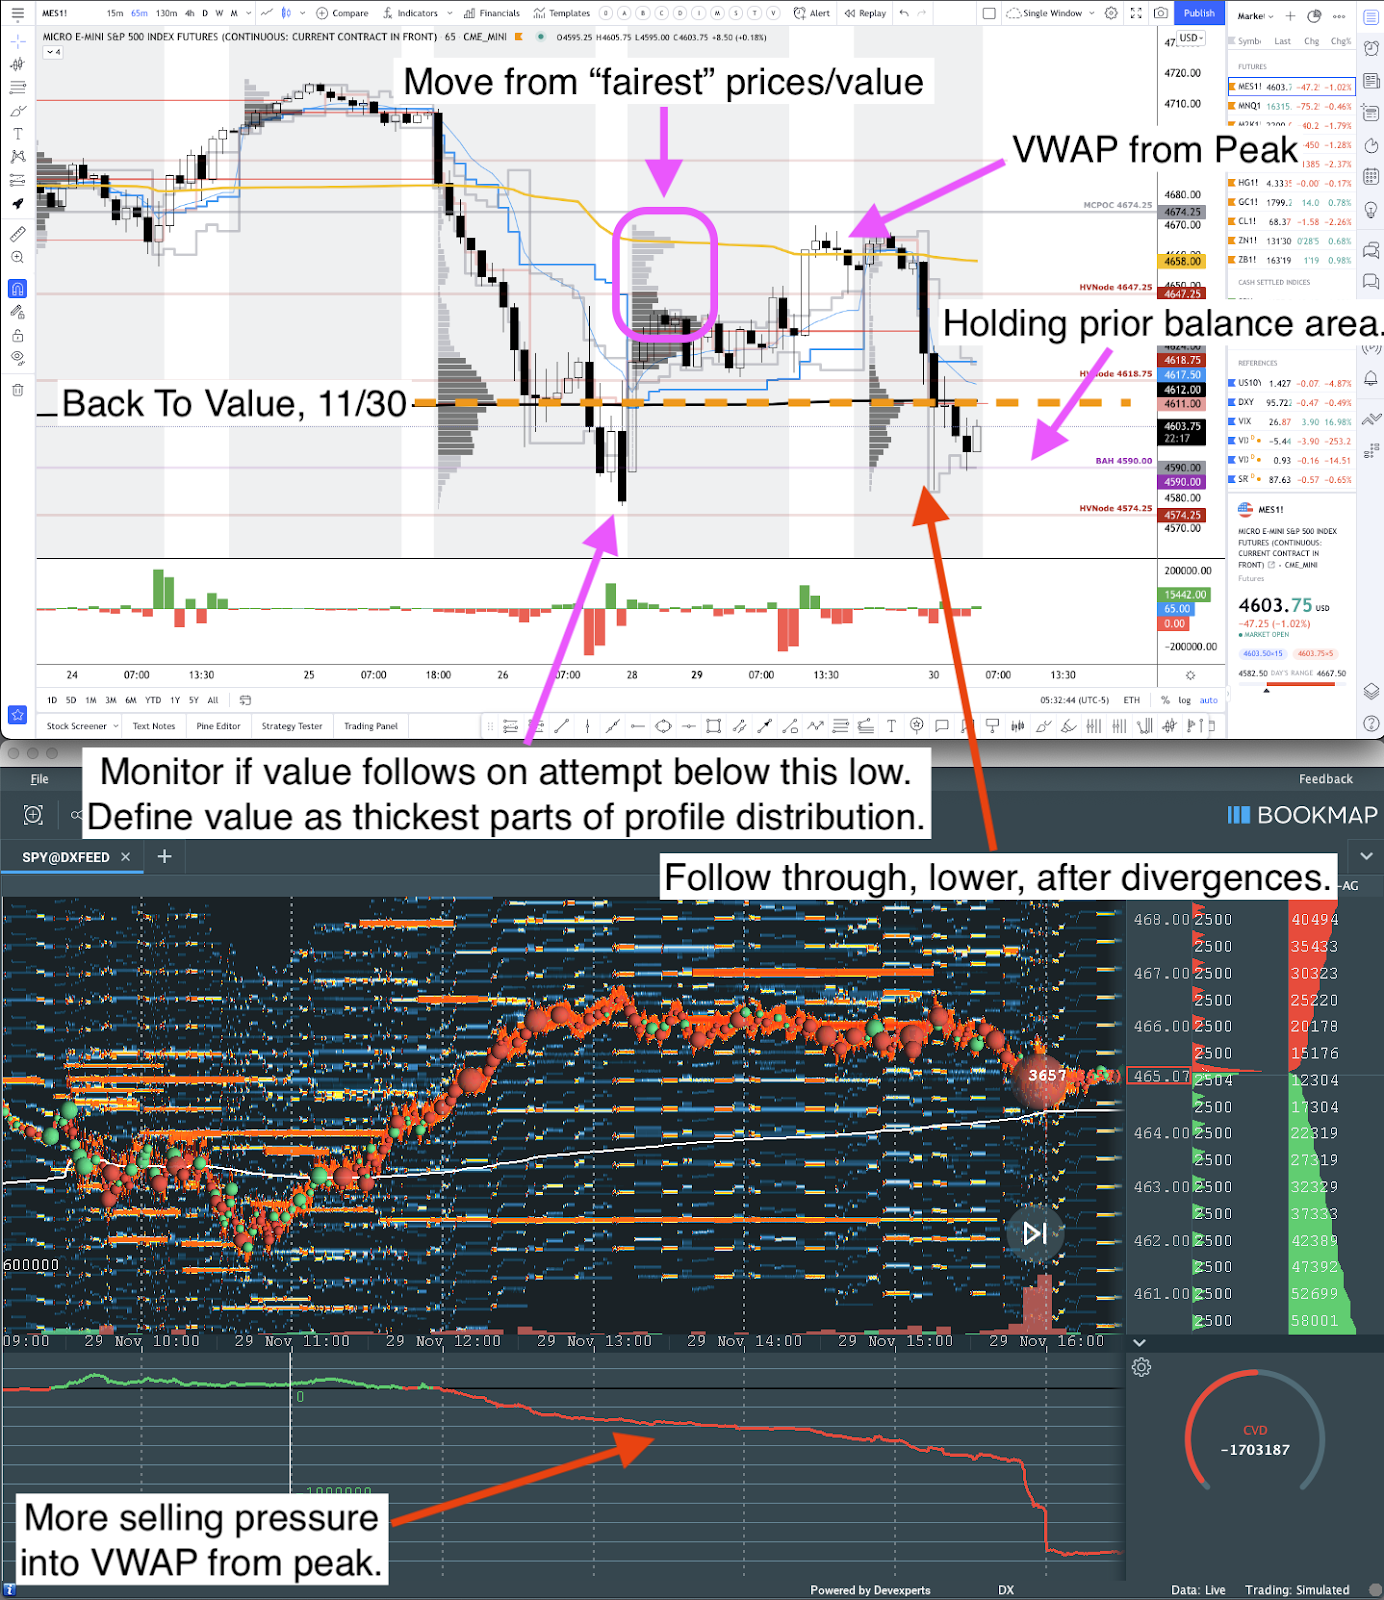
Categories
Commentary

Daily Brief For October 14, 2021

Update: This morning’s 7:55 AM ET release of the newsletter failed to include updated S&P 500 levels in the very first graphic, below. That graphic has been updated, now. Sorry!

Market Commentary

Equity index, commodity, bond futures trade sideways to higher. Volatility ebbs.

  • Consumer prices rose. Taper in play.
  • Ahead: Claims, PPI data, Fed speak.

What Happened: After news that consumer prices rose more than expected, alongside the release of Federal Open Market Committee (FOMC) minutes which revealed an intent to taper asset purchases, U.S. stock index futures auctioned higher.

Ahead is data on jobless claims and the producer price index (8:30 AM ET). After is Fed-speak by Lorie Logan (12:00 PM ET), Tom Barkin (1:00 PM ET), and Patrick Harker (6:00 PM ET).

Graphic updated 6:30 AM ET. Sentiment Risk-On if expected /ES open is above the prior day’s range. /ES levels are derived from the profile graphic at the bottom of the following section. SqueezeMetrics Dark Pool Index (DIX) and Gamma (GEX) calculations are based on where the prior day’s reading falls with respect to the MAX and MIN of all occurrences available. A higher DIX is bullish. At the same time, the lower the GEX, the more (expected) volatility. SHIFT data used for S&P 500 (INDEX: SPX) options activity. Note that options flow is sorted by the call premium spent; if more positive then more was spent on call options. Breadth reflects a reading of the prior day’s NYSE Advance/Decline indicator. VIX reflects a current reading of the CBOE Volatility Index (INDEX: VIX) from 0-100.

What To Expect: As of 6:30 AM ET, Thursday’s regular session (9:30 AM – 4:00 PM EST) in the S&P 500 will likely open outside of prior-range and -value, suggesting a potential for immediate directional opportunity.

Gap Scenarios: Gaps ought to fill quickly. Should they not, that’s a signal of strength; do not fade. Leaving value behind on a gap-fill or failing to fill a gap (i.e., remaining outside of the prior session’s range) is a go-with indicator.

Auctioning and spending at least 1-hour of trade back in the prior range suggests a lack of conviction; in such a case, do not follow the direction of the most recent initiative activity.

Adding, during the prior day’s regular trade, on positive intraday breadth and divergent market liquidity metrics, the best case outcome occurred; after numerous sessions of a minimum separation in value (i.e., the area where 70% of the day’s volume occurred) failed to support downside price discovery, participants took back Monday’s spike and weak close

The activity now puts in play the minimal excess high just short of the $4,408.75 low volume area (LVNode), as well as the $4,415.00 untested point of control (VPOC), two areas where initiative buyers were unable to counter the fading momentum from short covering.

Looking across the spectrum, the Nasdaq 100 and Russell 2000 are firming, relative to the S&P 500 and Dow Jones Industrial Average, two indices that held the relative strength mantle, prior. 

This rotation, if we will, may support sideways-to-higher trade in the coming sessions as participants clash head-on with the 50.00% and 61.80% Fibonacci retracements, levels that overlap key anchored volume-weighted average price (AVWAP) levels.

Note: VWAP is a metric highly regarded by chief investment officers, among other participants, for quality of trade. Additionally, liquidity algorithms are benchmarked and programmed to buy and sell around VWAPs. We look to buy above a flat/rising VWAP pinch. Sell below a flat/declining VWAP pinch.
Graphic: SPDR S&P 500 ETF (NYSE: SPY) top left, Invesco QQQ Trust Series 1 (NASDAQ: QQQ) top right, iShares Russell 2000 ETF (NYSE: IWM) bottom left, SPDR Dow Jones Industrial Average ETF Trust (NYSE: DIA) bottom right. Spending more than a few hours of trade above trend, VWAP (yellow), and the 61.80% Fibonacci retracement suggest good odds of upside continuation.

Further, the aforementioned trade is happening in the context of weakness into a seasonally bullish cycle of rebalancing and earnings

Some risks include the prospects of tapering off asset purchases, next month, alongside dangerous inflation pressures, as indicated by minutes from the FOMC meeting last month.

“Markets took the hint. Two-year yields are their highest since March last year, when the pandemic first hit,” said Bloomberg’s John Authers. “Meanwhile, the 10-year yield retreated from an approach toward its post-pandemic high. The two-year reflects the now-strong likelihood that the Fed will raise rates within the next two years; the 10-year reflects concerns about growth.” 

In terms of positioning, conditions may be supportive. 

Moreover, for today, participants may make use of the following frameworks.

In the best case, the S&P 500 trades sideways or higher; activity above the $4,381.25 LVNode puts in play the $4,393.75 high volume area (HVNode). Initiative trade beyond the HVNode could reach as high as the $4,415.00 VPOC and $4,437.75 micro composite point of control (MCPOC), or higher.

In the worst case, the S&P 500 trades lower; activity below the $4,381.25 LVNode puts in play the $4,360.25 LVNode. Initiative trade beyond the $4,360.25 LVNode could reach as low as the $4,349.00 VPOC and $4,330.25 LVNode, or lower.

Click here to load today’s updated real-time key levels into the web-based TradingView charting platform. Please note that all levels are derived using the 65-minute timeframe.
Graphic: 65-minute profile chart of the Micro E-mini S&P 500 Futures updated 6:30 AM ET.

Definitions

Spikes: Spike’s mark the beginning of a break from value. Spikes higher (lower) are validated by trade at or above (below) the spike base (i.e., the origin of the spike).

Volume Areas: A structurally sound market will build on areas of high volume (HVNodes). Should the market trend for long periods of time, it will lack sound structure, identified as low volume areas (LVNodes). LVNodes denote directional conviction and ought to offer support on any test. 

If participants were to auction and find acceptance into areas of prior low volume (LVNodes), then future discovery ought to be volatile and quick as participants look to HVNodes for favorable entry or exit.

POCs: POCs are valuable as they denote areas where two-sided trade was most prevalent in a prior day session. Participants will respond to future tests of value as they offer favorable entry and exit.

MCPOCs: POCs are valuable as they denote areas where two-sided trade was most prevalent over numerous day sessions. Participants will respond to future tests of value as they offer favorable entry and exit.

Excess: A proper end to price discovery; the market travels too far while advertising prices. Responsive, other-timeframe (OTF) participants aggressively enter the market, leaving tails or gaps which denote unfair prices.

Value-Area Placement: Perception of value unchanged if value overlapping (i.e., inside day). Perception of value has changed if value not overlapping (i.e., outside day). Delay trade in the former case.

News And Analysis

Consumer prices rise more than expected as energy costs surge.

Global minimum tax pact ups the chance of multinational tax hike.

Global gas crisis is spilling over into the oil markets, IEA explains.

China’s power cuts stressing economic growth and supply chains.

Federal Reserve officials seeing mid-November, December taper.

What People Are Saying

About

After years of self-education, strategy development, and trial-and-error, Renato Leonard Capelj began trading full-time and founded Physik Invest to detail his methods, research, and performance in the markets. 

Additionally, Capelj is a finance and technology reporter. Some of his biggest works include interviews with leaders such as John Chambers, founder and CEO, JC2 Ventures, Kevin O’Leary, businessman and Shark Tank host, Catherine Wood, CEO and CIO, ARK Invest, among others.

Disclaimer

At this time, Physik Invest does not manage outside capital and is not licensed. In no way should the materials herein be construed as advice. Derivatives carry a substantial risk of loss. All content is for informational purposes only.
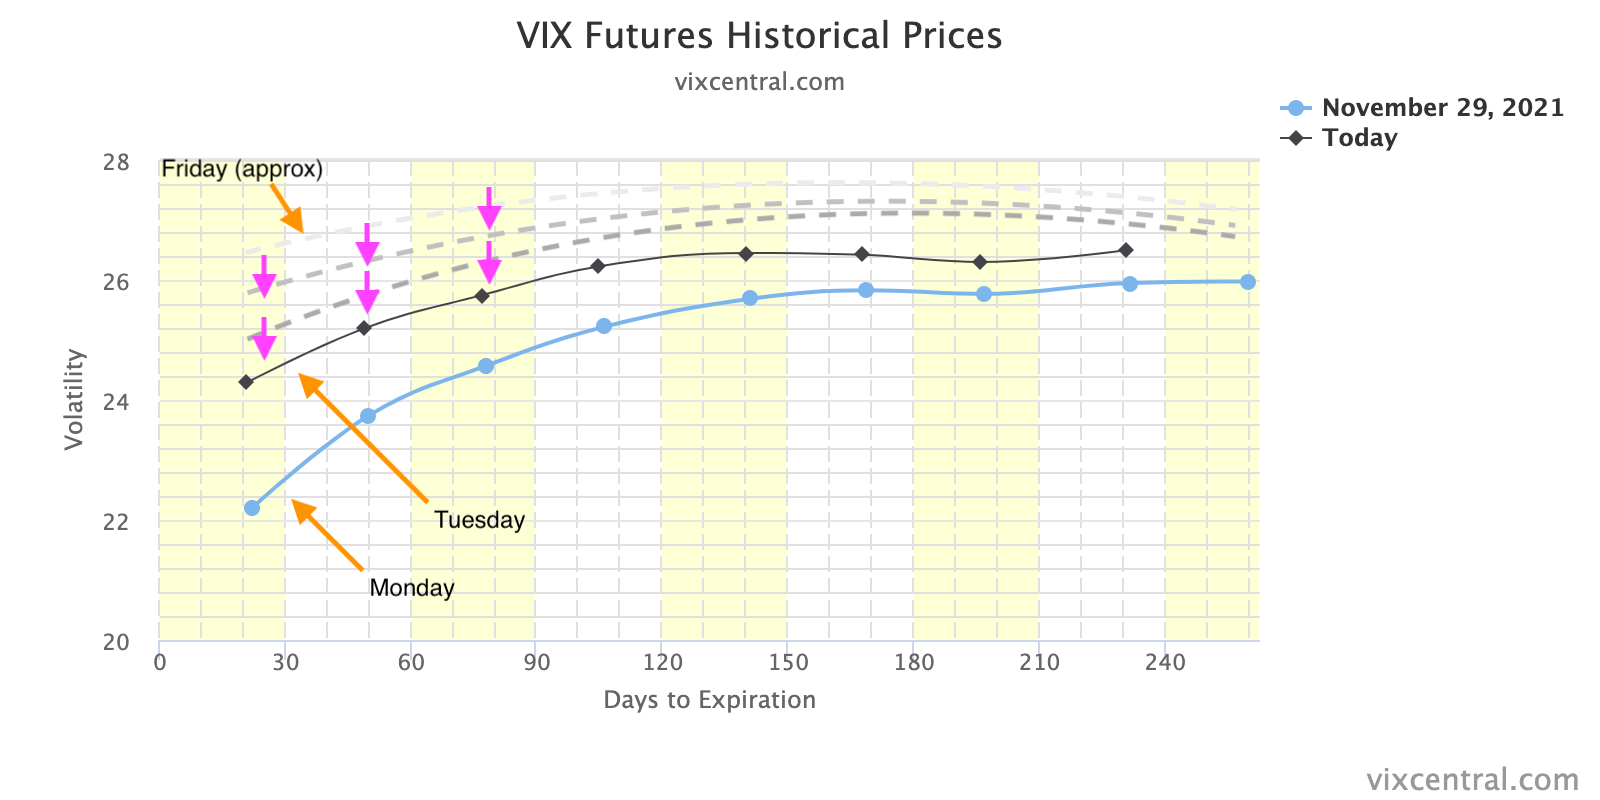
Categories
Commentary

Daily Brief For October 6, 2021

Market Commentary

Equity index futures, commodities, and bonds trade sideways to lower.

  • Fed action, debt ceiling fear mounting.
  • Ahead: ADP Employment, Fed speak.
  • Indices position for directional resolve.

What Happened: U.S. stock index futures auctioned sideways to lower overnight alongside narratives surrounding adjustments to monetary policy and debt ceiling complications.

Ahead is data on ADP employment (8:15 AM ET) and Fed speak (9:00 and 11:30 AM ET).

Graphic updated 6:30 AM ET. Sentiment Risk-Off if expected /ES open is below the prior day’s range. /ES levels are derived from the profile graphic at the bottom of the following section. SqueezeMetrics Dark Pool Index (DIX) and Gamma (GEX) calculations are based on where the prior day’s reading falls with respect to the MAX and MIN of all occurrences available. A higher DIX is bullish. At the same time, the lower the GEX, the more (expected) volatility. SHIFT data used for S&P 500 (INDEX: SPX) options activity. Note that options flow is sorted by the call premium spent; if more positive then more was spent on call options. Breadth reflects a reading of the prior day’s NYSE Advance/Decline indicator. VIX reflects a current reading of the CBOE Volatility Index (INDEX: VIX) from 0-100.

What To Expect: As of 6:30 AM ET, Wednesday’s regular session (9:30 AM – 4:00 PM EST) in the S&P 500 will likely open outside of prior-range and -value, suggesting an increased potential for immediate directional opportunity.

Adding, during the prior day’s regular trade, on positive albeit weak intraday breadth and divergent market liquidity metrics, the best case outcome occurred, evidenced by trade up to $4,358.00, the level of a key anchored volume-weighted average price (VWAP).

Graphic: Divergent delta (i.e., non-committed buying as measured by volume delta or buying and selling power as calculated by the difference in volume traded at the bid and offer) in SPDR S&P 500 ETF Trust (NYSE: SPY), one of the largest ETFs that track the S&P 500 index, via Bookmap. The readings are supportive of responsive trade or balance (i.e., rotational trade that suggests current prices offer favorable entry and exit).

Thereafter, equity index futures, led by the Nasdaq 100 and Russell 2000, liquidated overnight, leaving behind Tuesday’s prominent point of control (POC) before finding responsive buyers at a key high volume area (HVNode) for this most recent developing balance area (between the $4,363.25 and $4,278.00 HVNodes).

This trade is significant because it marks acceptance, or a willingness to transact at lower prices. We’re carrying forward, though, the presence of poor structures (e.g., Friday’s advance away from session value on a taper of volume, and a minimal excess low, suggests a lack of commitment to take prices lower).

Given the overnight gap inside of balance, the following scenarios apply.

Balance-Break Scenarios: A change in the market (i.e., the transition from two-time frame trade, or balance, to one-time frame trade, or trend) may occur.

Monitor for acceptance (i.e., more than 1-hour of trade) outside of the balance area. Rejection (i.e., return inside of balance) portends a move to the opposite end of the balance.

Further, the aforementioned trade is happening in the context of a traditionally volatile October, as well as narratives surrounding adjustments to monetary policy and debt ceiling complications.

Despite these themes supporting fear and uncertainty, Marko Kolanovic, JPMorgan’s chief global markets strategist, said the following in a note Monday: “We do not believe the recent bout of de-risking will lead to sustained falls, and maintain the stance to keep buying into any weakness.”

On the other hand, in support of continued volatility, Nordea believes there are “4 macro reasons why 2022 should be noisier than 2021: liquidity, growth slowdown, cost/margin problems and the risk of the Fed put looking very different if inflation indicators stay elevated.”

Graphic: According to Nordea, “The Fed is also quickly moving closer to a tapering decision, which now sounds almost as a done deal for November. The previous three episodes of QE tapering have all gone hand in hand with rising volatility. Our scenario with Fed rate hikes in the second half of 2022 would add to those volatility risks.”
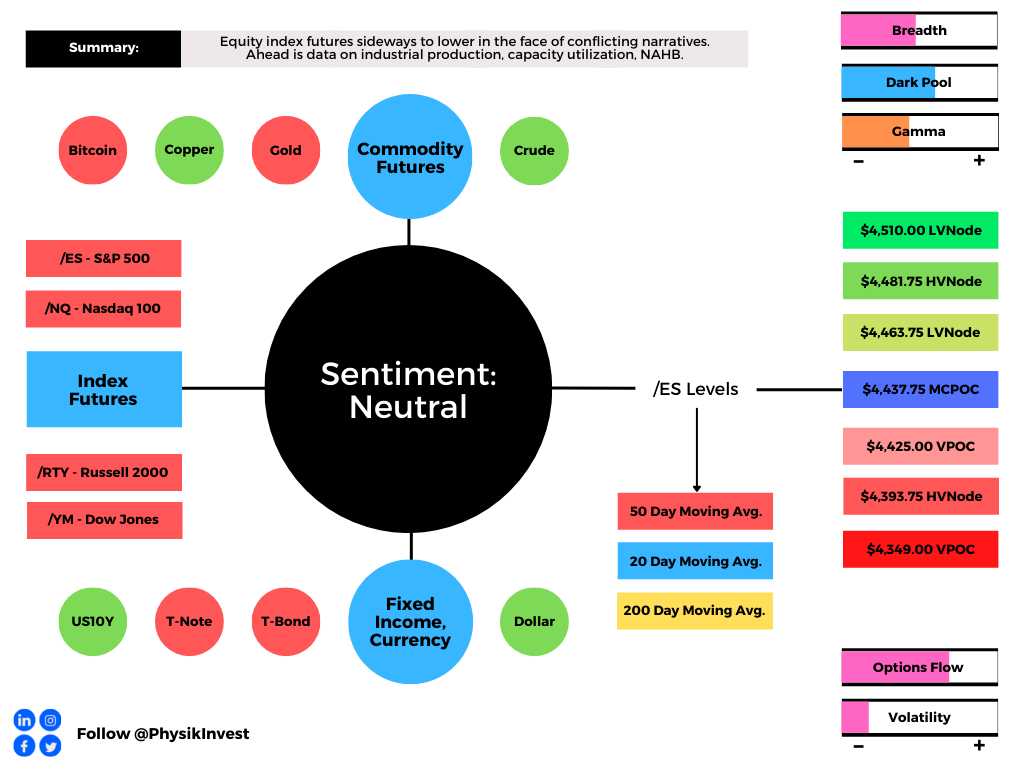
Prior to yesterday’s advance, this newsletter noted that indices were best positioned for a vicious rebound as near-term downside discovery metrics likely reached a limit

Graphic: ​​On October 5, 2021, according to SqueezeMetrics, “Net Put Delta (NPD) and the customer Vanna-Gamma Ratio (VGR) [] settled in a *bullish* place. Risk to the upside.”
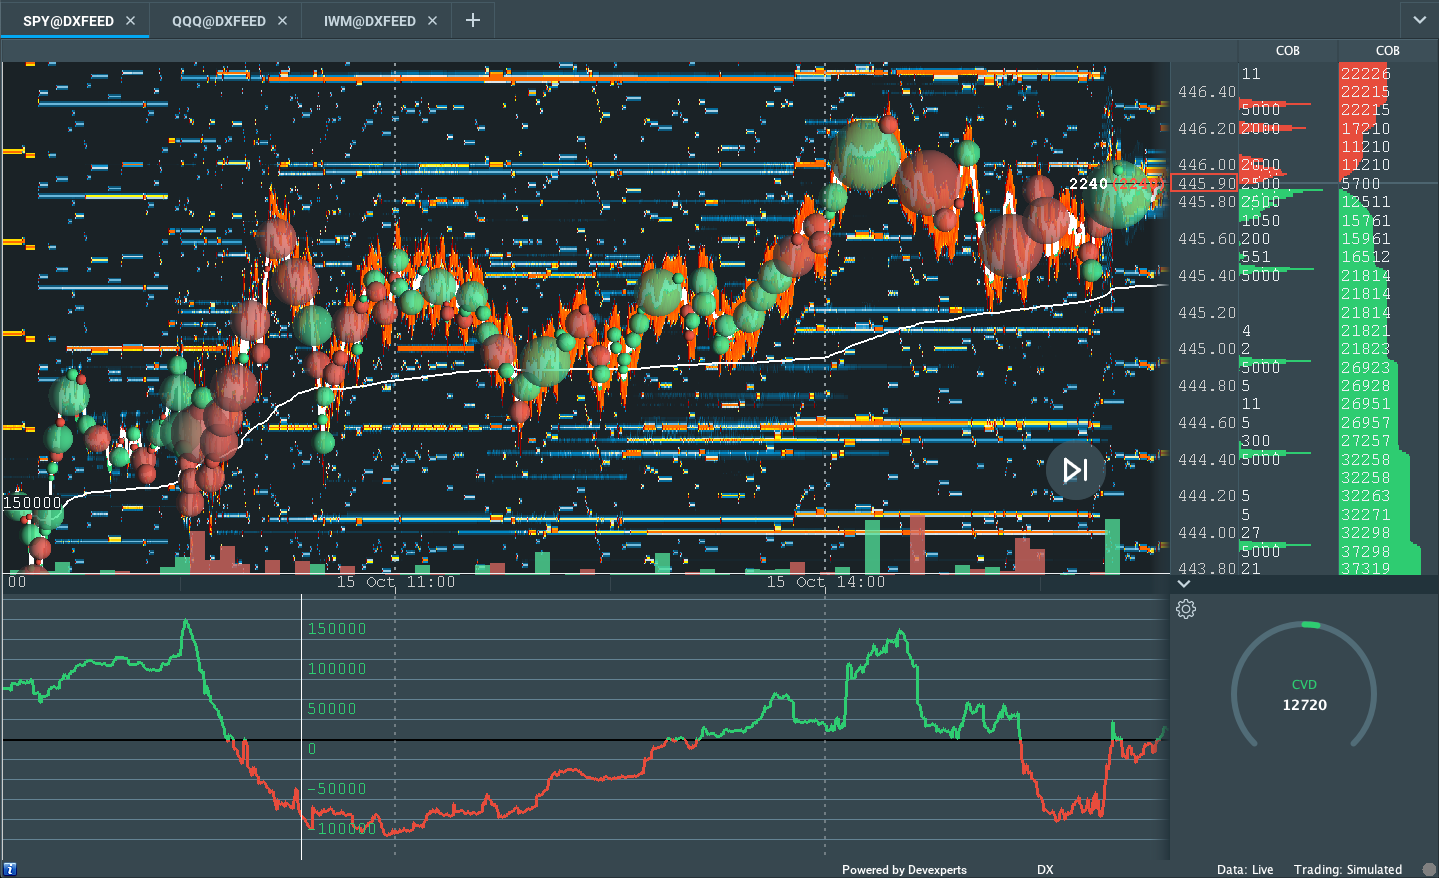
The overnight liquidation challenges that thesis, putting indexes in a peculiar position; it’s likely that participants are seeking more information to base a directional move.

Moreover, for today, participants may make use of the following frameworks.

In the best case, the S&P 500 trades sideways or higher; activity above the $4,278.00 HVNode puts in play the $4,332.25 low volume area (LVNode). Initiative trade beyond the LVNode could reach as high as $4,349.00 untested POC (VPOC) and $4,410.25 LVNode, or higher.

In the worst case, the S&P 500 trades lower; activity below the $4,278.00 HVNode puts in play the $4,260.00 overnight low (ONL). Initiative trade beyond the ONL could reach as low as $4,233.00 VPOC and $4,202.25 LVNode, or lower.

Graphic: 65-minute profile chart of the Micro E-mini S&P 500 Futures updated 6:30 AM ET.

Definitions

Overnight Rally Highs (Lows): Typically, there is a low historical probability associated with overnight rally-highs (lows) ending the upside (downside) discovery process.

Volume Areas: A structurally sound market will build on areas of high volume (HVNodes). Should the market trend for long periods of time, it will lack sound structure, identified as low volume areas (LVNodes). LVNodes denote directional conviction and ought to offer support on any test. 

If participants were to auction and find acceptance into areas of prior low volume (LVNodes), then future discovery ought to be volatile and quick as participants look to HVNodes for favorable entry or exit.

POCs: POCs are valuable as they denote areas where two-sided trade was most prevalent in a prior day session. Participants will respond to future tests of value as they offer favorable entry and exit.

Balance (Two-Timeframe Or Bracket): Rotational trade that denotes current prices offer favorable entry and exit. Balance-areas make it easy to spot a change in the market (i.e., the transition from two-time frame trade, or balance, to one-time frame trade, or trend). 

Modus operandi is responsive trade (i.e., fade the edges), rather than initiative trade (i.e., play the break).

Excess: A proper end to price discovery; the market travels too far while advertising prices. Responsive, other-timeframe (OTF) participants aggressively enter the market, leaving tails or gaps which denote unfair prices.

More On Volume-Weighted Average Prices (VWAPs): A metric highly regarded by chief investment officers, among other participants, for quality of trade. Additionally, liquidity algorithms are benchmarked and programmed to buy and sell around VWAPs.

Rates: Low rates have to potential to increase the present value of future earnings making stocks, especially those that are high growth, more attractive. To note, inflation and rates move inversely to each other. Low rates stimulate demand for loans (i.e., borrowing money is more attractive). In conjunction with the rapid recovery, lower rates solicit hawkish commentary as policymakers look to inhibit inflation.

News And Analysis

‘Volmageddon’ history as SEC greenlights leveraged VIX ETFs.

World trade rebounds at a faster clip than was initially expected.

Treasuries’ pain deepened amid the grimmest year since 2013.

European gas surges 60% in two days as EU sounds the alarm.

Unrelenting political brinkmanship edging U.S. closer to default.

What People Are Saying

About

After years of self-education, strategy development, and trial-and-error, Renato Leonard Capelj began trading full-time and founded Physik Invest to detail his methods, research, and performance in the markets. 

Additionally, Capelj is a finance and technology reporter. Some of his biggest works include interviews with leaders such as John Chambers, founder and CEO, JC2 Ventures, Kevin O’Leary, businessman and Shark Tank host, Catherine Wood, CEO and CIO, ARK Invest, among others.

Disclaimer

At this time, Physik Invest does not manage outside capital and is not licensed. In no way should the materials herein be construed as advice. Derivatives carry a substantial risk of loss. All content is for informational purposes only.