Categories
Commentary

Daily Brief For October 19, 2021

Market Commentary

Out sync with bonds, equity index futures and commodities traded higher. Volatility compressed.

  • Monetary uncertainty. Earnings pick up.
  • Options positioning may support prices.
  • Ahead: Building permits, housing starts.

What Happened: U.S. stock index futures auctioned sideways to higher overnight as participants sought to price in robust earnings against the backdrop of monetary uncertainty and increased pricing pressures. 

“The world is watching interest rates more closely than it has for some time — and rightly so, the moves have been emphatic, especially in the short-term maturities,” Chris Weston, head of research at Pepperstone Financial Pty, said. He added it’s “impressive how resilient and calm markets are in the face of the rates repricing.”

Ahead is data on building permits and housing starts (8:30 AM ET).

Graphic updated 6:30 AM ET. Sentiment Risk-On if expected /ES open is above the prior day’s range. /ES levels are derived from the profile graphic at the bottom of the following section. Levels may have changed since initially quoted; click here for the latest levels. SqueezeMetrics Dark Pool Index (DIX) and Gamma (GEX) calculations are based on where the prior day’s reading falls with respect to the MAX and MIN of all occurrences available. A higher DIX is bullish. At the same time, the lower the GEX, the more (expected) volatility. SHIFT data used for S&P 500 (INDEX: SPX) options activity. Note that options flow is sorted by the call premium spent; if more positive then more was spent on call options. Breadth reflects a reading of the prior day’s NYSE Advance/Decline indicator. VIX reflects a current reading of the CBOE Volatility Index (INDEX: VIX) from 0-100.

What To Expect: As of 6:30 AM ET, Tuesday’s regular session (9:30 AM – 4:00 PM EST) in the S&P 500 will likely open outside of prior-range and -value, suggesting a potential for immediate directional opportunity.

Gap Scenarios: Gaps ought to fill quickly. Should they not, that’s a signal of strength; do not fade. Leaving value behind on a gap-fill or failing to fill a gap (i.e., remaining outside of the prior session’s range) is a go-with indicator.

Auctioning and spending at least 1-hour of trade back in the prior range suggests a lack of conviction; in such a case, do not follow the direction of the most recent initiative activity.

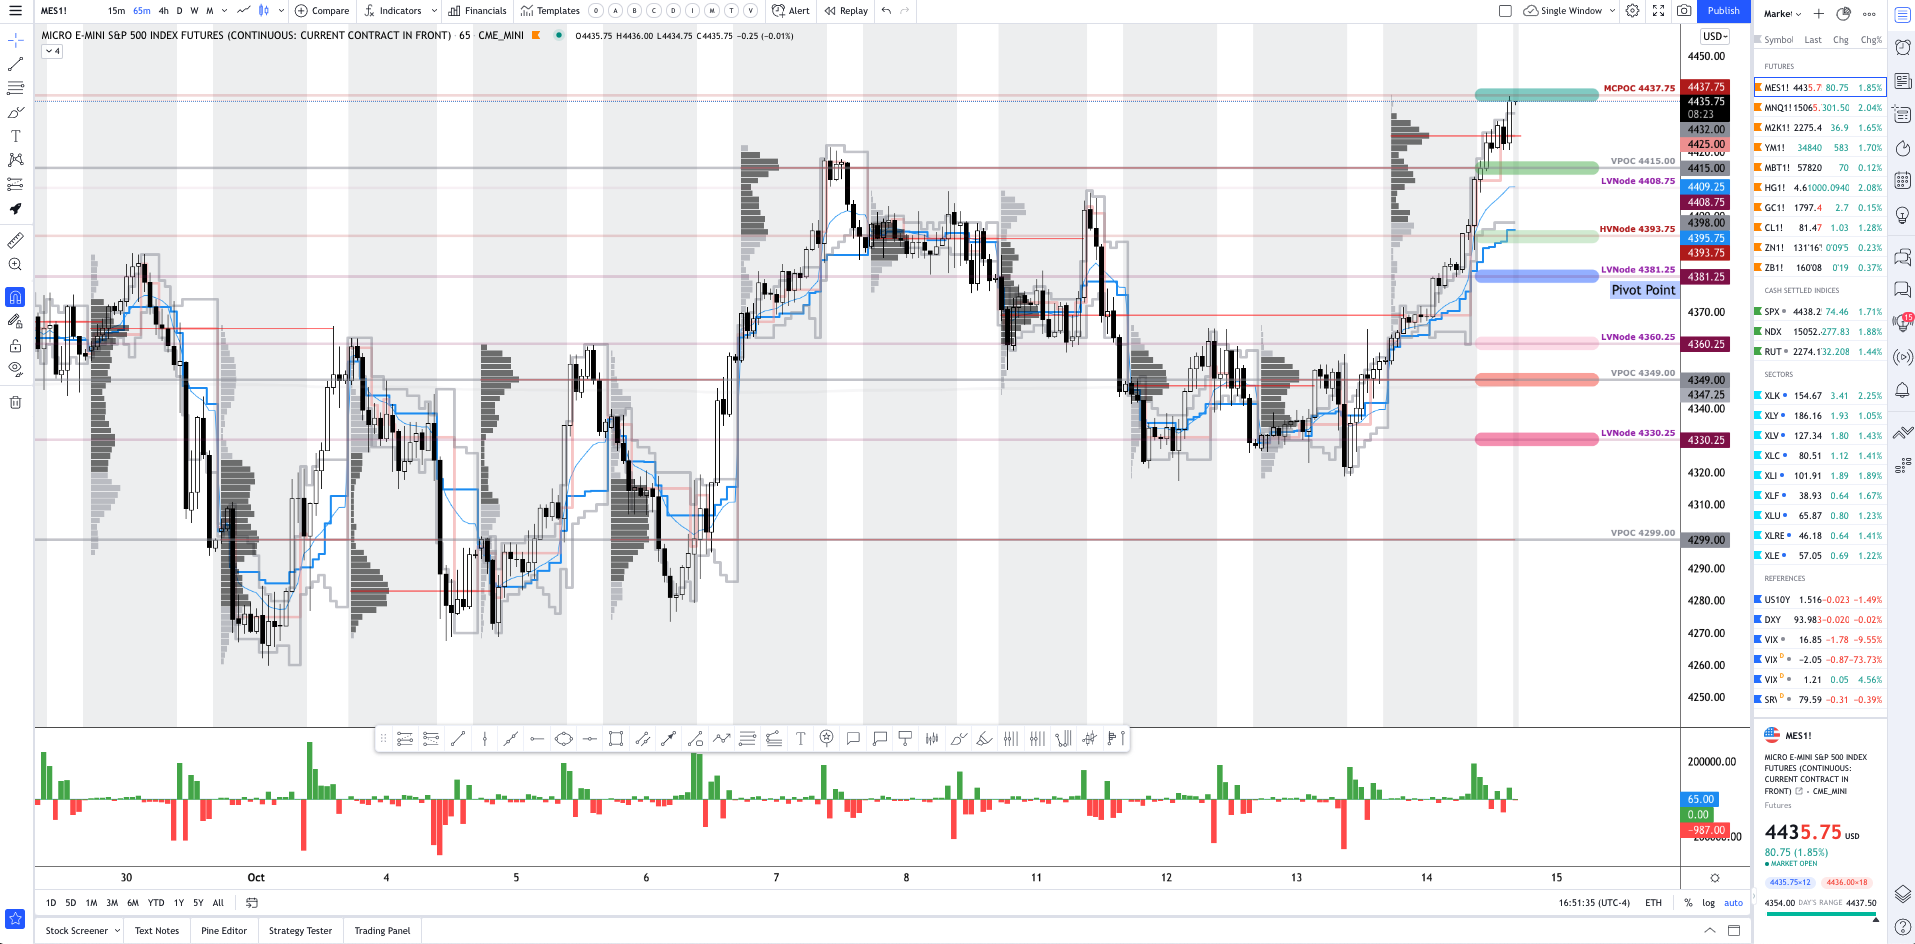
Adding, during the prior day’s regular trade, on non participatory intraday breadth and supportive market liquidity metrics, the best case outcome occurred, evidenced by a response at the $4,437.75 micro composite point of control (MCPOC), which carried into initiative buying, past the $4,469.75 overnight high (ONH).

Coupled with that dynamic is the sustained presence of numerous gaps and p-shaped emotional, multiple-distribution profile structures (i.e., old-money shorts covering); as a result, participants will likely look to revisit, repair, and strengthen – build out areas of high volume (HVNodes) via the cave-fill process – these areas of low volume (LVNodes).

Graphic: Mostly supportive delta (i.e., committed buying as measured by volume delta or buying and selling power as calculated by the difference in volume traded at the bid and offer) in SPDR S&P 500 ETF Trust (NYSE: SPY), one of the largest ETFs that track the S&P 500 index, via Bookmap. The readings support this recent leg of initiative trade.

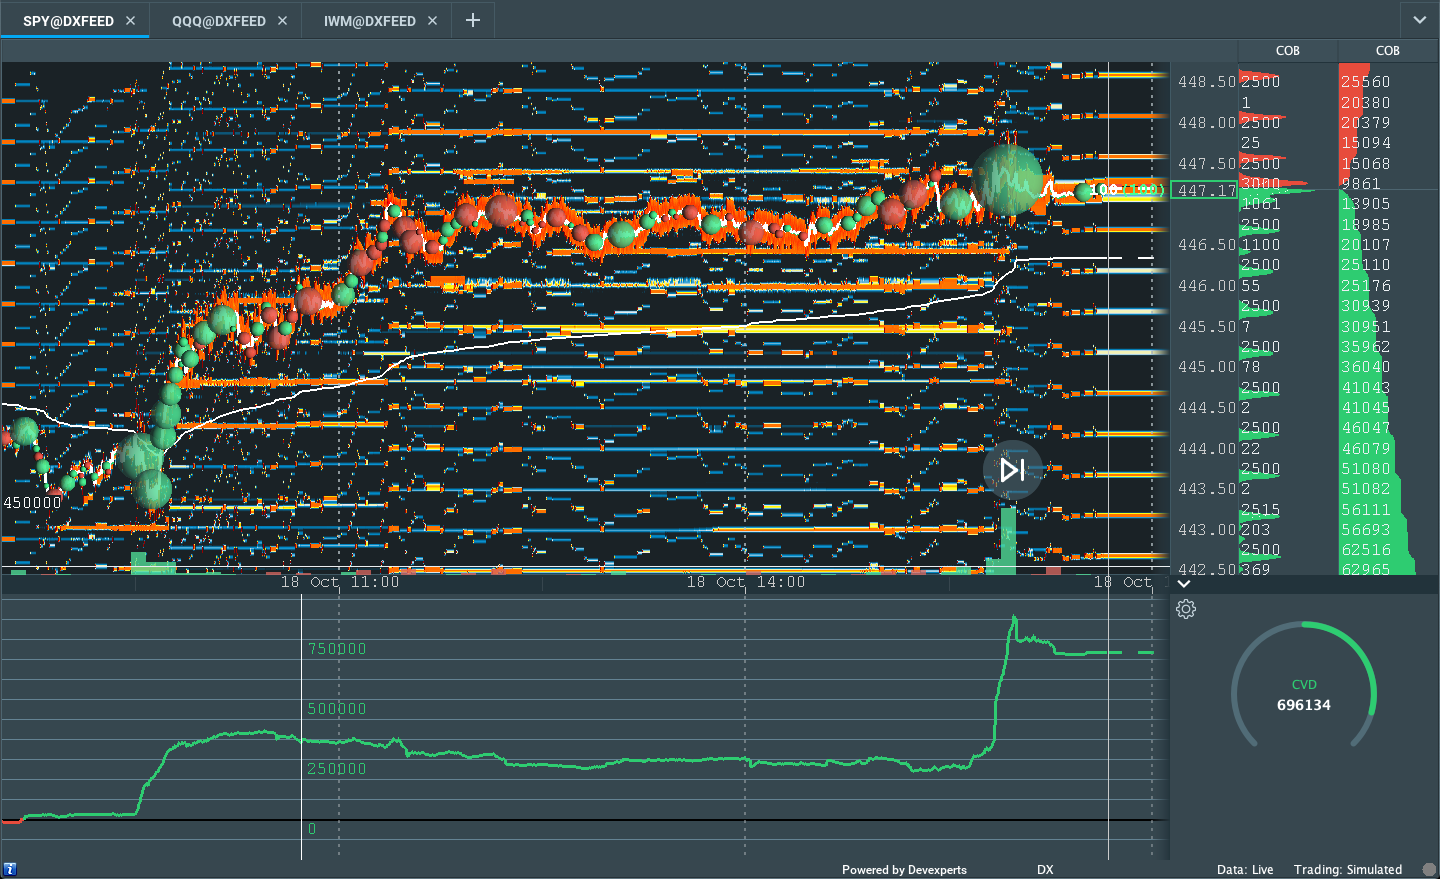
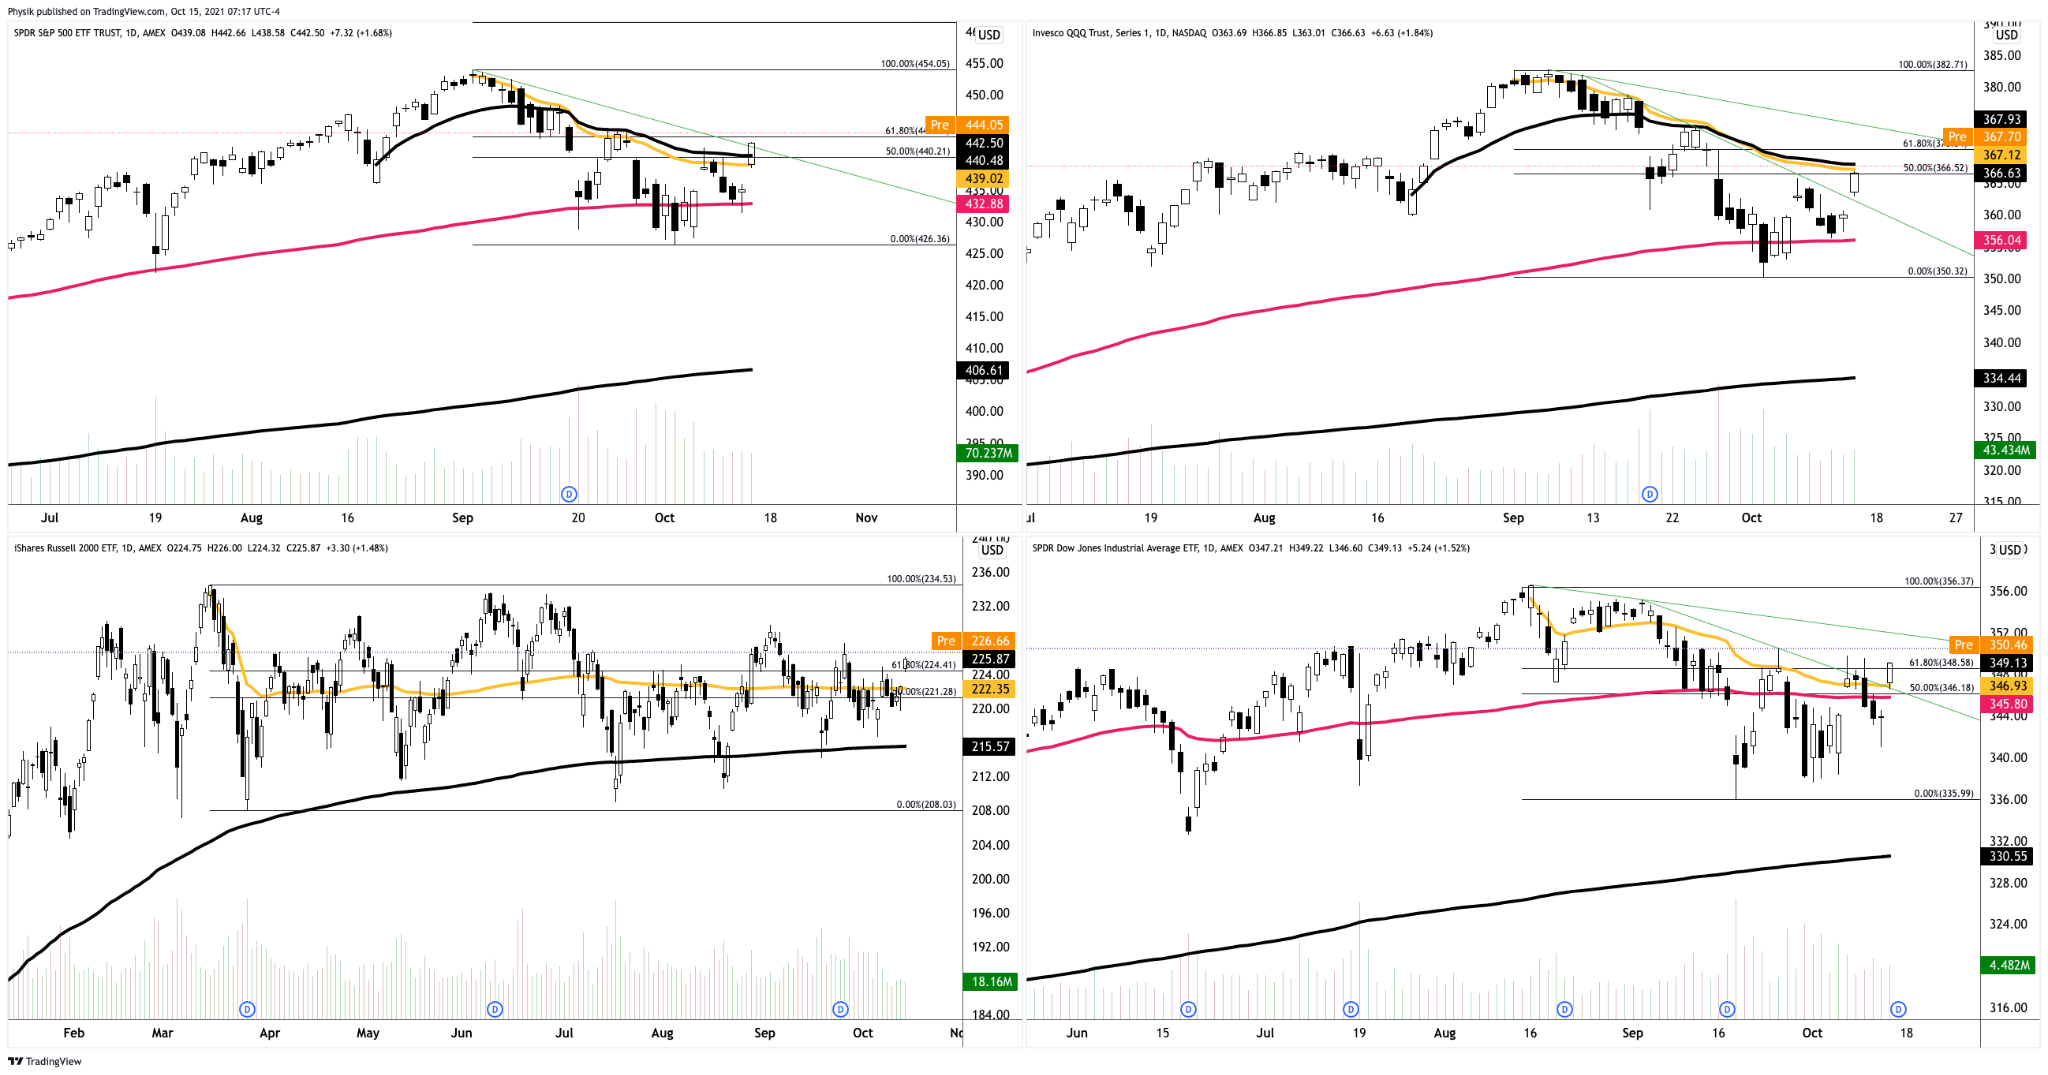
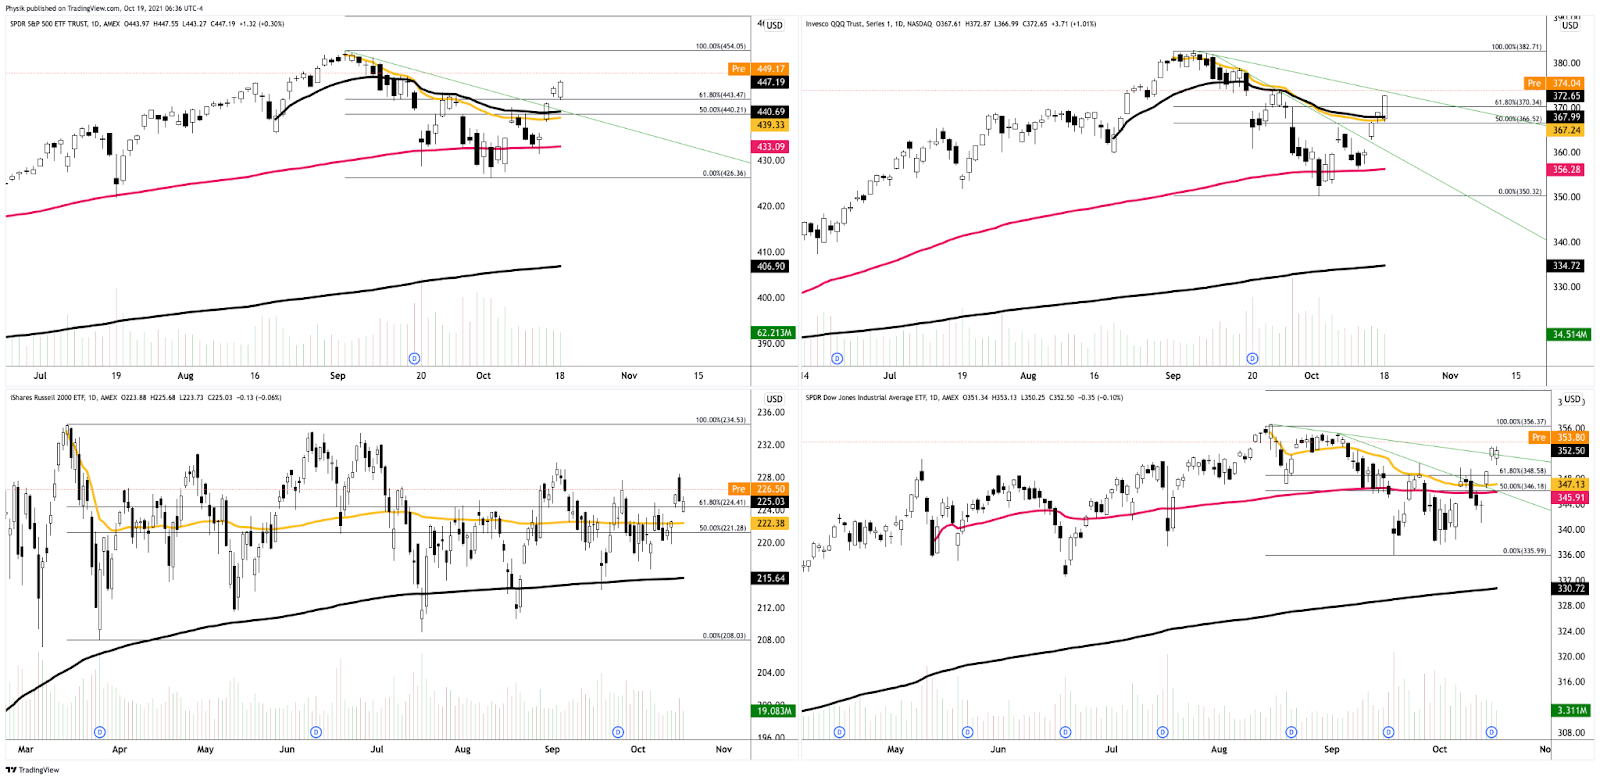
Zooming out, we see the Nasdaq 100 trading relatively strong.

Given where the S&P 500’s price is in relation to the yellow anchored volume-weighted average price (VWAP), below, the average buyer, since the all-time high, holds a winning position; sideways-to-higher trade, above the upward sloping trendline, as well as the 50.00% and 61.8% retracements, likely puts in play a recovery of the all-time high.

Graphic: SPDR S&P 500 ETF (NYSE: SPY) top left, Invesco QQQ Trust Series 1 (NASDAQ: QQQ) top right, iShares Russell 2000 ETF (NYSE: IWM) bottom left, SPDR Dow Jones Industrial Average ETF Trust (NYSE: DIA) bottom right.

Further, the aforementioned trade is happening in the context of improving breadth amidst a seasonally bullish cycle of contributions, rebalancing, and earnings, as well as the risks associated with a taper in asset purchases and a hike in rates.

In terms of positioning, the CBOE Volatility Index (INDEX: VIX) was lower, while the VIX futures term structure remained in contango; supply at the front end of the curve, alongside the long-gamma environment, signals a potential for near-term equity market stability.

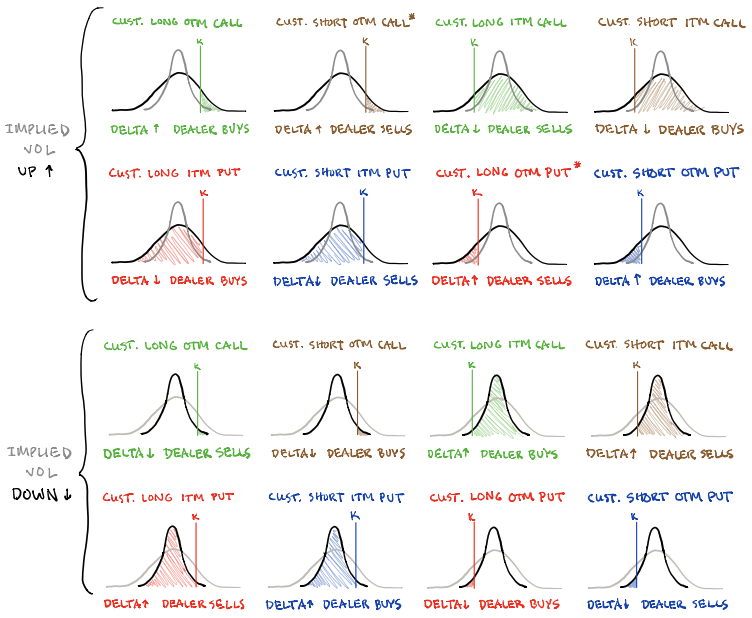
According to SpotGamma analyses, participants were likely selling puts into yesterday’s price rise; this dynamic may support sideways to higher trade.

In a barebones overview of some of the dynamics at play, here, if implied volatility were to rise, the counterparty to the aforementioned trade would purchase stock (long delta) to hedge their rising long put (short delta) exposure. If implied volatility were to decline, the counterparty would likely sell stock (short delta) as their long put (short delta) exposure declines.

Pictured: SqueezeMetrics highlights implications of volatility, direction, and moneyness.

Moreover, for today, participants may make use of the following frameworks.

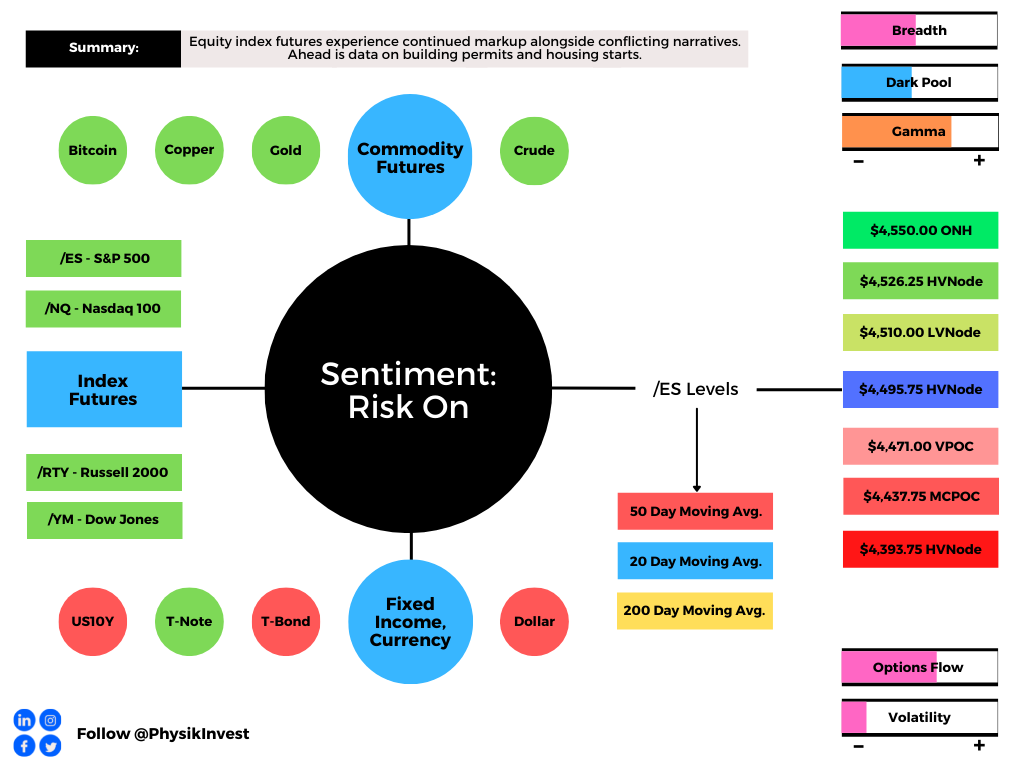
In the best case, the S&P 500 trades sideways or higher; activity above the $4,495.75 high volume area (HVNode) puts in play the $4,510.00 low volume area (LVNode). Initiative trade beyond the LVNode could reach as high as the $4,526.25 HVNode and $4,550.00 overnight high (ONH), or higher.

In the worst case, the S&P 500 trades lower; activity below the $4,495.75 HVNode puts in play the $4,471.00 untested point of control (VPOC). Initiative trade beyond the VPOC could reach as low as the $4,437.75 micro composite point of control (MCPOC) and $4,393.75 HVNode, or lower.

Click here to load today’s updated real-time key levels into the web-based TradingView charting platform. Please note that all levels are derived using the 65-minute timeframe.
Graphic: 65-minute profile chart of the Micro E-mini S&P 500 Futures updated 6:20 AM ET.

Definitions

Cave-Fill Process: Widened the area deemed favorable to transact at by an increased share of participants. This is a good development.

Overnight Rally Highs (Lows): Typically, there is a low historical probability associated with overnight rally-highs (lows) ending the upside (downside) discovery process.

Volume Areas: A structurally sound market will build on areas of high volume (HVNodes). Should the market trend for long periods of time, it will lack sound structure, identified as low volume areas (LVNodes). LVNodes denote directional conviction and ought to offer support on any test. 

If participants were to auction and find acceptance into areas of prior low volume (LVNodes), then future discovery ought to be volatile and quick as participants look to HVNodes for favorable entry or exit.

Short Covering: The profile shape suggests participants were “too” short and had poor location.

Gamma: Gamma is the sensitivity of an option to changes in the underlying price. Dealers that take the other side of options trades hedge their exposure to risk by buying and selling the underlying. When dealers are short-gamma, they hedge by buying into strength and selling into weakness. When dealers are long-gamma, they hedge by selling into strength and buying into weakness. The former exacerbates volatility. The latter calms volatility.

POCs: POCs are valuable as they denote areas where two-sided trade was most prevalent in a prior day session. Participants will respond to future tests of value as they offer favorable entry and exit.

MCPOCs: POCs are valuable as they denote areas where two-sided trade was most prevalent over numerous day sessions. Participants will respond to future tests of value as they offer favorable entry and exit.

Initiative Buying (Selling): Buying (selling) within or above (below) the previous day’s value area.

Responsive Buying (Selling): Buying (selling) in response to prices below (above) an area of recent price acceptance.

Volume-Weighted Average Prices (VWAPs): A metric highly regarded by chief investment officers, among other participants, for quality of trade. Additionally, liquidity algorithms are benchmarked and programmed to buy and sell around VWAPs.

News And Analysis

Nordea: Is permanent inflation now an alarming consensus?

Evergrande unit has remit funds to pay yuan bond coupon.

China’s central bank should cut RRR, one adviser suggests.

World facing fiscal problems much worse than from COVID.

Investing prosperously in light of China’s common prosperity.

Bitcoin pushes toward record before debut of ETF products.

What People Are Saying

About

After years of self-education, strategy development, and trial-and-error, Renato Leonard Capelj began trading full-time and founded Physik Invest to detail his methods, research, and performance in the markets. 

Additionally, Capelj is a finance and technology reporter. Some of his biggest works include interviews with leaders such as John Chambers, founder and CEO, JC2 Ventures, Kevin O’Leary, businessman and Shark Tank host, Catherine Wood, CEO and CIO, ARK Invest, among others.

Disclaimer

At this time, Physik Invest does not manage outside capital and is not licensed. In no way should the materials herein be construed as advice. Derivatives carry a substantial risk of loss. All content is for informational purposes only.

Categories
Commentary

Daily Brief For October 15, 2021

Editor’s Note: Yesterday, it came to my attention that the top-most graphic quoted outdated levels. Great time for that to happen, knowing that all upside levels came into play, haha!

My apologies for failing to update that graphic, properly. In the future, if you have concerns over levels, scroll to the bottom where you see the text: “Click here to load today’s updated real-time key levels.” By clicking, you will be directed to a real-time, updated TradingView chart.

If any other questions (or you simply want to stay in touch throughout the session), email me at renato@physikinvest.com. Happy trading!

Market Commentary

Equity index futures trade sideways to higher with most commodities. Volatility ebbs.

  • Strong balance sheets, investment, labor.
  • Ahead: Retail sales, sentiment, and more.
  • Positioning for responsive trade, balance.

What Happened: U.S. stock index futures auctioned sideways to higher overnight alongside reports the economy will be supported by consumer balance sheets, business investment, and a healthy labor market.

Ahead is data on retail sales, the Import Price Index, the Empire State Index (8:30 AM ET), University of Michigan consumer sentiment and business inventories (10:00 AM ET), as well as Fed-speak by John Williams (12:20 PM ET). 

Graphic updated 6:00 AM ET. Sentiment Risk-On if expected /ES open is above the prior day’s range. /ES levels are derived from the profile graphic at the bottom of the following section. Levels may have changed since initially quoted; click here for the latest levels. SqueezeMetrics Dark Pool Index (DIX) and Gamma (GEX) calculations are based on where the prior day’s reading falls with respect to the MAX and MIN of all occurrences available. A higher DIX is bullish. At the same time, the lower the GEX, the more (expected) volatility. SHIFT data used for S&P 500 (INDEX: SPX) options activity. Note that options flow is sorted by the call premium spent; if more positive then more was spent on call options. Breadth reflects a reading of the prior day’s NYSE Advance/Decline indicator. VIX reflects a current reading of the CBOE Volatility Index (INDEX: VIX) from 0-100.

What To Expect: As of 6:30 AM ET, Friday’s regular session (9:30 AM – 4:00 PM EST) in the S&P 500 will likely open outside of prior-range and -value, suggesting a potential for immediate directional opportunity.

Gap Scenarios: Gaps ought to fill quickly. Should they not, that’s a signal of strength; do not fade. Leaving value behind on a gap-fill or failing to fill a gap (i.e., remaining outside of the prior session’s range) is a go-with indicator.

Auctioning and spending at least 1-hour of trade back in the prior range suggests a lack of conviction; in such a case, do not follow the direction of the most recent initiative activity.

Adding, during the prior day’s regular trade, on strong intraday breadth and divergent market liquidity metrics, the best case outcome occurred

After numerous sessions of a minimum separation in value (i.e., the area where 70% of the day’s volume occurred) failed to support downside price discovery, equity index futures established a rounded bottom before initiative buyers expanded range and value the opposite way.

In light of the recovery process, the S&P 500 – as evidenced by p-shaped emotional, multiple-distribution profile structures – finished, yesterday, just short of the $4,437.75 micro composite point of control (MCPOC) as momentum faded at key areas of resting liquidity.

Graphic: Screenshot of conditions, end-of-day Thursday. Equity indices, commodities, and bonds ended sideways to higher. The Nasdaq 100 led the S&P 500, Russell 2000, and Dow Jones Industrial Average, a clear change in tone. All key levels to the upside, yesterday, came into play; the $4,437.75 micro-composite point of control (MCPOC), which corresponded with resting market liquidity, marked an end to the discovery process.

In other words, the near-vertical price rise was sold responsively. This activity comes after participants saw days of responsive buying into the dip, earlier this week.

Taken together, the status quo remains responsive trade as participants look to balance (i.e., build out a base) ahead of new information. Once new information comes to light, participants will have a base to resolve and build on, directionally, into the end of this year.

Graphic: Divergent delta (i.e., non-committed buying as measured by volume delta or buying and selling power as calculated by the difference in volume traded at the bid and offer) in SPDR S&P 500 ETF Trust (NYSE: SPY), one of the largest ETFs that track the S&P 500 index, via Bookmap. The readings are supportive of responsive trade or balance (i.e., rotational trade that suggests current prices offer favorable entry and exit).

Zooming out, we see the Nasdaq 100 coming into trend, Fibonacci, and volume-weighted average price (VWAP) resistance. This dynamic, alongside poor structure and divergent market liquidity metrics, promotes the responsive trade thesis.

Graphic: SPDR S&P 500 ETF (NYSE: SPY) top left, Invesco QQQ Trust Series 1 (NASDAQ: QQQ) top right, iShares Russell 2000 ETF (NYSE: IWM) bottom left, SPDR Dow Jones Industrial Average ETF Trust (NYSE: DIA) bottom right. Spending more than a few hours of trade above trend, VWAP (yellow), and the 61.80% Fibonacci retracement suggest good odds of upside continuation.

Further, the aforementioned trade is happening in the context of a seasonally bullish cycle of rebalancing and earnings, as well as the risks associated with a taper in asset purchases and a hike in rates.

“The economy is being supported by robust consumer balance sheets, rebounding business investment and a healthy labor market,” adds Hugh Gimber, global strategist at J.P. Morgan Asset Management.

In terms of positioning, coming into October 14, according to SpotGamma, the decay of customers’ long put hedges implied those taking the other side – dealers who warehouse short put risk – would cover their underlying hedges, bolstering the violent move higher.

“[T]his was a vanna/charm type rally back into major resistance. Said another way: we see this as a short cover rally, and the market is unstable.” 

Moreover, for today, participants may make use of the following frameworks.

In the best case, the S&P 500 trades sideways or higher; activity above the $4,437.75 MCPOC puts in play the $4,463.75 low volume area (LVNode). Initiative trade beyond the LVNode could reach as high as the $4,481.75 high volume area (HVNode) and $4,510.00 LVNode, or higher.

In the worst case, the S&P 500 trades lower; activity below the $4,437.75 MCPOC puts in play the $4,425.00 untested point of control (VPOC). Initiative trade beyond the VPOC could reach as low as the $4,393.75 HVNode and $4,349.00 VPOC, or lower.

Click here to load today’s updated real-time key levels into the web-based TradingView charting platform. Please note that all levels are derived using the 65-minute timeframe.
Graphic: 65-minute profile chart of the Micro E-mini S&P 500 Futures updated 6:30 AM ET.

Definitions

Volume Areas: A structurally sound market will build on areas of high volume (HVNodes). Should the market trend for long periods of time, it will lack sound structure, identified as low volume areas (LVNodes). LVNodes denote directional conviction and ought to offer support on any test. 

If participants were to auction and find acceptance into areas of prior low volume (LVNodes), then future discovery ought to be volatile and quick as participants look to HVNodes for favorable entry or exit.

Short Covering: The profile shape suggests participants were “too” short and had poor location.

POCs: POCs are valuable as they denote areas where two-sided trade was most prevalent in a prior day session. Participants will respond to future tests of value as they offer favorable entry and exit.

MCPOCs: POCs are valuable as they denote areas where two-sided trade was most prevalent over numerous day sessions. Participants will respond to future tests of value as they offer favorable entry and exit.

Options Expiration (OPEX): Option expiries mark an end to pinning (i.e, the theory that market makers and institutions short options move stocks to the point where the greatest dollar value of contracts will expire worthless) and the reduction dealer gamma exposure.

Price Discovery (One-Timeframe Or Trend): Elongation and range expansion denotes a market seeking new prices to establish value, or acceptance (i.e., more than 30-minutes of trade at a particular price level). 

Balance (Two-Timeframe Or Bracket): Rotational trade that denotes current prices offer favorable entry and exit. Balance-areas make it easy to spot a change in the market (i.e., the transition from two-time frame trade, or balance, to one-time frame trade, or trend). 

Modus operandi is responsive trade (i.e., fade the edges), rather than initiative trade (i.e., play the break).

Value-Area Placement: Perception of value unchanged if value overlapping (i.e., inside day). Perception of value has changed if value not overlapping (i.e., outside day). Delay trade in the former case.

More On Volume-Weighted Average Prices (VWAPs): A metric highly regarded by chief investment officers, among other participants, for quality of trade. Additionally, liquidity algorithms are benchmarked and programmed to buy and sell around VWAPs.

Rates: Low rates have to potential to increase the present value of future earnings making stocks, especially those that are high growth, more attractive. To note, inflation and rates move inversely to each other. Low rates stimulate demand for loans (i.e., borrowing money is more attractive). In conjunction with the rapid recovery, lower rates may solicit hawkish commentary as policymakers look to inhibit inflation.

News And Analysis

Upgrades outpace downgrades for second consecutive quarter.

‘Prick this bubble’: Morgan Stanley’s CEO calling for rate hikes.

Bitcoin futures frenzy erupts as day traders pile into ETF plays.

Global energy squeeze triggers unusual decline at U.S. oil hub.

China broke its Evergrande silence and said risks are in check.

JPMorgan Chase suggests more M&A could be on the horizon.

What People Are Saying

About

After years of self-education, strategy development, and trial-and-error, Renato Leonard Capelj began trading full-time and founded Physik Invest to detail his methods, research, and performance in the markets. 

Additionally, Capelj is a finance and technology reporter. Some of his biggest works include interviews with leaders such as John Chambers, founder and CEO, JC2 Ventures, Kevin O’Leary, businessman and Shark Tank host, Catherine Wood, CEO and CIO, ARK Invest, among others.

Disclaimer

At this time, Physik Invest does not manage outside capital and is not licensed. In no way should the materials herein be construed as advice. Derivatives carry a substantial risk of loss. All content is for informational purposes only.

Categories
Commentary

Market Commentary For 1/28/2021

Notice: To view this week’s big picture outlook, click here.

What Happened: Alongside the earnings of heavily weighted index constituents and news the Fed would maintain monetary stimulus amid a slowing recovery, U.S. index futures sold heavy Wednesday, and found acceptance at lower prices during the overnight session.

What Does It Mean: During Wednesday’s regular trade in the S&P 500, market participants were unable to maintain higher prices.

This came as the market failed to drum up initiative buying after an upside break of the $3,852.50 ledge, in addition to profile structures denoting the presence of excess (which forms after an auction has traveled too far in a particular direction and portends sustained reversal). Both of the prior occurrences provided increased confidence among responsive sellers.

Additionally, participants saw a proxy for buying derived from short sales (i.e., liquidity provision on the market making side) decline and a substantial change in tone in terms of speculative derivatives activity.

Graphic 1: Speculative derivatives activity for January 27, 2021
Graphic 2: DIX by Squeeze Metrics suggests large divergence between price and buying

What To Expect: Thursday’s regular session (9:30 AM – 4:00 PM ET) will likely open inside of prior-balance and -range, suggesting limited directional opportunity.

Further, yesterday’s move through the $3,824.00 – $3,763.75 balance-area was the most negative outcome and portends further downside discovery.

Graphic 3: 15-minute chart of the Micro E-mini S&P 500 Futures show near-term damage to bullish thesis

Given that increased capital was not committed into yesterday’s lows, evidenced by a divergent delta (i.e., the difference between buying and selling pressure), participants can expect a near-term low, per graphic 4.

Graphic 4: Divergent delta in the SPDR S&P 500 ETF Trust (NYSE: SPY), the largest ETF that tracks the S&P 500

That said, because the market initiated out of balance, lower, responsive sellers have been emboldened. As a result, participants ought to respond to probes into value. Therefore, as long as the S&P 500 remains below the $3,794.75 high-volume node (HVNode), an area that offers favorable entry and exit, the bearish narrative remains intact.

The go/no-go for upside is the $3,806.50 regular-trade high. The go/no-go for downside is $3,703.25 overnight low. Anything in-between portends responsive, non-directional trade.

Above $3,806.50 puts in play the $3,842.00 HVNode. Below $3,703.25, participants ought to look to the $3,611.50 and $3,556.00 HVNodes.

Graphic 5: 4-hour profile chart of the Micro E-mini S&P 500 Futures

Levels Of Interest: $3,806.50 regular-trade high, $3,703.25 overnight low.