Editor’s Note: Late today. So sorry! The main takeaway is that we’re in a window of volatility and participants should focus on leveraging rich skew and complex spreads to hedge or speculate on sideways to lower trade.
Market Commentary
- SPX below balance, 50-day SMA.
- Ahead is a 2-day FOMC meeting.
- Concerns around the debt ceiling.
- Rich skew makes hedging easier.
- Post OPEX volatility likely in play.
What Happened: U.S. stock index futures auctioned lower, last week, into Friday’s quadruple witching derivatives expiry.
Of interest this week is a meeting of the Federal Open Market Committee (FOMC).
What To Expect: During the prior week’s trade, on weak breadth, the worst-case outcome occurred, evidenced by a balance-area breakout and separation of value below the S&P 500’s 50-day simple moving average (i.e., a visual level likely paid attention to by short-term, technically-driven market participants who generally are unable to defend retests).
Balance-Break Scenarios: A change in the market (i.e., the transition from two-time frame trade, or balance, to one-time frame trade, or trend) has occurred.

We now monitor for rejection (i.e., return inside of balance) which portends a move to the opposite end of the balance.
Further, the aforementioned trade is happening in the context of a waning economic recovery, heightened valuations in the face of strong EPS expectations, the prospects of stimulus reduction, non-seasonally aligned flows, impactful options and equity market dynamics, divergent sentiment, as well as fears of a mid-cycle transition.
In a Goldman Sachs Group Inc (NYSE: GS) note posted by The Market Ear, analysts “believe it is a critical period for many investors and companies that manage performance to calendar year-end. Such pressures boost volumes and volatility as investors observe earnings reports, analyst days and managements’ guidance for the following year.”
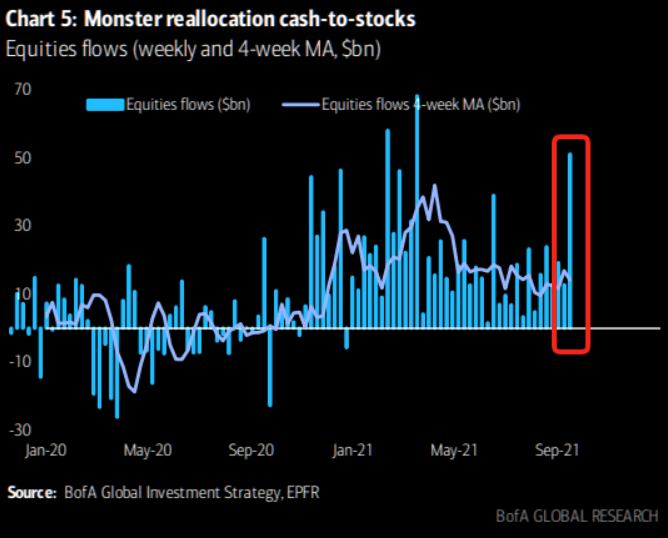
At the same time, inflows into equities are exploding to the upside as JPMorgan Chase & Co (NYSE: JPM) technicians “do not see a pattern on the [S&P 500] chart or any cross-market dynamics that would suggest the market is set for a lasting bearish reversal. The late-Aug systematic sell signals lose statistical significance into next week and the seasonal trends improve into early-Oct.”
That said, we hone in on risks.
If concerns like the debt ceiling are not resolved, some economists argue, according to Bloomberg, “that an announcement on tapering is likely to be delayed to December, and that Treasury yields could fall further as a result.”
We note that – as Goldman Sachs writes – “The upcoming debt limit deadline is beginning to look as risky as the 2011 debt limit showdown that led to Standard & Poor’s downgrade of the US sovereign rating and eventually to budget sequestration, or the 2013 deadline that overlapped with a government shutdown.”
On the other hand, according to SqueezeMetrics, “the current combination of weak put flows and large customer vanna exposure” is fragile; “people are [still] overexposed to changes in VIX, and will be hurt more than usual if VIX starts moving up. Historically, this means SPX down, VIX up.”
Following SqueezeMetrics’ remarks, SpotGamma adds that “over 50% of stocks [had] their largest gamma position” roll-off Friday. This suggests an increased potential for volatility heading into the September 21-22 FOMC event.
In this post-quad-witching window of non-strength, we may, as a result, use the rich skew to hedge (see below Weekly Trade Idea section).
Moreover, for today, given an increased potential for heightened volatility and initiative trade, participants may make use of the following frameworks.
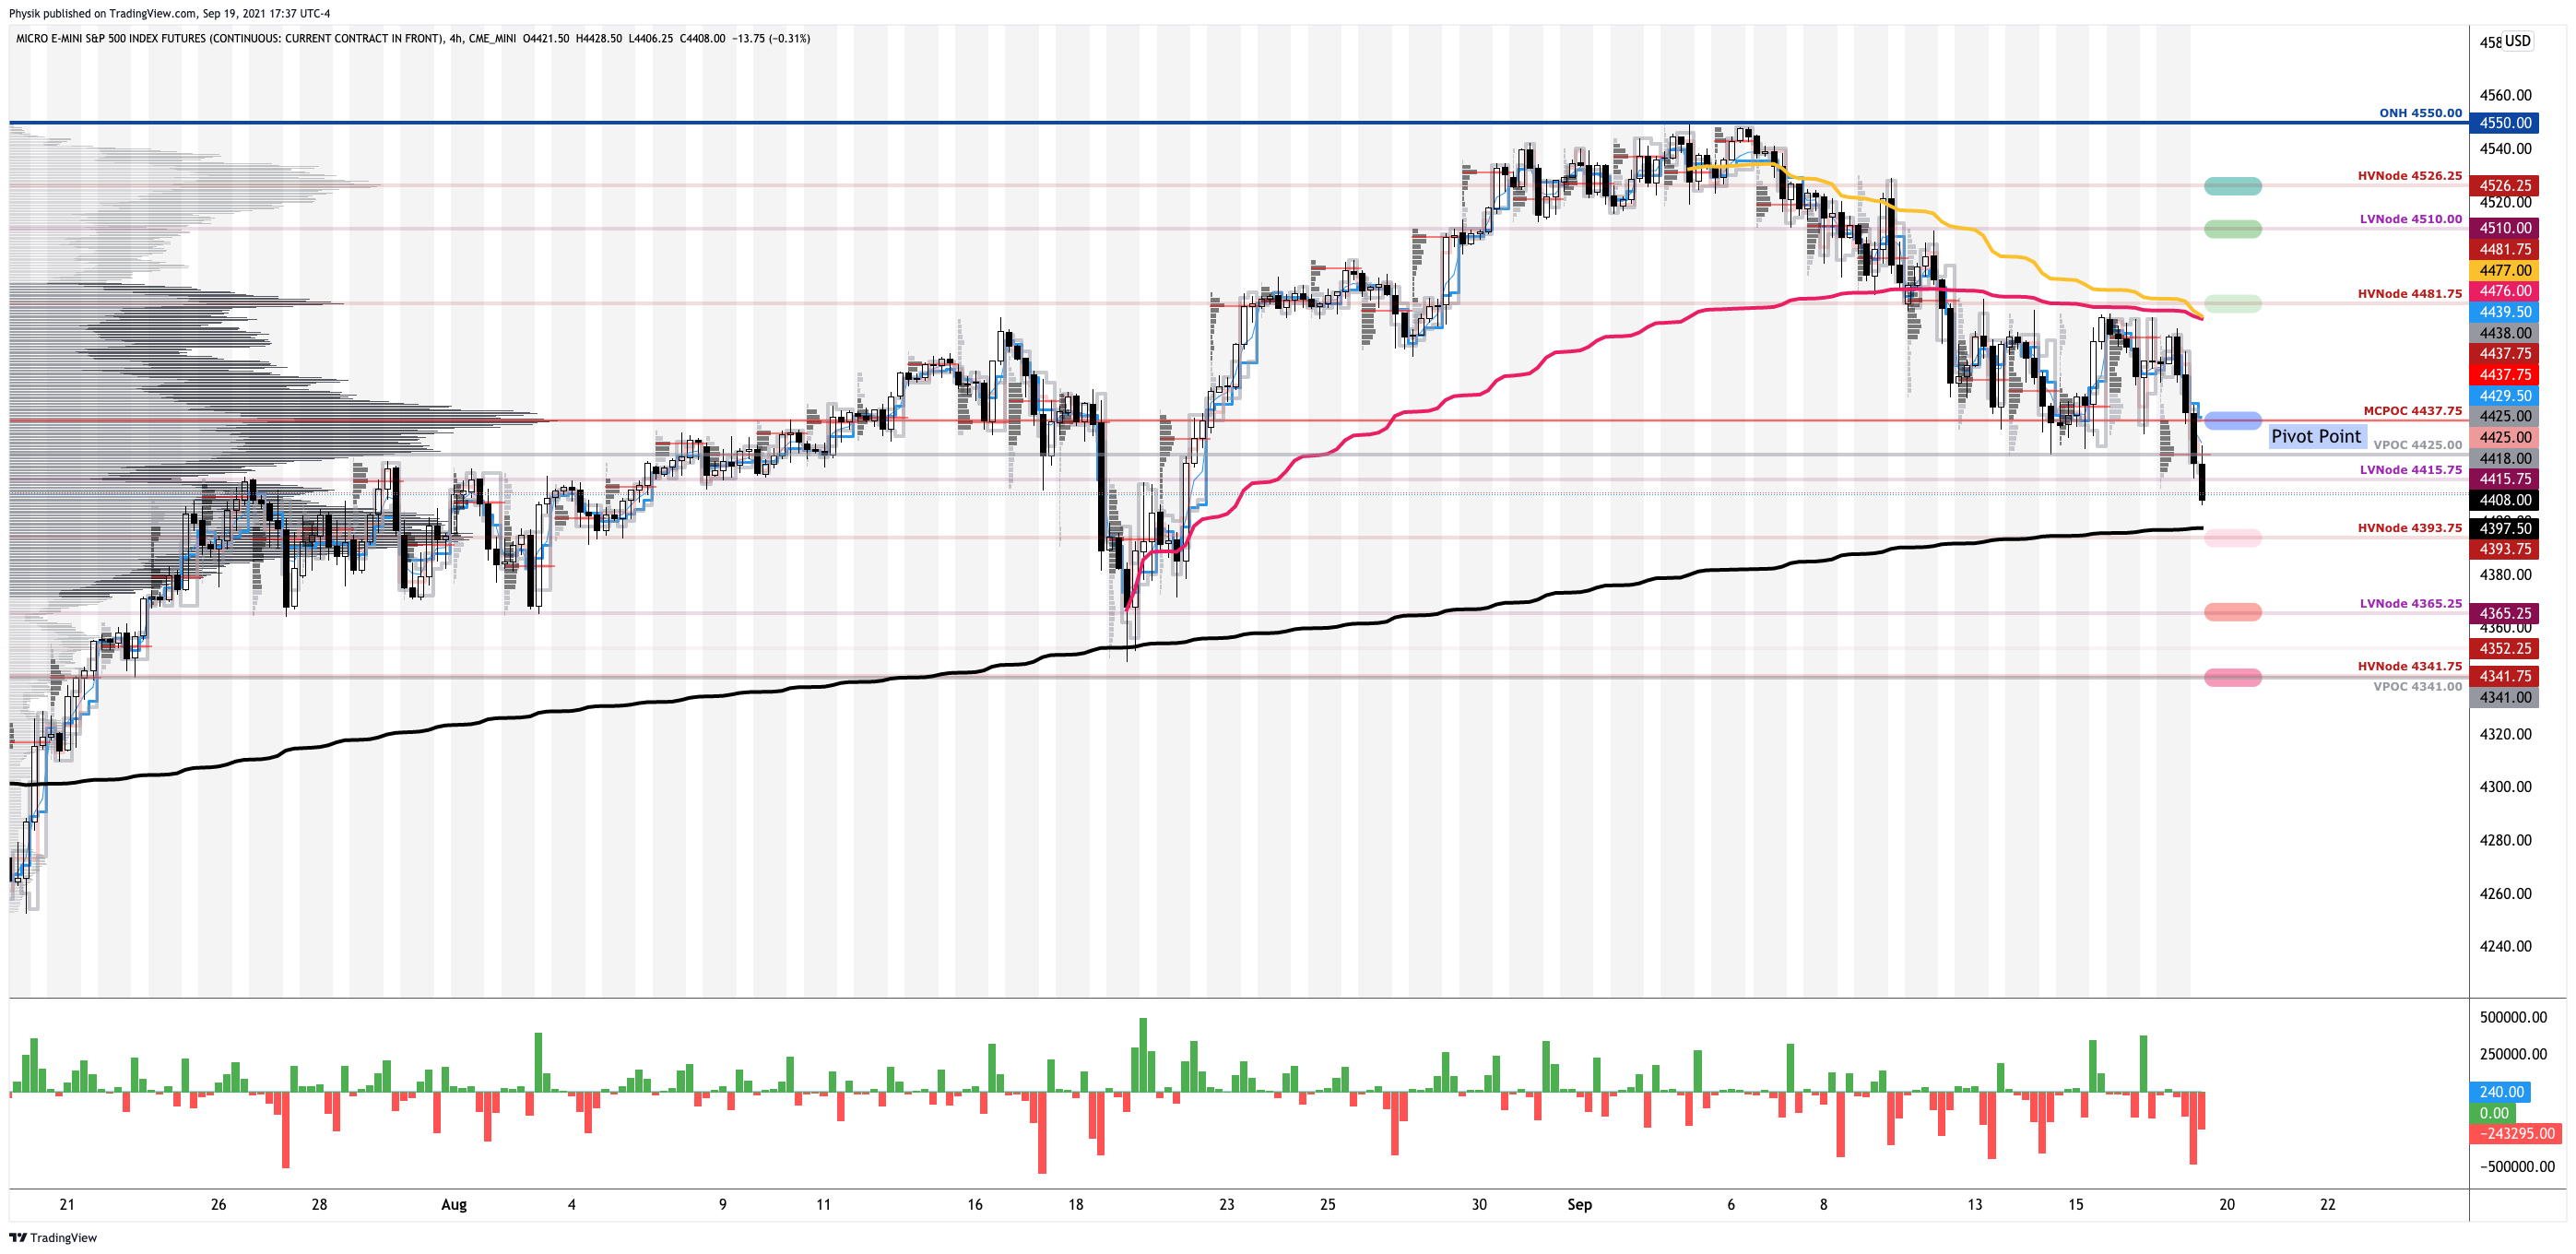
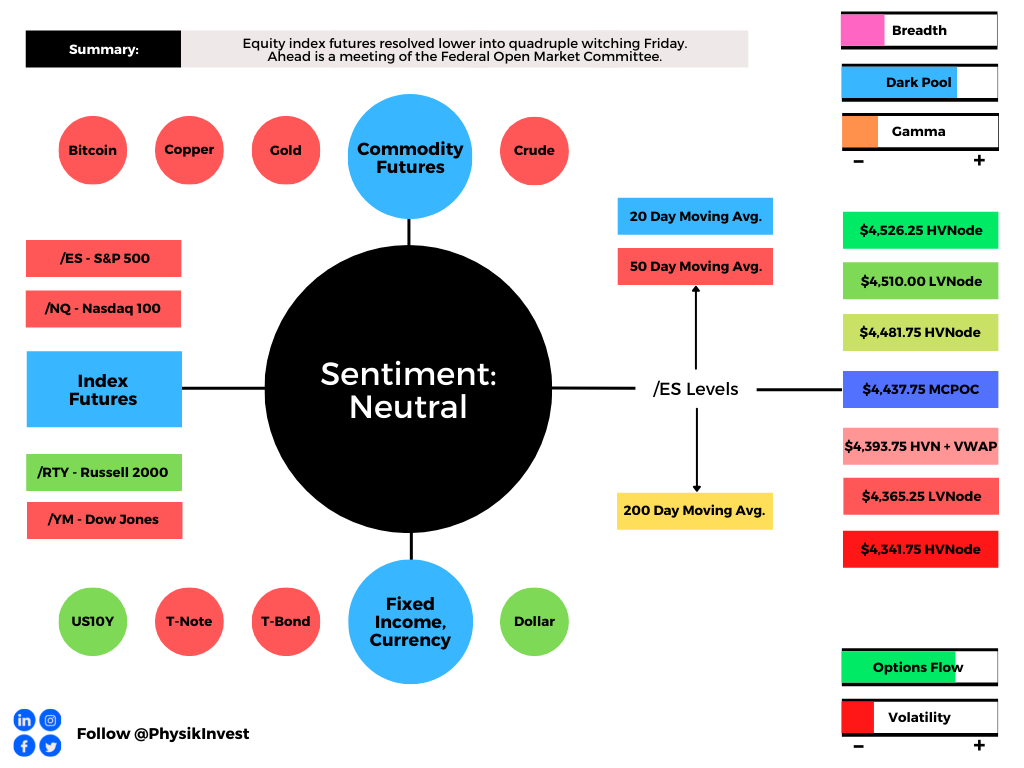
In the best case, the S&P 500 trades sideways or higher; activity above the $4,437.75 micro-composite point of control (MCPOC) puts in play the $4,481.75 high volume area (HVNode). Initiative trade beyond the $4,481.75 HVNode could reach as high as the $4,510.00 low volume area (LVNode) and $4,526.25 HVNode, or higher.
In the worst case, the S&P 500 trades lower; activity below the $4,437.75 MCPOC puts in play the $4,393.75 HVNode. Initiative trade beyond the $4,393.75 HVNode could reach as low as the $4,365.25 LVNode and $4,341.00 untested point of control (VPOC), or lower.
We note that the $4,481.75 and $4,393.75 HVNodes intersect key anchored volume-weighted average price levels. These are metrics highly regarded by chief investment officers, among other participants, for quality of trade. Additionally, liquidity algorithms are benchmarked and programmed to buy and sell around VWAPs.

Key Definitions
Volume Areas: A structurally sound market will build on areas of high volume (HVNodes). Should the market trend for long periods of time, it will lack sound structure, identified as low volume areas (LVNodes). LVNodes denote directional conviction and ought to offer support on any test.
If participants were to auction and find acceptance into areas of prior low volume (LVNodes), then future discovery ought to be volatile and quick as participants look to HVNodes for favorable entry or exit.
POCs: POCs are valuable as they denote areas where two-sided trade was most prevalent in a prior day session. Participants will respond to future tests of value as they offer favorable entry and exit.
MCPOCs: POCs are valuable as they denote areas where two-sided trade was most prevalent over numerous day sessions. Participants will respond to future tests of value as they offer favorable entry and exit.
Weekly Trade Idea
Please Note: In no way is the below a trade recommendation. Derivatives carry a substantial risk of loss. All content is for informational purposes only.
Options offer an efficient way to gain directional exposure.
If an option buyer was short (long) stock, he or she could buy a call (put) to hedge upside (downside) exposure. Additionally, one can spread, or buy (+) and sell (-) options together, strategically.
Commonly discussed spreads include credit, debit, ratio, back, and calendar.
- Credit: Sell -1 option closer to the money. Buy +1 option farther out of the money.
- Debit: Buy +1 option closer to the money. Sell -1 option farther out of the money.
- Ratio: Buy +1 option closer to the money. Sell -2 options farther out of the money.
- Back: Sell -1 option closer to the money. Buy +2 options farther out of the money.
- Calendar: Sell -1 option. Buy +1 option farther out in time, at the same strike.
Typically, if bullish (bearish), sell at-the-money put (call) credit spread and/or buy a call (put) debit/ratio spread structured around target price. Alternatively, if the expected directional move is great (small), opt for a back spread (calendar spread). Also, if credit spread, capture 50-75% of the premium collected. If debit spread, capture 2-300% of the premium paid.
Be cognizant of risk exposure to direction (delta), time (theta), and volatility (vega).
- Negative (positive) delta = synthetic short (long).
- Negative (positive) theta = time decay hurts (helps).
- Negative (positive) vega = volatility hurts (helps).
Trade Idea: SELL -1 1/2 BACKRATIO SPX 100 (Weeklys) 29 SEP 21 4400/4300 PUT @.65 CREDIT LMT
I’m neutral to bearish on the S&P 500 and I think the index may slide toward $4,300. I will structure a spread below the current index price, expiring in about 2 weeks. I will buy the 4400 put option once (+1) and sell the 4300 put option twice (-2) for a $0.65 credit. Should the index not move to my target, I keep the $65 credit. Should it move to $4,300, I could make $10,065.00 at expiry. Should the index move past $4,200.00 or so, I may incur unlimited losses. My goal, with this spread, is to capture the initial credit and close for additional credit if the index moves lower.

If necessary, I will hedge the position by either (A) selling futures, (B) widening strikes, (C) buying a far out-of-the-money put option to cap downside in case of an unpredictable move lower, or (D) roll strikes down in price and out in time.
News And Analysis
An essay on why you keep losing money as a trader.
August retail sales reflect strong consumer demand.
UBS: Resist temptation to time market despite highs.
U.S. debt ceiling fight could cause markets to tumble.
Nasdaq on whether Rule 605 works better in dollars.
Rally driven less by reflation prospects; TINA to stock.
Higher U.S. CGT proposal spurs a PE and M&A rush.
If a CEO talks like Kant, think twice before investing.
New vehicle prices surge amid global chip shortages.
Active managers’ performance disappointing in 2021.
DeFi is disrupting but not derailing traditional finance.
OpenSea admitted recent incident as insider trading.
SEC looks to greater oversight of the crypto markets.
Central bank digital currency; cash for the digital age.
White House to put forward three CFTC nominations.
Some key lessons from NYC’s first SALT conference.
Let’s Hang Out
Salt Lake City, UT September 28-30
About
After years of self-education, strategy development, and trial-and-error, Renato Leonard Capelj began trading full-time and founded Physik Invest to detail his methods, research, and performance in the markets.
Additionally, Capelj is a finance and technology reporter. Some of his biggest works include interviews with leaders such as John Chambers, founder and CEO, JC2 Ventures, Kevin O’Leary, businessman and Shark Tank host, Catherine Wood, CEO and CIO, ARK Invest, among others.
Disclaimer
At this time, Physik Invest does not manage outside capital and is not licensed. In no way should the materials herein be construed as advice. Derivatives carry a substantial risk of loss. All content is for informational purposes only.