
What Happened
Overnight, screens went green as equity index and commodity futures auctioned sideways to higher as fears regarding the Chinese economy and omicron were assuaged.
Specifically, China moved to ease monetary policy and studies revealed GSK’s antibody treatment working on the COVID-19 omicron variant.
Ahead is data on the trade deficit, productivity, and unit labor costs (8:30 AM ET), as well as consumer credit (3:00 PM ET).
What To Expect
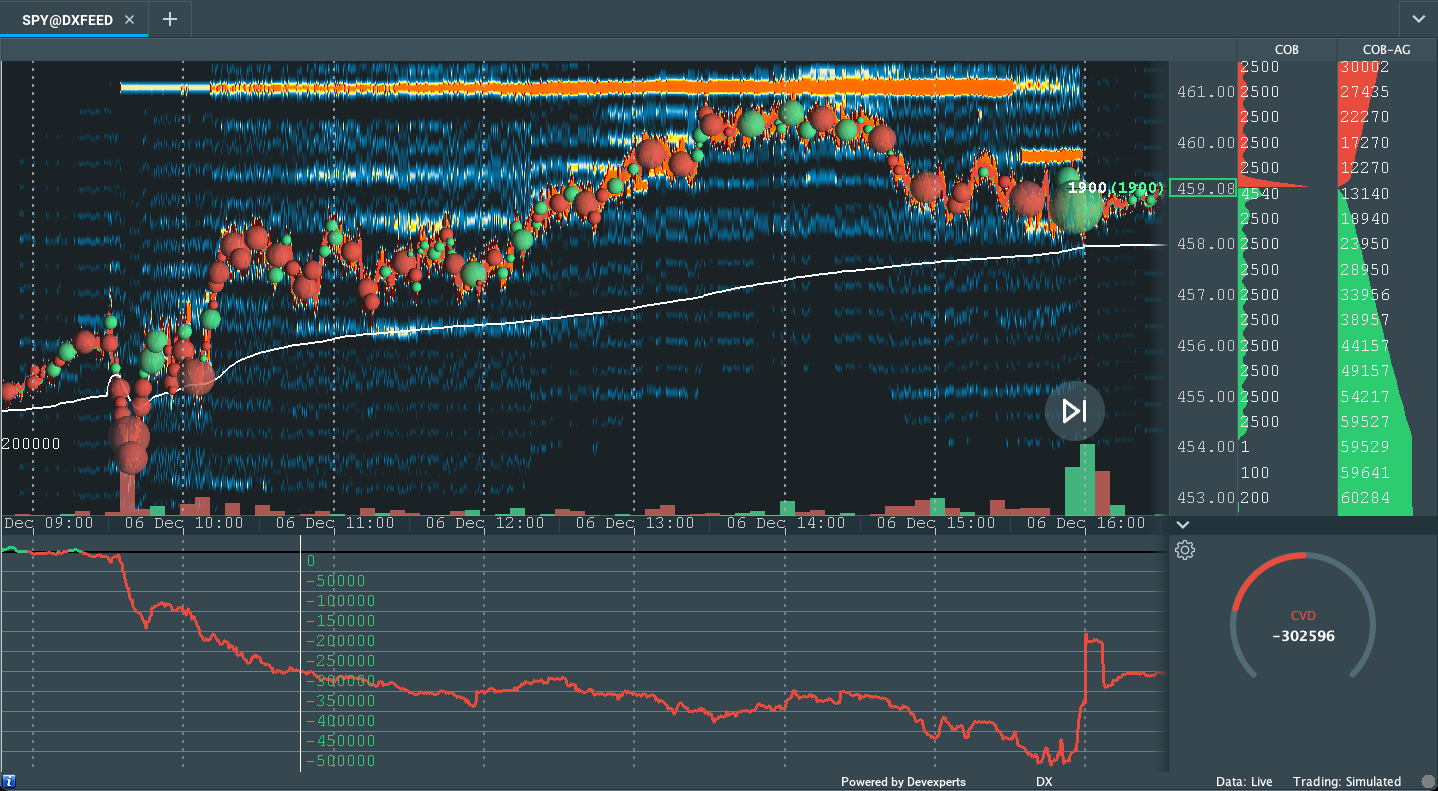
On supportive intraday breadth and divergent market liquidity metrics, the best case outcome occurred, evidenced by an upside gap, expansion of range, and separation of value.
This activity, which marks participants’ willingness to change the trend, is on top of poor structure, a dynamic that adds to technical instability.
Specifically, Monday’s session left a gap and p-shaped emotional, multiple-distribution profile structure (i.e., old-money shorts covering).
Going forward, participants will look to revisit, repair, and strengthen – build out areas of high volume (HVNodes) via the cave-fill process – these areas of low volume (LVNodes).
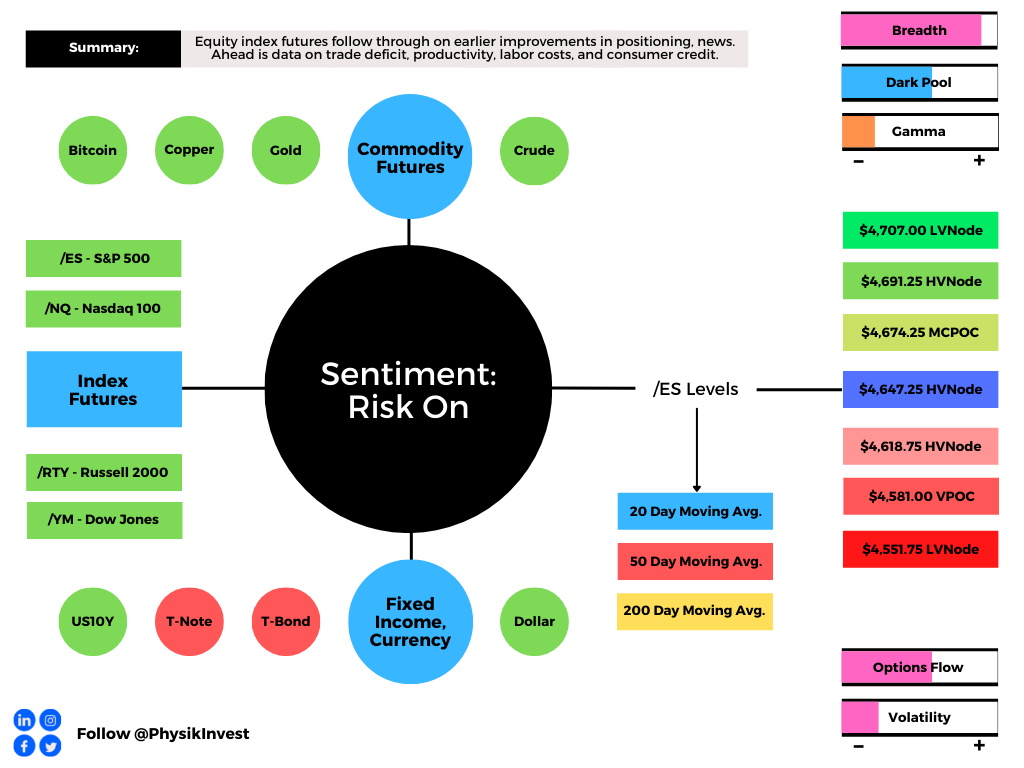
Context: COVID-19, China, and U.S. growth, as well as improvements in positioning metrics.
Overnight, there was news that GlaxoSmithKline Plc’s research showed its antibody treatment effective against mutations in the omicron variant.
This came after China’s decision to reduce the cash banks must hold in reserves; the development releases “funds in long-term liquidity to bolster slowing economic growth.”
As noted yesterday, though there is a potential that the U.S. realizes the swiftest tightening in financial conditions since 2005, now, more than during the tech-and-telecom bubble, do rates and earnings growth support current valuations.
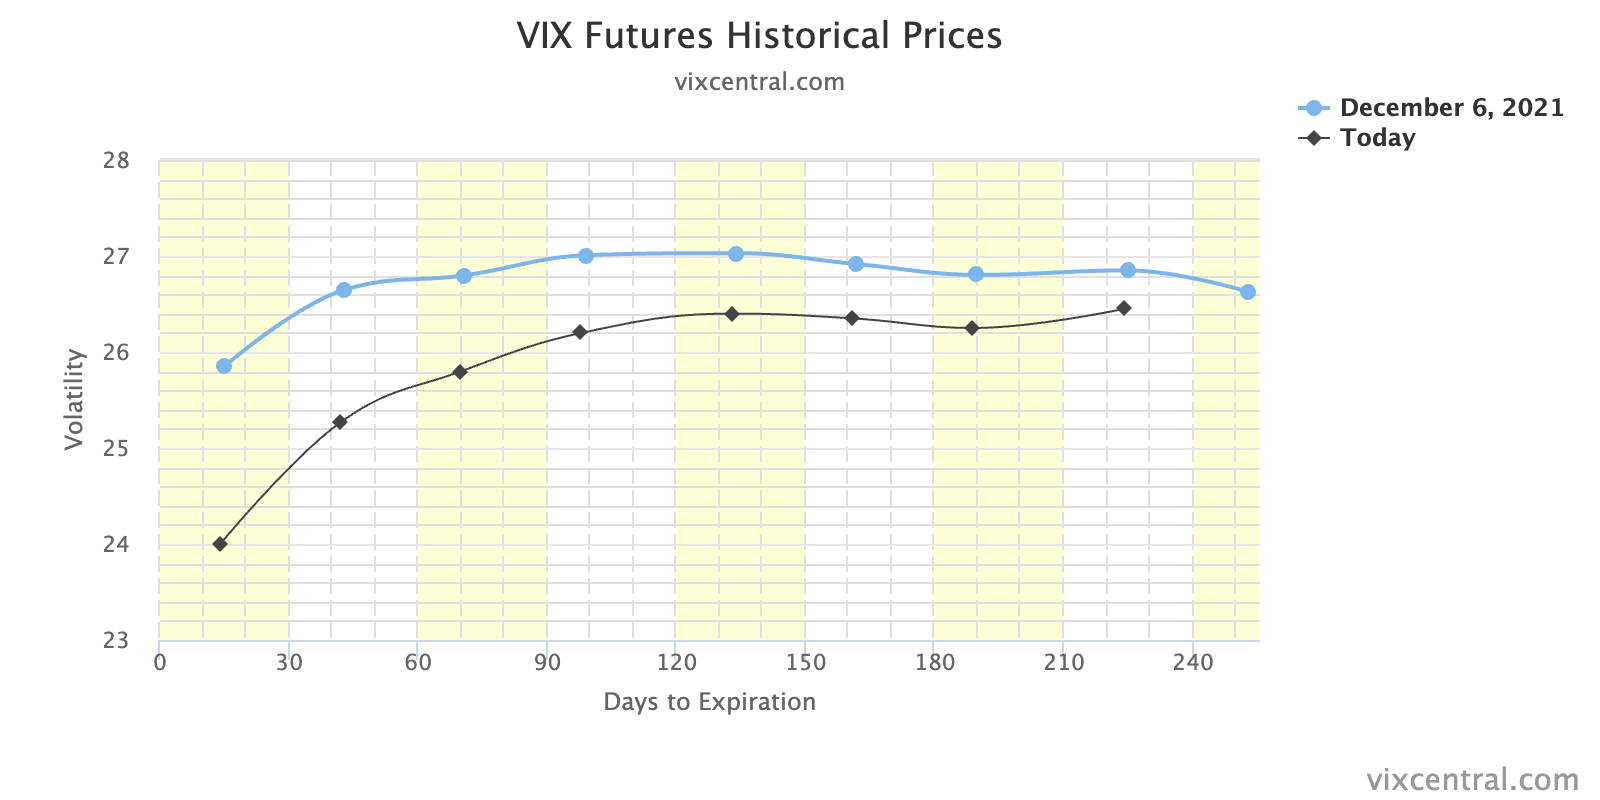
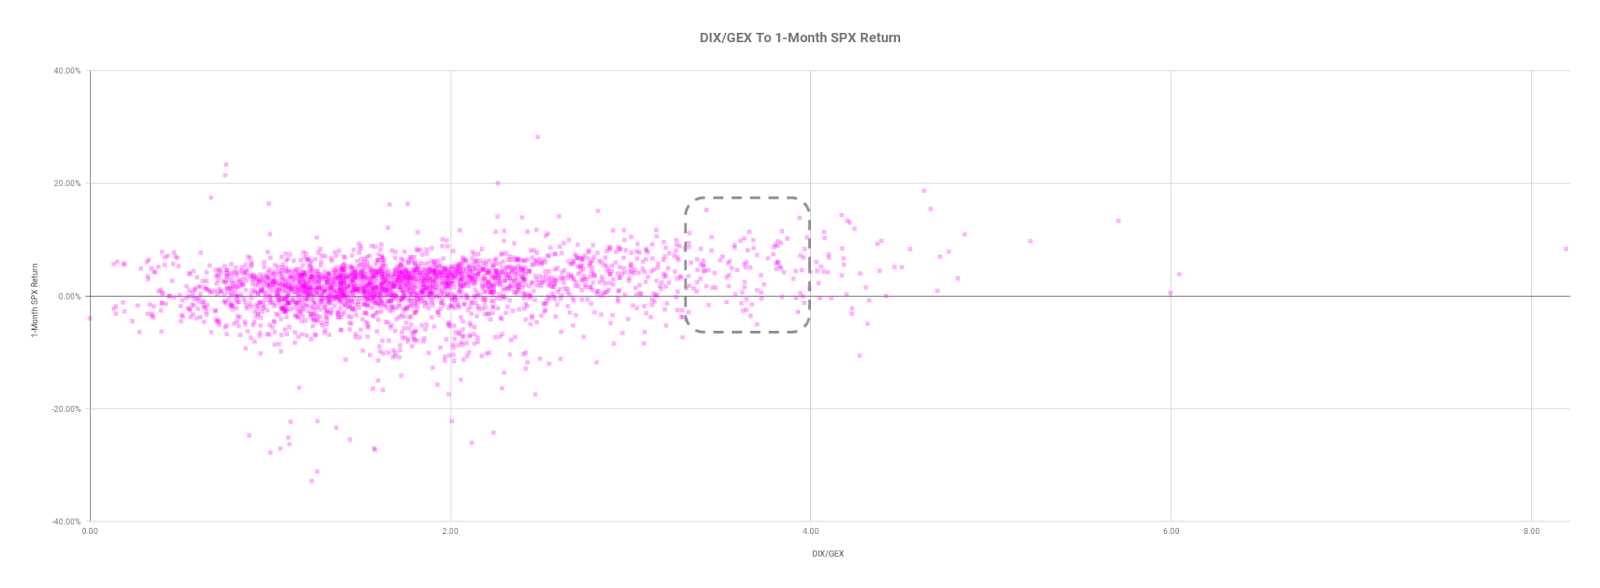
At the same time, DIX, which is derived from short sales (i.e., liquidity provision on the market-making side), pointed to “natural, passive buying support,” while negative gamma exposures (i.e., an environment characterized by options dealers hedging their exposure by selling into lows and buying into highs), as a result of increased demand for very short-dated downside protection, left the market prone to destabilizing volatility.
Taken together, the distribution of forward S&P 500 returns was skewed positive, heading into Monday’s session.
Subsequent price action, after participants’ powerful responsive buying at the S&P 500’s 50-day simple moving average, which coincided with a large base of resting liquidity at $4,500.00, is follow-through on indices being positioned for a vicious rebound.
To tame our expectations, I end with a statement from Morgan Stanley (NYSE: MS) research:
“We reiterate our view that tapering is tightening for the markets and it will lead to lower valuations like it always does at this stage of any recovery. How much lower? We forecast S&P 500 forward P/Es to fall to 18x, or approximately 12% below current levels. Obviously, for the more expensive parts of the market, that decline will be larger.”
Expectations: As of 6:30 AM ET, Monday’s regular session (9:30 AM – 4:00 PM ET), in the S&P 500, will likely open in the upper part of a positively skewed overnight inventory, outside of prior-range and -value, suggesting a potential for immediate directional opportunity.
Gap Scenarios: Gaps ought to fill quickly. Should they not, that’s a signal of strength; do not fade. Leaving value behind on a gap-fill or failing to fill a gap (i.e., remaining outside of the prior session’s range) is a go-with indicator.

Auctioning and spending at least 1-hour of trade back in the prior range suggests a lack of conviction; in such a case, do not follow the direction of the most recent initiative activity.
In the best case, the S&P 500 trades sideways or higher; activity above the $4,647.25 HVNode puts in play the $4,674.25 micro composite point of control (MCPOC).
Initiative trade beyond the MCPOC could reach as high as the $4,691.25 HVNode and $4,707.00 LVNode, or higher.
In the worst case, the S&P 500 trades lower; activity below the $4,647.25 HVNode puts in play the $4,618.75 HVNode.
Initiative trade beyond the latter could reach as low as the $4,581.00 untested point of control (VPOC) and $4,551.75 LVNode, or lower.
Click here to load today’s updated key levels into the web-based TradingView charting platform. Note that all levels are derived using the 65-minute timeframe. New links are produced, daily.

What People Are Saying
Definitions
Cave-Fill Process: Widened the area deemed favorable to transact at by an increased share of participants. This is a good development.
Volume Areas: A structurally sound market will build on areas of high volume (HVNodes). Should the market trend for long periods of time, it will lack sound structure, identified as low volume areas (LVNodes). LVNodes denote directional conviction and ought to offer support on any test.
If participants were to auction and find acceptance into areas of prior low volume (LVNodes), then future discovery ought to be volatile and quick as participants look to HVNodes for favorable entry or exit.
POCs: POCs are valuable as they denote areas where two-sided trade was most prevalent in a prior day session. Participants will respond to future tests of value as they offer favorable entry and exit.
MCPOCs: POCs are valuable as they denote areas where two-sided trade was most prevalent over numerous day sessions. Participants will respond to future tests of value as they offer favorable entry and exit.
Value-Area Placement: Perception of value unchanged if value overlapping (i.e., inside day). Perception of value has changed if value not overlapping (i.e., outside day). Delay trade in the former case.
About
After years of self-education, strategy development, and trial-and-error, Renato Leonard Capelj began trading full-time and founded Physik Invest to detail his methods, research, and performance in the markets.
Additionally, Capelj is a Benzinga finance and technology reporter interviewing the likes of Shark Tank’s Kevin O’Leary, JC2 Ventures’ John Chambers, and ARK Invest’s Catherine Wood, as well as a SpotGamma contributor, developing insights around impactful options market dynamics.
Disclaimer
At this time, Physik Invest does not manage outside capital and is not licensed. In no way should the materials herein be construed as advice. Derivatives carry a substantial risk of loss. All content is for informational purposes only.