
Physik Invest’s Daily Brief is read by thousands of subscribers. You, too, can join this community to learn about the fundamental and technical drivers of markets.
Positioning
The Federal Reserve (Fed) upped its benchmark interest rate by 25 basis points. This puts the target rate range between 4.5% and 4.75%.
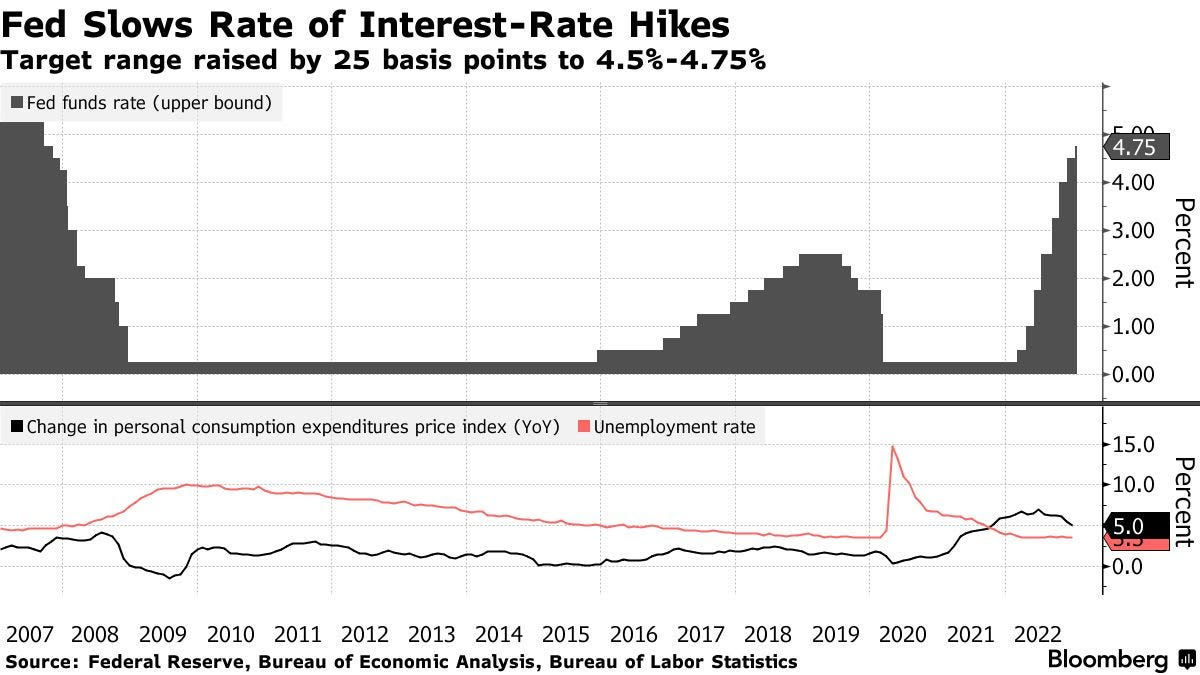
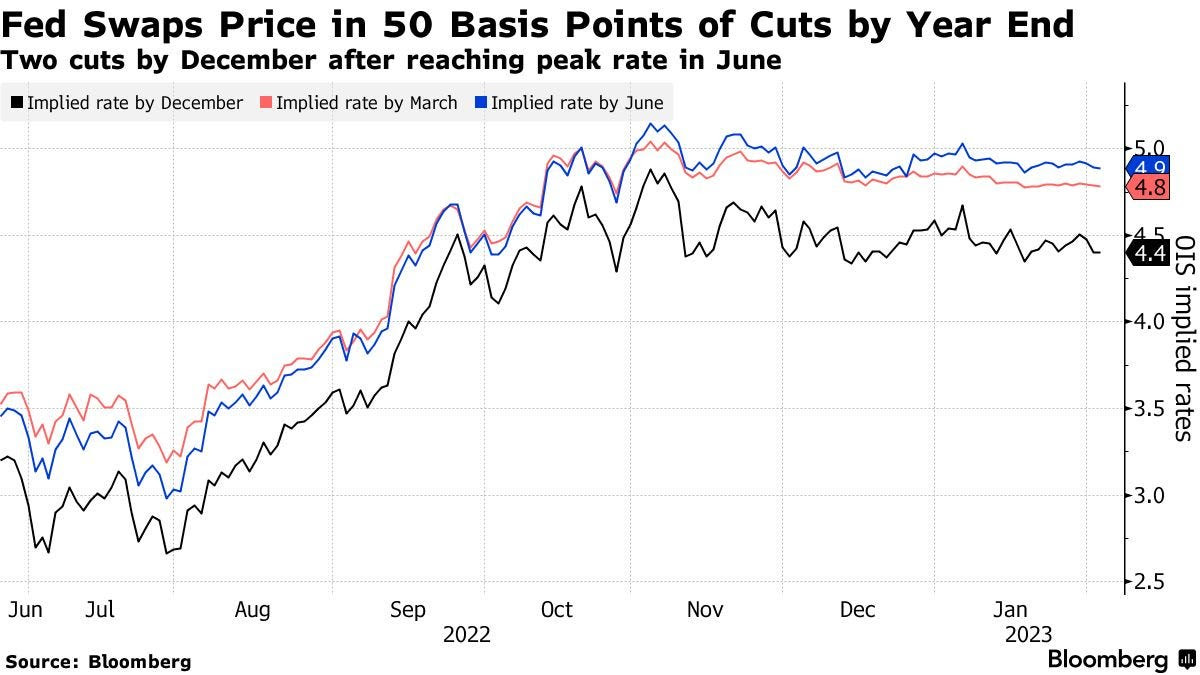
The Fed’s Jerome Powell signaled that toughness on inflation will last; though the “disinflation process has started,” and markets are pricing about 50 basis points of cuts by year-end, Powell said rates will continue to increase at least a couple more times. He said rates may reach as high as 5.25% to cut “inflation to 2% over time.”
Markets rallied sharply when Powell began talking. Some suggest his not “overly combative” responses were a reason. Looking back to the Daily Brief for February 1, 2023, we said that in spite of “toughness from the Fed,” markets would likely trend sideways to higher as traders would “not be able to justify the pricing of the ultra-short-dated options they demanded heading into Wednesday.”
Consequently, the supply and expiry of short-dated options coincided with dealers, who were short-stock against the puts they supplied, buying back their hedges. Kai Volatility’s Cem Karsan put this well in a media appearance pre-Fed.
He said that “vol structurally affects how markets move” and that put options, which traders own and dealers are short (and hedging with short stock, as well), would likely go down in value as the “event vol” falls; “those vanna and charm effects will naturally lead to a buyback.”
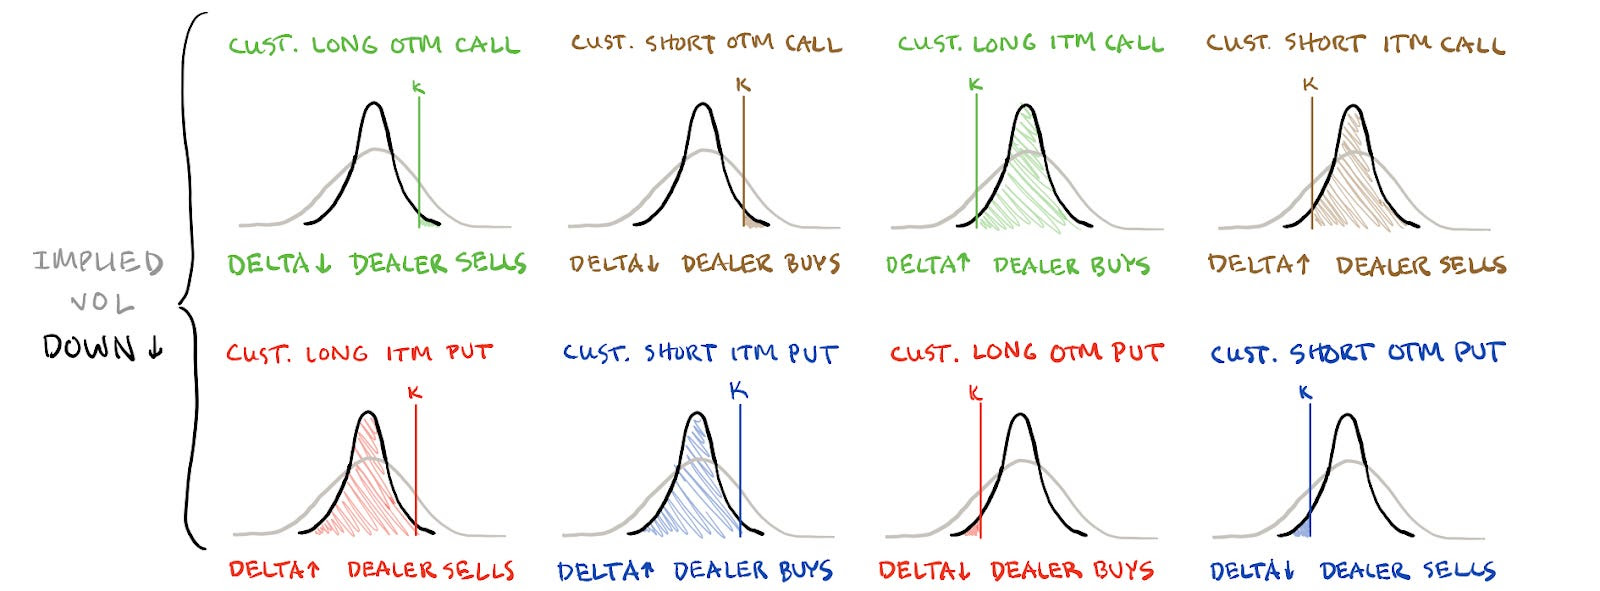
For context, vanna is the change in an options delta with respect to changes in IVOL. Charm is the change in an options delta with respect to changes in time. These are second-order derivatives of an option’s value, once to time or IVOL, and once to delta.
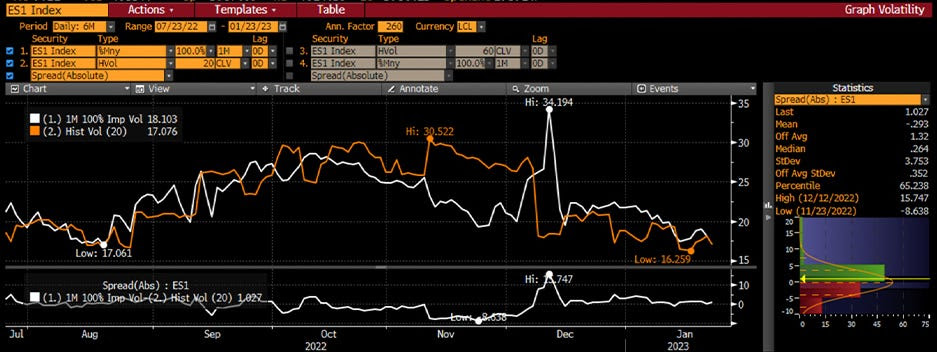
The positive market response, however, should not overly excite. Rather, the market is in a precarious position, and the compression of volatility, given its low starting point, probably does little to encourage a long-lasting rally.
Trades this letter put forth (e.g., call butterflies and ratio spreads) that would benefit from a sharp move higher while limiting the downside, in products like the Nasdaq 100 (INDEX: NDX), are working spectacularly. In fact, while your letter writer was traveling, his trading partner initiated some +1 x -2 (17 FEB 23 13500/14000) call ratio spreads for free (i.e., $0.00 debit or better to enter), and those spreads are now pricing over $6.00 credit to close. That’s $600.00. Nice job, Justin!
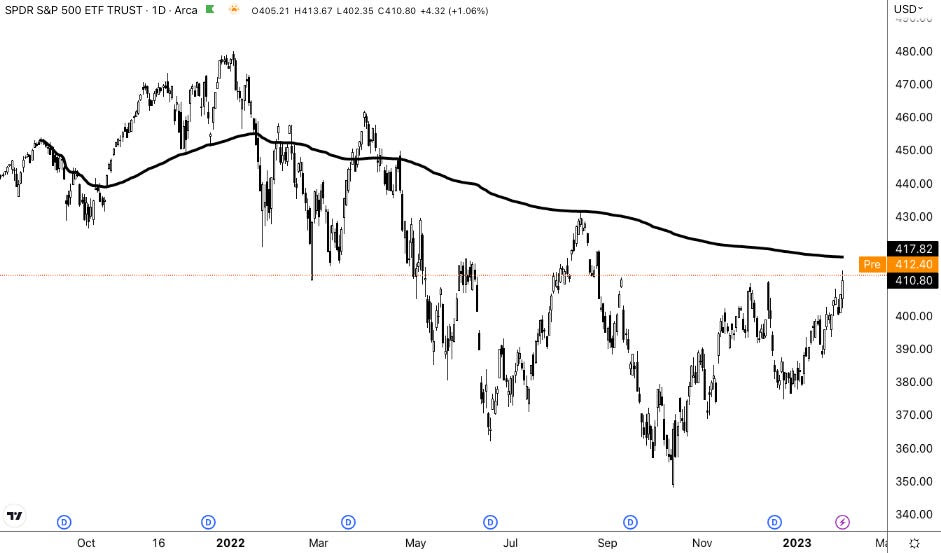
Anyways, though markets could continue trending higher, the risks for a move lower, particularly after mid-February, are increasing some say. Additionally, though we keep our technical analysis usually limited to volume and market profiles, there are a few anchored volume-weighted average price levels sticking out just above current prices.
For context, VWAPs are metrics highly regarded by chief investment officers, among other participants, for the quality of trade. Additionally, liquidity algorithms are benchmarked and programmed to buy and sell around VWAPs.
Knowing that longer-dated S&P 500 (INDEX: SPX) implied volatility (IVOL) is cheap, now attractive trades include selling rich call verticals to finance put verticals.
As an aside, there are a number of reasons for calls pricing the way they do. Some of them include the opportunity cost of forgone interest (i.e., buy a call and invest the outlay difference in an interest-bearing account), as well as a fear of missing out in the context of a lower liquidity environment and less supply to absorb demand for hedging (hence higher lows in the VIX).
Technical
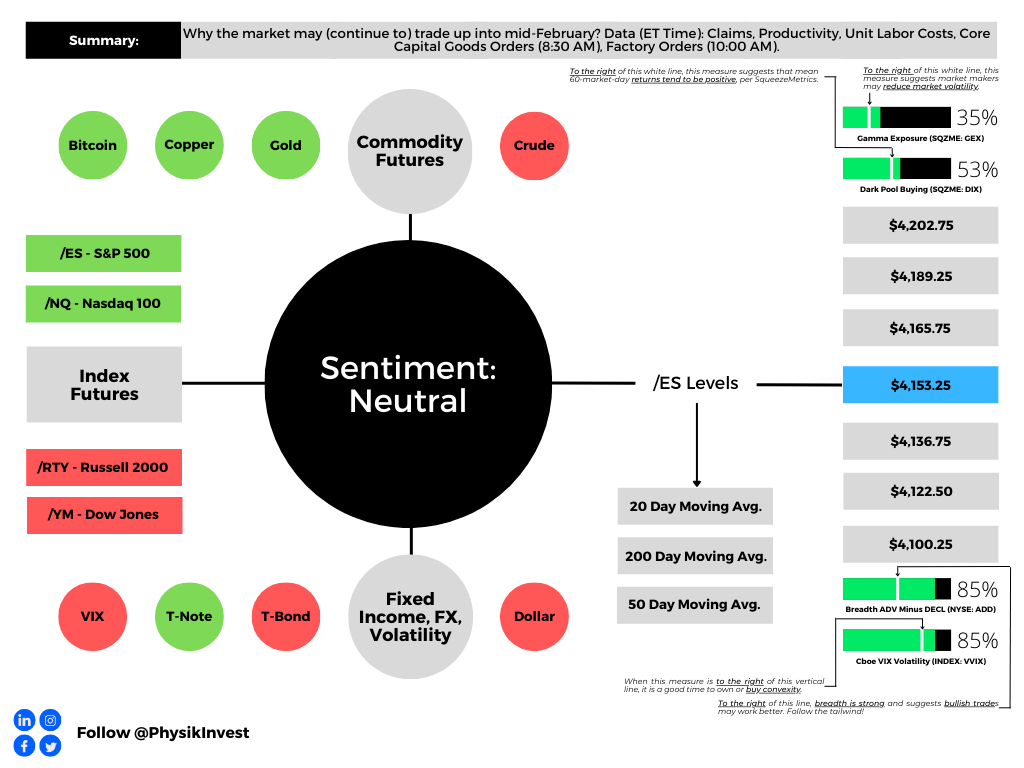
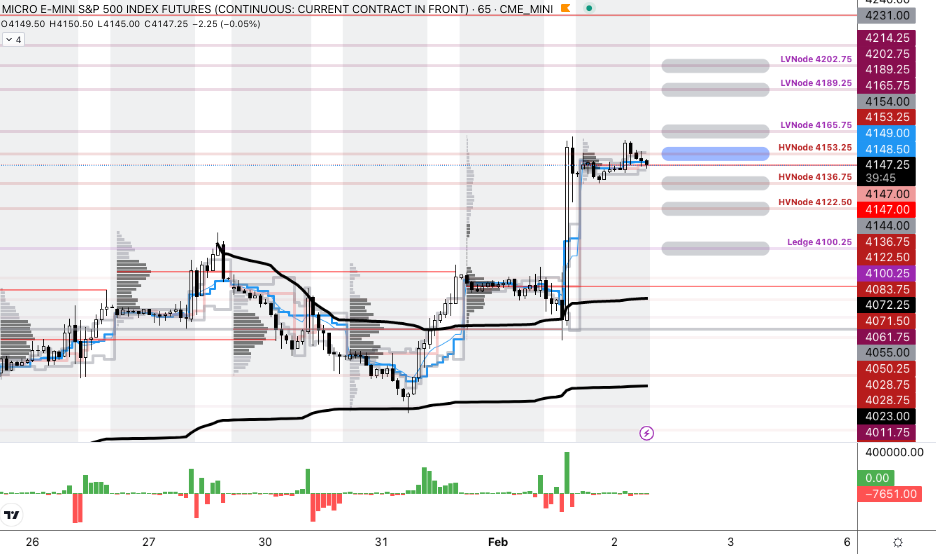
As of 7:30 AM ET, Thursday’s regular session (9:30 AM – 4:00 PM ET), in the S&P 500, is likely to open in the middle part of a balanced overnight inventory, inside of the prior range, suggesting a limited potential for immediate directional opportunity.
The S&P 500 pivot for today is $4,153.25.
Key levels to the upside include $4,165.75, $4,189.25, and $4,202.75.
Key levels to the downside include $4,136.75, $4,122.50, and $4,100.25.
Disclaimer: Click here to load the updated key levels via the web-based TradingView platform. New links are produced daily. Quoted levels hold weight barring an exogenous development.
Definitions
Volume Areas: Markets will build on areas of high-volume (HVNodes). Should the market trend for a period of time, this will be identified by a low-volume area (LVNodes). The LVNodes denote directional conviction and ought to offer support on any test.
If participants auction and find acceptance in an area of a prior LVNode, then future discovery ought to be volatile and quick as participants look to the nearest HVNodes for more favorable entry or exit.
About
In short, Renato Leonard Capelj is an economics graduate working in finance and journalism.
Capelj spends most of his time as the founder of Physik Invest through which he invests and publishes daily analyses to subscribers, some of whom represent well-known institutions.
Separately, Capelj is an equity options analyst at SpotGamma and an accredited journalist interviewing global leaders in business, government, and finance.
Past works include conversations with investor Kevin O’Leary, ARK Invest’s Catherine Wood, FTX’s Sam Bankman-Fried, Lithuania’s Minister of Economy and Innovation Aušrinė Armonaitė, former Cisco chairman and CEO John Chambers, and persons at the Clinton Global Initiative.
Contact
Direct queries to renato@physikinvest.com or Renato Capelj#8625 on Discord.
Calendar
You may view this letter’s content calendar at this link.
Disclaimer
Do not construe this newsletter as advice. All content is for informational purposes.


