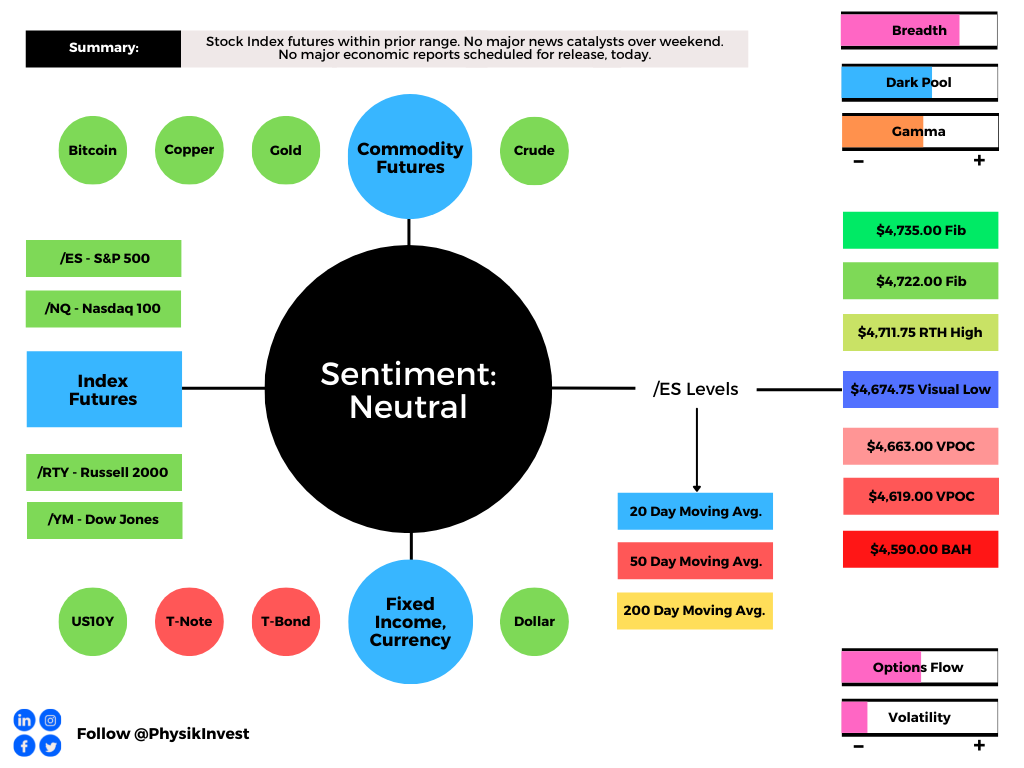
What Happened
Overnight, equity index futures auctioned sideways to higher as participants looked to take back nearly all of Friday’s shortened holiday trading range.
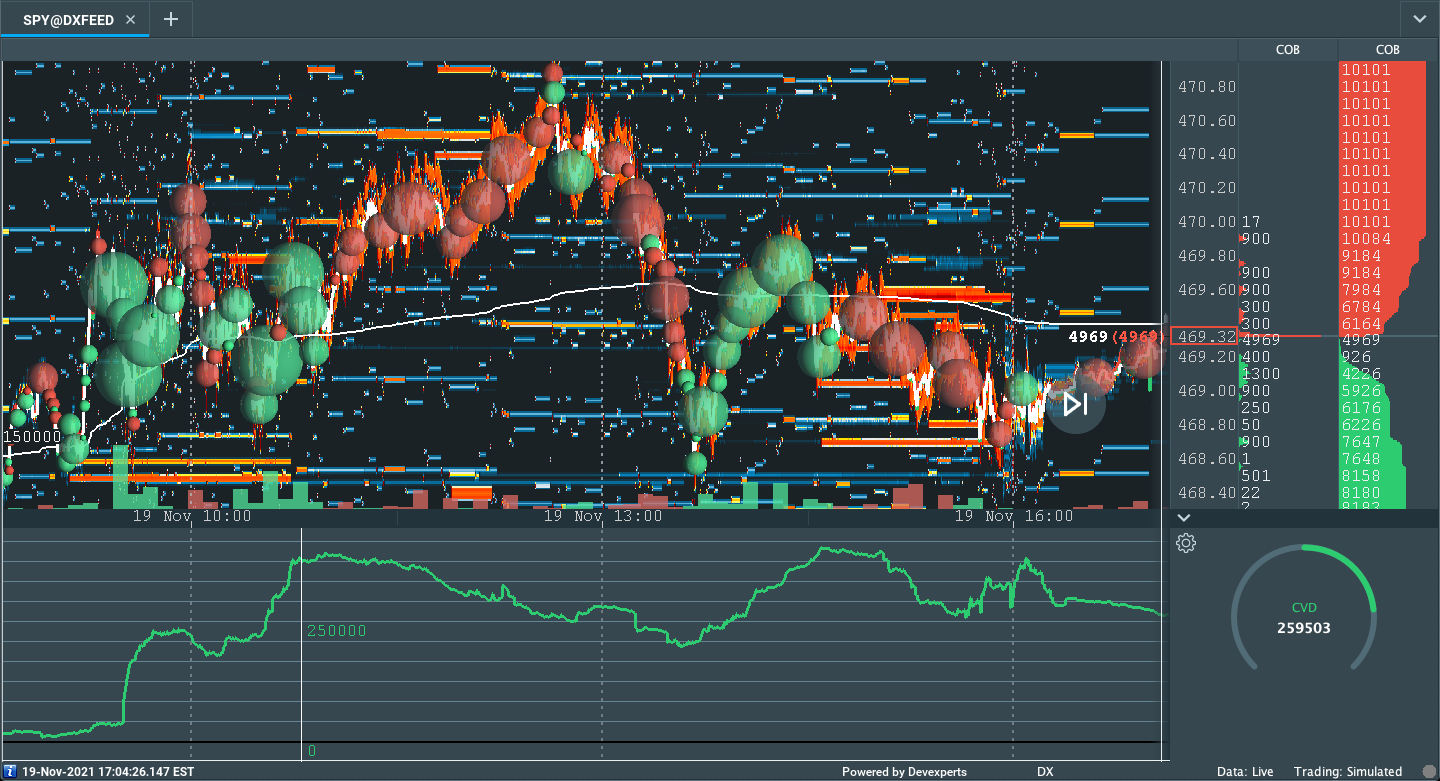
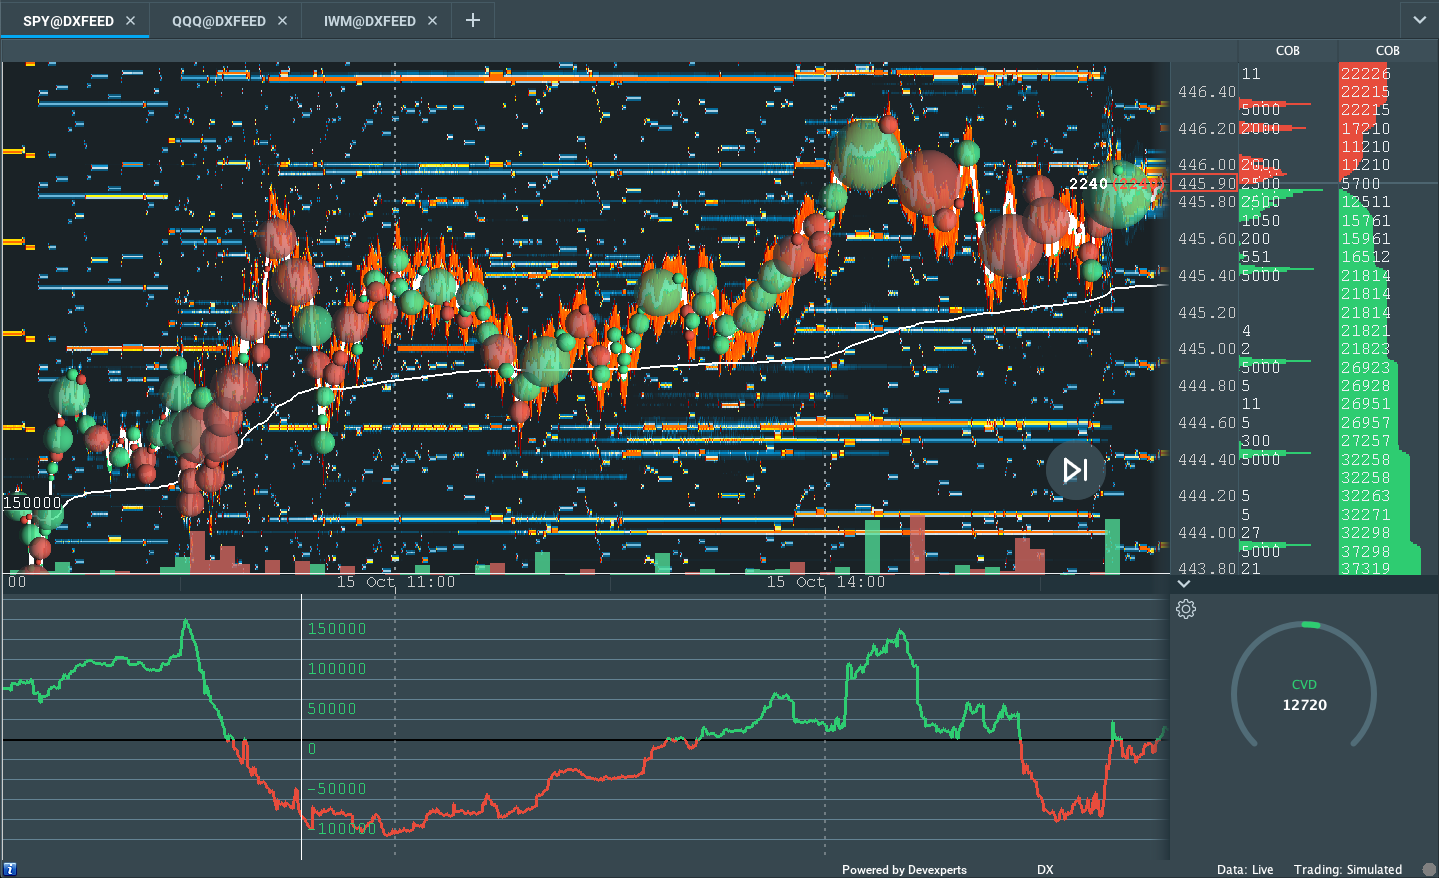
According to some metrics, the SPDR S&P 500 ETF Trust (NYSE: SPY), one of the largest ETFs that track the S&P 500 index, experienced one of its most illiquid days, Friday.
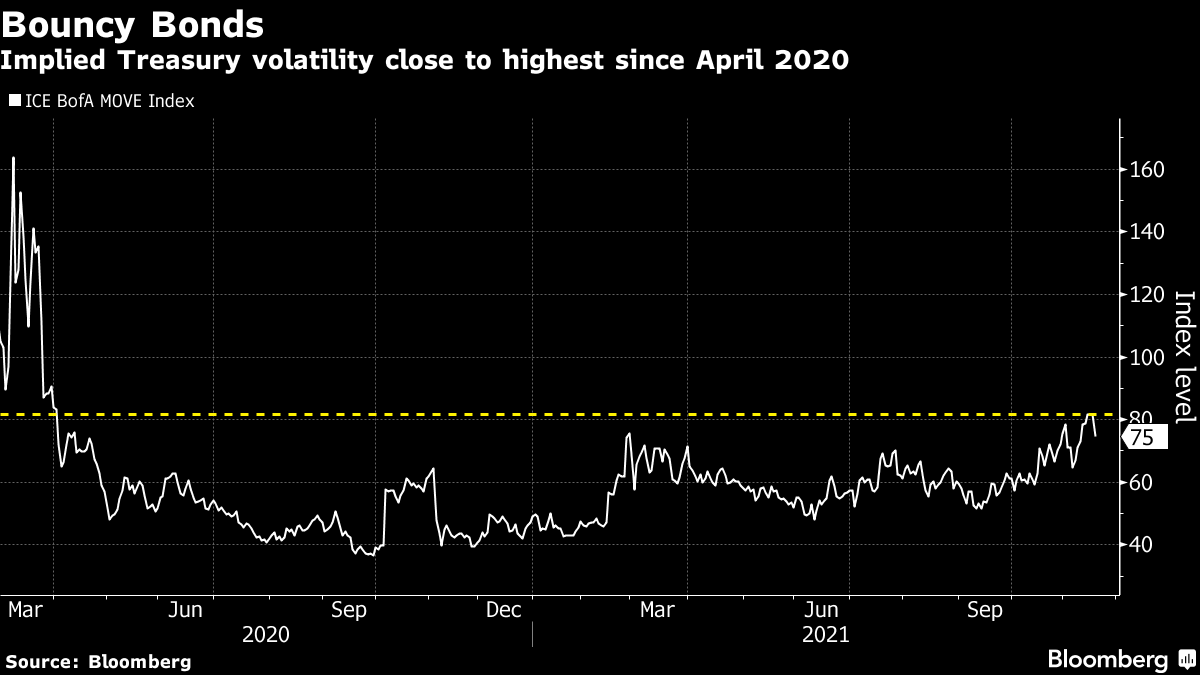
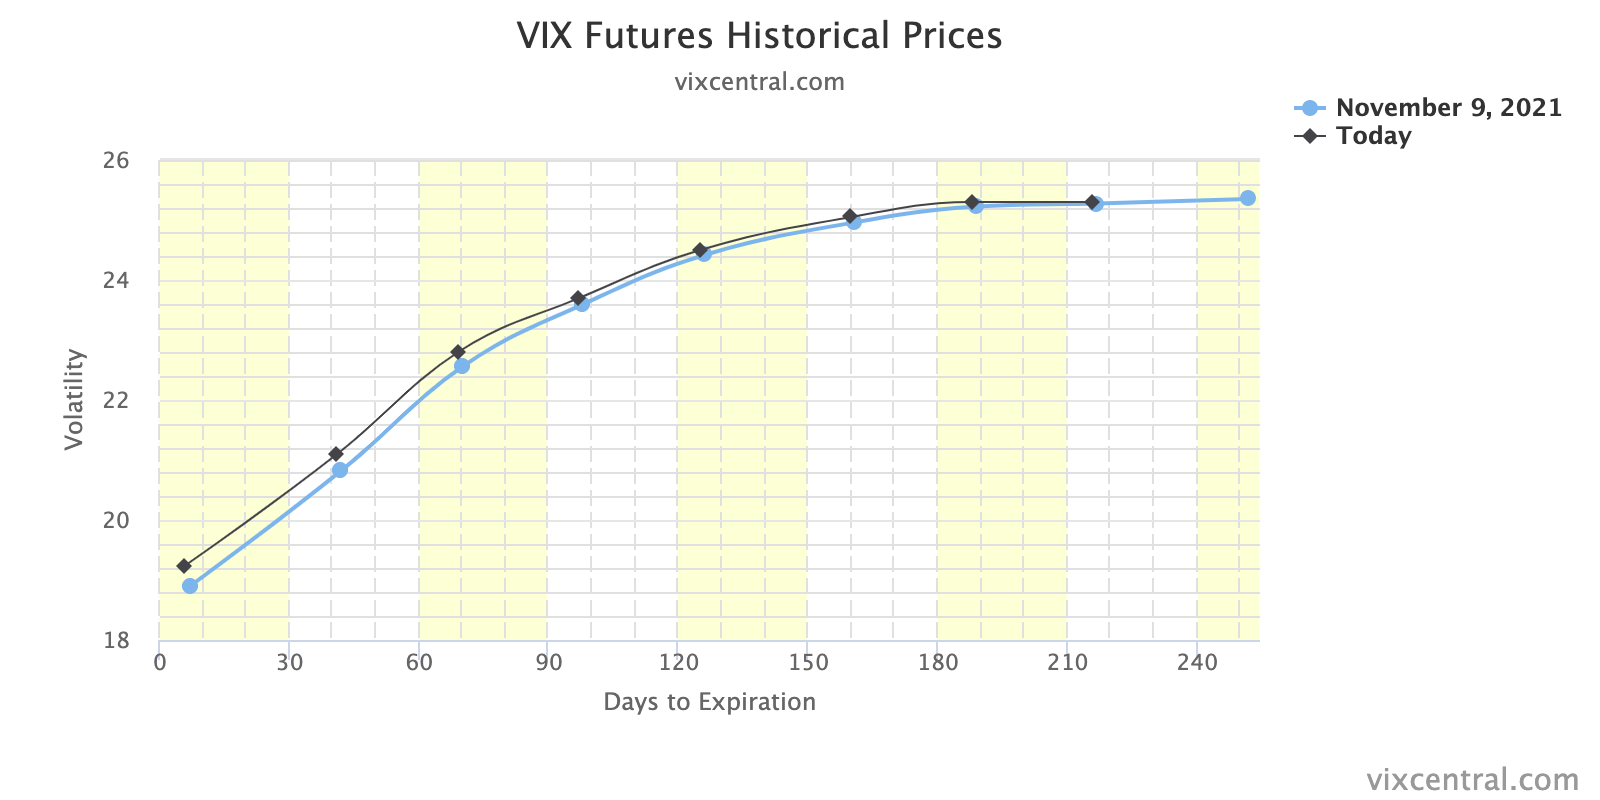
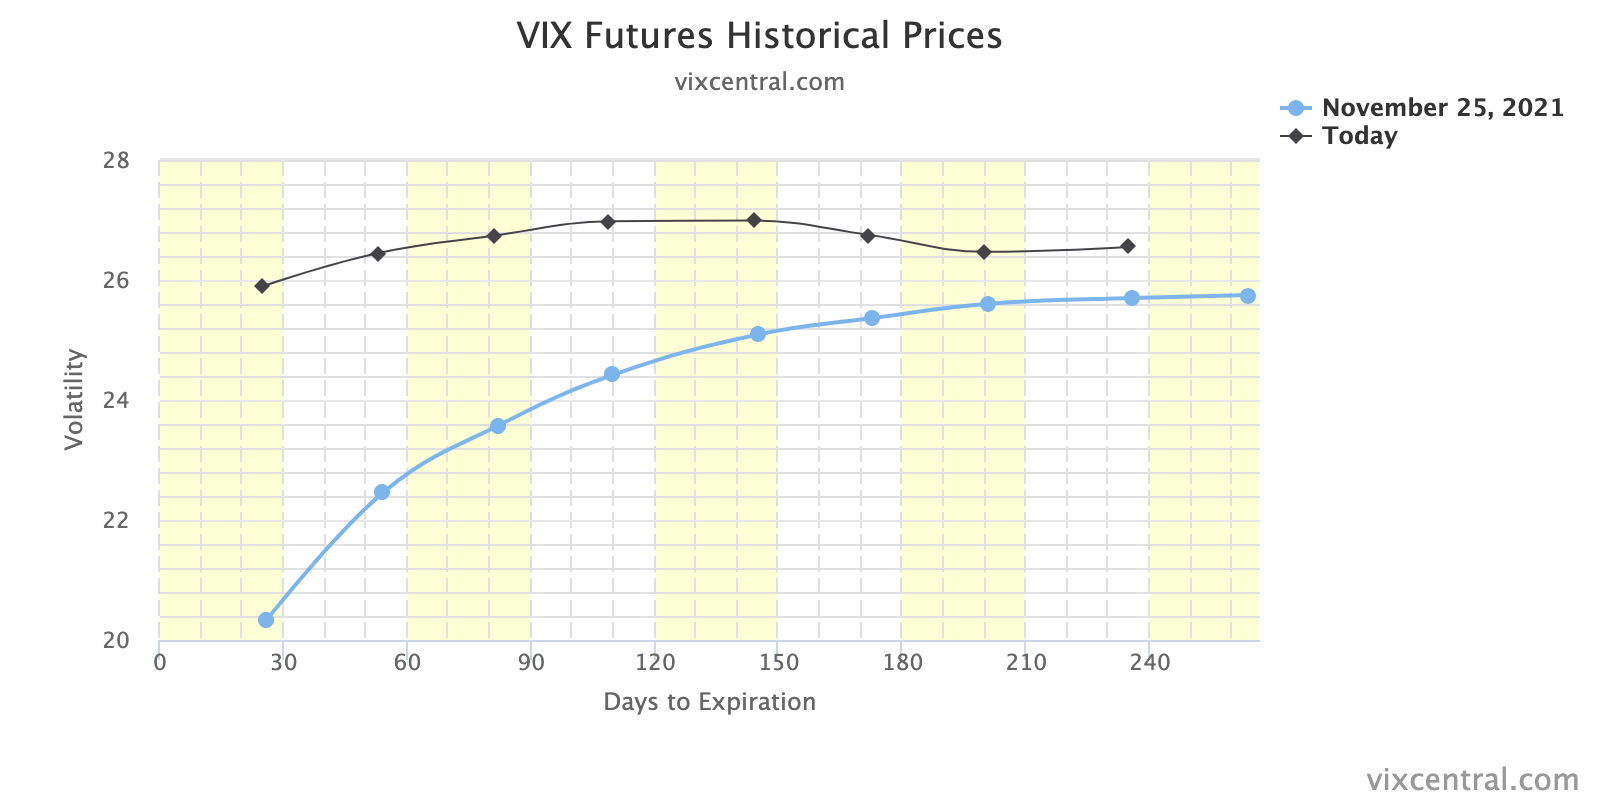
At the same time, the CBOE Volatility Index (INDEX: VIX) closed up nearly 50% while the VIX futures term structure settled in backwardation amidst a re-pricing of tail-risk, so to speak.
Moreover, ahead is data on Pending Home Sales (10:00 AM ET).
What To Expect
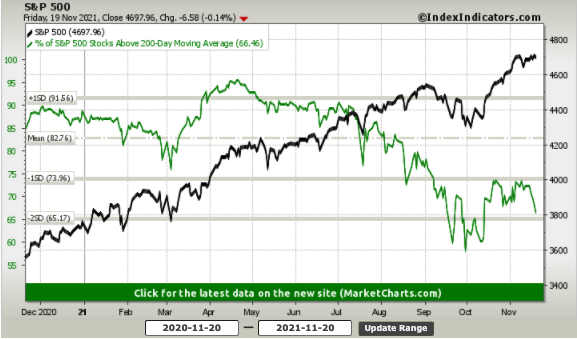
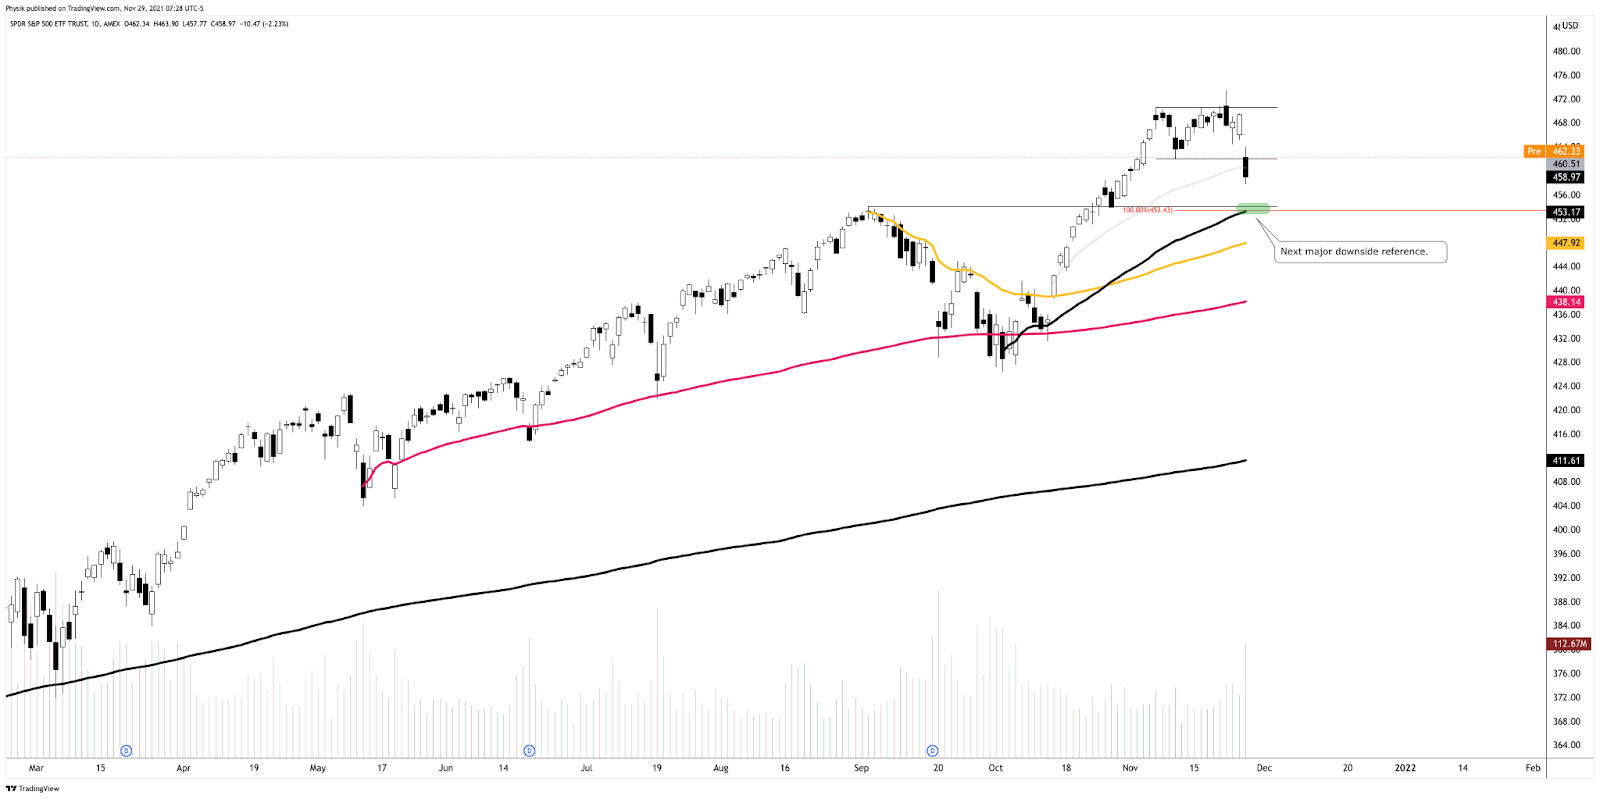
Despite the lackluster intraday breadth and divergent market liquidity metrics, the worst-case outcome occurred, Friday, evidenced by downside expansion of range and separation of value.
Coming into the session, the experiences associated with ‘Volmageddon’ came to mind; the VIX was up nearly 40.00%, a concern given the exuberance of past weeks and options positioning, as well as a decline in correlations, and unsupportive breadth.
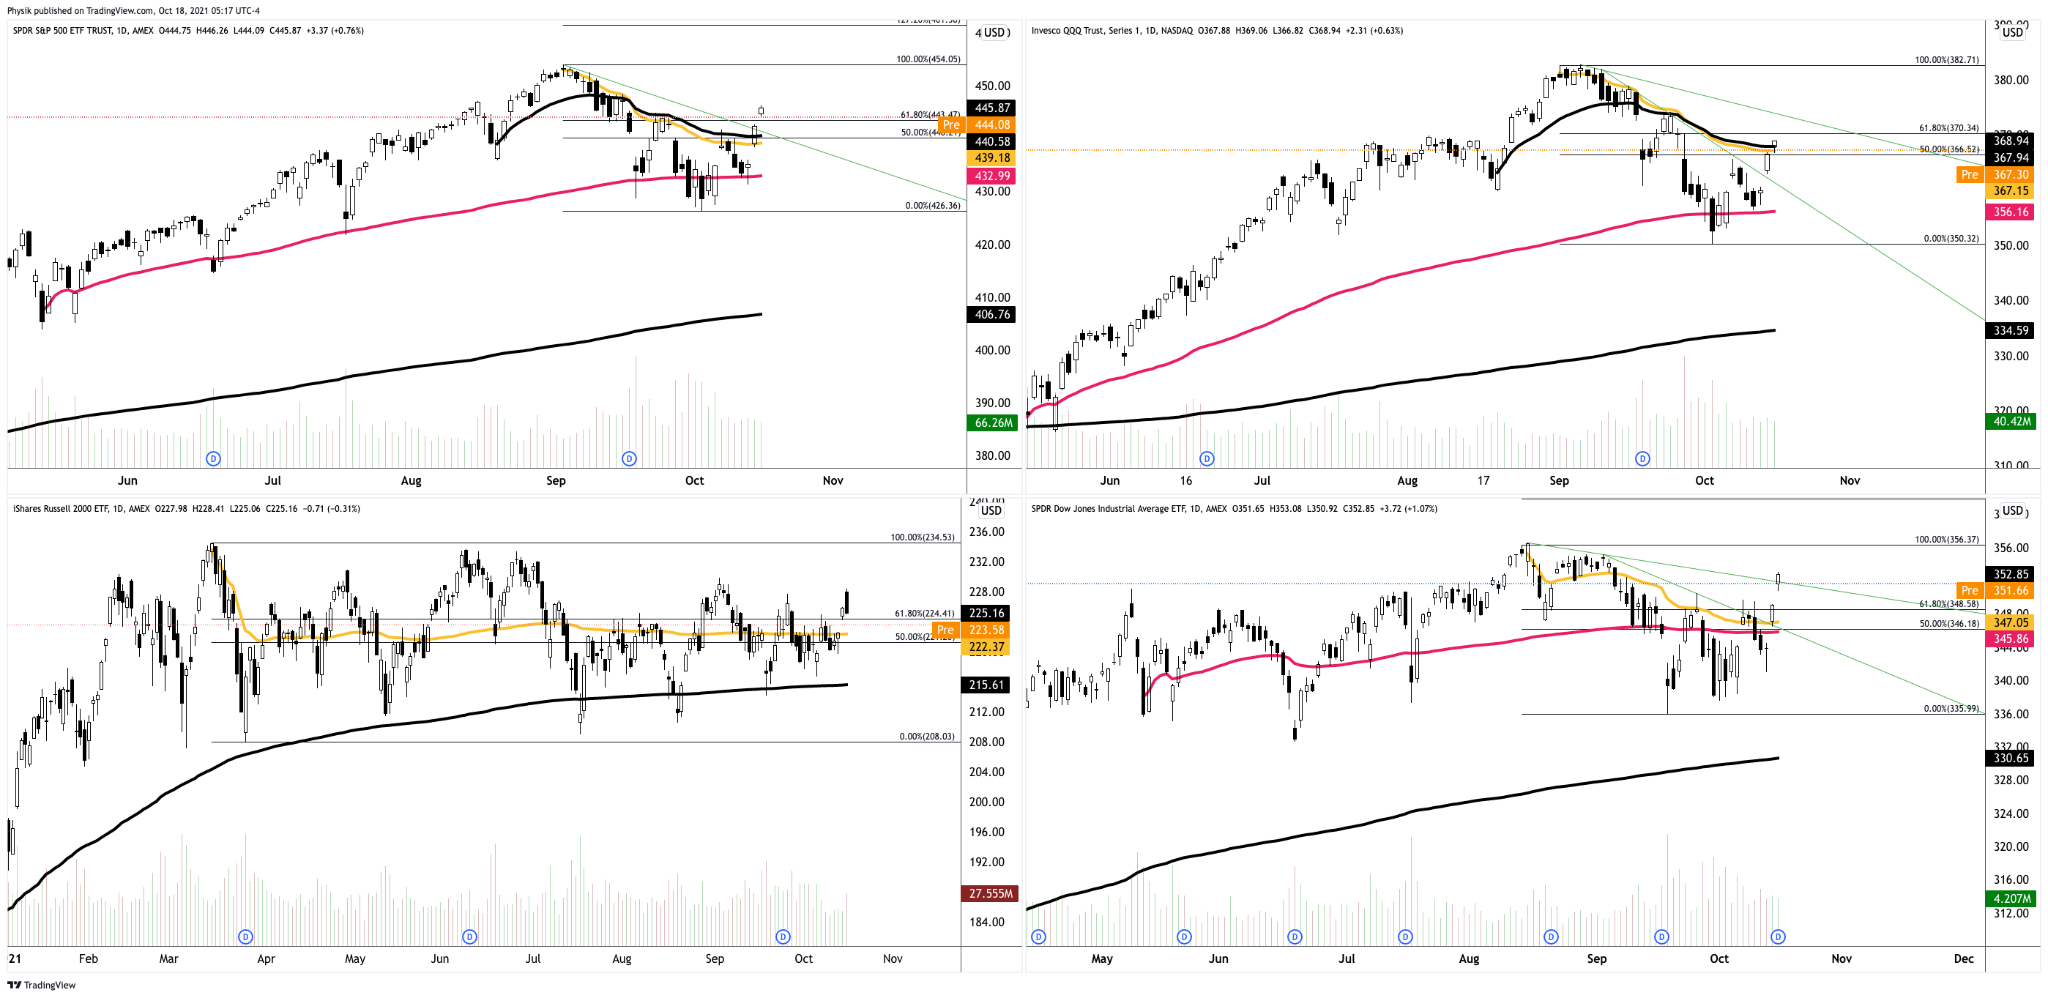
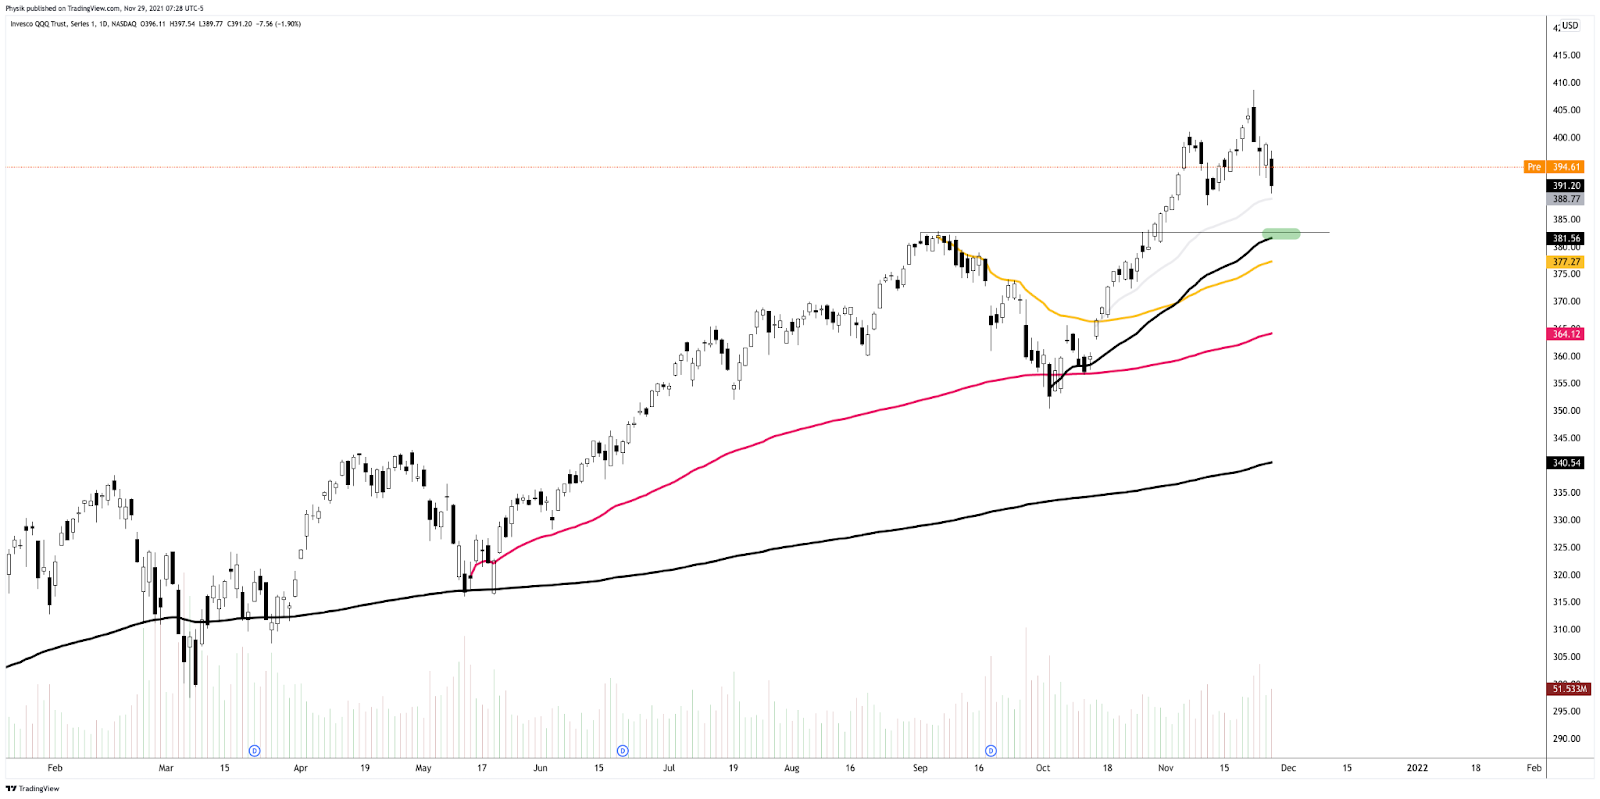
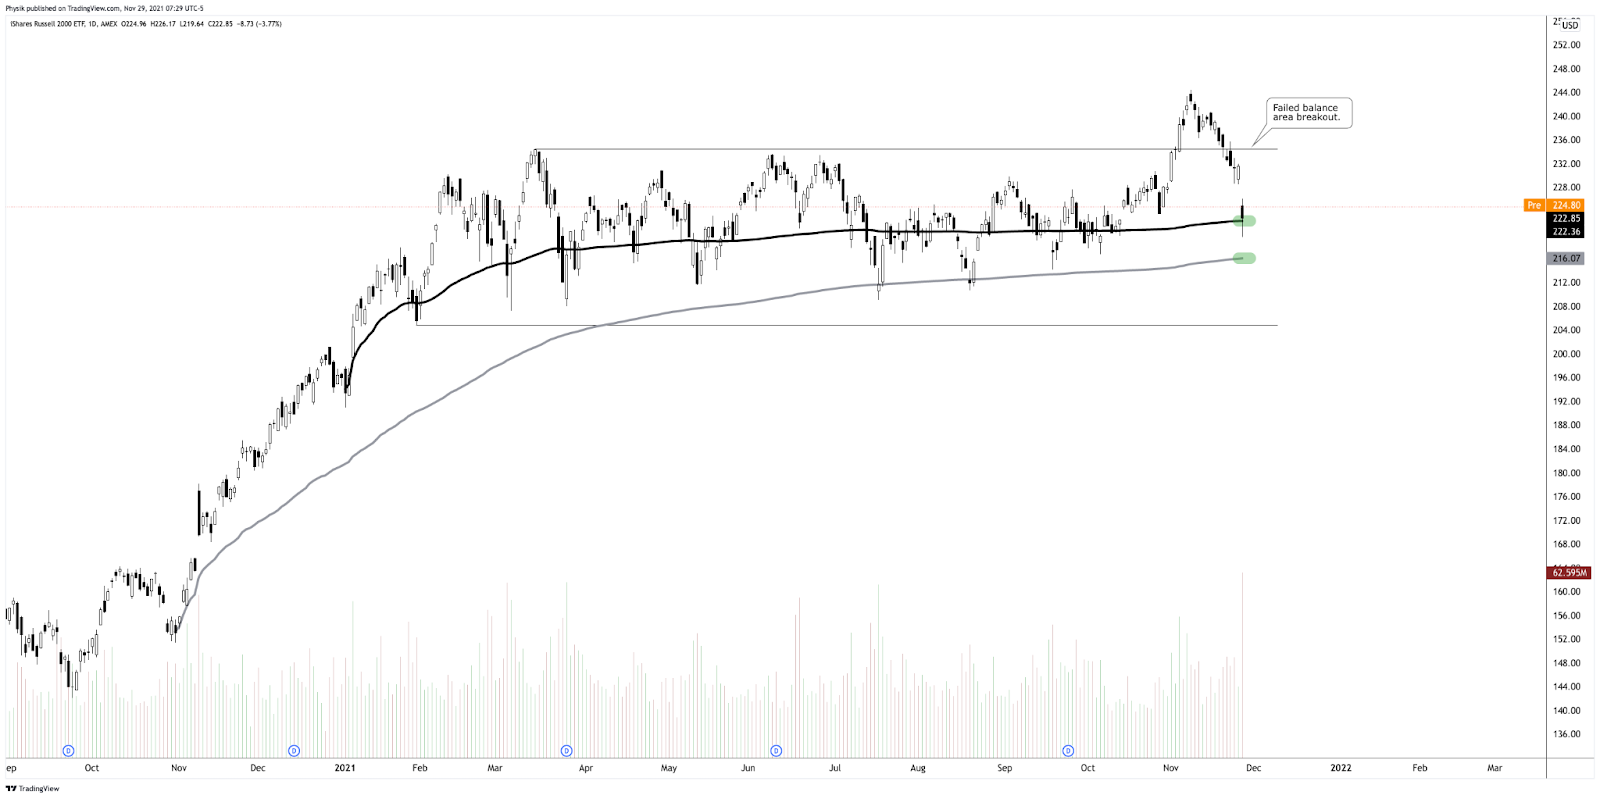
Tempering the fall were divergences; the Russell 2000 was down nearly 4.00% before Friday’s U.S. open while the S&P 500 was off about 2.00% or so, buoyed by the Nasdaq 100 which was only down about 1.00% amidst an 8% dip in the ten-year yield.
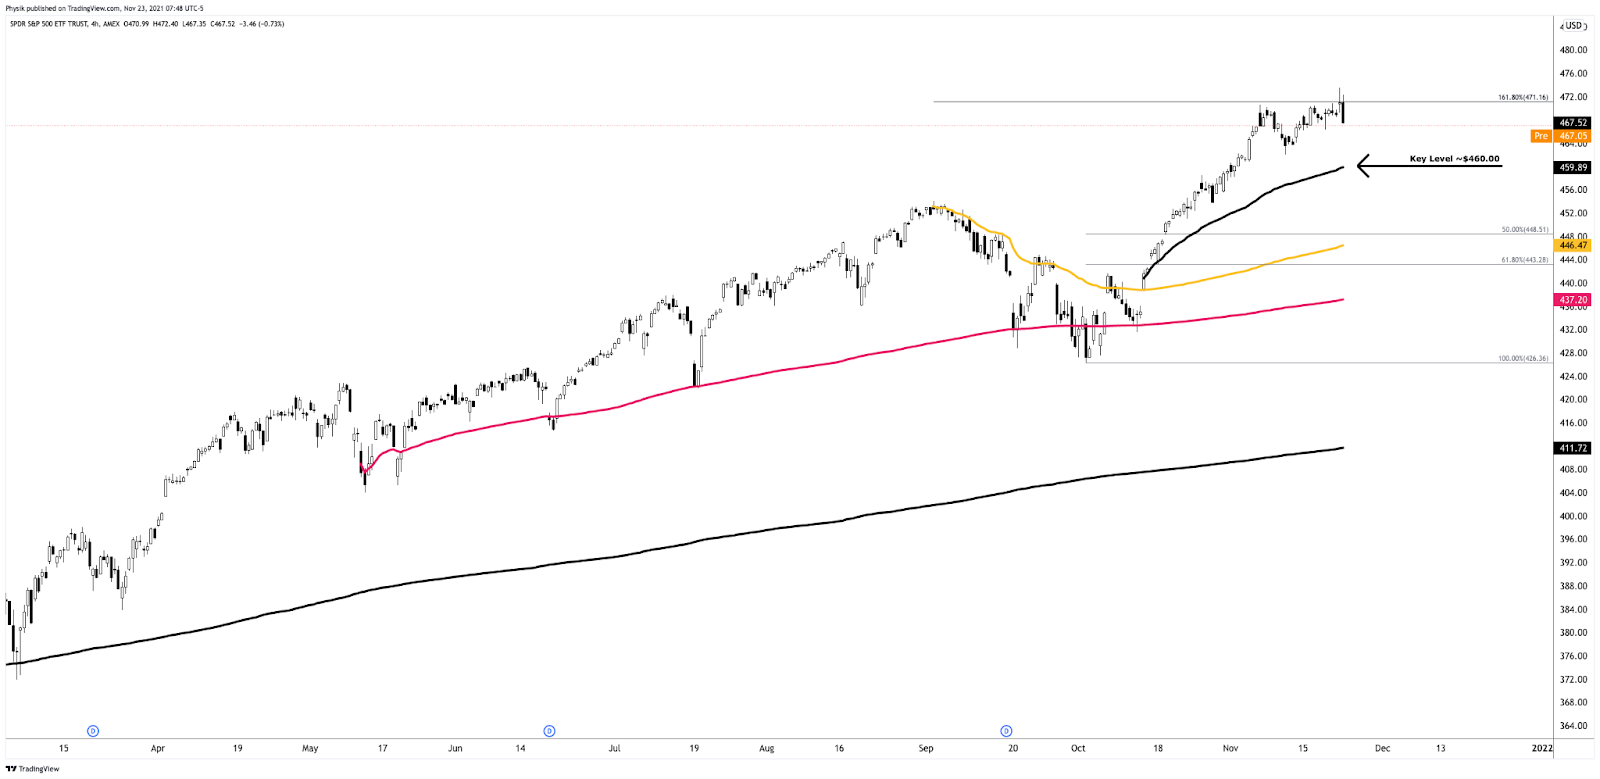
The divergence persisted with the S&P 500 closing firmly below its 20-day simple moving average, a visual level often acted on by short-term, technically-driven participants who generally are unable to defend retests.
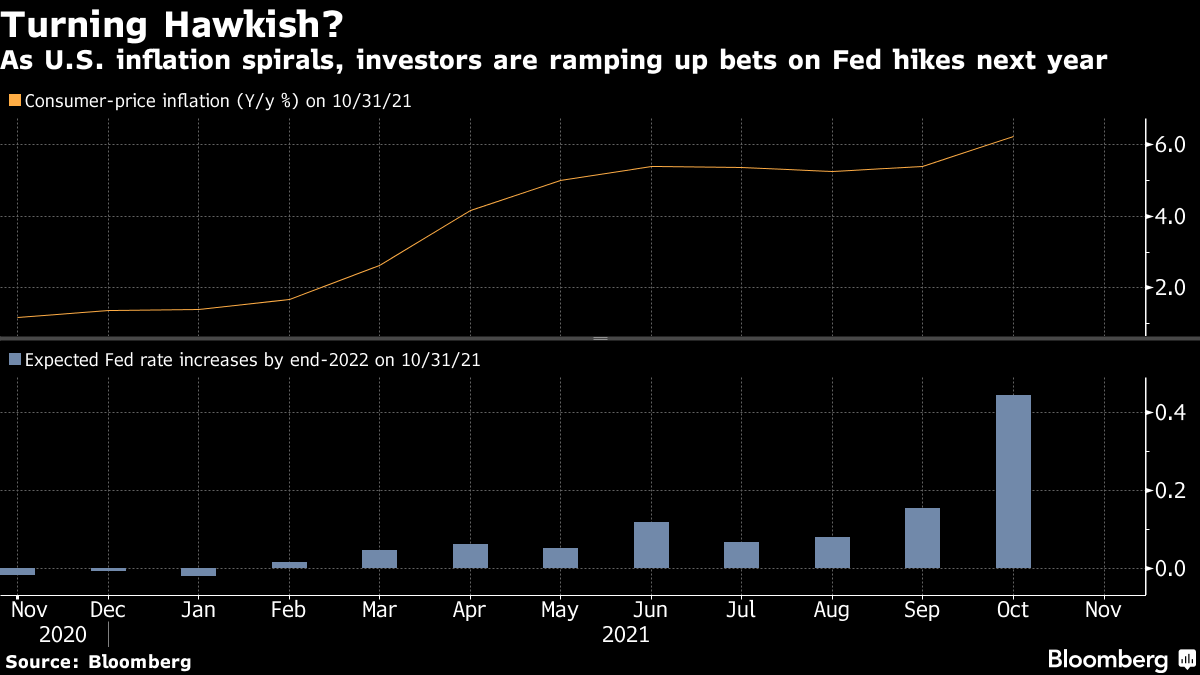
Context: A resurgence in the COVID-19 coronavirus as an improvement in macroeconomic conditions prompts a hawkish shift from the Federal Reserve (Fed).
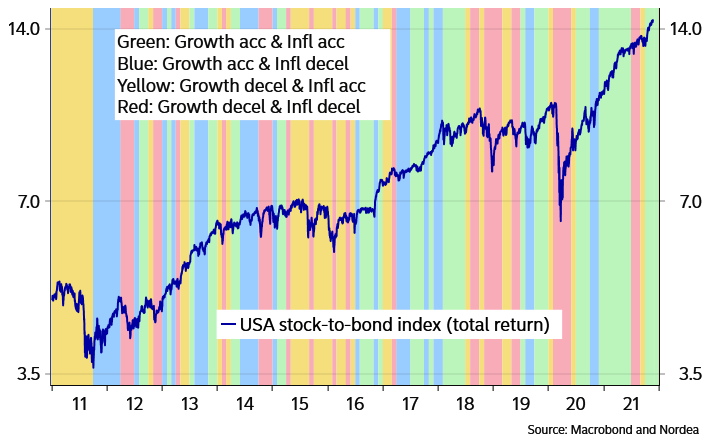
“Many risky asset tailwinds in 2021 are turning into at least mild headwinds in 2022,” Nordea says. “Economic growth should decelerate, liquidity conditions are deteriorating, profit margins should be under pressure from rising costs and question marks regarding the Fed/ECB put will arise due to elevated inflation indicators. To us, this spells higher volatility.”
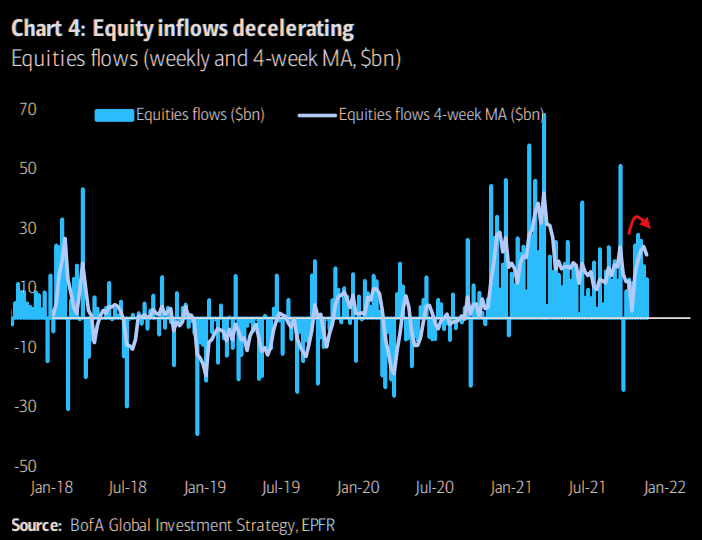
Moreover, for the past two years, almost, equities rallied amidst an acceleration in growth, which is typically correlated with equity outperformance over bonds.
At the same time, there’s been an insatiable appetite for stocks, according to Bloomberg, with investors pouring “almost $900 billion into equity exchange-traded and long-only funds in 2021 — exceeding the combined total from the past 19 years.”
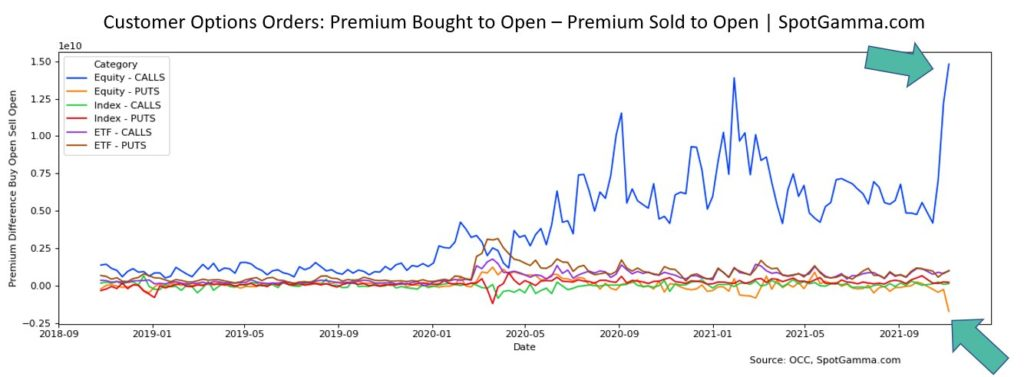
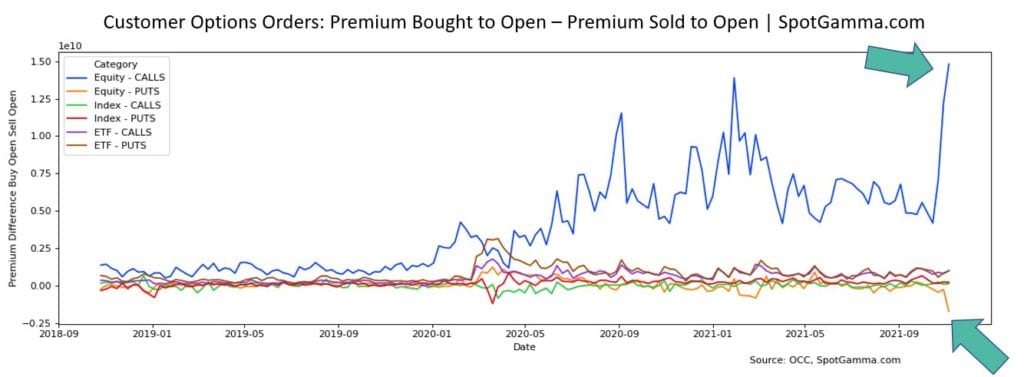
This appetite for risk fed into the activity of some high-flyers like Tesla Inc (NASDAQ: TSLA) with customers, at least in the past weeks, opting to aggressively sell puts and buy calls heading into the November monthly options expiration (OPEX).
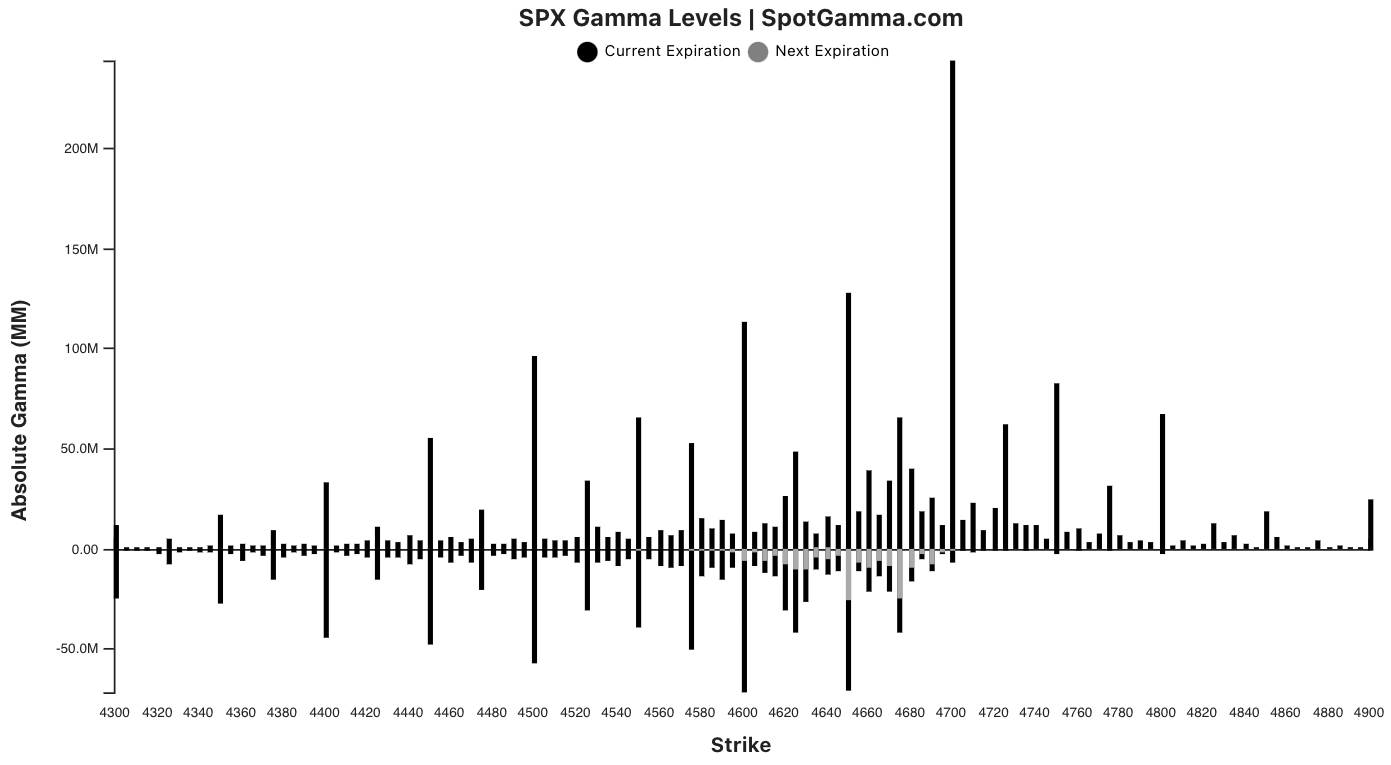
Unfortunately, (1) after OPEX, the absence of sticky and supportive hedging flows freed the broader market for directional resolve, and (2) according to SpotGamma, in light of recent exuberance, “participants [were] underexposed to downside put protection.”
What this meant was that after OPEX’s unpinning and increase in correlation, fundamental contexts were to matter more.
Therefore, the Fed’s “increased openness to accelerat[e] the taper pace” and hike rates, alongside fresh travel restrictions on a new COVID-19 variant, as well as holiday illiquidity, resulted in a rough re-pricing of tail risk as participants sought after those highly “convex” options which had counterparties exacerbating underlying price movement.
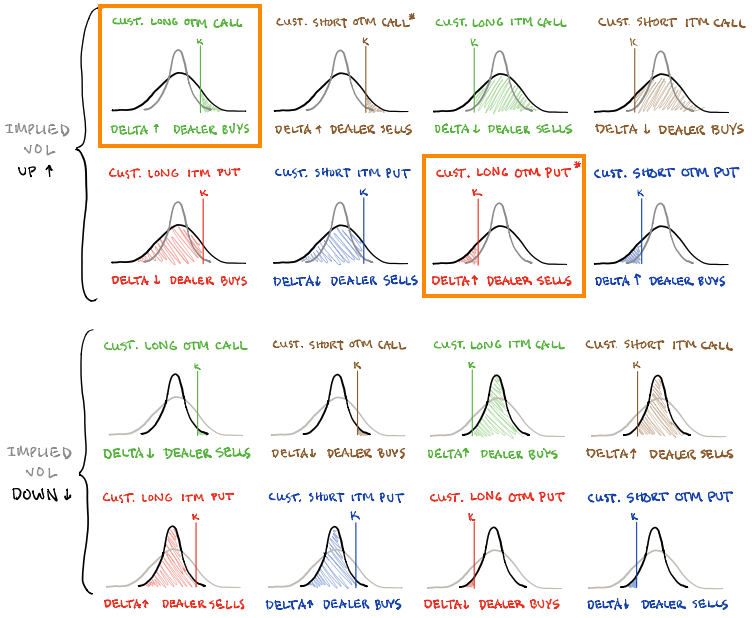
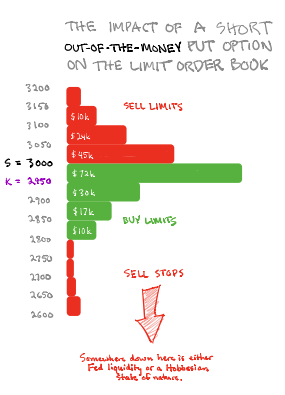
To elaborate, in short, was volatility to pick up, those participants (who were once exuberant) were likely to reach for protection forcing dealers to reflexively hedge in a destabilizing manner.
Dealers is the term used to describe those participants that take the other side and warehouse customer options risk, at least in the case where orders can’t be matched between customers.
With that, as volatility rose and customers demanded protection, counterparties hedged by selling into weakness. The conditions worsened when much of the activity was concentrated in shorter-dated tenors where the sensitivity of options to direction is higher if we will.
Once that short-dated protection rolls off the table (and/or is monetized), dealers will reverse and support the market, buying to close their existing stock/futures hedges.
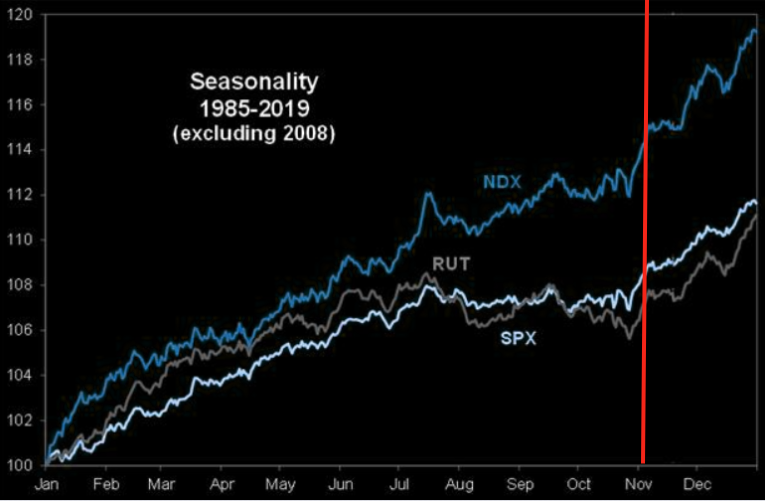
This flow is stabilizing and may play into a seasonally-aligned rally into Christmas as participants see defenses rolled out against the new COVID-19 variant, and the positive effects of pro-cyclical inflation and economic growth, improvements in global trade, and continuity at the Fed, among other dynamics, play out.
We see participants opportunistically buying the dip, already, via metrics like DIX that’s derived from liquidity provision on the market-making side.
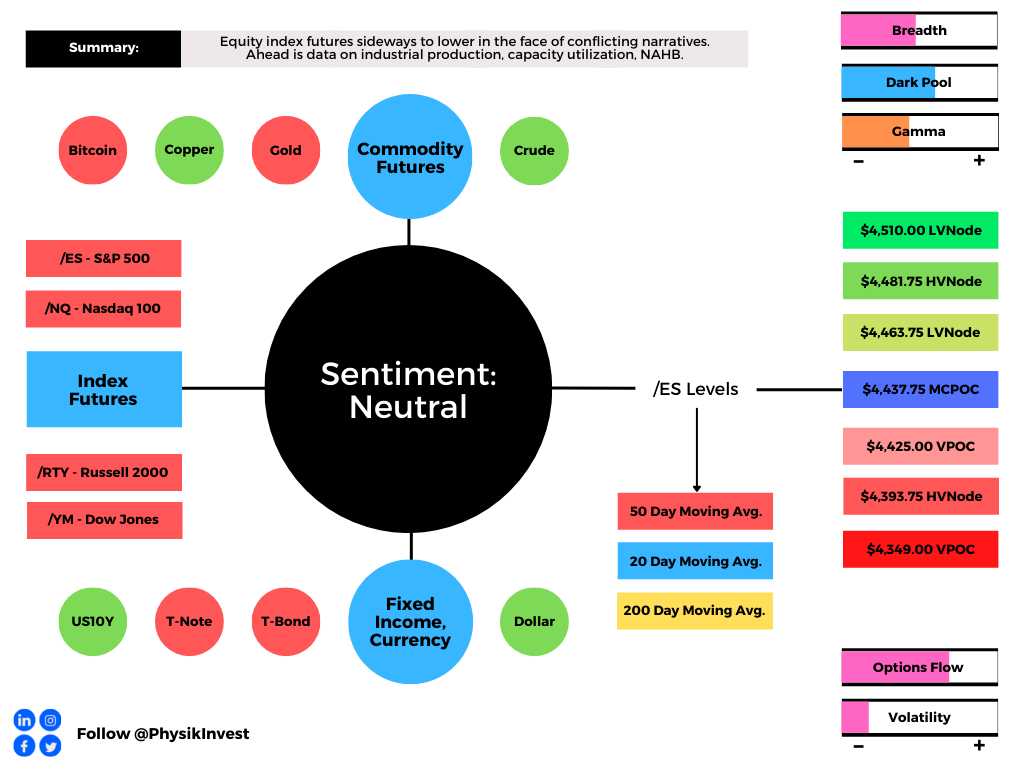
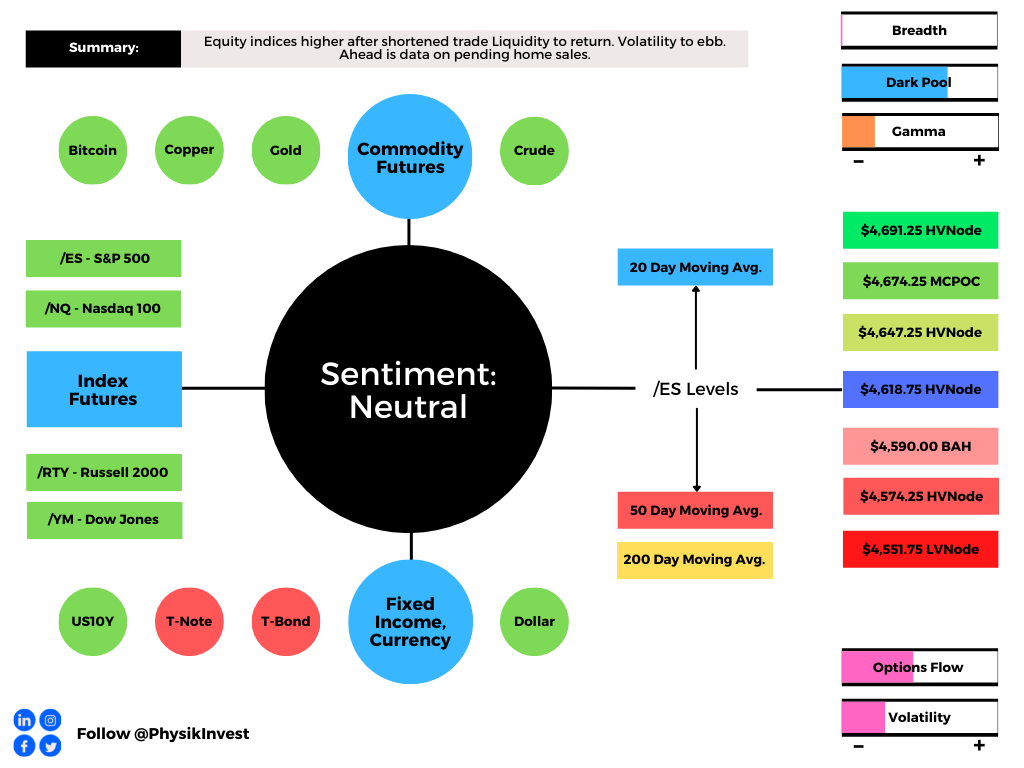
Expectations: As of 6:00 AM ET, Monday’s regular session (9:30 AM – 4:00 PM ET), in the S&P 500, will likely open in the middle part of a positively skewed overnight inventory, inside of prior-range and -value, suggesting a limited potential for immediate directional opportunity.
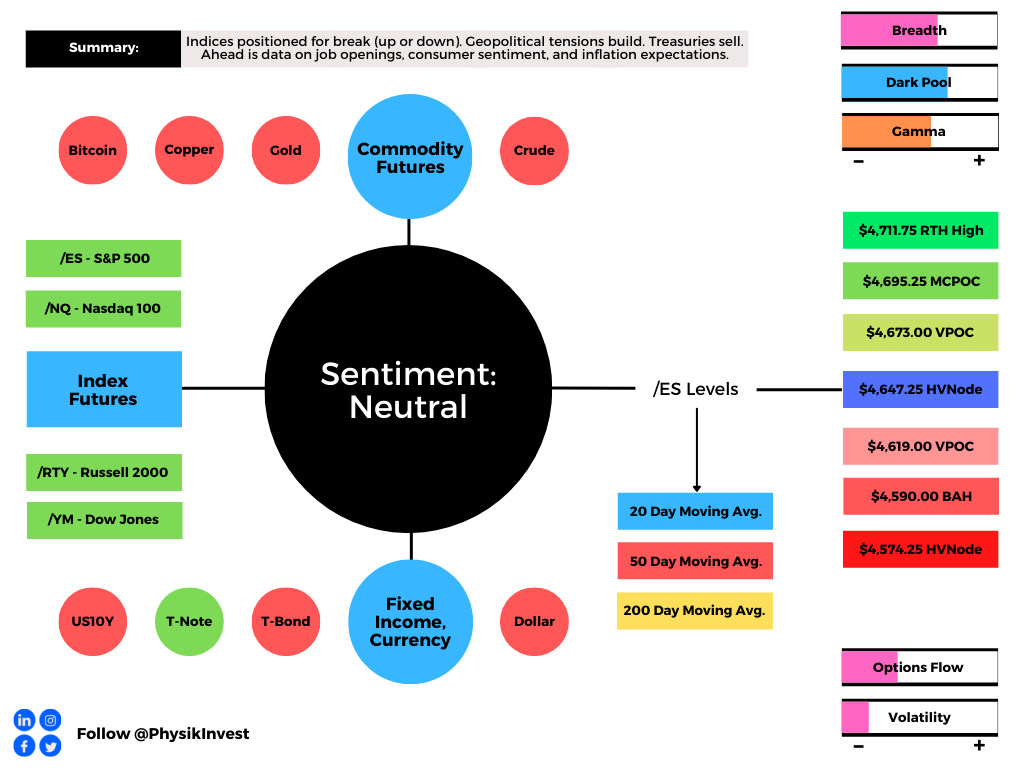
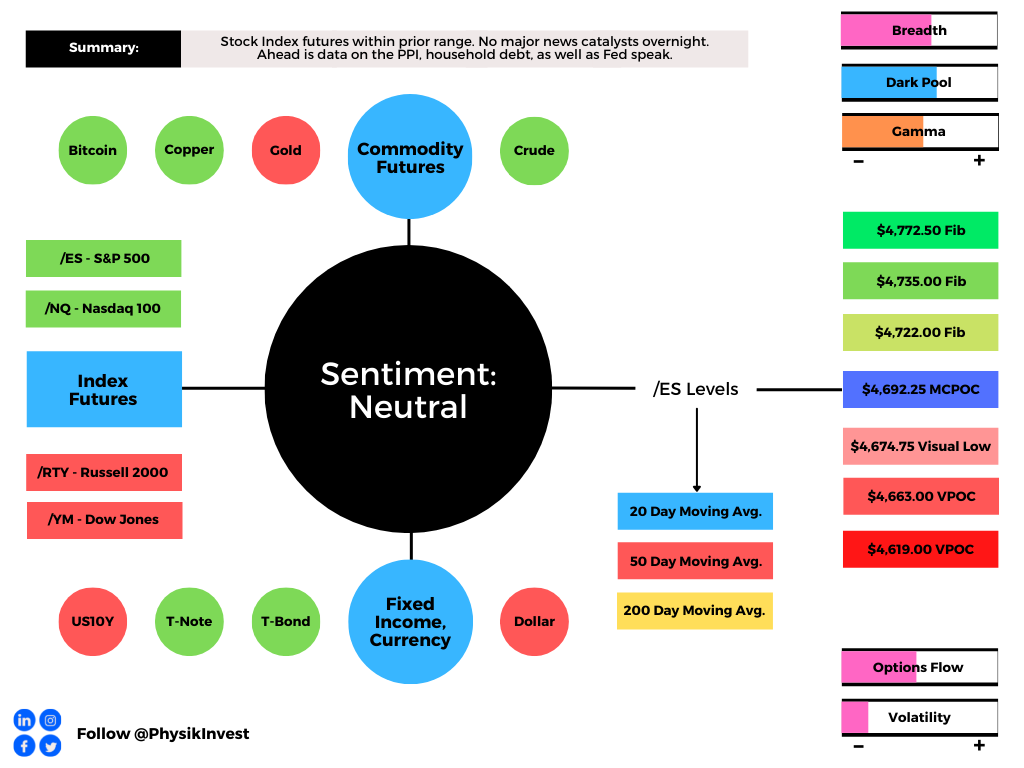
In the best case, the S&P 500 trades sideways or higher; activity above the $4,618.75 high volume area (HVNode) puts in play the $4,647.25 HVNode. Initiative trade beyond the latter HVNode could reach as high as the $4,674.25 micro composite point of control (MCPOC) and $4,691.25 HVNode, or higher.
In the worst case, the S&P 500 trades lower; activity below the $4,618.75 HVNode puts in play the $4,590.00 balance boundary (BAH). Initiative trade beyond the BAH could reach as low as the $4,574.25 HVNode and $4,551.75 LVNode, or lower.
Click here to load today’s updated key levels into the web-based TradingView charting platform. Note that all levels are derived using the 65-minute timeframe. New links are produced, daily.

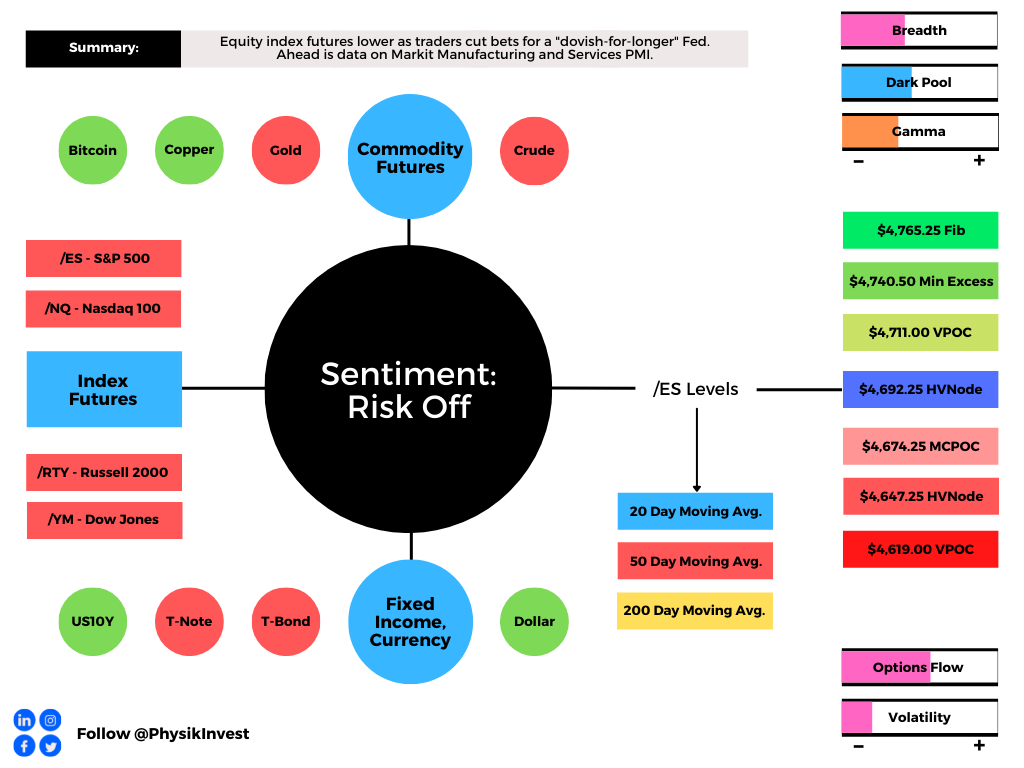
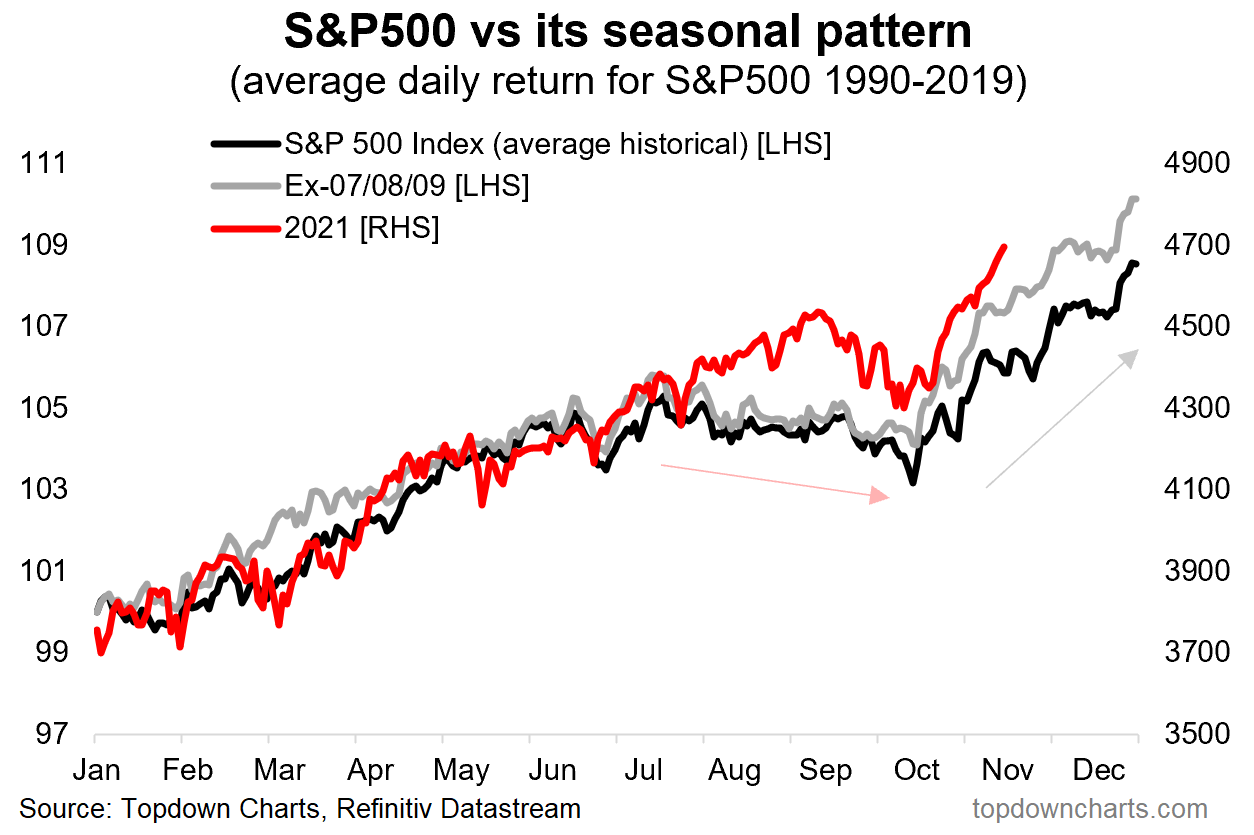
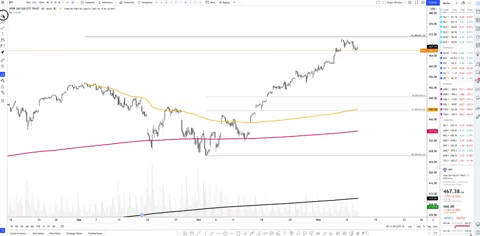
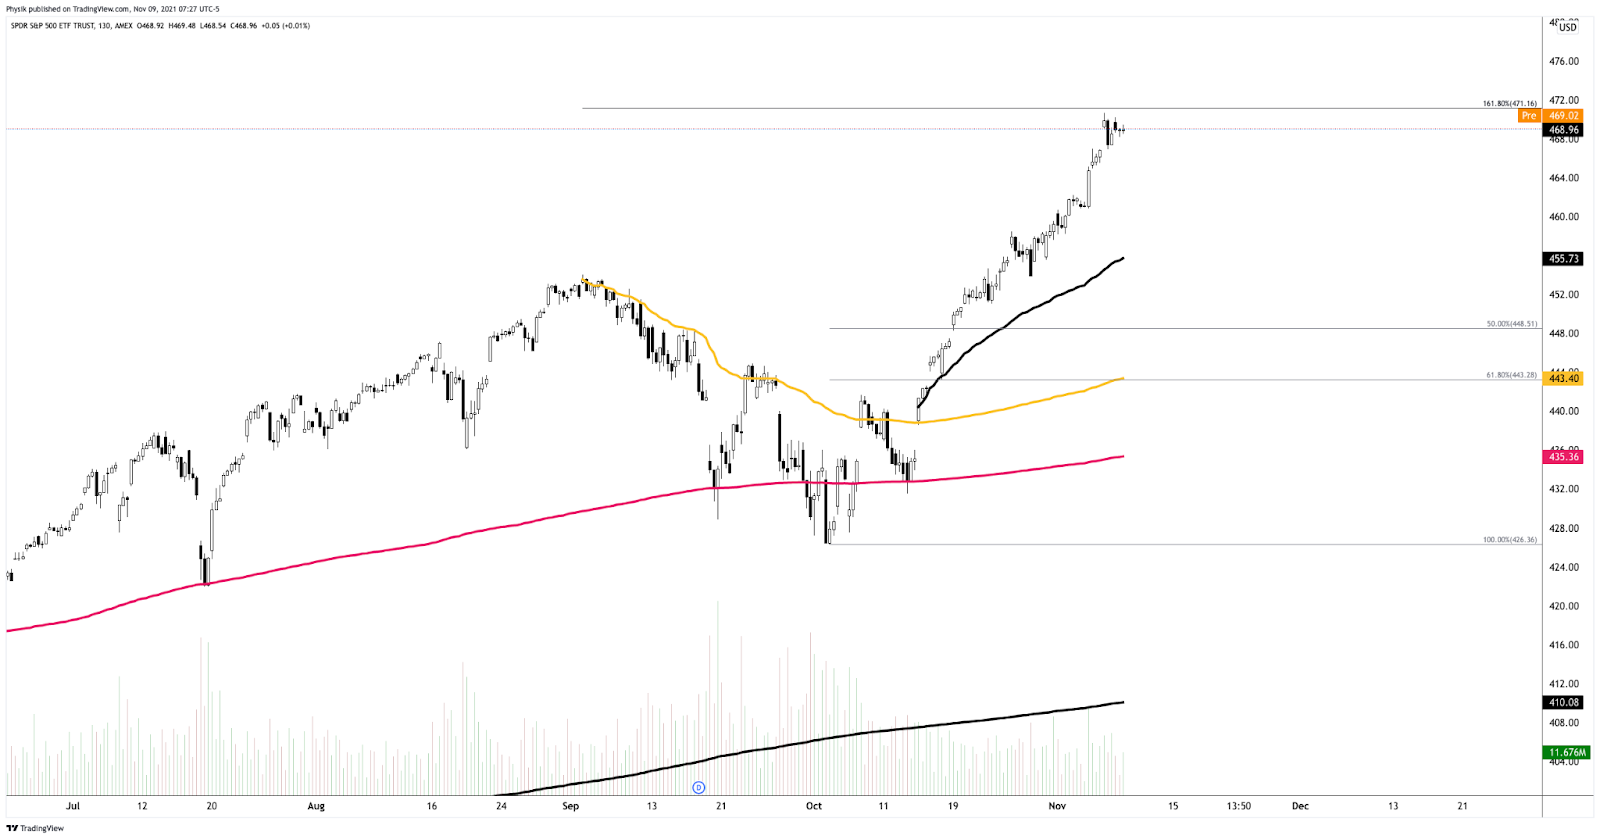
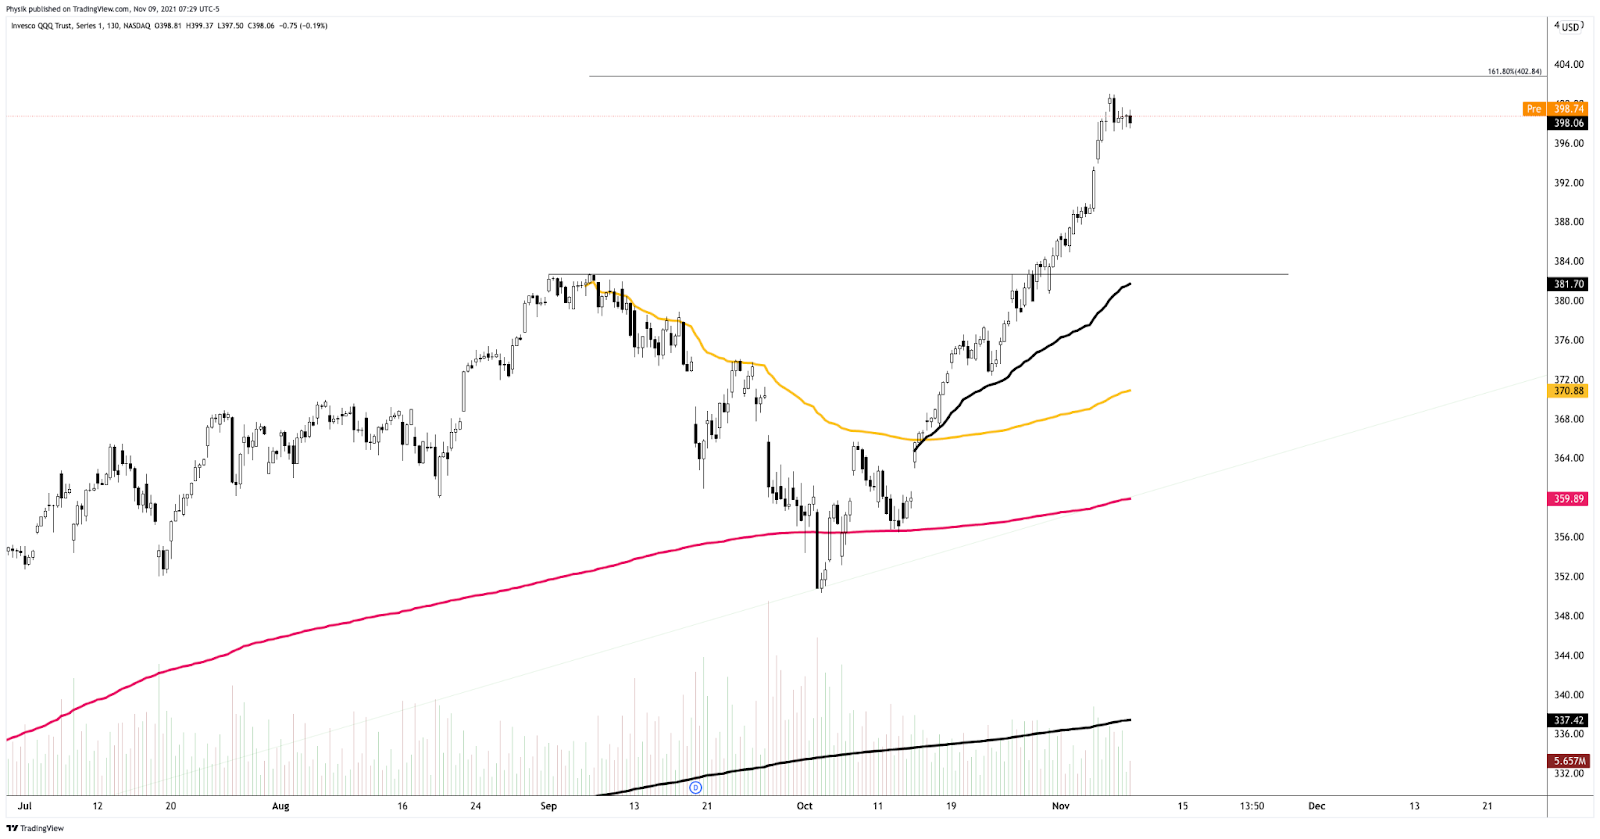
Charts To Watch
What People Are Saying
Definitions
Overnight Rally Highs (Lows): Typically, there is a low historical probability associated with overnight rally-highs (lows) ending the upside (downside) discovery process.
Volume Areas: A structurally sound market will build on areas of high volume (HVNodes). Should the market trend for long periods of time, it will lack sound structure, identified as low volume areas (LVNodes). LVNodes denote directional conviction and ought to offer support on any test.
If participants were to auction and find acceptance into areas of prior low volume (LVNodes), then future discovery ought to be volatile and quick as participants look to HVNodes for favorable entry or exit.
Gamma: Gamma is the sensitivity of an option to changes in the underlying price. Dealers that take the other side of options trades hedge their exposure to risk by buying and selling the underlying. When dealers are short-gamma, they hedge by buying into strength and selling into weakness. When dealers are long-gamma, they hedge by selling into strength and buying into weakness. The former exacerbates volatility. The latter calms volatility.
POCs: POCs are valuable as they denote areas where two-sided trade was most prevalent in a prior day session. Participants will respond to future tests of value as they offer favorable entry and exit.
MCPOCs: POCs are valuable as they denote areas where two-sided trade was most prevalent over numerous day sessions. Participants will respond to future tests of value as they offer favorable entry and exit.
Options Expiration (OPEX): Traditionally, option expiries mark an end to pinning (i.e, the theory that market makers and institutions short options move stocks to the point where the greatest dollar value of contracts will expire) and the reduction dealer gamma exposure.
Rates: Low rates have to potential to increase the present value of future earnings making stocks, especially those that are high growth, more attractive. To note, inflation and rates move inversely to each other. Low rates stimulate demand for loans (i.e., borrowing money is more attractive).
About
After years of self-education, strategy development, and trial-and-error, Renato Leonard Capelj began trading full-time and founded Physik Invest to detail his methods, research, and performance in the markets.
Additionally, Capelj is a Benzinga finance and technology reporter interviewing the likes of Shark Tank’s Kevin O’Leary, JC2 Ventures’ John Chambers, and ARK Invest’s Catherine Wood, as well as a SpotGamma contributor, developing insights around impactful options market dynamics.
Disclaimer
At this time, Physik Invest does not manage outside capital and is not licensed. In no way should the materials herein be construed as advice. Derivatives carry a substantial risk of loss. All content is for informational purposes only.