
The daily brief is a free glimpse into the prevailing fundamental and technical drivers of U.S. equity market products. Join the 1,200+ that read this report daily, below!
Administrative
A light letter. We’ll go into far more detail to start next week. See you, then!
Positioning
Assets rallied following a downside surprise in figures for headline annual inflation. Some policymakers also expressed a view that the pace of rate hikes could slow.
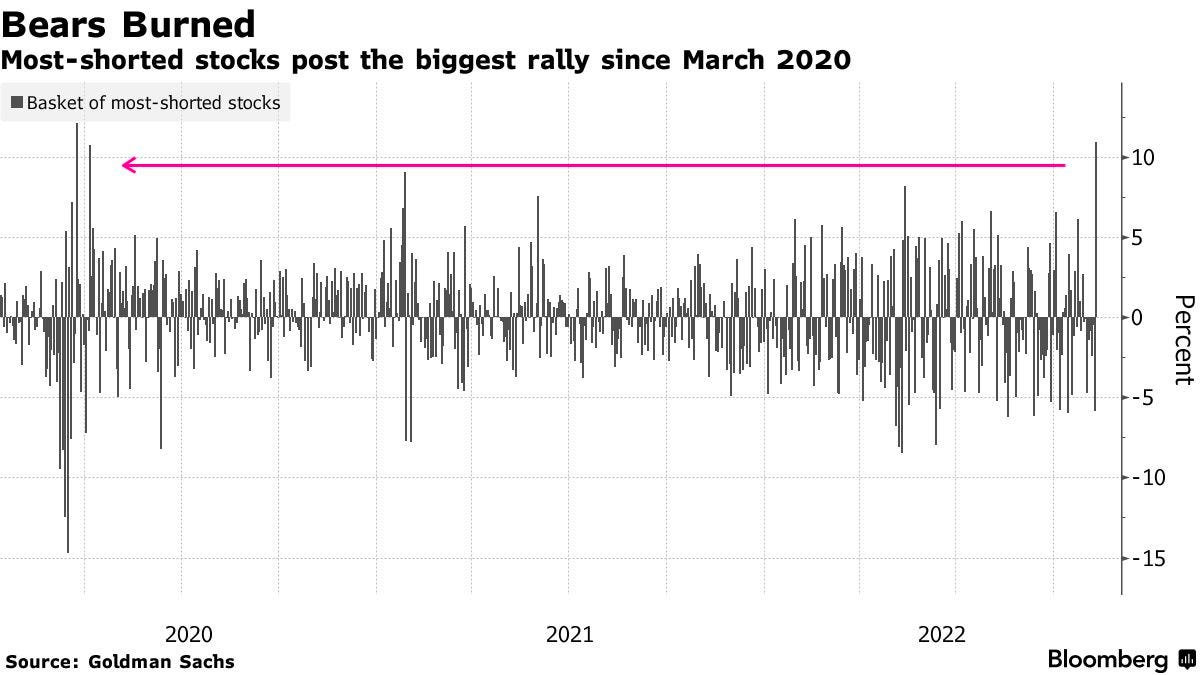
Barring the worst case, the stage was set for relief. Traders sought protection, as evidenced by a persistent bid in implied volatility (IVOL), which compounded the pressures of de-grossing.
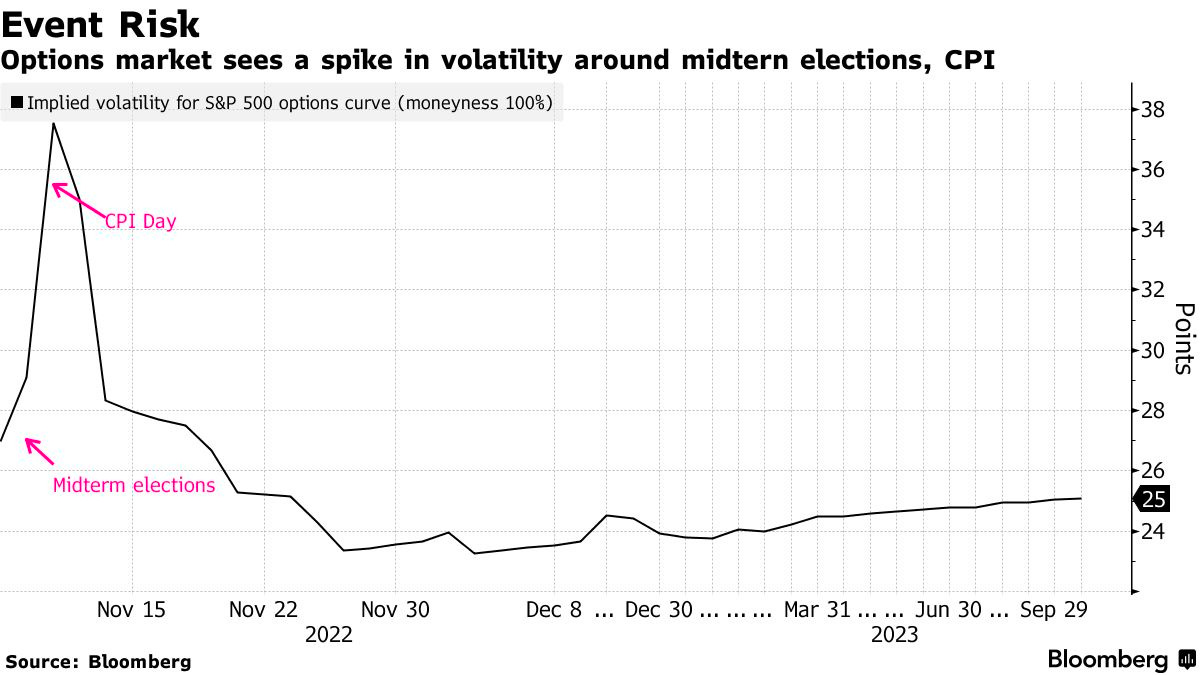
There was a “clustering of vol[atility] demand to hedge” elections and CPI, per Kai Volatility’s Cem Karsan. On the back of that, “the potential Vanna flows that [would] come from these events” are very positive.
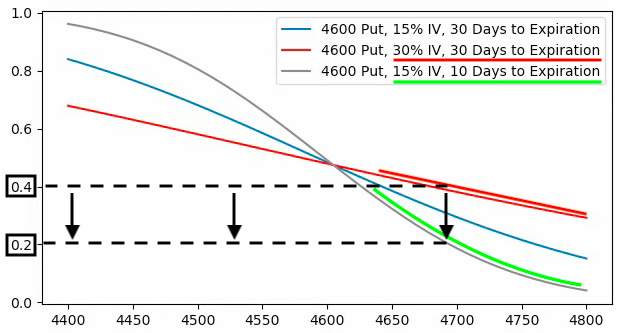
Per SpotGamma, when “nothing bad happen[ed], and traders close[d] those puts, that … bolster[ed] [upside].”
Karsan adds the market is entering a period during which there’s less liquidity to absorb decaying protection with respect to time (Charm).
This may drive (bullish) seasonality.
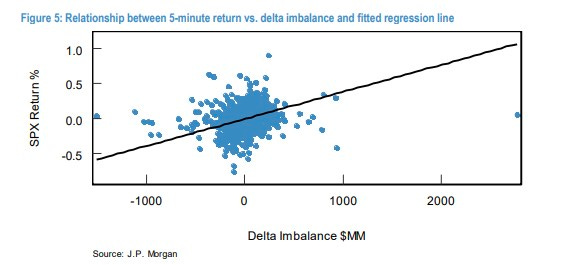
Risks are brewing, though. The very poor hedging heading into this next rally may set the stage for a violent downside. Traders not well-hedged may seek protection when something bad happens, and this will compound macro-type sales, particularly if the activity is in options with less time to expiration (note the below graphic).
Technical
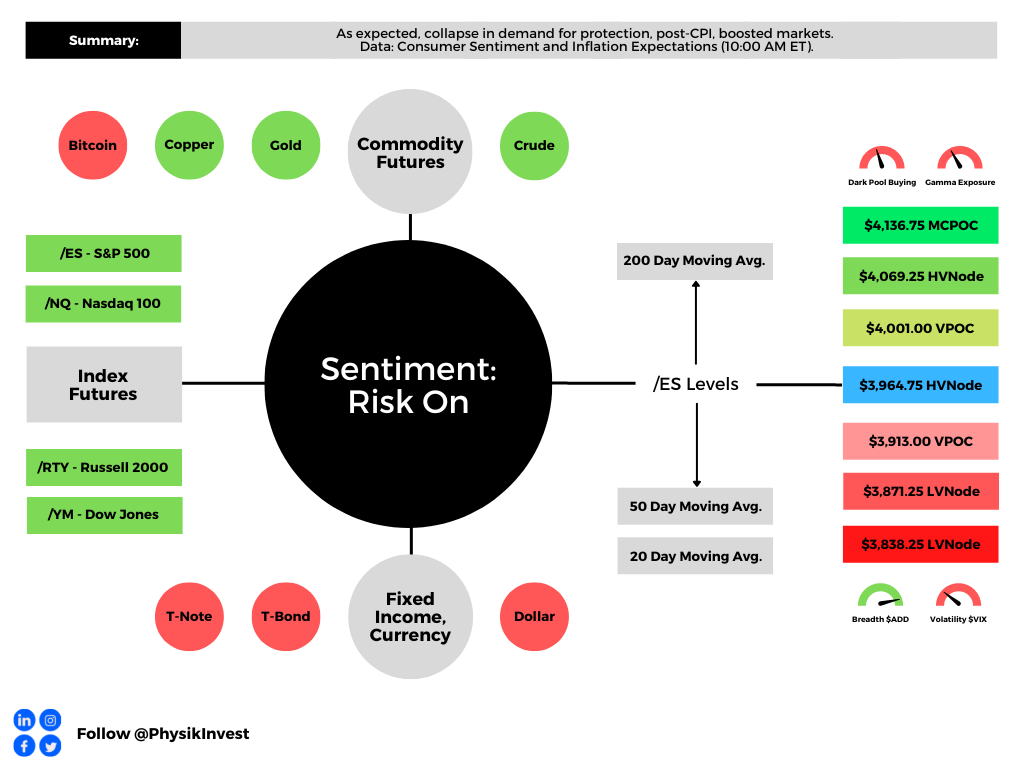
As of 7:45 AM ET, Friday’s regular session (9:30 AM – 4:00 PM ET), in the S&P 500, is likely to open in the middle part of a positively skewed overnight inventory, outside of prior-range and -value, suggesting a potential for immediate directional opportunity.
In the best case, the S&P 500 trades higher.
Any activity above the $3,964.75 HVNode puts into play the $4,001.00 VPOC. Initiative trade beyond the VPOC could reach as high as the $4,069.25 HVNode and $4,136.75 MCPOC, or higher.
In the worst case, the S&P 500 trades lower.
Any activity below the $3,964.75 HVNode puts into play the $3,913.00 VPOC. Initiative trade beyond the VPOC could reach as low as the $3,871.25 and $3,838.25 LVNode, or lower.
Click here to load today’s key levels into the web-based TradingView charting platform. Note that all levels are derived using the 65-minute timeframe. New links are produced, daily.

Definitions
Volume Areas: A structurally sound market builds on high-volume (HVNodes) areas.
Should the market trend for long periods of time, it will lack sound structure, identified as low-volume areas (LVNodes). LVNodes denote directional conviction and ought to offer support on any test.
If participants were to auction and find acceptance into areas of low volume, then future discovery ought to be volatile and quick as participants look to HVNodes for favorable entry or exit.
POCs: POCs are valuable as they denote areas where two-sided trade was most prevalent in a prior day session. Participants will respond to future tests of value as they offer favorable entry and exit.
MCPOCs: POCs are valuable as they denote areas where two-sided trade was most prevalent over numerous day sessions. Participants will respond to future tests of value as they offer favorable entry and exit.
About
After years of self-education, strategy development, mentorship, and trial-and-error, Renato Leonard Capelj began trading full-time and founded Physik Invest to detail his methods, research, and performance in the markets.
Capelj also develops insights around impactful options market dynamics at SpotGamma and is a Benzinga reporter.
Some of his works include conversations with ARK Invest’s Catherine Wood, investors Kevin O’Leary and John Chambers, FTX’s Sam Bankman-Fried, ex-Bridgewater Associate Andy Constan, Kai Volatility’s Cem Karsan, The Ambrus Group’s Kris Sidial, among many others.
Disclaimer
In no way should the materials herein be construed as advice. Derivatives carry a substantial risk of loss. All content is for informational purposes only.


