
Physik Invest’s Daily Brief is read by thousands of subscribers. You, too, can join this community to learn about the fundamental and technical drivers of markets.
Positioning
Traders may have observed a unique market dynamic occurring in the past sessions.
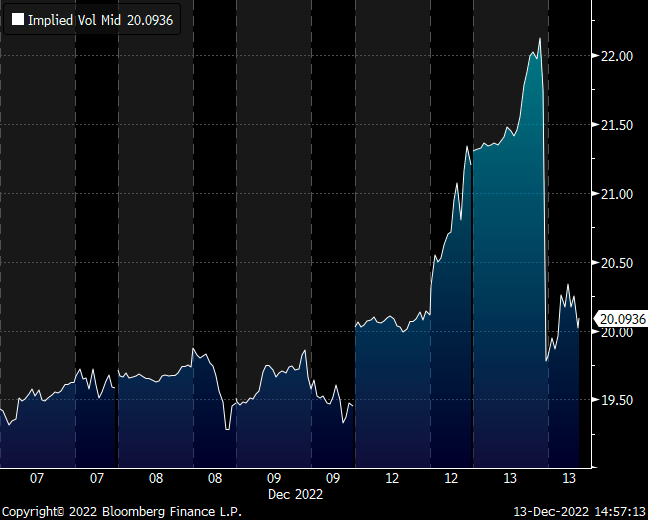
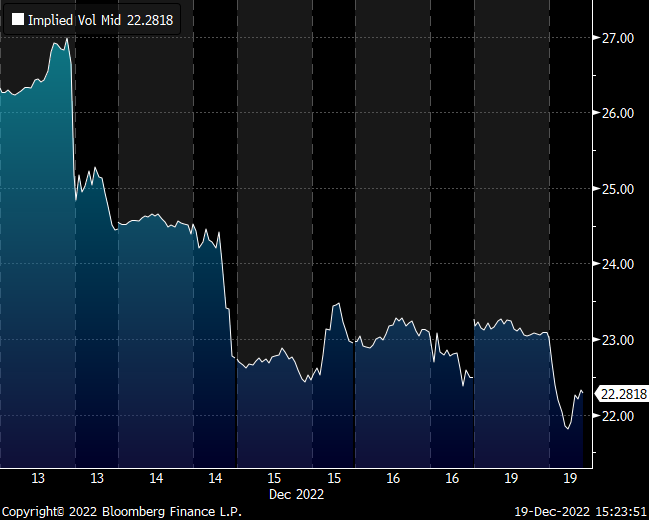
In spite of a down S&P 500 (INDEX: SPX), fixed-strike and top-line implied volatility (IVOL) measures such as the Cboe Volatility Index (INDEX: VIX), are on a downward trajectory. Let’s unpack.
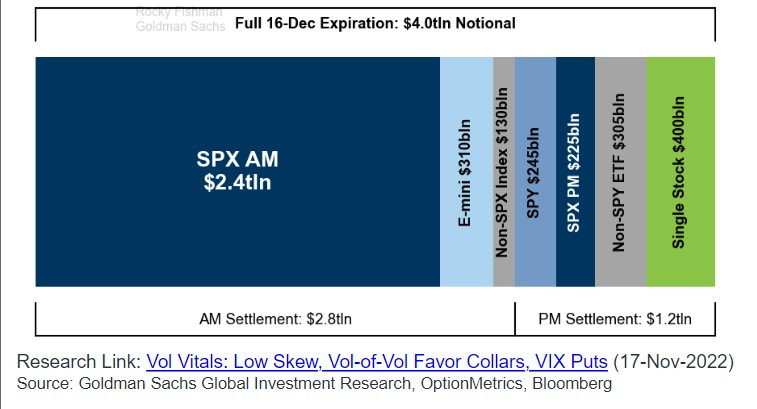
Heading into the December monthly options expiration (OPEX), traders were seeking to bet on and guard against large market movement. Traders’ demand for options, particularly those that are shorter-dated, bid IVOL markedly over the period running up to December OPEX.
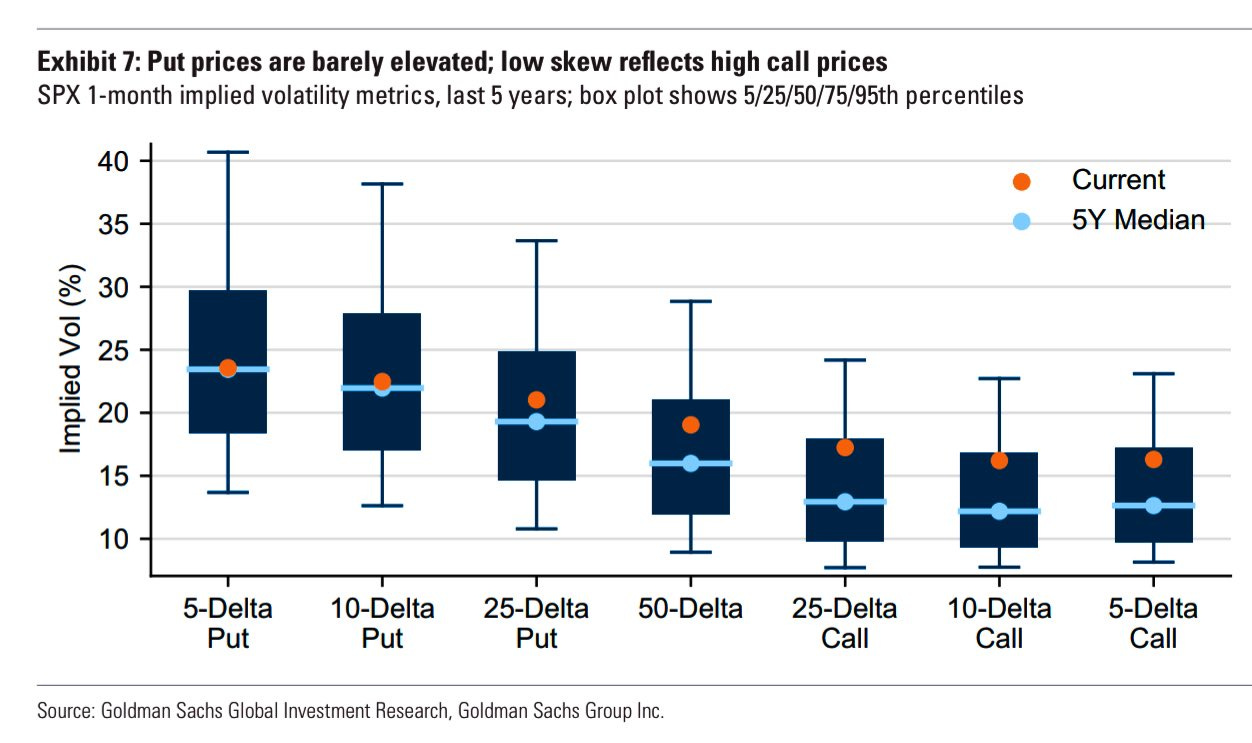
In fact, based on the pricing of options, the “consensus was a large right tail move in stocks,” SpotGamma explained in a recent note. Just look at the prices of options expiring December 15. There was a big premium in ultra-short-dated S&P 500 call options (left) versus puts (right).

The same can be viewed via low volatility skew, in part the result of traders’ decreased interest in owning downside protection (as there is less reason to hold downside protection if you have sold your long stock and/or you have monetized existing protection during the 2022 decline).
Anyways, as a result, counterparties (i.e., those who supplied traders their positive exposure to movement) were left “short a massive amount of Gamma,” or negative exposure to movement, which often results in hedging that reduces market liquidity and fattens the tails of the potential distribution of returns (i.e., buying strength and selling weakness), Kai Volatility said in a letter; positioning boosted “crash risk” and the potential for “more melt-ups.”
A clear display of this was after the “CPI release on Tuesday … In a matter of hours, [the] market gapped up 4% [and] then gave it all back,” Kai Volatility said.
To further explain, that is because short-dated options gain and lose value quickly given their increased sensitivity to changes in market movement (Gamma), as time passes. When the S&P 500 moved higher after CPI, call options gained a lot of value (Delta) very quickly. Those on the other side of that trade (i.e., counterparts), who had exposure to -Gamma or negative exposure to movement, went from having, for sake of brevity, very little -Delta to a lot of -Delta. Therefore, counterparts bought stock and futures (added +Delta) to hedge against an imbalance bolstering rapid up-market movement. When the short-dated exposure rolled off, these options risks were no longer there. Counterparts removed the +Delta they added (sold stock and futures back to the market) resulting in a move back down to where markets had started.
Moving on.
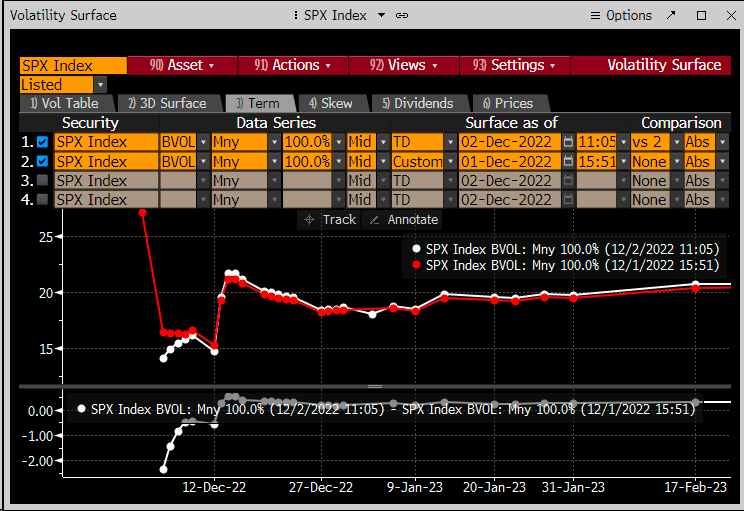
Following the events of last week, the absence of the unexpected (i.e., what traders sought to hedge and/or bet on), resulted in options selling (supply of protection), a pressure on options prices that remained through December’s large monthly OPEX.
These pressures are expected to last through January 10, as it’s easy to sell high IVOL likely to expire worthless (knowing there are good odds that nothing happens through the holidays), and own IVOL on the back of that period which is cheap.
As Karsan puts it, “you’ll have some moments of minor excitement but no crazy tails,” until the week of January 10 when we are more likely to “see a countertrend rally.”
Following this period, as far out as May, there is a seasonal effect in the volatility space that could set the stage for a sharp leg lower. More on this later.
Technical
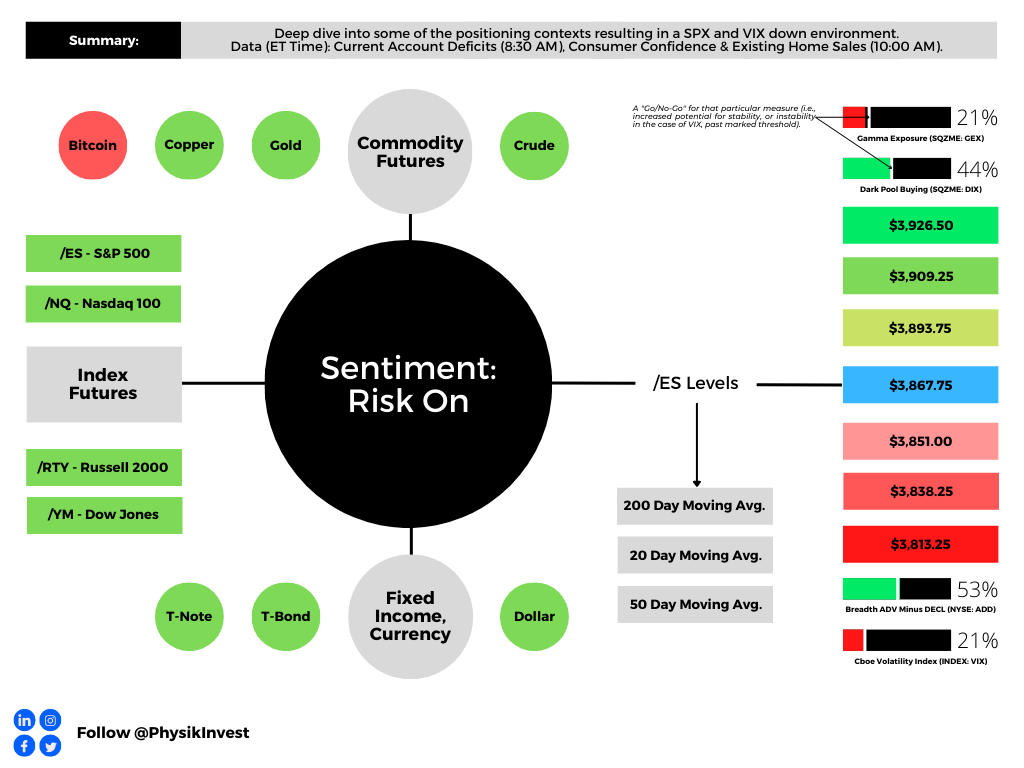
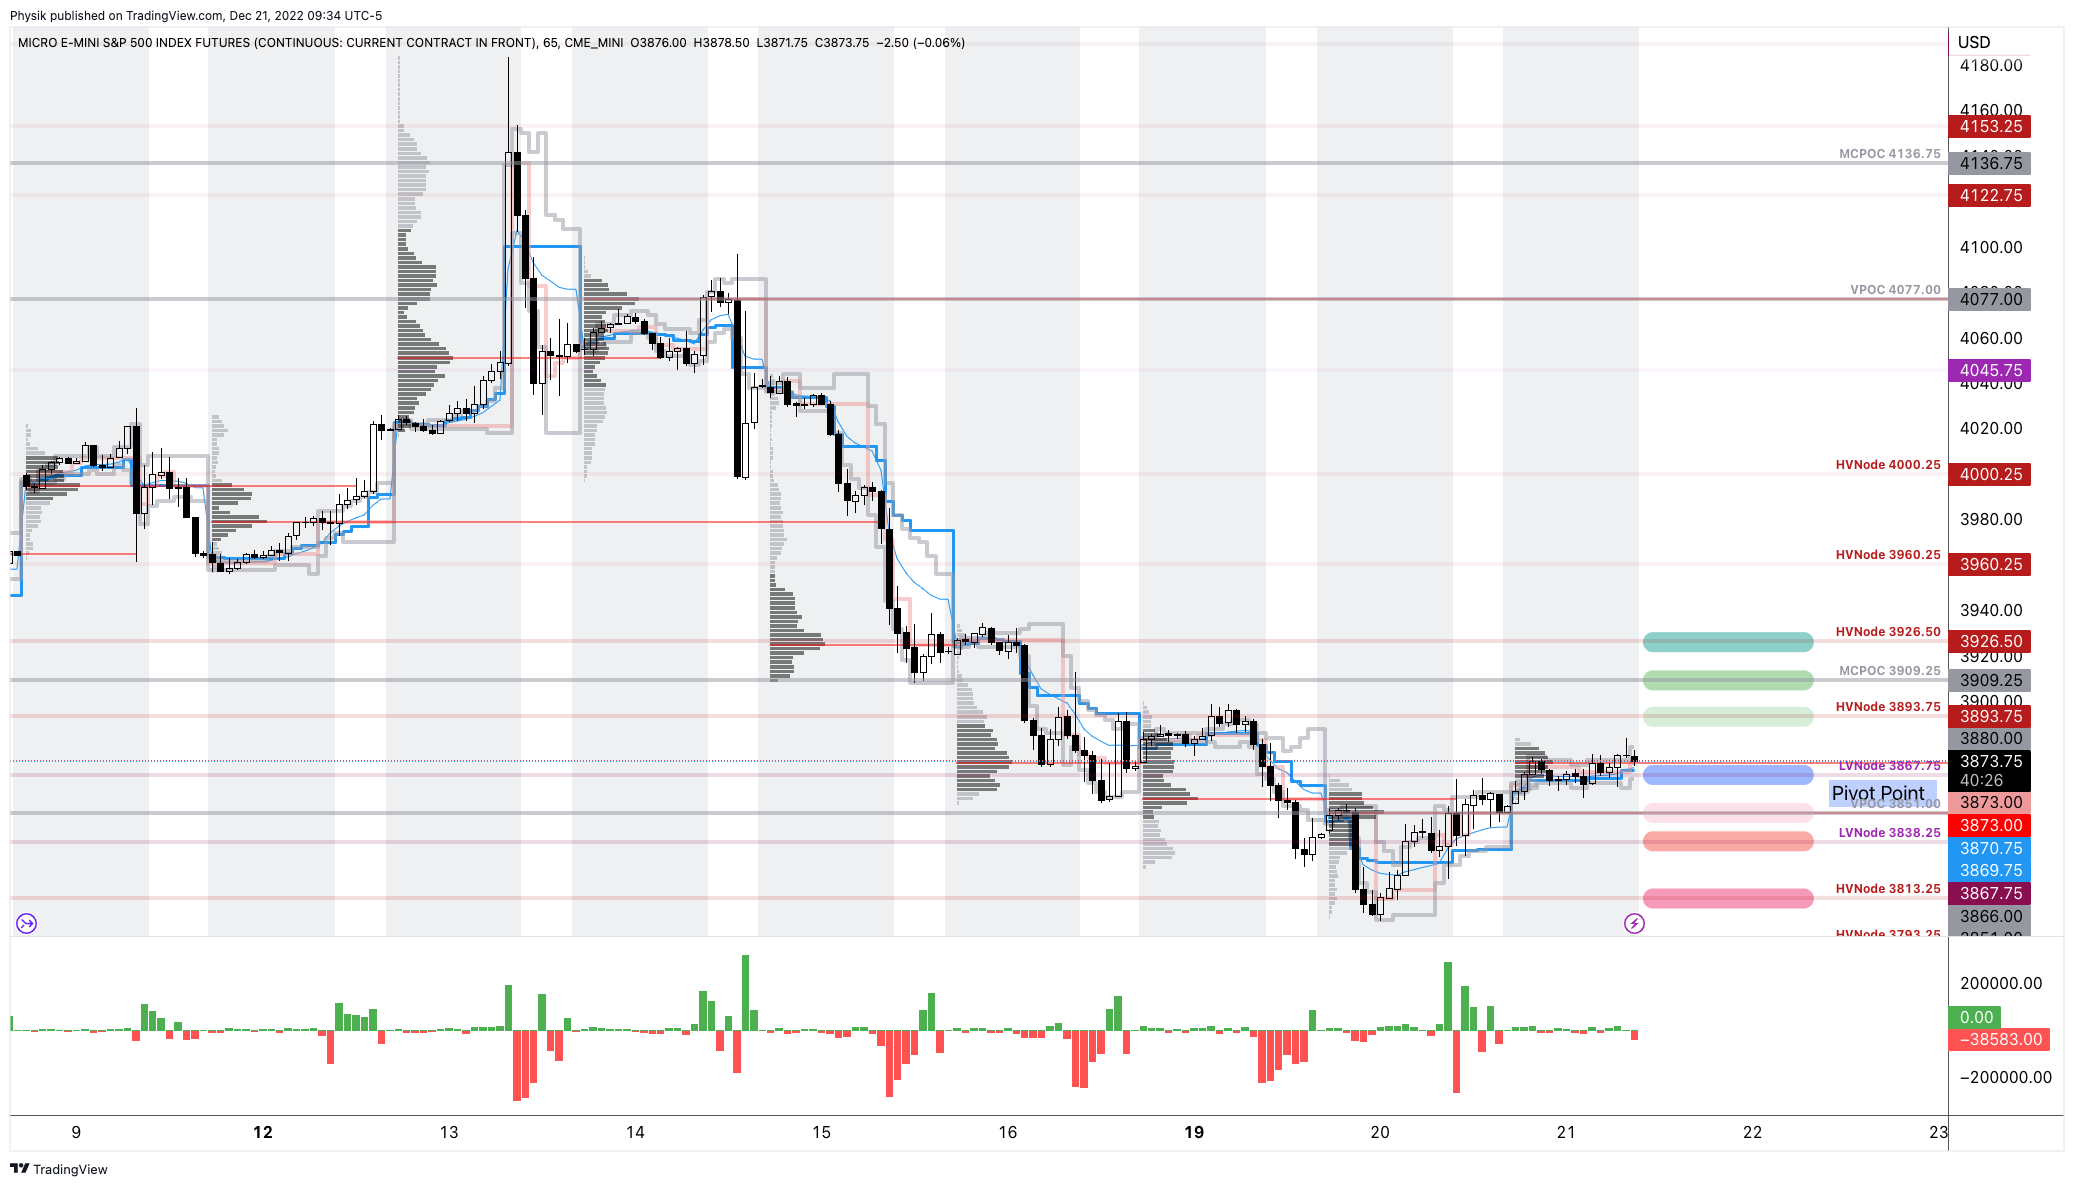
As of 9:30 AM ET, Wednesday’s regular session (9:30 AM – 4:00 PM ET), in the S&P 500, is likely to open in the upper part of a positively skewed overnight inventory, outside of prior-range and -value, suggesting a potential for immediate directional opportunity.
Our S&P 500 pivot for today is $3,867.75.
Key levels to the upside include $3,893.75, $3,909.25, and $3,926.50.
Key levels to the downside include $3,851.00, $3,838.25, and $3,813.25.
Click here to load today’s key levels into the web-based TradingView platform. All levels are derived using the 65-minute timeframe. New links are produced, daily.
Definitions
Volume Areas: Markets will build on areas of high-volume (HVNodes). Should the market trend for long periods of time, it will be identified by low-volume areas (LVNodes). LVNodes denote directional conviction and ought to offer support on any test.
If participants auction and find acceptance in an area of a prior LVNode, then future discovery ought to be volatile and quick as participants look to HVNodes for favorable entry or exit.
POCs: Denote areas where two-sided trade was most prevalent in a prior day session. Participants will respond to future tests of value as they offer favorable entry and exit.
About
In short, an economics graduate working in finance and journalism.
Capelj spends most of his time as the founder of Physik Invest through which he invests and publishes daily analyses to subscribers, some of whom represent well-known institutions.
Separately, Capelj is an equity options analyst at SpotGamma and an accredited journalist interviewing global leaders in business, government, and finance.
Past works include conversations with investor Kevin O’Leary, ARK Invest’s Catherine Wood, FTX’s Sam Bankman-Fried, Lithuania’s Minister of Economy and Innovation Aušrinė Armonaitė, former Cisco chairman and CEO John Chambers, and persons at the Clinton Global Initiative.
Contact
Direct queries to renato@physikinvest.com or Renato Capelj#8625 on Discord.
Calendar
You may view this letter’s content calendar at this link.
Disclaimer
Do not construe this newsletter as advice. All content is for informational purposes.


