The Daily Brief is a free glimpse into the prevailing fundamental and technical drivers of U.S. equity market products. Join the 200+ that read this report daily, below!
Updates: Hi everyone! To start, I wanted to sincerely apologize for the below graphic being inaccurate, yesterday. Technology problems! I have since updated the graphic. My bad – egg on my face.
As always, for checks on quoted levels, and the like, just read on below. I try to build in as many redundancies to ensure we have the most information to trade on as possible.
If levels do not make sense, I assure you that they are either (A) updated in the attached real-time charts or (B) in the “Technical” section, below.
Feedback and questions are always encouraged/appreciated!
What Happened
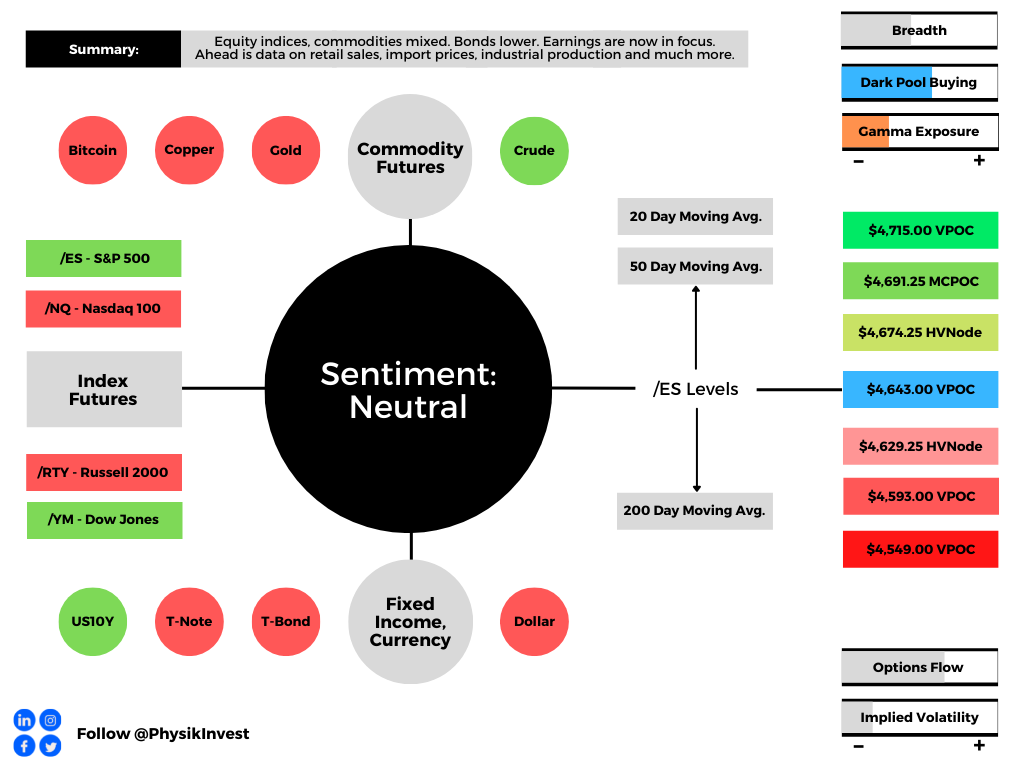
Overnight, equity index futures rotated, lower, validating the end-of-day, knee-jerk price exploration. Commodities were mixed, bonds fell, and volatility was bid.
Ahead is data on retail sales and import prices (8:30 AM ET), industrial production and capacity utilization (9:15 AM ET), University of Michigan consumer sentiment figures and business inventories (10:00 AM ET), as well as some speech by New York Fed President John Williams (11:00 AM ET).
Note that in observance of Martin Luther King Jr. Day, markets will be closed on Monday, January 17.
There will be no commentary published, as a result.
What To Expect
Fundamental: Markets sold heavy, yesterday, on the heels of hawkish commentary from monetary policymakers.
The Federal Reserve’s Lael Brainard said the central bank would be in a position to start hiking rates as soon as it wound down bond purchases. This is to happen in March.
“The (Fed’s policy-setting) committee has projected several hikes over the course of the year,” Brainard said in testimony.
“Of course, we will be in a position to do that I think as soon as our purchases are terminated, and we’ll simply have to see what the data requires over the course of the year, and you know we started to discuss shrinking our balance sheet.”
The Fed is moving more quickly to “save itself from having to hike too far and make rates so expensive that they slow down the economy.”
“We understand the Fed’s paralysis given the massive uncertainty coming out of the pandemic,” says Jim Bianco of Bianco Research. “However, the longer they wait to address inflation, the worse this conundrum will become.”
So, what’s the major concern with tightening and eventual balance sheet compression?
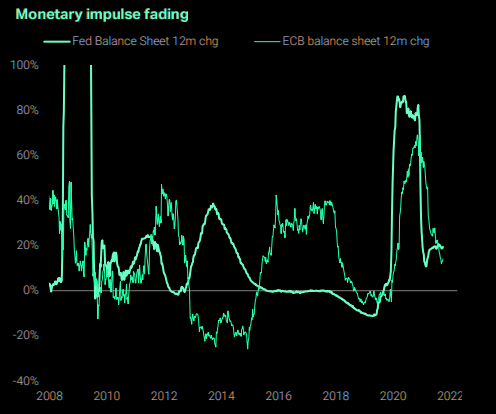
It has much to do with left-tail risks. Prevailing monetary frameworks and max liquidity promoted a large divergence in price from fundamentals.
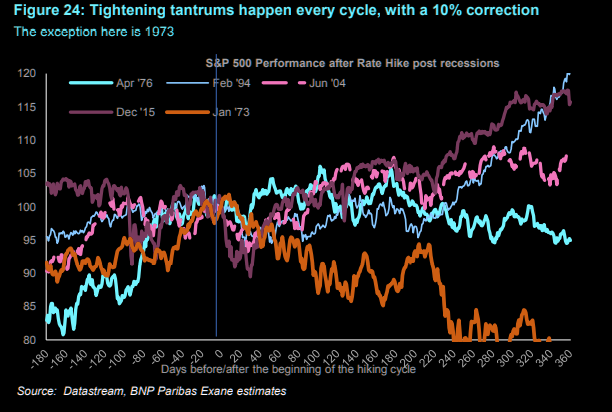
With expected monetary policy evolution, however, valuations are much less justifiable. Many institutions, as a result, see peaks in 2022, just as rate hikes are initiated.
“The decline in stock prices is forecast to be orderly but it could turn into something worse,” Moody’s Corporation (NYSE: MCO) explains in reference to the growth of passive investing – the effect of increased moneyness among nonmonetary assets – and derivatives trading.
“A drop in stock prices could trigger margin calls.”
Notwithstanding, as stated in the prior day’s, according to JPMorgan Chase & Co (NYSE: JPM) strategists, “[p]olicy tightening is likely to be gradual and at a pace, that risk assets should be able to handle, and is occurring in an environment of strong cyclical recovery.”
This is as Moody’s also notes that “there will still be a lot of excess liquidity—a little less than $1 trillion— when the central bank’s balance sheet does begin to decline.”
Note that over the next weeks, a focus will be the release of earnings, in the face of inflation, supply-chain challenges, and the like. We will cover this in later commentaries.
Positioning: Thursday’s trade did little to upset the narratives discussed in the “Positioning” section of this commentary over the past few days.
As stated, metrics that overlay options positioning and buying pressure (via short sales or liquidity provision on the market-making side) are positively skewed, albeit less so than before.
At the same time, we have trading desks suggesting “the conditions are not in place for a larger correction (>5%),” while volatility remains compressed, relatively so, at the index level.
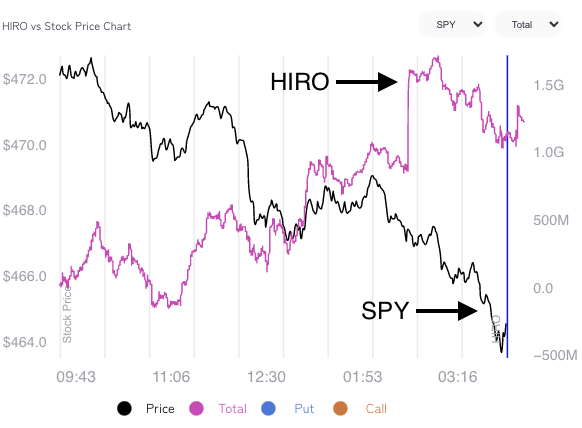
For instance, SpotGamma’s (beta) Hedging Impact of Real-Time options indicator suggested S&P 500 options activity diverged, markedly, from what underlying prices were doing.
This could mean that Thursday’s news-driven sell-off did not change the status quo.
Obviously, elsewhere, in single stock land, conditions are different. Metrics suggest options were a contributing factor in the weakness of rate-sensitive names, yesterday.
This is as many products are in lower liquidity and short-gamma (wherein an options delta rises with stock prices rises and falls when stock prices drop) in which moves are more erratic.
Note: As a position’s delta rises with stock or index price rises, gamma (or how an option’s delta is expected to change given a change in the underlying) is added to the delta.
Therefore, coming into weighty options expiration, correlations may (continue to) be off (as that is the only reconciliation in an environment where, at the index level, hedging pressures are sticky, whereas elsewhere they aren’t).
After the large January monthly options expiration (OPEX), correlations ought to fall back in line.
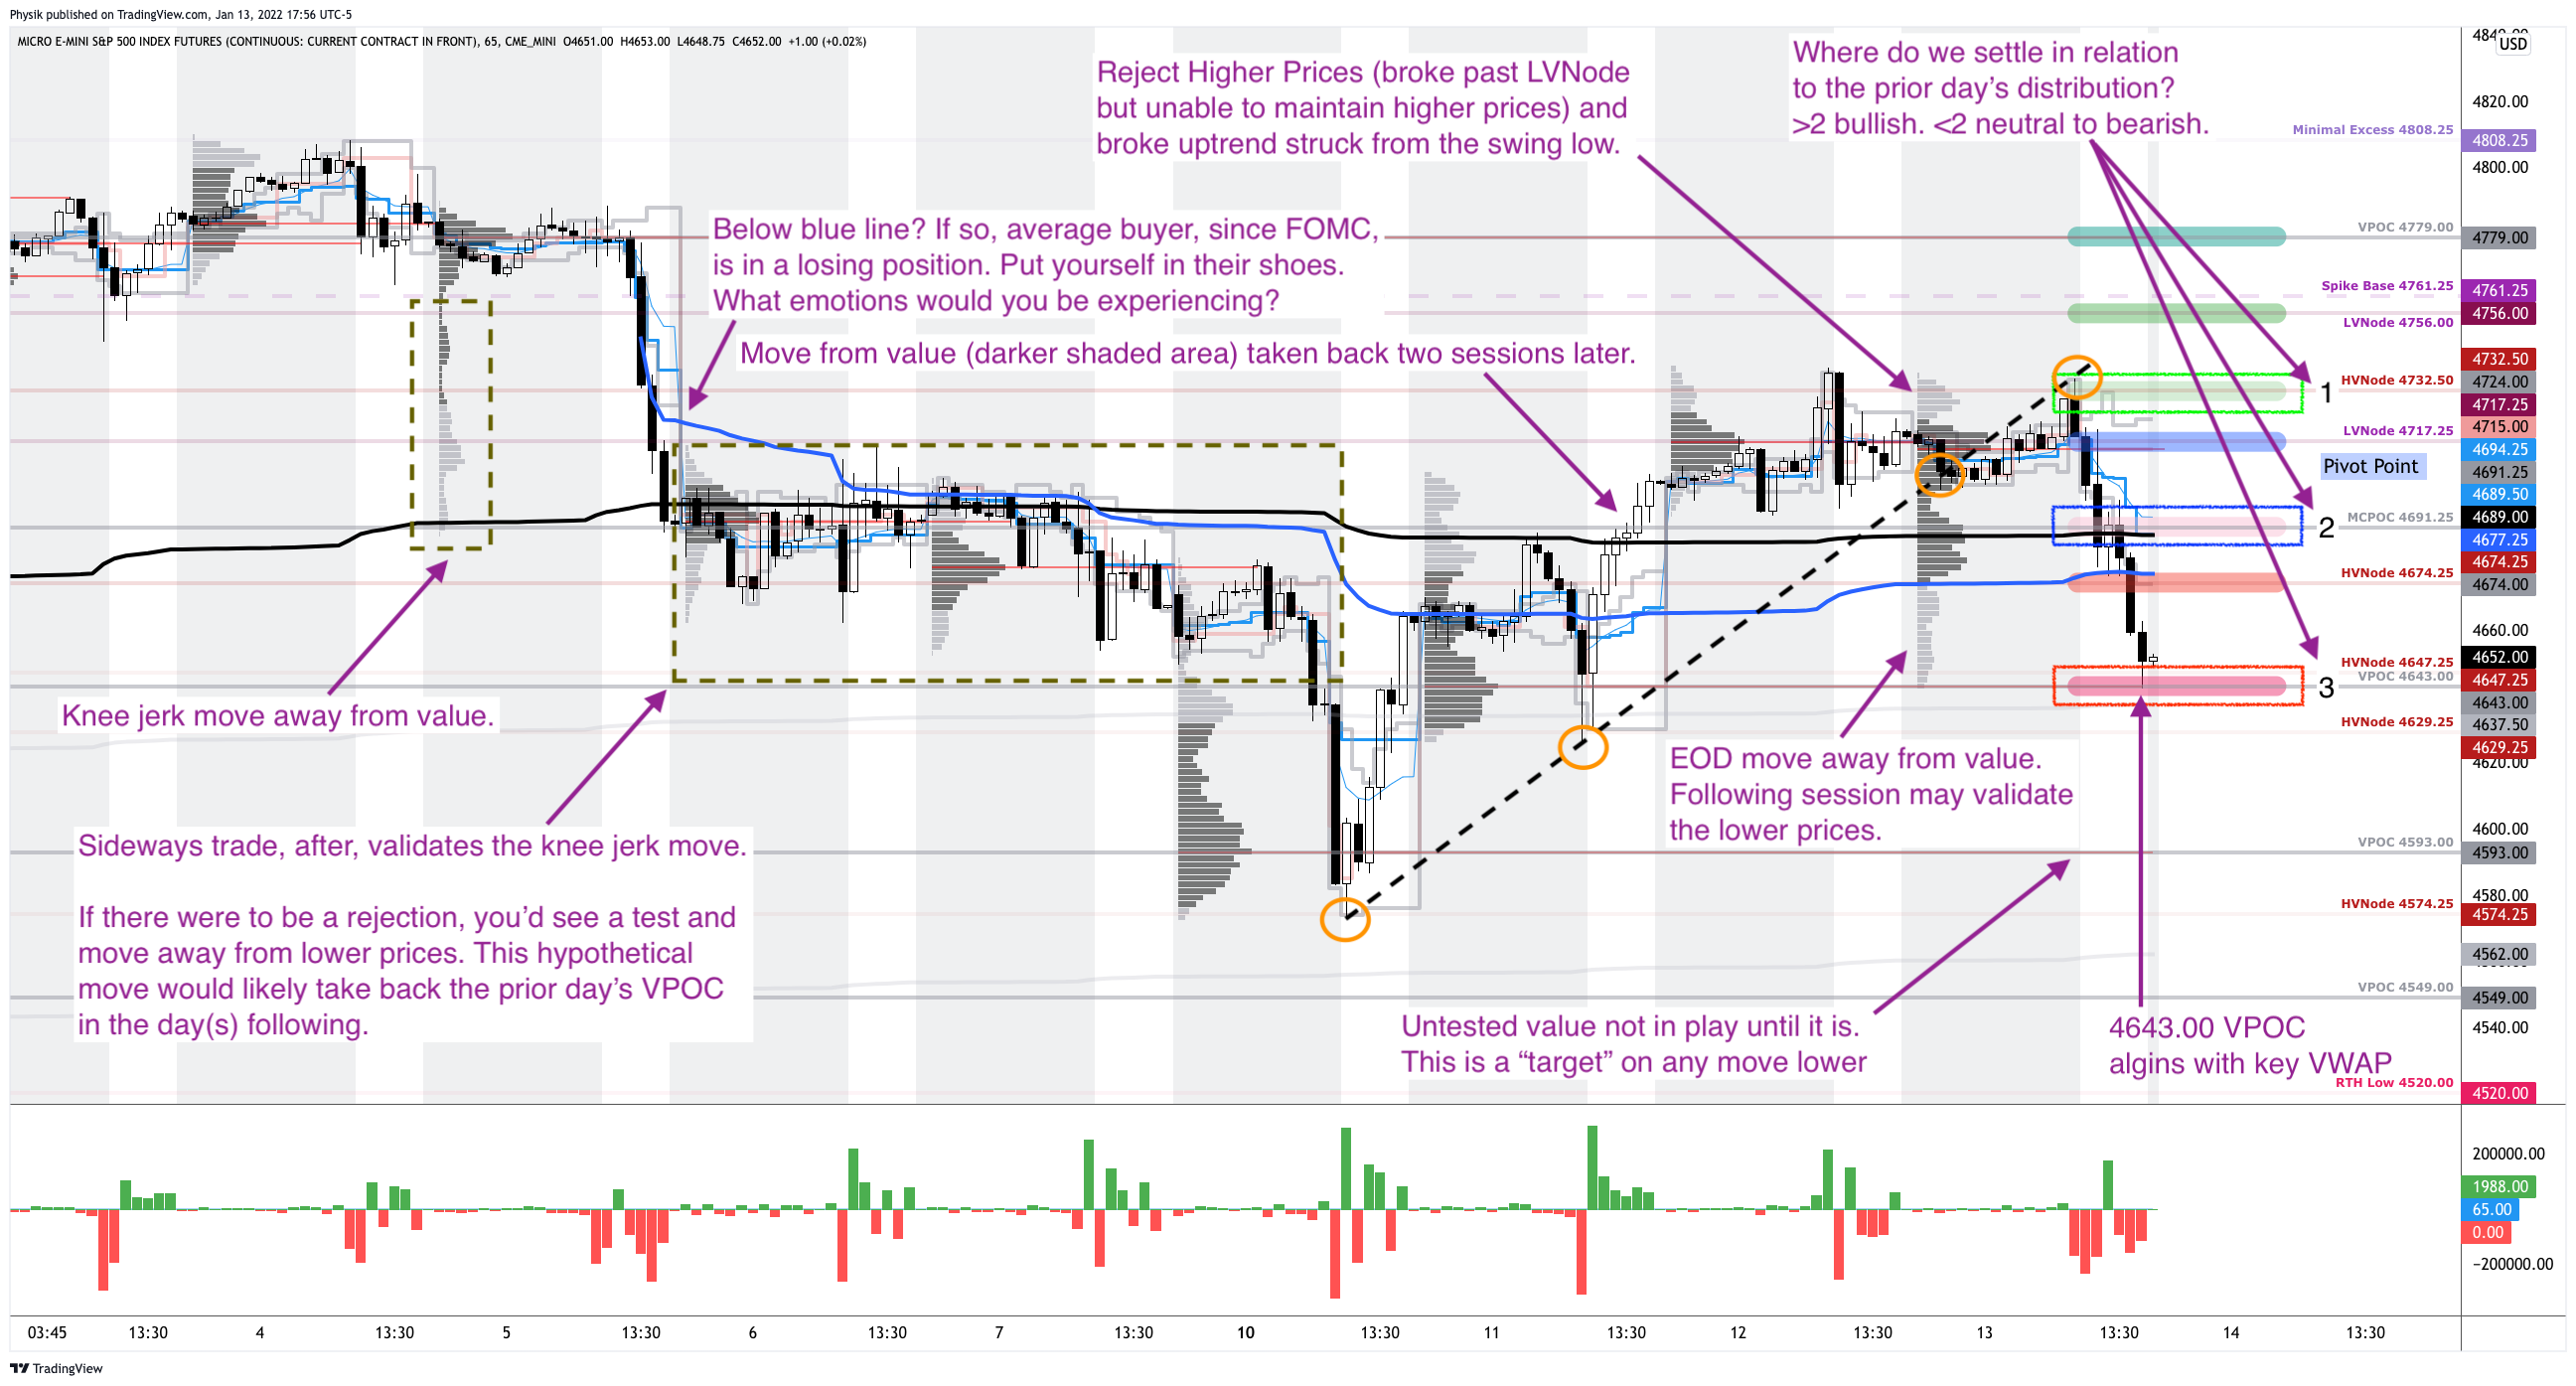
Technical: As of 6:30 AM ET, Friday’s regular session (9:30 AM – 4:00 PM ET), in the S&P 500, will likely open in the middle part of a balanced skewed overnight inventory, just of prior-range and -value, suggesting a limited potential for immediate directional opportunity.
In the best case, the S&P 500 trades higher; activity above the $4,643.00 untested point of control (VPOC) puts in play the $4,674.25 high volume area (HVNode). Initiative trade beyond the HVNode could reach as high as the $4,691.25 micro composite point of control (MCPOC) and $4,715.00 VPOC, or higher.
In the worst case, the S&P 500 trades lower; activity below the $4,643.00 VPOC puts in play the $4,629.25 HVNode. Initiative trade beyond the HVNode could reach as low as the $4,593.00 and $4,549.00 VPOC, or lower.
Click here to load today’s key levels into the web-based TradingView charting platform. Note that all levels are derived using the 65-minute timeframe. New links are produced, daily.

Considerations: Recent trade is more so dominated by visually-driven, weaker-handed momentum players that mechanically respond to key technical levels like the 20-day simple moving average or profile levels.
Simply put, the other time frame participants are waiting for more information before committing to substantial expansion of range via large sales or buys.

Definitions
Volume Areas: A structurally sound market will build on areas of high volume (HVNodes). Should the market trend for long periods of time, it will lack sound structure, identified as low volume areas (LVNodes). LVNodes denote directional conviction and ought to offer support on any test.
If participants were to auction and find acceptance into areas of prior low volume (LVNodes), then future discovery ought to be volatile and quick as participants look to HVNodes for favorable entry or exit.
POCs: POCs are valuable as they denote areas where two-sided trade was most prevalent in a prior day session. Participants will respond to future tests of value as they offer favorable entry and exit.
MCPOCs: POCs are valuable as they denote areas where two-sided trade was most prevalent over numerous day sessions. Participants will respond to future tests of value as they offer favorable entry and exit.
Options Expiration (OPEX): Traditionally, option expiries mark an end to pinning (i.e, the theory that market makers and institutions short options move stocks to the point where the greatest dollar value of contracts will expire) and the reduction dealer gamma exposure.
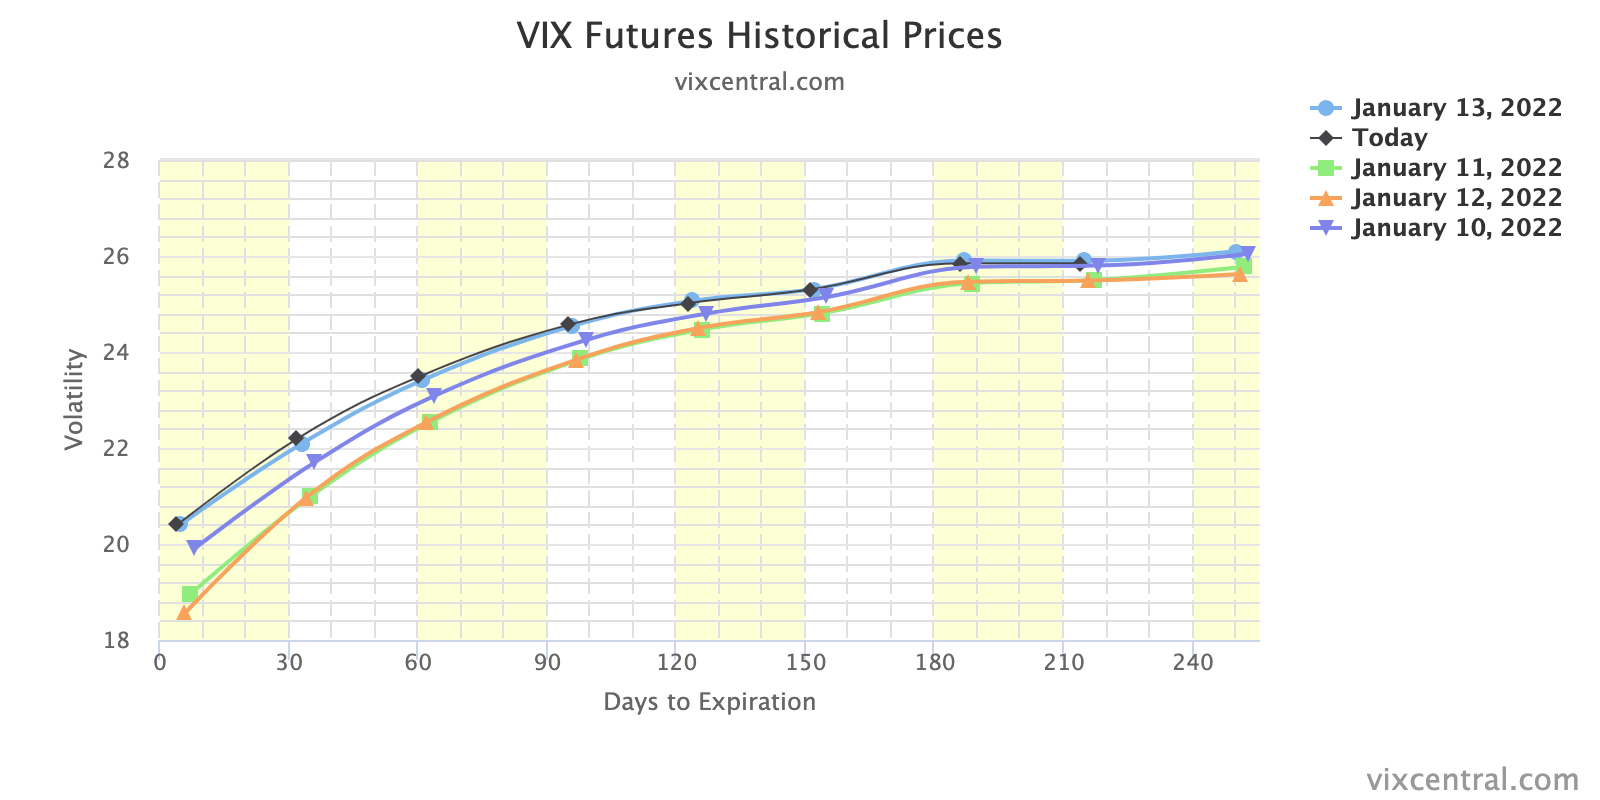
Inversion Of VIX Futures Term Structure: Longer-dated VIX expiries are less expensive; is a warning of elevated near-term risks for equity market stability.
Volume-Weighted Average Prices (VWAPs): A metric highly regarded by chief investment officers, among other participants, for quality of trade. Additionally, liquidity algorithms are benchmarked and programmed to buy and sell around VWAPs.
About
After years of self-education, strategy development, mentorship, and trial-and-error, Renato Leonard Capelj began trading full-time and founded Physik Invest to detail his methods, research, and performance in the markets.
Capelj is also a Benzinga finance and technology reporter interviewing the likes of Shark Tank’s Kevin O’Leary, JC2 Ventures’ John Chambers, FTX’s Sam Bankman-Fried, and ARK Invest’s Catherine Wood, as well as a SpotGamma contributor developing insights around impactful options market dynamics.
Disclaimer
Physik Invest does not carry the right to provide advice.
In no way should the materials herein be construed as advice. Derivatives carry a substantial risk of loss. All content is for informational purposes only.