Physik Invest’s Daily Brief is read free by thousands of subscribers. Join this community to learn about the fundamental and technical drivers of markets.

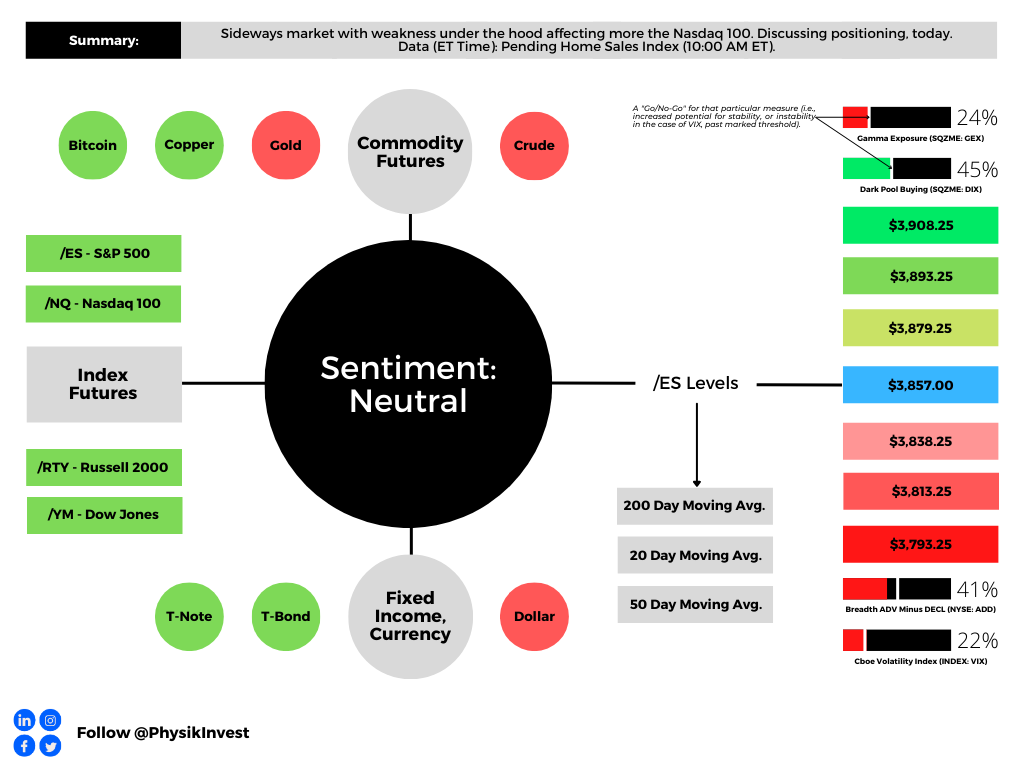
Positioning
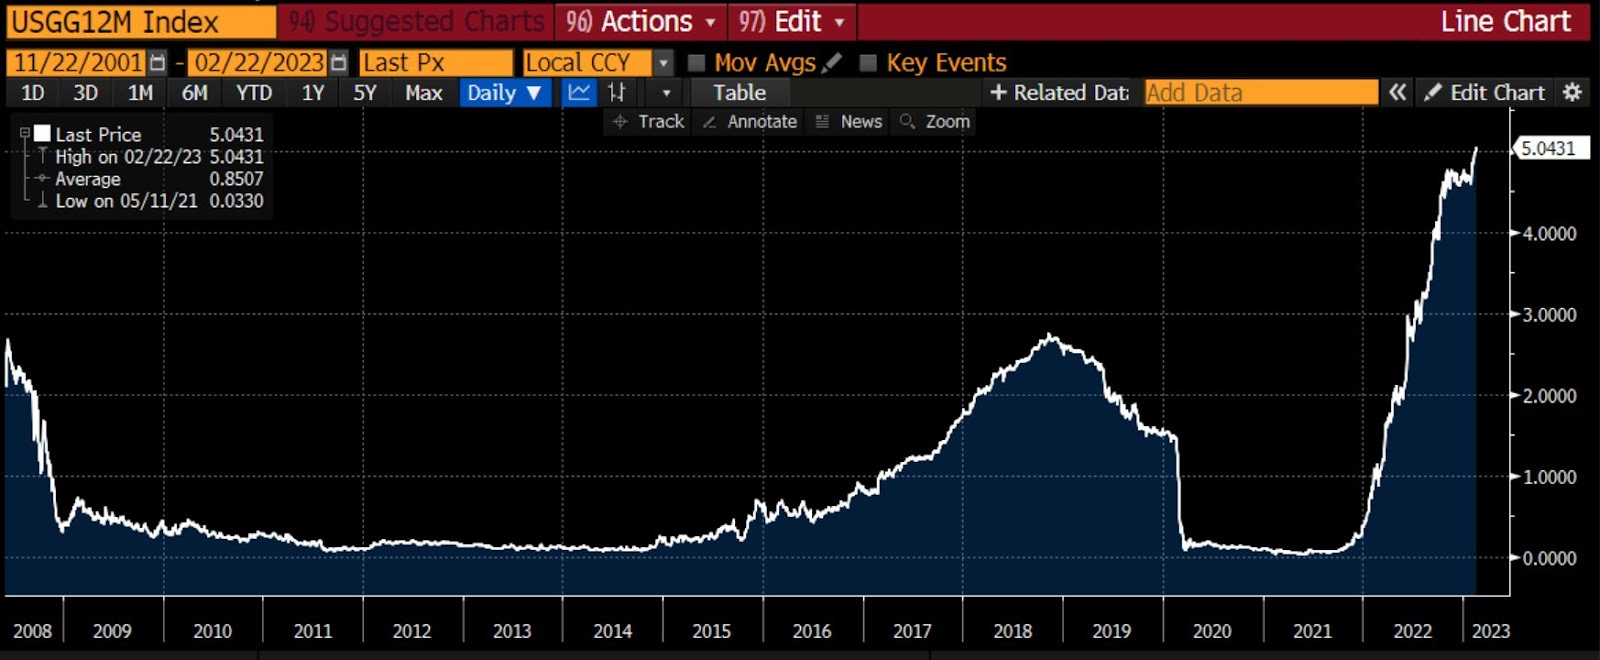
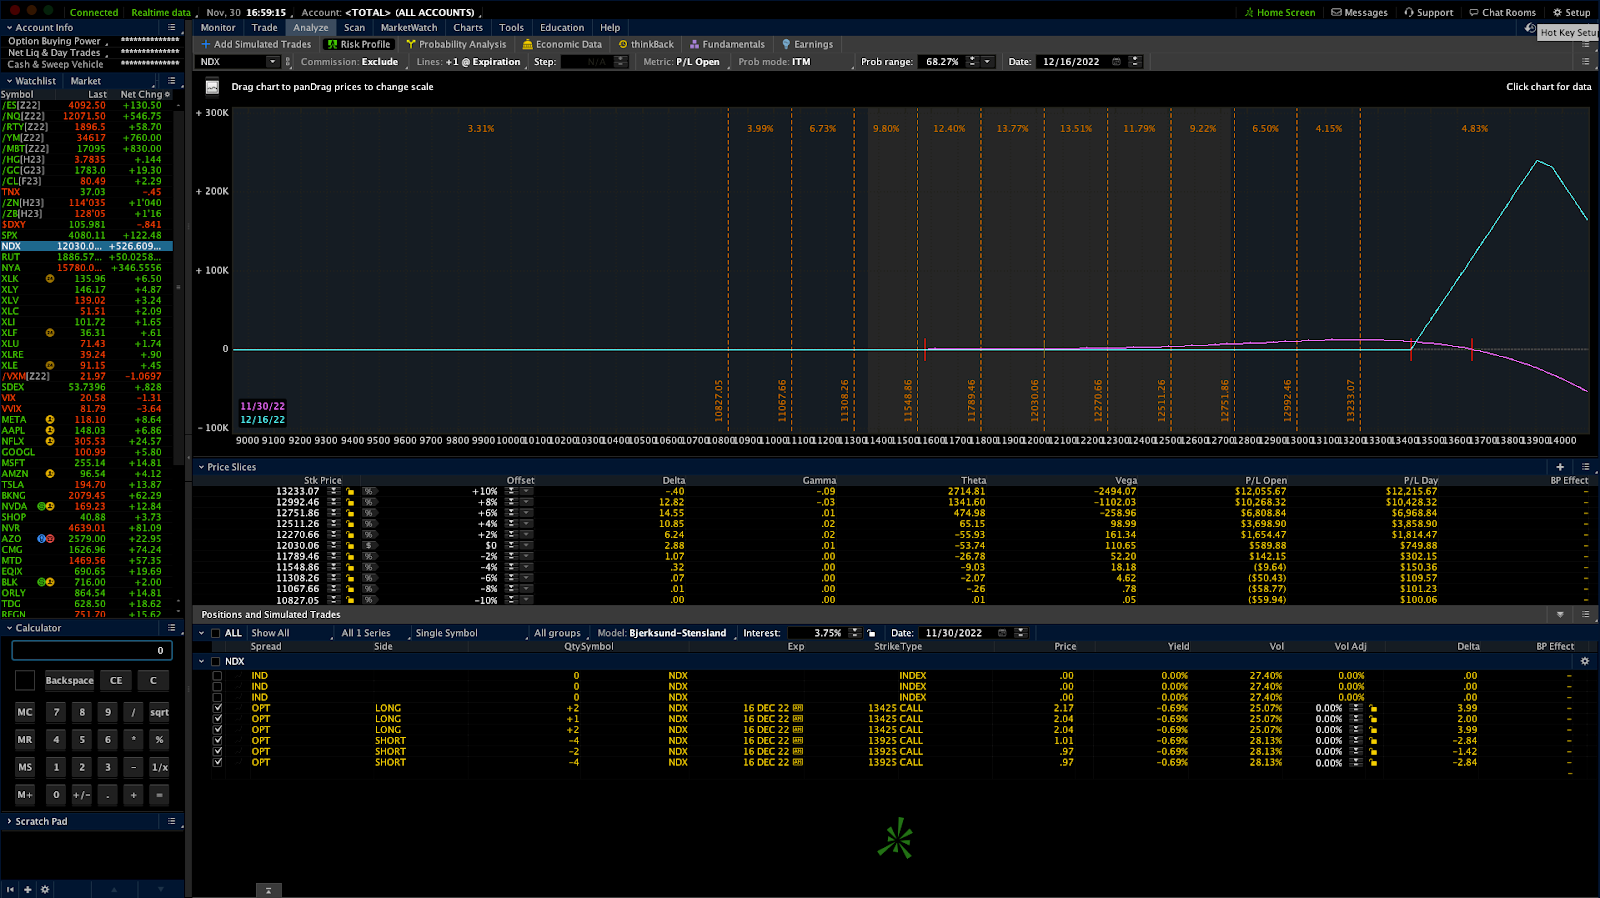
Traders continue to balance the risks of owning risk assets versus less-risky bonds, for instance. In what can be construed as a fear-of-missing-out (FOMO), some have sought upside equity exposure in a way that limits downside: call options.
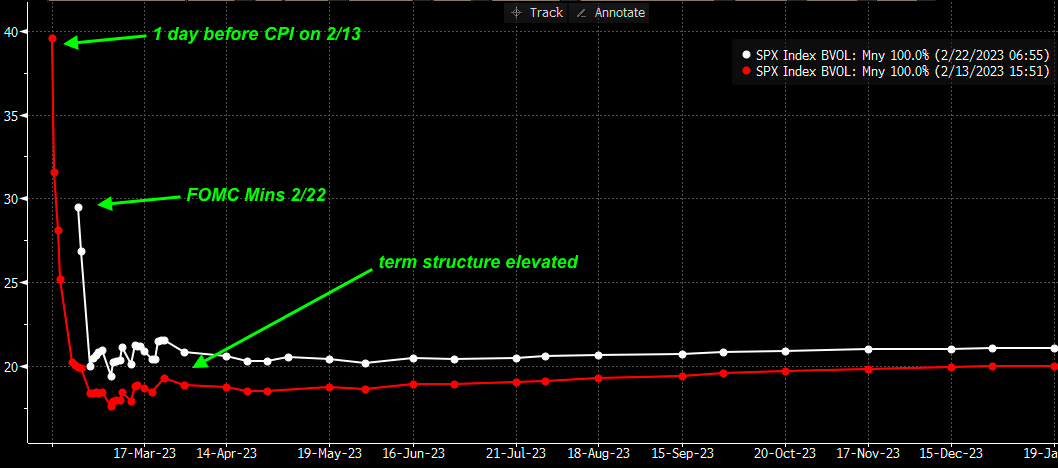
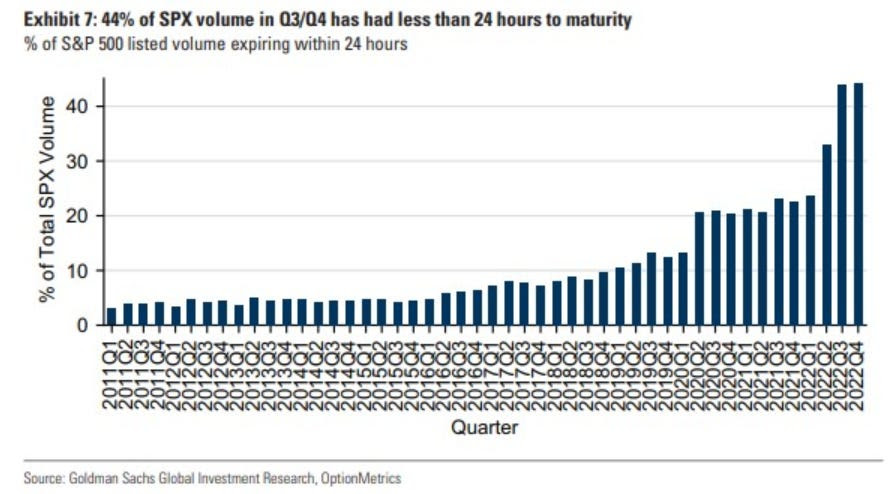
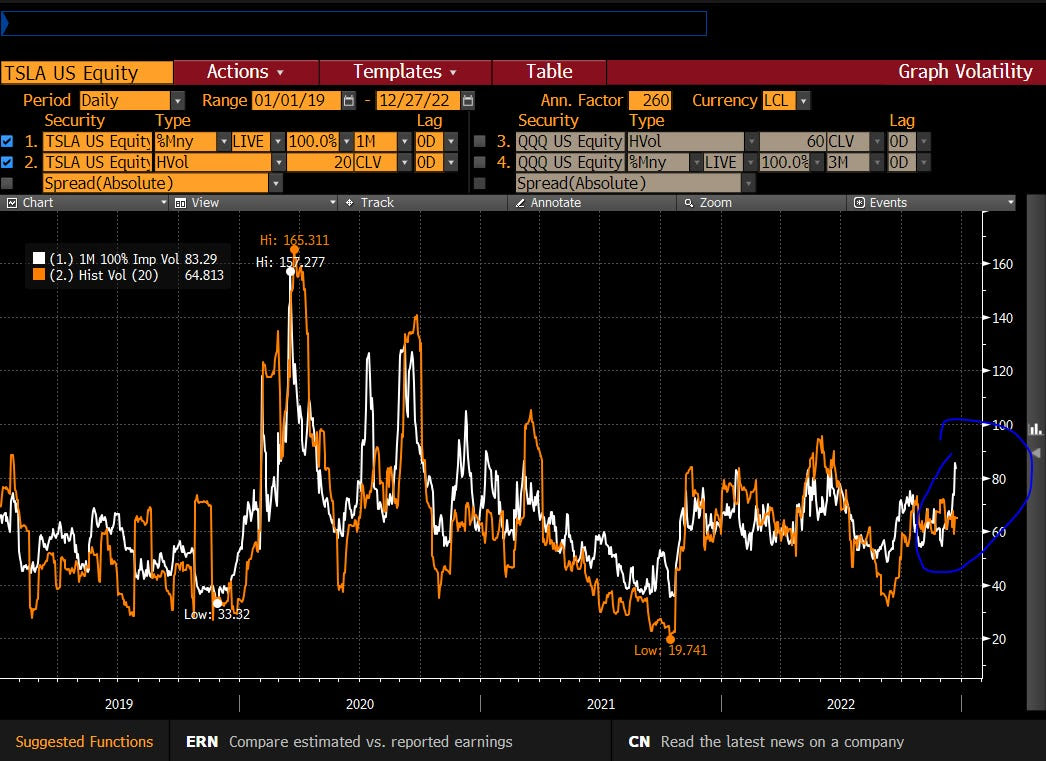
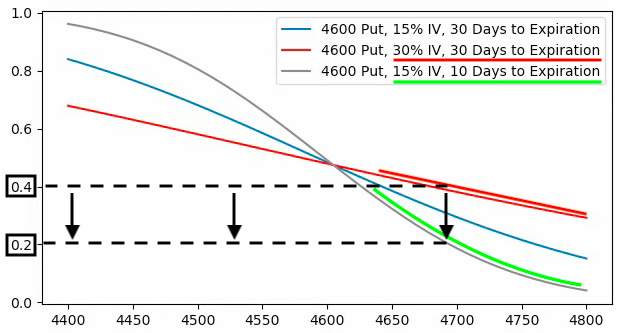
Consequently, implied volatility (IVOL) on the call side, particularly in options with less time to expiration, continues to be elevated by upwards of 10.00% or more.
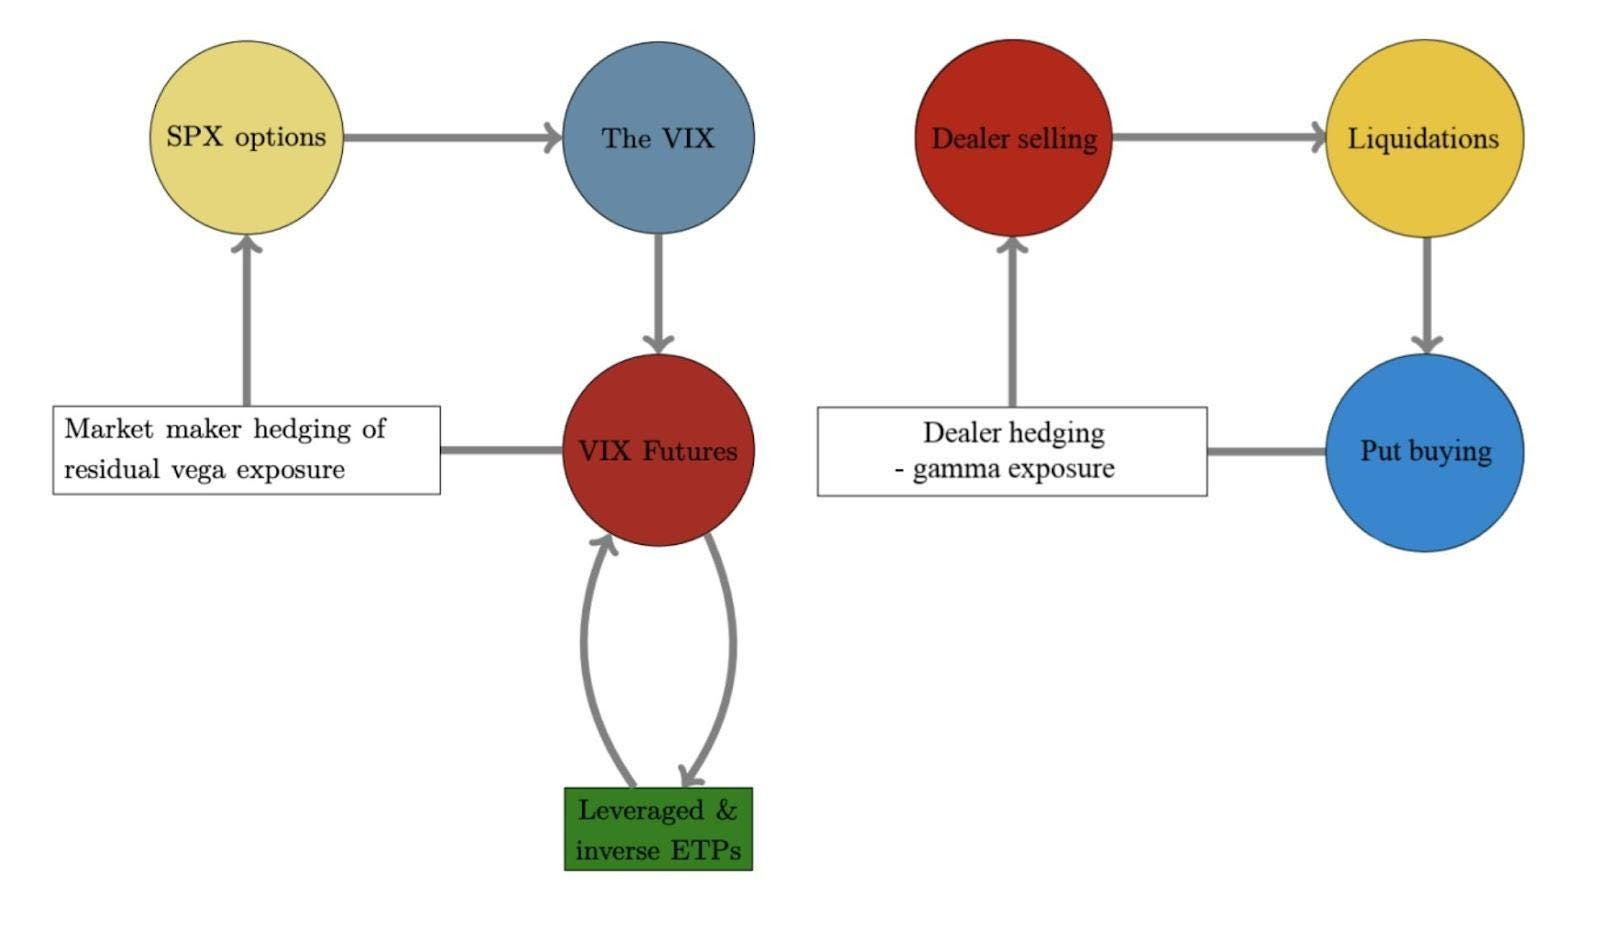
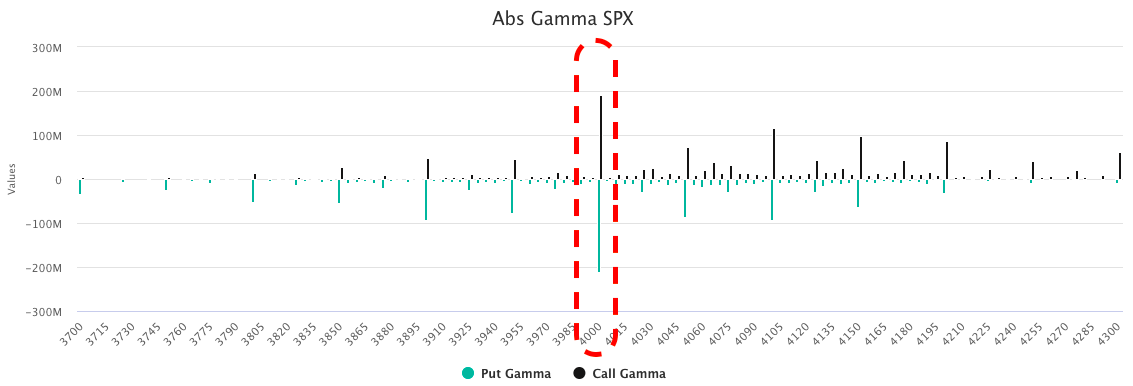
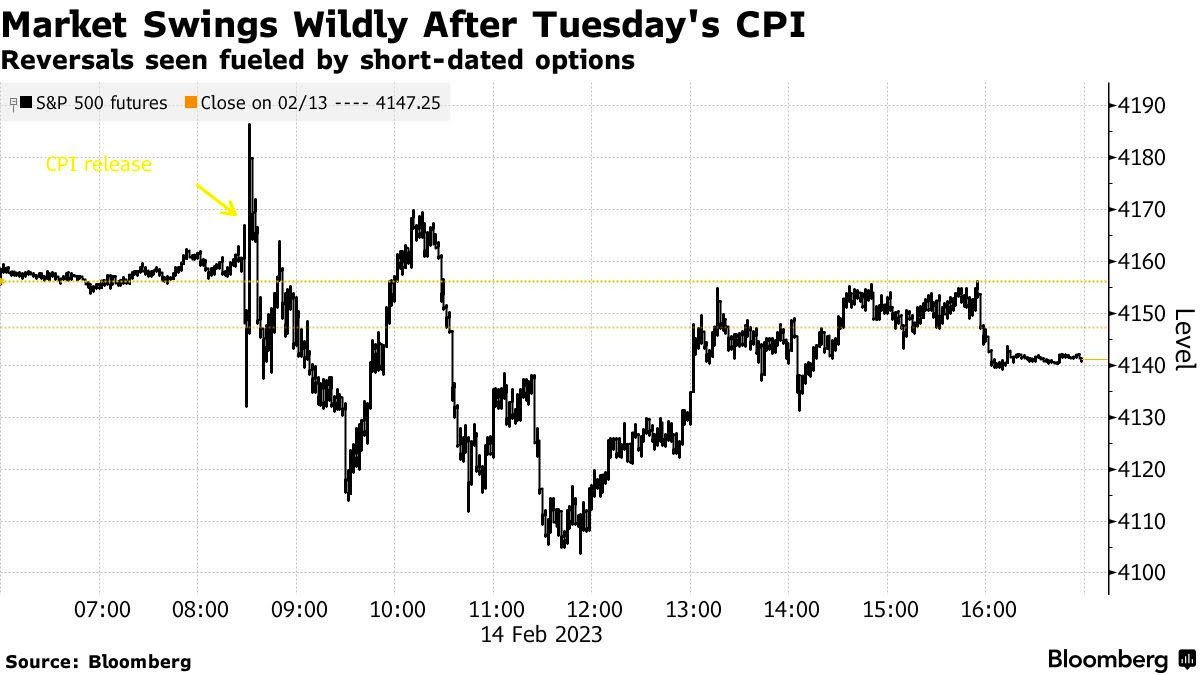
Further, this week’s trading has been dominated by the expected post-options expiry (OpEx) weakness, as well as short-term catalysts and trading. Take yesterday, for example, the market opened higher signaling a potential trend change on upbeat earnings reports, as I detailed in a SpotGamma note. Under the hood, however, there was little optimism. The S&P 500 (INDEX: SPX) succumbed to this weakness before reversing at a key support SpotGamma’s modeling established and rising toward a key resistance into session-end. Noteworthy was the options activity heading into the decline. We observe this activity with tools including SpotGamma’s HIRO indicator measuring the real-time hedging impact of traders’ options activities.
As the SPX traded lower, ultra-short-dated call buyers and put sellers synthetically bought the market. The hedging of this ultra-sensitive exposure portended a turn at the low. As the SPX resolved higher, this activity traded out, so to speak, as evidenced by ultra-short-dated call selling and put buying, hence mean-reversion into the close.
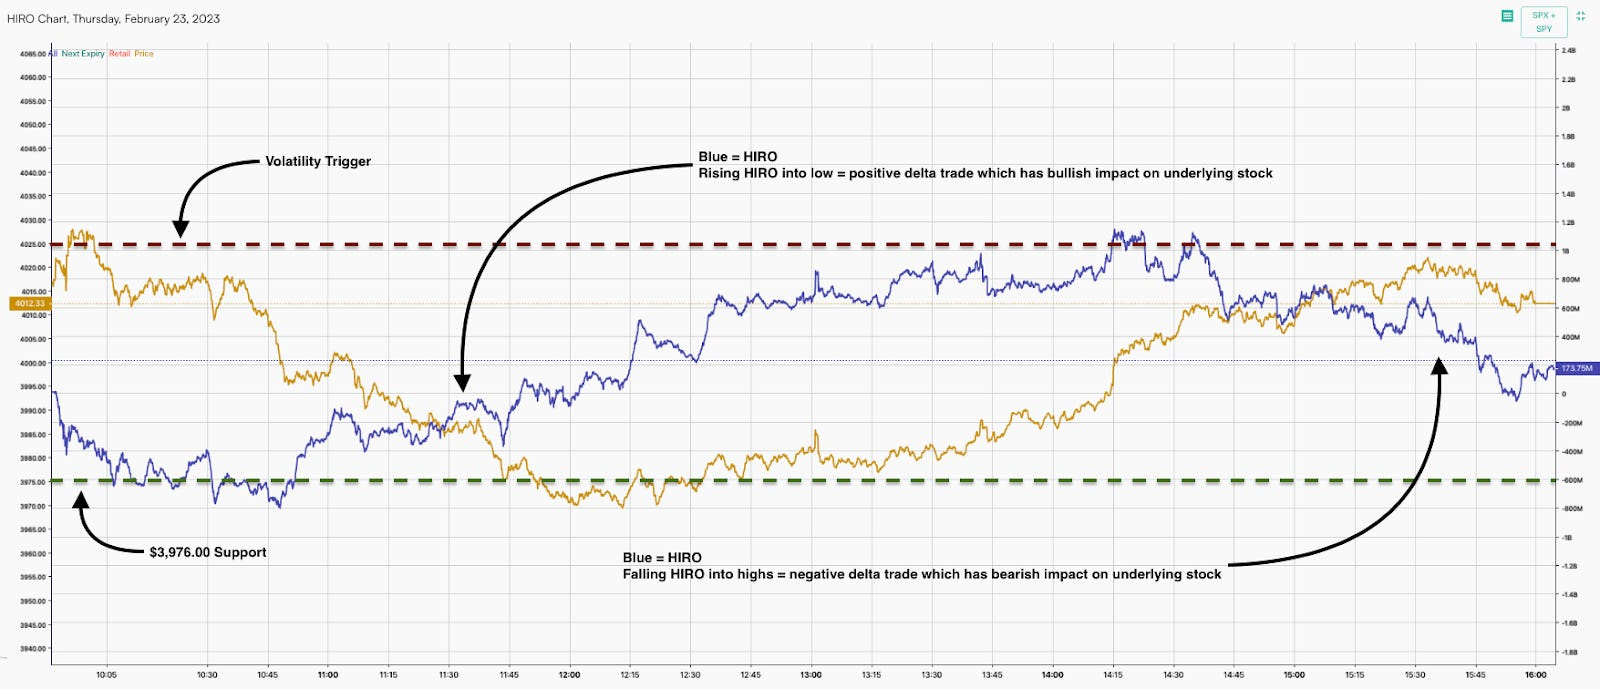
SpotGamma’s founder said these “head-fakes” were to be expected. “Traders are uncertain and still are not committed to demanding longer-dated protection,” hence lower longer-dated IVOL.
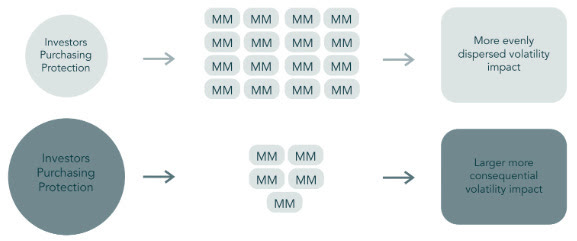
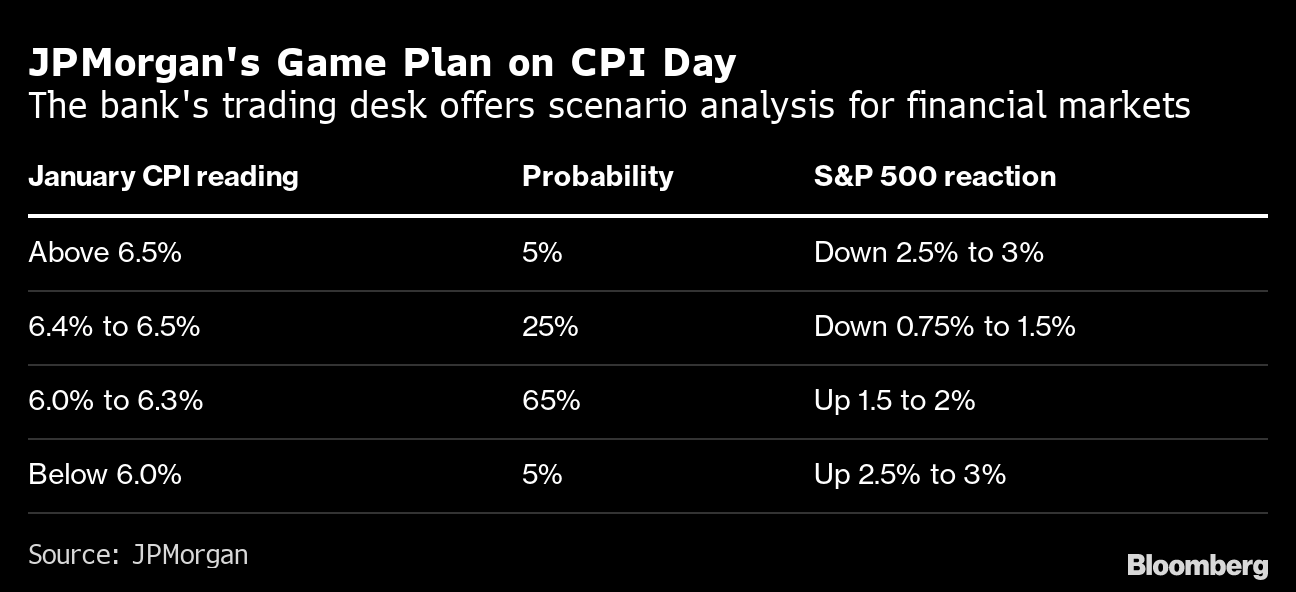
In a Bank of America Corporation (NYSE: BAC) response to JPMorgan Chase & Co’s (NYSE: JPM) note on an ultra-short-dated options trading catastrophe looming, we learn that mean-reversion is, in part, a result of “traders buying short-dated options at the beginning of the day and unwinding those same positions late in the day,” I put in a SpotGamma note.
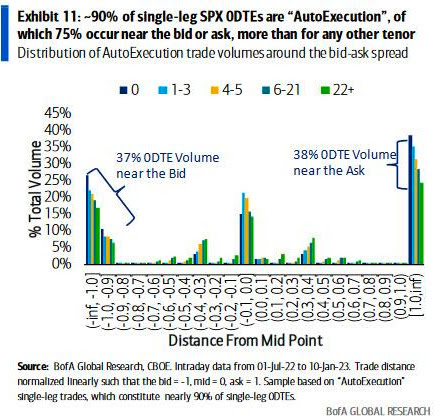
To quote BAC directly, half of all SPX ultra-short-dated options activity is “single-leg auto-execution.” Options IVOL is “at levels that are likely inconsistent with a market that has been overrun by option sellers,” contrary to JPM’s opinion, ZeroHedge said in one recap. “75% of trades occur near the bid or the ask – more than for any other tenor, and volume is uniquely skewed towards the ask early in the day but towards the bid later in the day.”
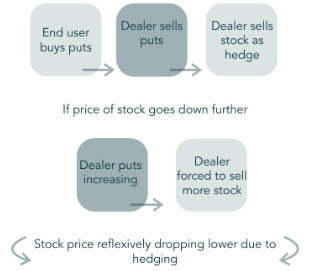
Consequently, a takeaway is that, as this letter has put forth in the past, ultra-short-dated options activity does not have a long-lasting impact. Rather, what is impactful is participants’ desire to carry exposure to options/protection that are farther-dated.
As put in yesterday’s letter, the contexts for a far-reaching rally are weak. A change in the bearish context is likely to coincide with charged options values (i.e., wound IVOL or big put delta) or some fundamental, macro-type catalyst. In the latter, a caveat is that IVOL compression, alone, likely does little to inspire a far-reaching rally.
Technical
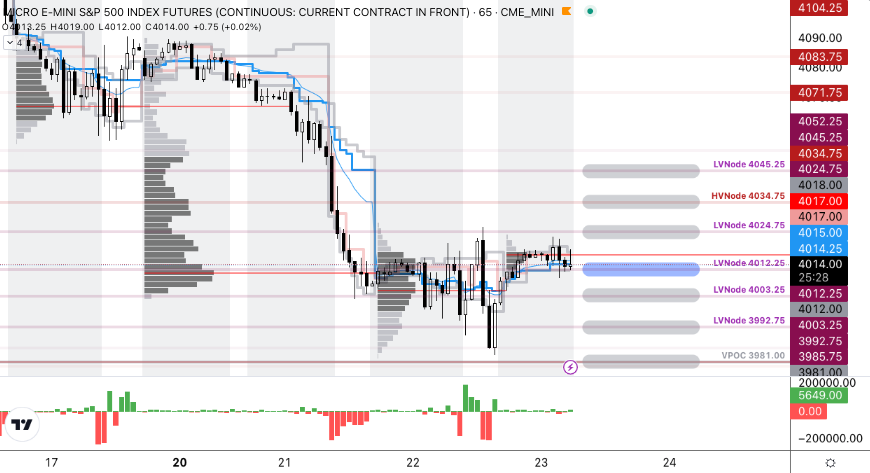
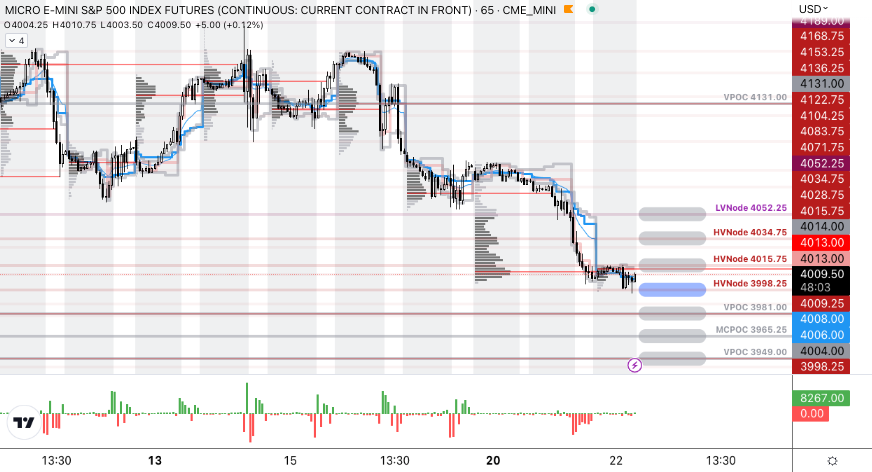
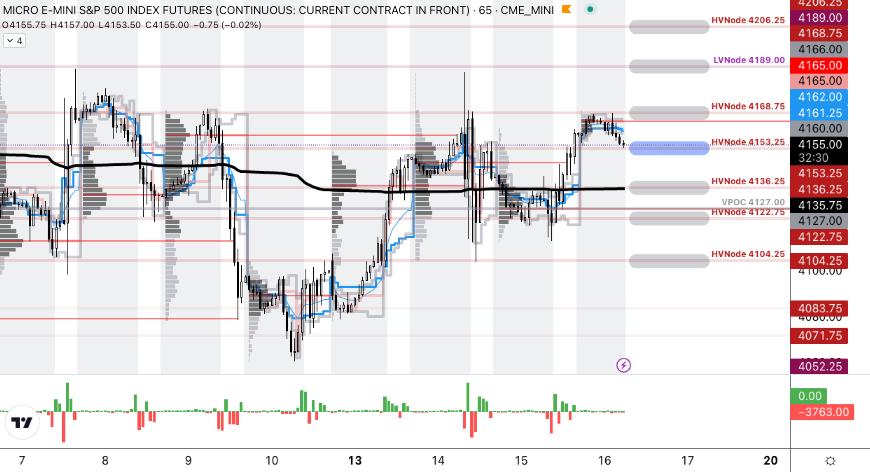
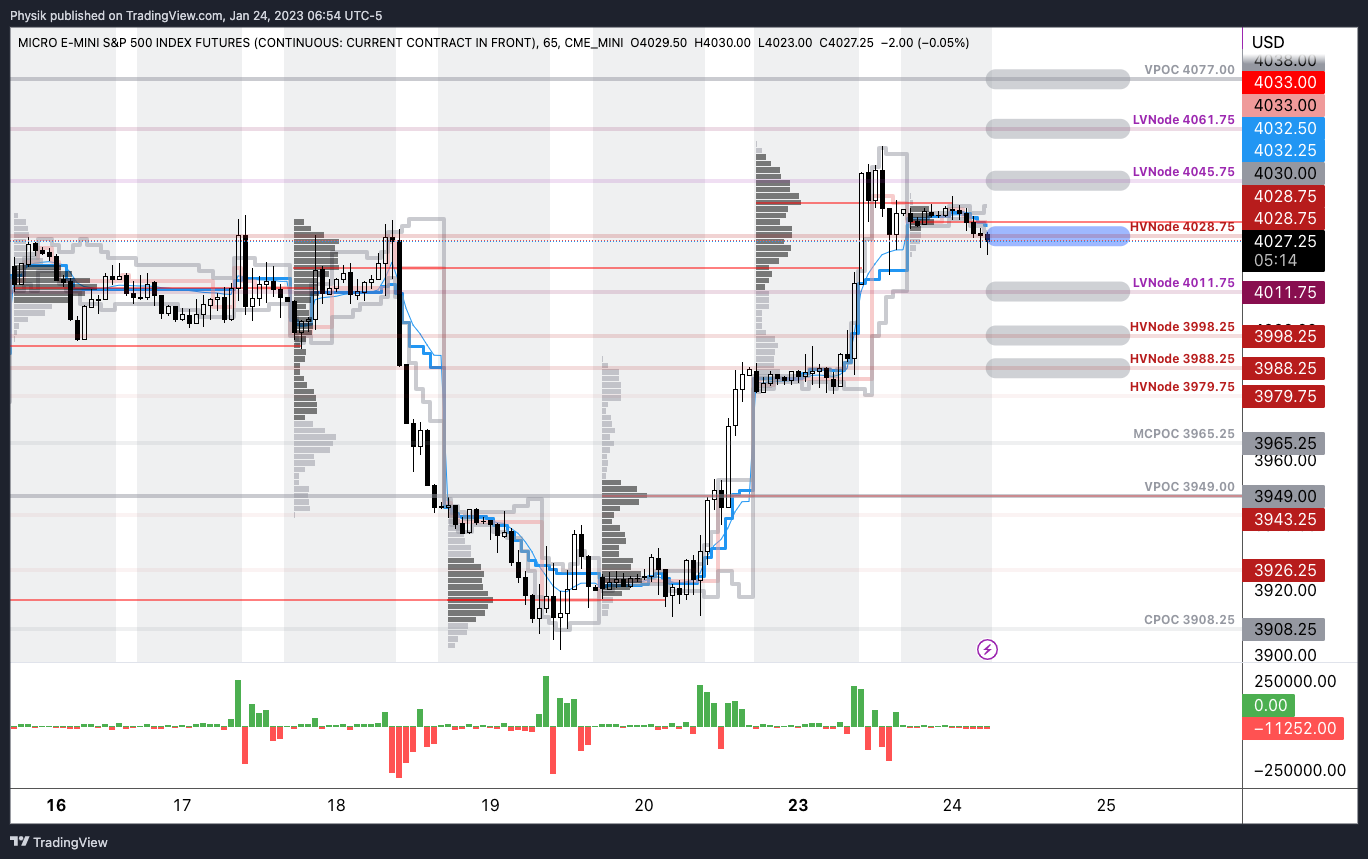
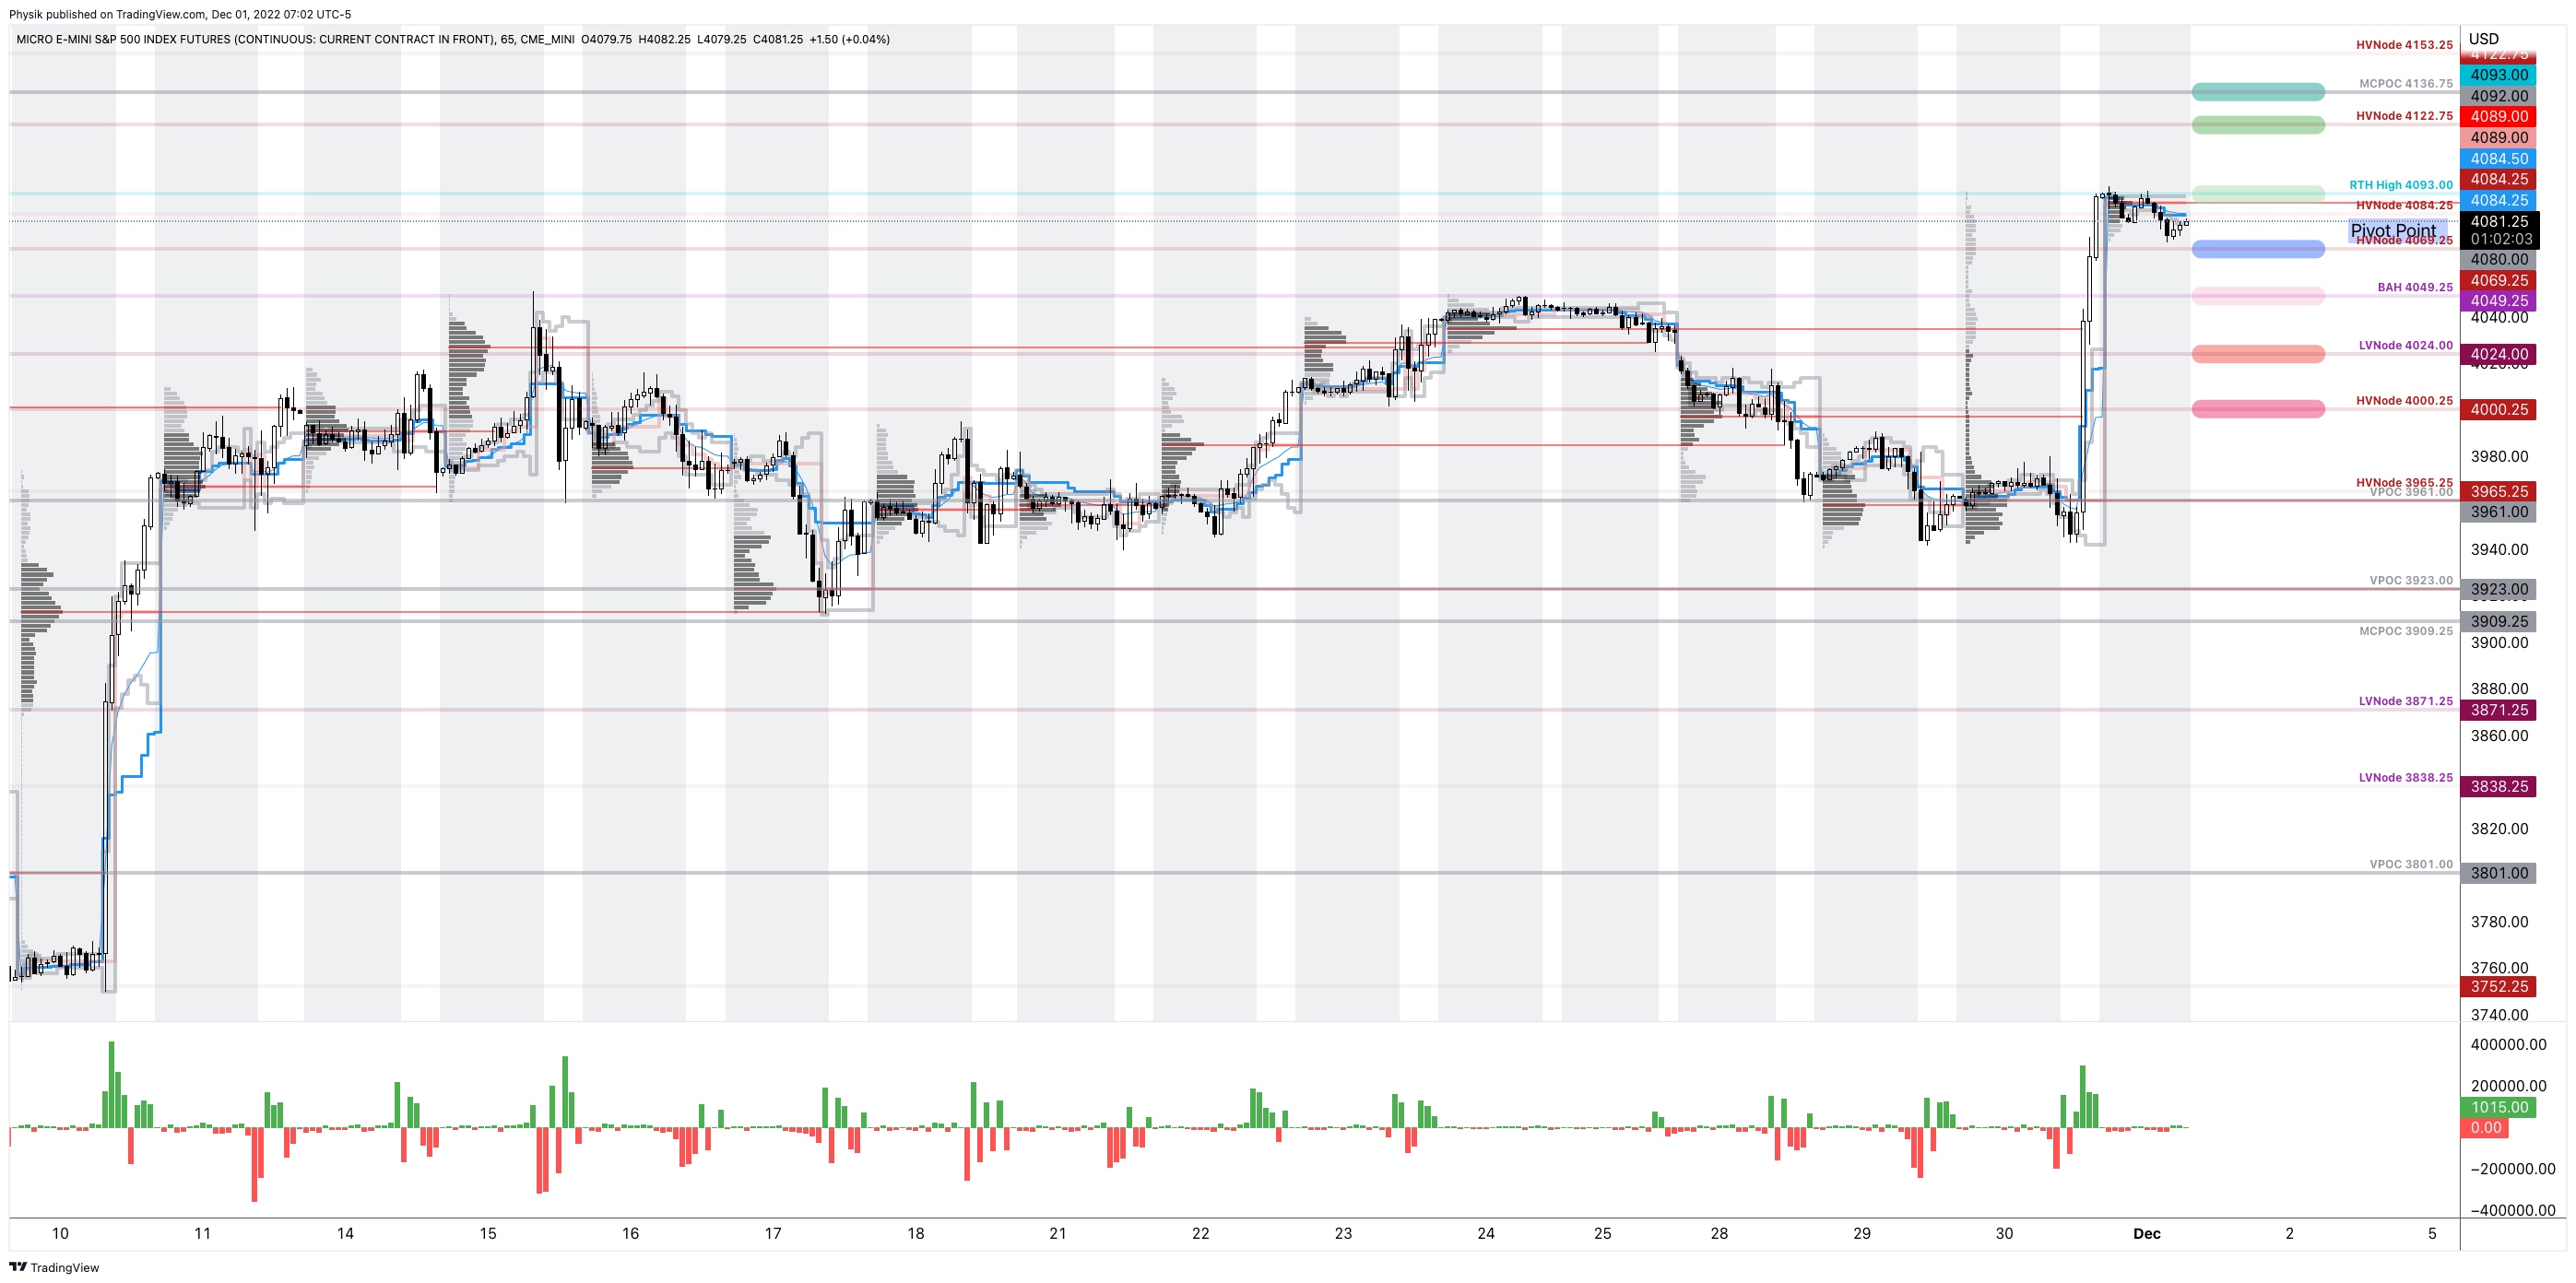
As of 7:30 AM ET, Friday’s regular session (9:30 AM – 4:00 PM ET), in the S&P 500, is likely to open in the lower part of a negatively skewed overnight inventory, inside of the prior day’s range, suggesting a limited potential for immediate directional opportunity.
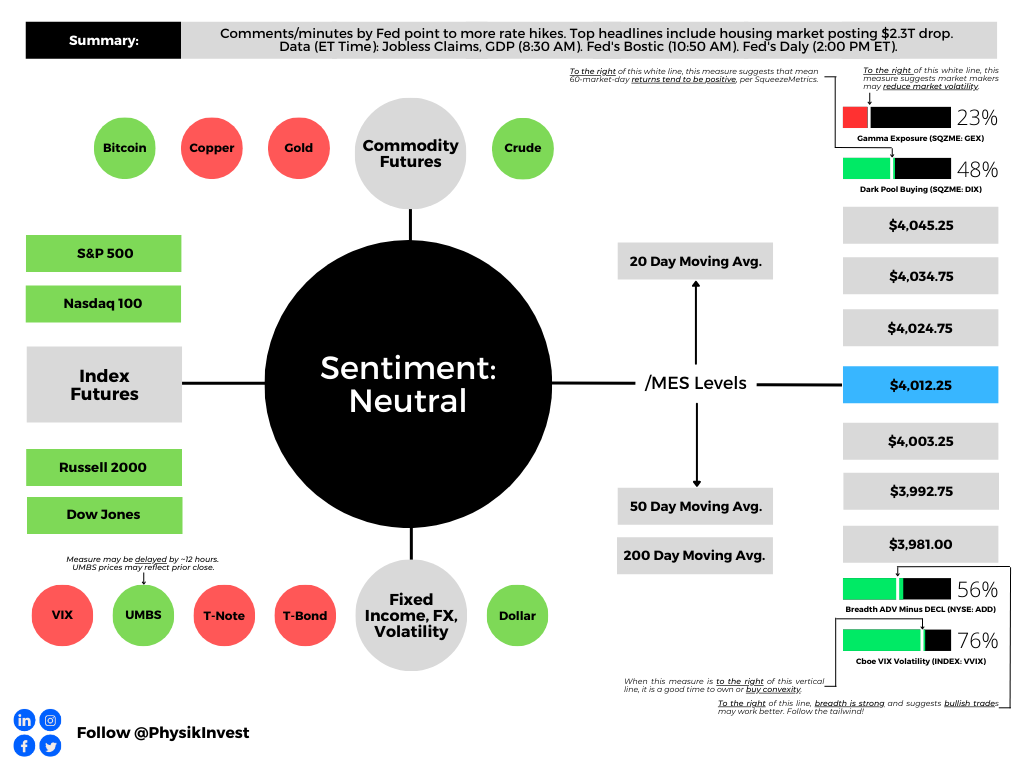
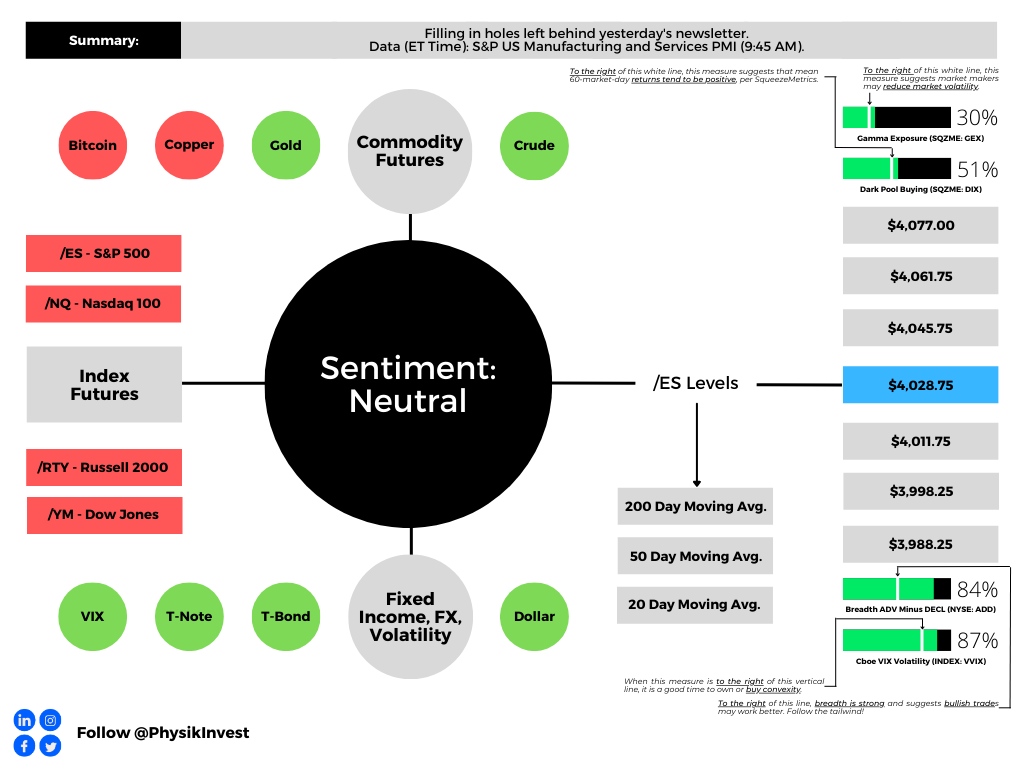
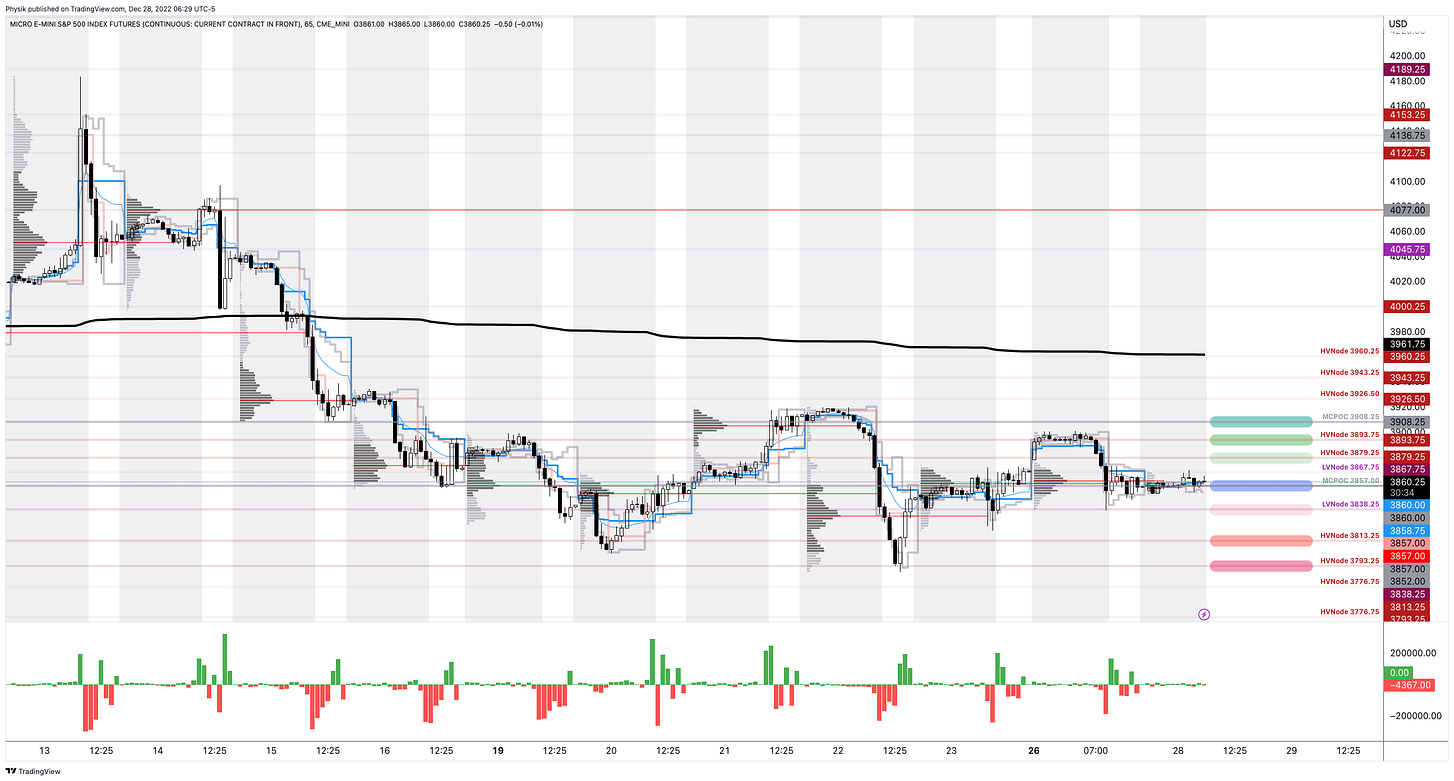
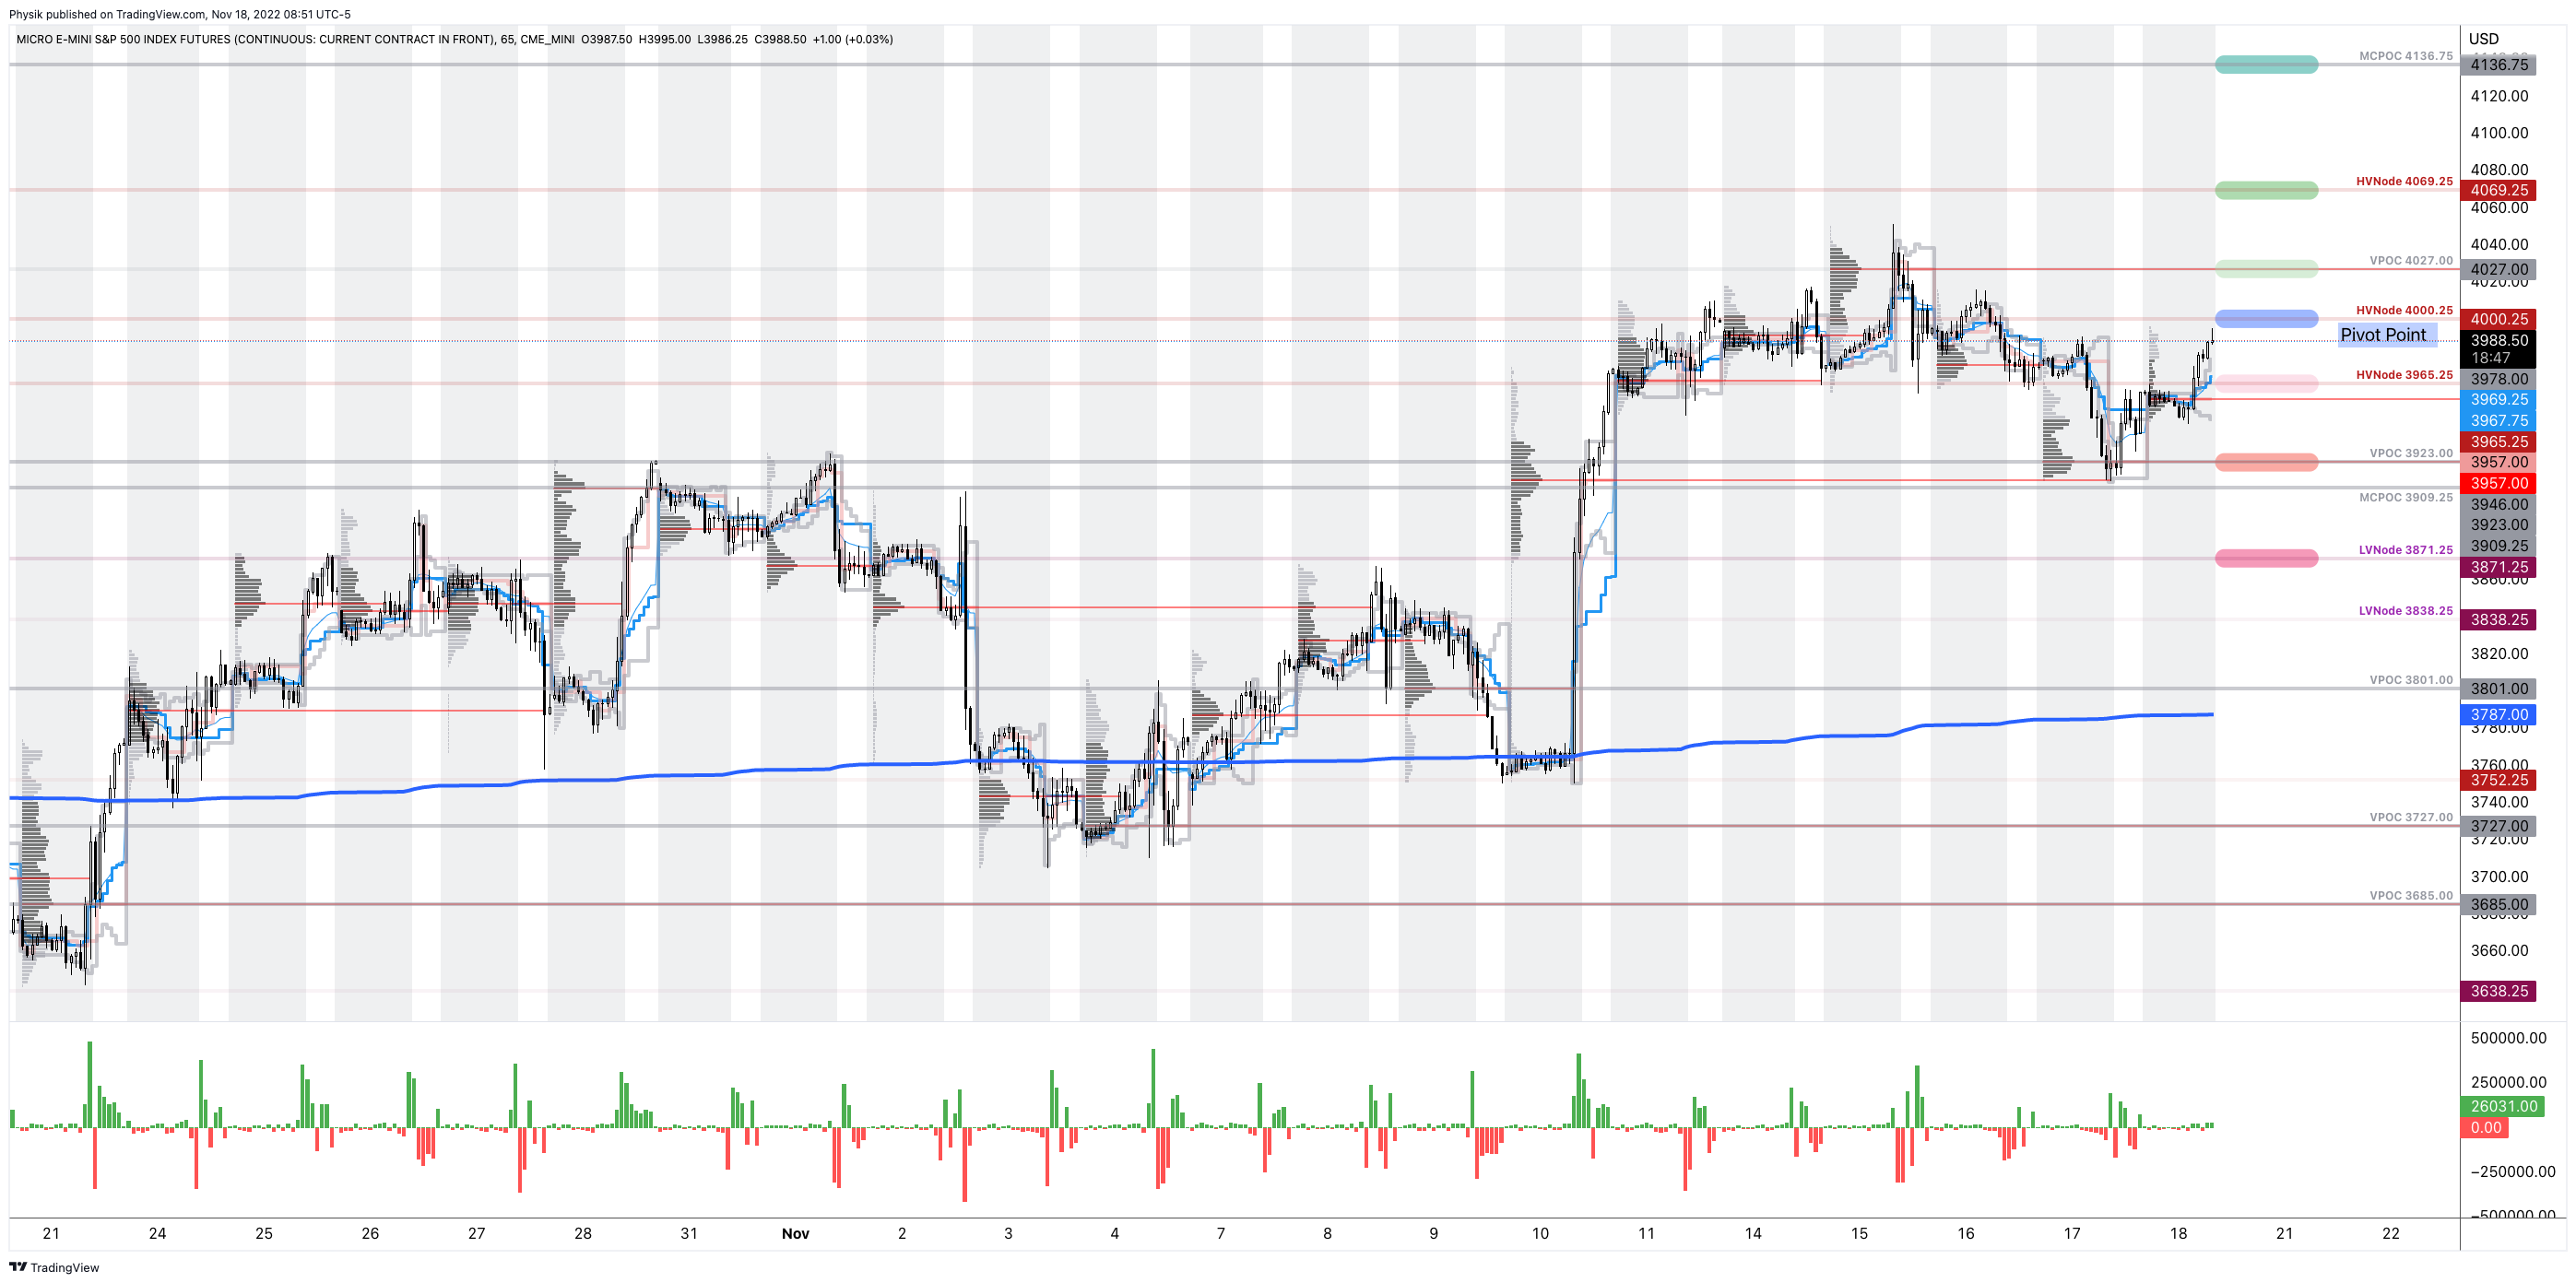
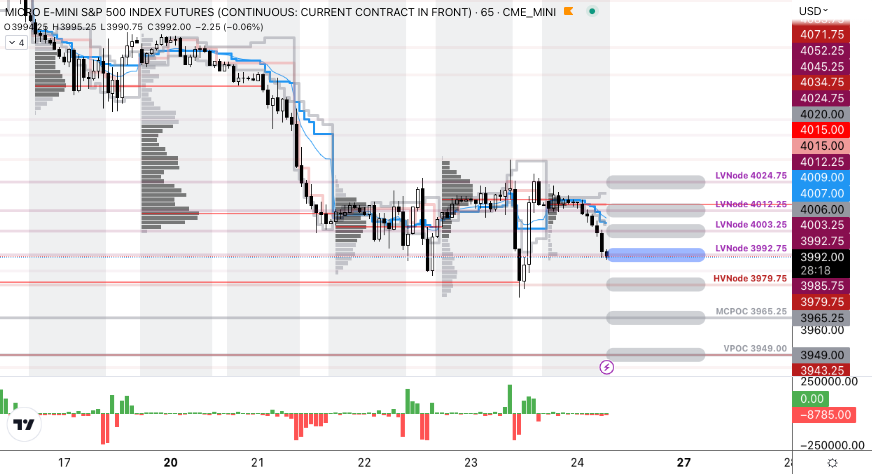
The S&P 500 pivot for today is $3,992.75.
Key levels to the upside include $4,003.25, $4,012.25, and $4,024.75.
Key levels to the downside include $3,979.75, $3,965.25, and $3,949.00.
Disclaimer: Click here to load the updated key levels via the web-based TradingView platform. New links are produced daily. Quoted levels likely hold barring an exogenous development.
Definitions
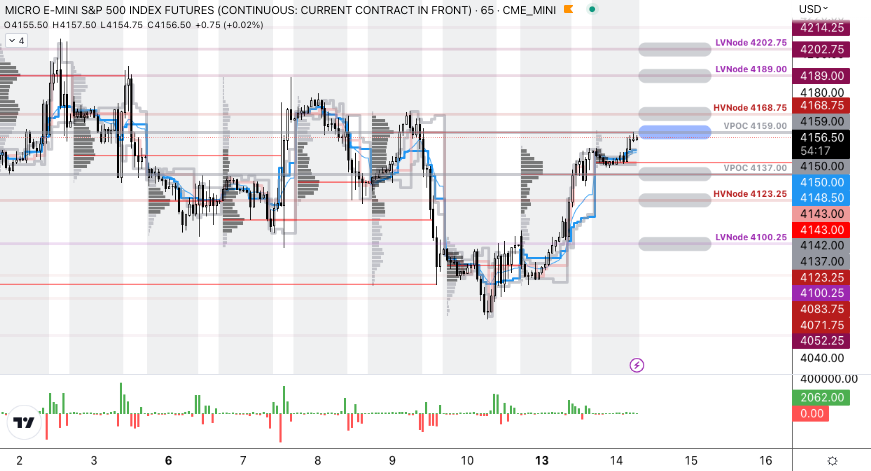
Volume Areas: Markets will build on areas of high-volume (HVNodes). Should the market trend for a period of time, this will be identified by a low-volume area (LVNodes). The LVNodes denote directional conviction and ought to offer support on any test.
If participants auction and find acceptance in an area of a prior LVNode, then future discovery ought to be volatile and quick as participants look to the nearest HVNodes for more favorable entry or exit.
POCs: Areas where two-sided trade was most prevalent in a prior day session. Participants will respond to future tests of value as they offer favorable entry and exit.
MCPOCs: Denote areas where two-sided trade was most prevalent over numerous sessions. Participants will respond to future tests of value as they offer favorable entry and exit.
About
The author, Renato Leonard Capelj, works in finance and journalism.
Capelj spends the bulk of his time at Physik Invest, an entity through which he invests and publishes free daily analyses to thousands of subscribers. The analyses offer him and his subscribers a way to stay on the right side of the market. Separately, Capelj is an options analyst at SpotGamma and an accredited journalist.
Capelj’s past works include conversations with investor Kevin O’Leary, ARK Invest’s Catherine Wood, FTX’s Sam Bankman-Fried, North Dakota Governor Doug Burgum, Lithuania’s Minister of Economy and Innovation Aušrinė Armonaitė, former Cisco chairman and CEO John Chambers, and persons at the Clinton Global Initiative.
Connect
Direct queries to renato@physikinvest.com. Find Physik Invest on Twitter, LinkedIn, Facebook, and Instagram. Find Capelj on Twitter, LinkedIn, and Instagram. Only follow the verified profiles.
Calendar
You may view this letter’s content calendar at this link.
Disclaimer
Do not construe this newsletter as advice. All content is for informational purposes. Capelj and Physik Invest manage their own capital and will not solicit others for it.