A big deal was made surrounding some data that shows investors increasing their bets on US equities falling; net short positions in the E-mini S&P 500 (FUTURE: /ES) are the highest since 2011, Bloomberg reports. JPMorgan Chase & Co (NYSE: JPM) and Goldman Sachs Group Inc (NYSE: GS) concur as their data showsclients betting on stocks falling or reducing stock exposure quickly.
This is happening in the context of some mixed, albeit still robust-leaning, data; payrolls upped bets that the Federal Reserve or Fed would move its target rate to 5.00-5.25%. GS’ Bobby Molavi adds, “the prevalent view seems to be that more things will break on the back of rapid rise in cost of capital.”
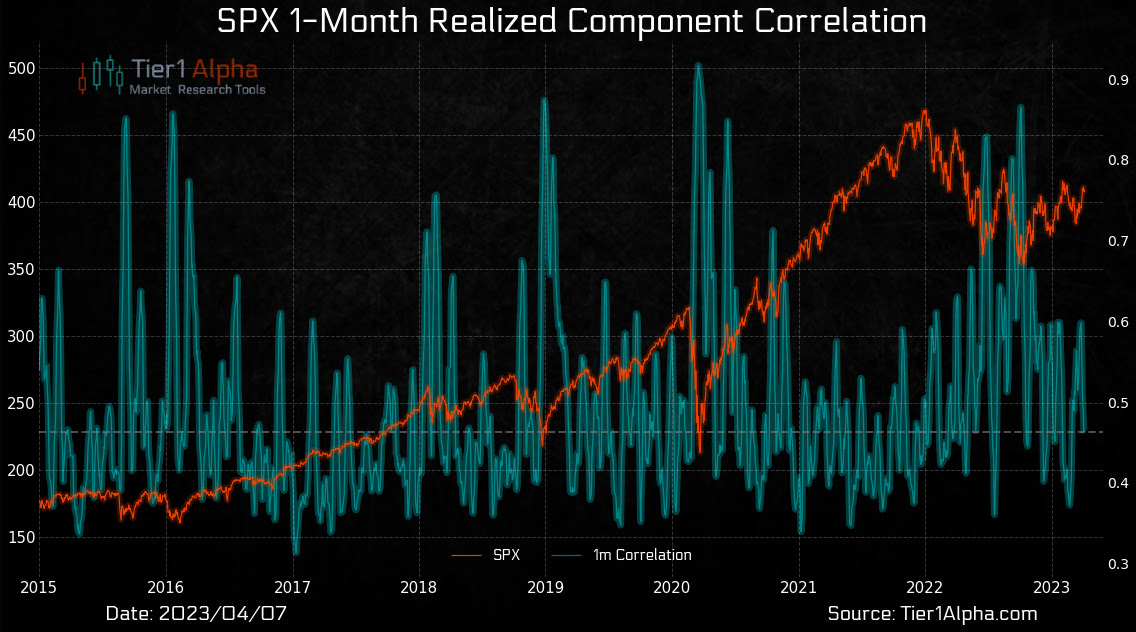
In light of the rate expectations, the Nasdaq 100 (INDEX: NDX) appears to be handing over the leadership baton to the S&P 500 (INDEX: SPX), though both indexes remain primarily intact and coiling; the fundamental-type pressures are balanced by follow-on support from those actors that base their decisions on such things as the amount a market moves (i.e., realized volatility or RVOL), says Tier1Alpha and SpotGamma.
The two providers of market insights see falling implied (IVOL) and RVOL as catalysts for buying stocks. This, coupled with the hedging of soon-to-expire large options open interest, particularly on the put side, in a lower liquidity environment, supports the indexes while underlying breadth and correlations are underwhelming.
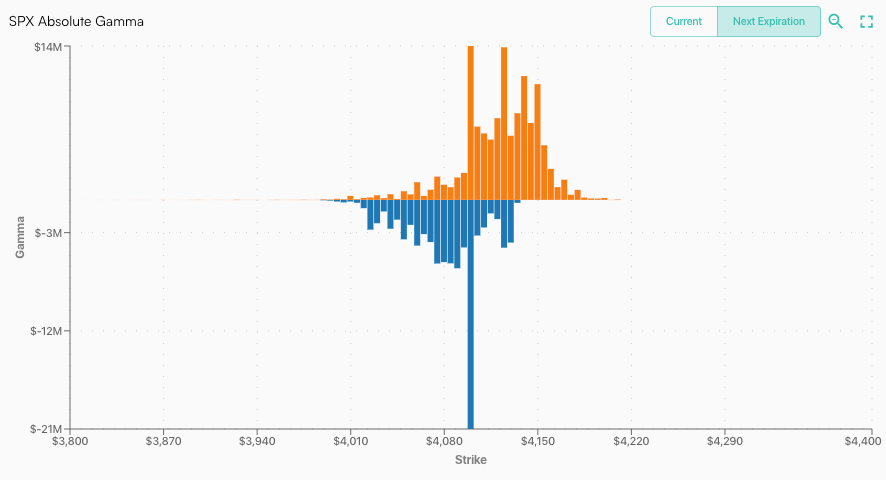
A large concentration of put open interest near current prices is pictured just below. The eventual removal of this put-heavy positioning will reduce some directional risks to options counterparts; as puts disappear or decline in value, their delta or exposure to direction does too. If a counterparty is short a put and has less positive delta to hedge, they may buy back some of their short-delta exposure in the underlying index, a catalyst for higher S&P 500 prices.
Graphic: Retrieved from SpotGamma.
A large open interest concentration set to roll off this April is pictured just below.
Retrieved from SpotGamma.
This has happened before. Newfound Research explains it best in their paper titled “Liquidity Cascades: The Coordinated Risk of Uncoordinated Market Participants.”
In keeping the indexes and their underlying idiosyncratic baskets in line via arbitrage constraints, while there is a build-up of suppressive and supportive dealer hedging at the index level, “then the only reconciliation is a decline in correlation.”
In this context, Tier1Alpha explains, “lower correlations tend to lead to lower volatility … giv[ing] volatility control funds the go-ahead to augment their risk exposure, with an estimated $14 billion in equities purchases … to be spread out in blocks.”
Consequently, in line with our thesis that positioning and technical contexts support near-term strength, it still makes sense to take the profits of very wide, albeit low- or zero-cost, call ratio spread structures discussed in past letters to cut the cost of our bets on the equity market downside and lower rates with more time to expiry. Should the indexes trade higher, SpotGamma agrees with Kai Volatility’s Cem Karsan that volatility could be sticky.
Hence, call structures could keep their value better and enable us to lower the cost of our bets on the market downside. If the fundamental context supporting the rotation of call option profits into puts is no longer valid, then the losses on such trades are limited; the money is made in not losing it.
Graphic: Retrieved from SpotGamma’s Weekend Note.
Not doing as outlined and blindly buying put options to protect long equity exposure is generally a poor-performing strategy, despite the performance claims of some funds specializing in that practice.
Graphic: Retrieved from QVR Advisors via Bloomberg. “Buying puts is a money-losing proposition when considered in isolation. Chart shows the performance of hedges rolled every quarter with delta hedging, as a percentage of notional amount protected.”
About
Welcome to the Daily Brief by Physik Invest, a soon-to-launch research, consulting, trading, and asset management solutions provider. Learn about our origin story here, and consider subscribing for daily updates on the critical contexts that could lend to future market movement.
Separately, please don’t use this free letter as advice; all content is for informational purposes, and derivatives carry a substantial risk of loss. At this time, Capelj and Physik Invest, non-professional advisors, will never solicit others for capital or collect fees and disbursements. Separately, you may view this letter’s content calendar at this link.
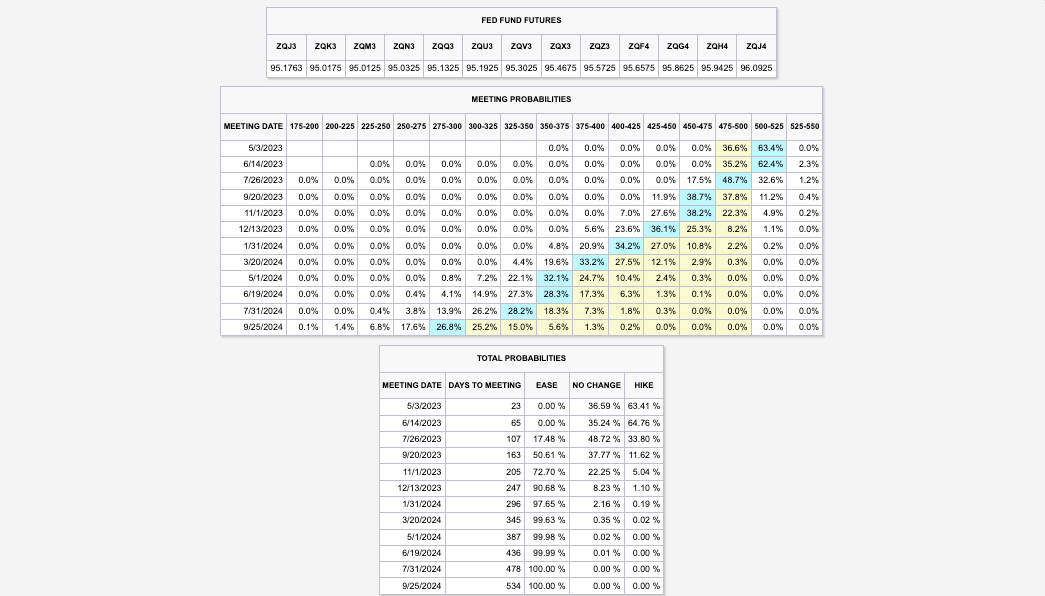
US payroll data has increased the possibility of a rate hike by the Federal Reserve or Fed in early May, leading to higher rates and affecting those who expected a pause or pivot through poorly performing yield curve steepener trades. The market expects the Fed to raise its target rate to 5.00-5.25% and keep it there through mid-year.
Graphic: Retrieved from CME Group Inc’s (NASDAQ: CME) FedWatch Tool.
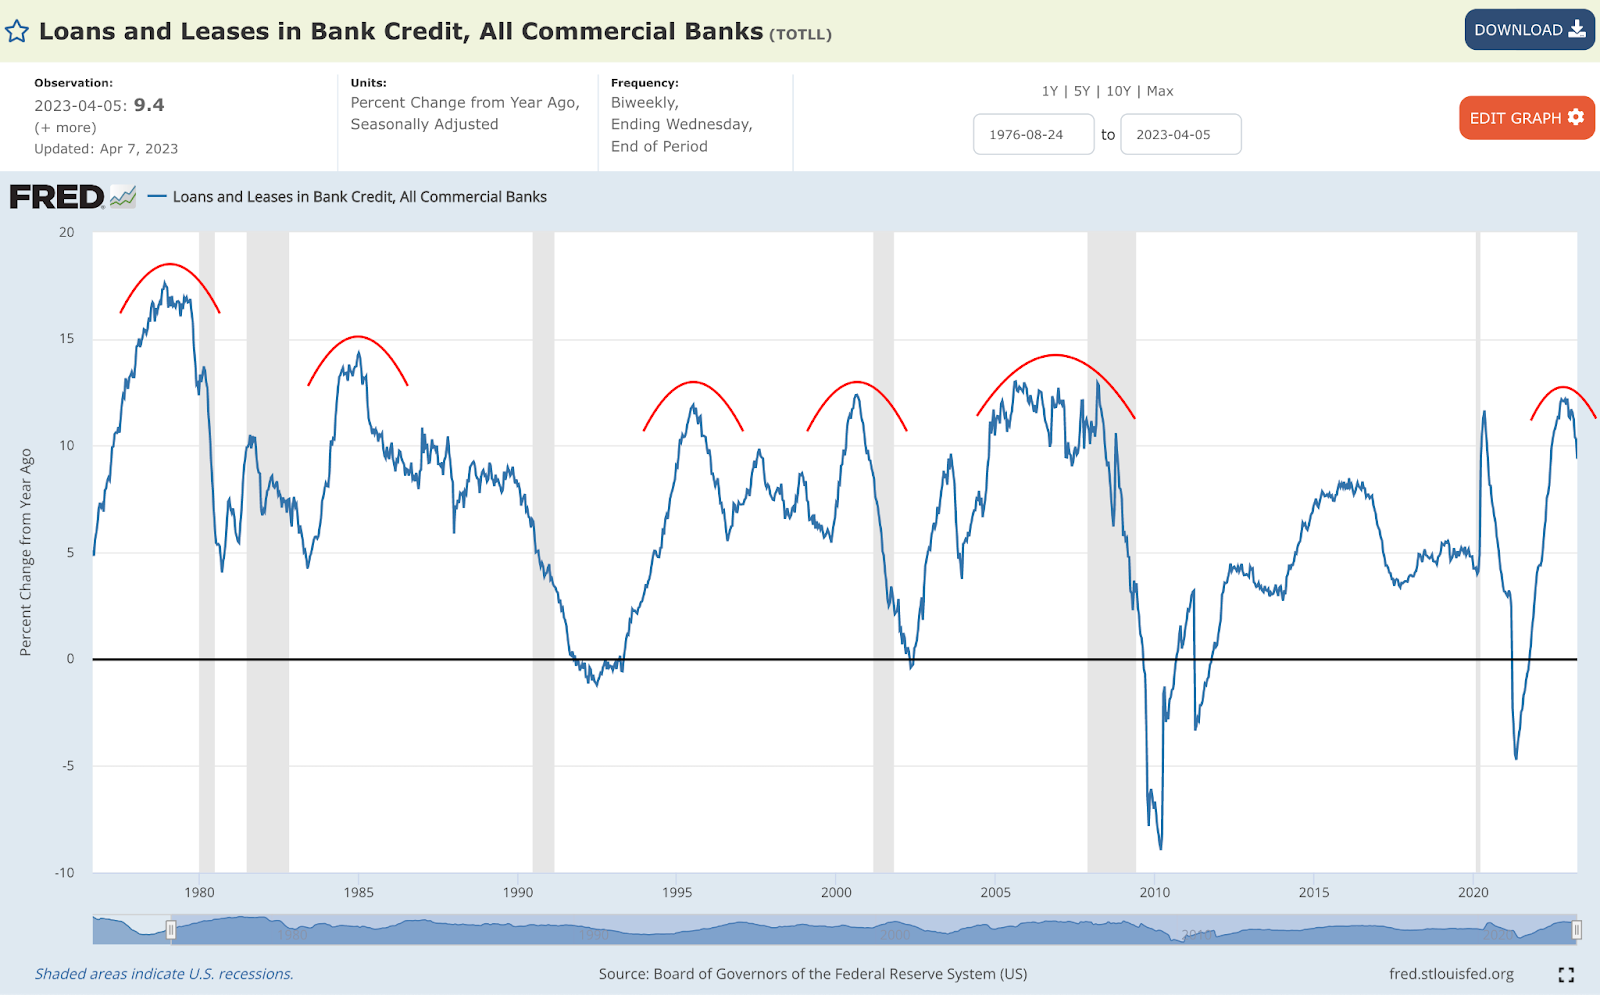
There is more to the pressure than just yields. Surveys indicate a drop in profits for sensitive areas of the equity market, such as technology and banks; as soon as the labor market starts softening, a credit crunch is expected to accelerate by some.
Graphic: Retrieved from the St. Louis Fed via Cubic Analytics.
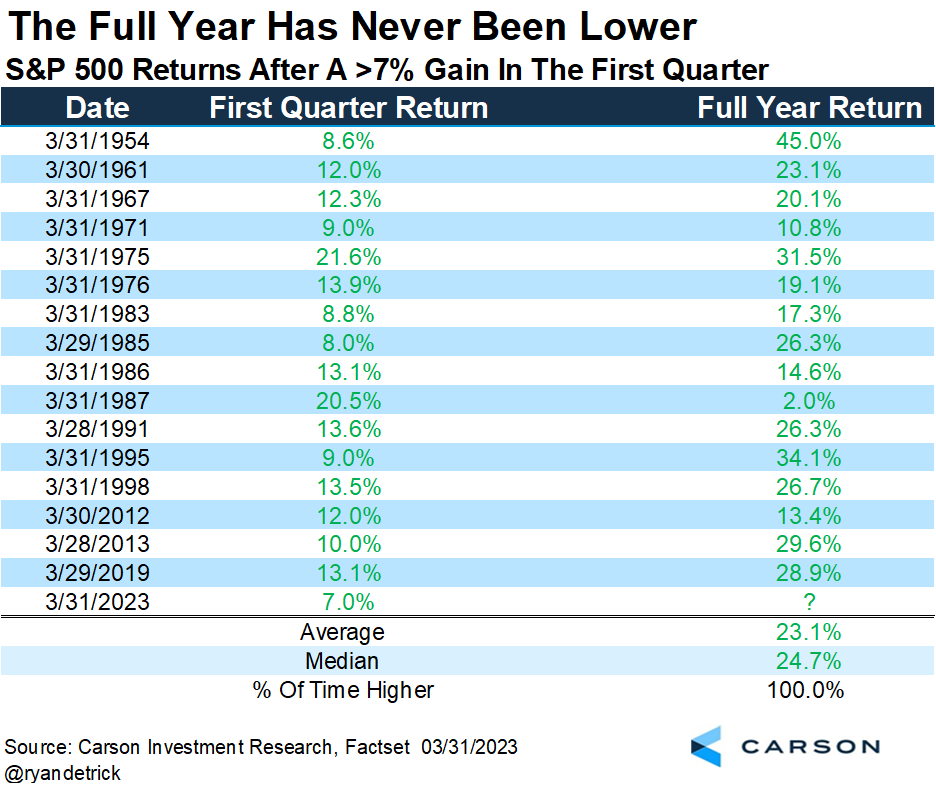
Despite the turbulence from earnings, data suggests the S&P 500 (INDEX: SPX) may perform well through year-end. Historically, the full-year return was always positive when the S&P 500 had a positive first quarter. However, there have been exceptions, says Callum Thomas, quoting data gathered by Ryan Detrick.
Graphic: Retrieved from Ryan Detrick via Callum Thomas’ Weekly S&P 500 ChartStorm.
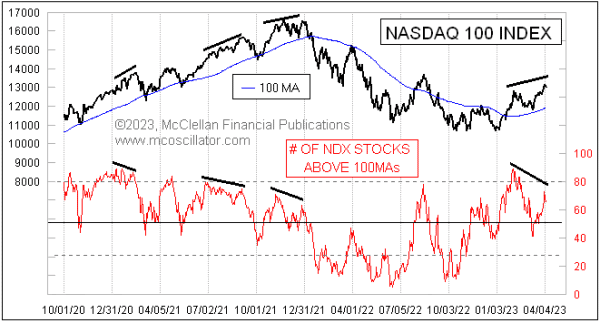
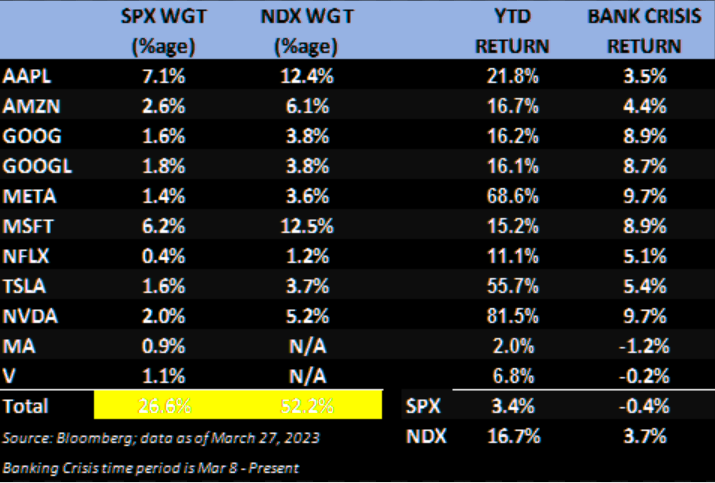
Peeking beneath the hood, only a few (primarily rate-sensitive) stocks have bolstered recent index strength; many components are not participating in the rally, which could be a harbinger of potential post-earnings weaknesses.
Graphic: Retrieved from McClellan Financial Publications.
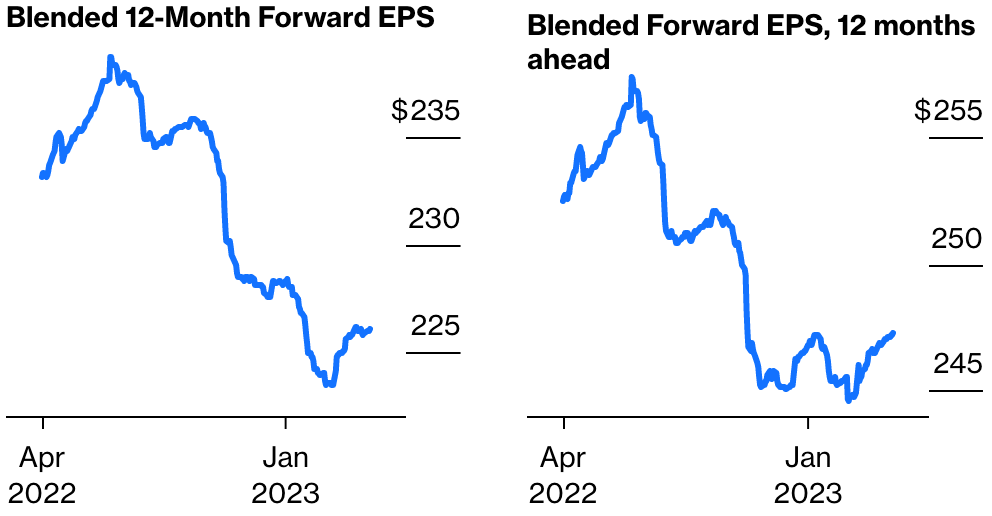
Notwithstanding, if rates continue to fall, so do borrowing costs; falling inflation cuts pressures on input cost; rising unemployment helps keep labor costs under control, Bloomberg reports. The forecasts (not surveys) actually show earnings holding up better than the narrative suggests.
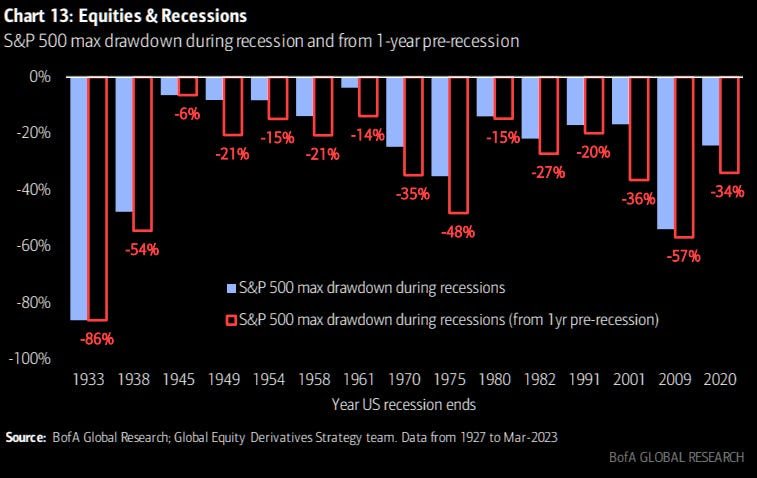
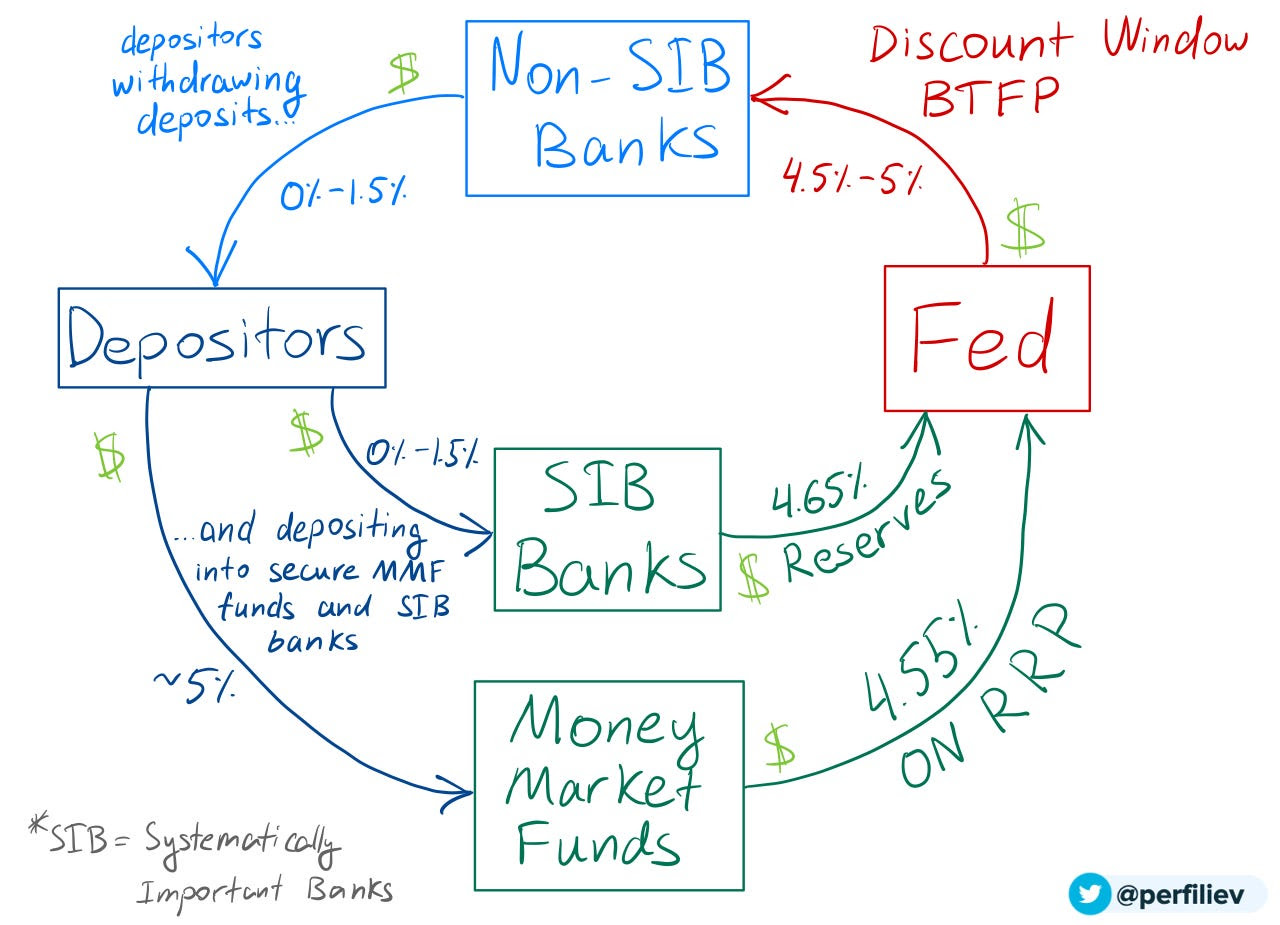
So what, then? In an annual report, JPMorgan Chase & Co (NYSE: JPM) concludes that if “we have higher inflation for longer, the Fed may be forced to increase rates higher than people expect despite the recent bank crisis.” Compounding the rate hikes is quantitative tightening or QT, the process of a central bank reducing the amount of money it has injected into an economy by selling bonds or other financial assets, which “may have ongoing impacts that might, over time, be another force, pushing longer-term rates higher than currently envisioned.” The net effect, though insights gleaned from the curve may be muddied due to the scale of recent interventions, is an “inverted yield curve [implying] we are going into a recession” and lower credit creation because, as Sergei Perfiliev well puts it, “if capital ends with the Fed, it is dead – it has left the economy and the banking system.”
Graphic: Retrieved from Bank of America Corporation (NYSE: BAC) via TheMarketEar.
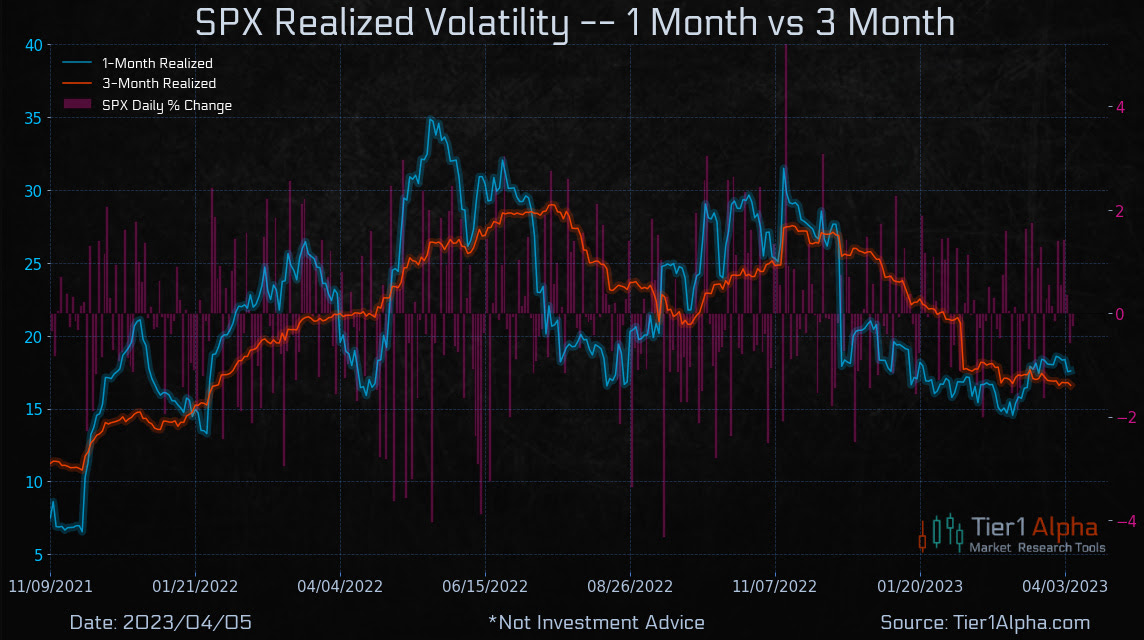
How do we position ourselves, given all these narratives? Equity volatility implied (IVOL) and realized (RVOL) decreased. This may continue to be a booster. In fact, “if markets remain within a +/-1.5% range, a drop in volatility could trigger significant buying activity from the vol-control space, with up to $14 billion in notional flows hitting the tape, creating a favorable environment for equities,” says Tier1Alpha.
So, positioning-wise, stocks could trade up into a “more combustible” state where “volatility is sticky into a rally,” as Kai Volatility’s Cem Karsan said would happen.
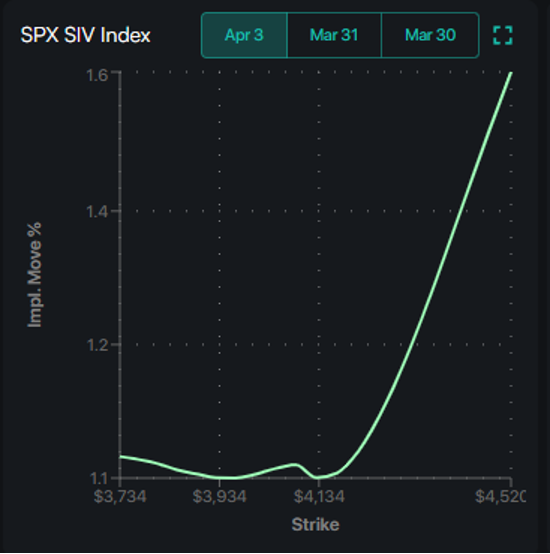
SpotGamma confirms that, based on current positioning, SPX IVOL is projected to move up as the underlying index moves up; there are likely many people chasing the rally with long calls, “creating a swelling of call skew.”
In this environment, very wide call ratio spread structures discussed in past letters may continue to do well. We can use the profits from those call structures to cut the cost of our bets on the equity market downside and lower interest rates.
Graphic: Retrieved from SpotGamma’s Weekend Note.
About
Welcome to the Daily Brief by Physik Invest, a soon-to-launch research, consulting, trading, and asset management solutions provider. Learn about our origin story here, and consider subscribing for daily updates on the critical contexts that could lend to future market movement.
Separately, please don’t use this free letter as advice; all content is for informational purposes, and derivatives carry a substantial risk of loss. At this time, Capelj and Physik Invest, non-professional advisors, will never solicit others for capital or collect fees and disbursements. Separately, you may view this letter’s content calendar at this link.
Welcome to the Daily Brief by Physik Invest, a soon-to-launch research, consulting, trading, and asset management solutions provider. Learn about our origin story here, and consider subscribing for daily updates on the critical contexts that could lend to future market movement.
Tomorrow’s Good Friday, and some markets, including the US’s equity market, will be closed. The Treasury market will remain open, albeit for less time, and may enable traders to price the impacts of coming releases, including non-farm payrolls (NFP). The consensus is that the US added 235,000 jobs in March, with the unemployment rate expected to remain steady at 3.50%. Higher for longer, then? We shall see.
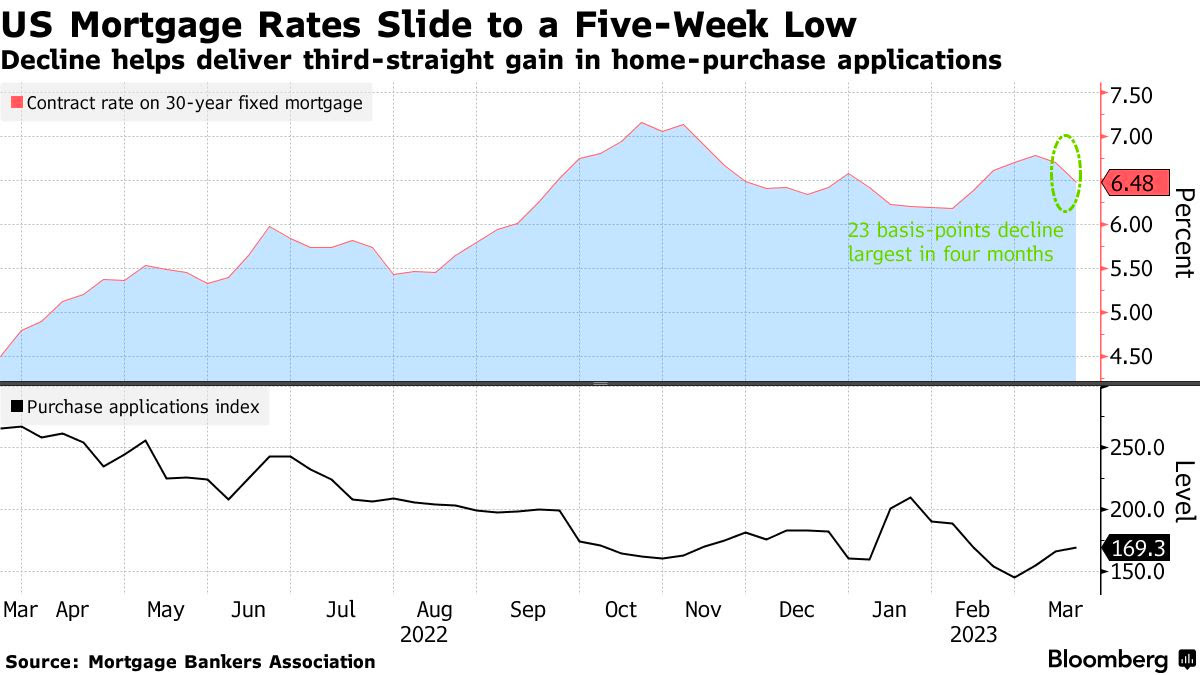
Moreover, the big news is that the trend in mortgage rates, followed closely in the US, continues to be down. US 30-year fixed mortgage rates fell for a fourth-straight week, though applications to buy and refinance a home declined for the first time in a month. However, borrowing costs remain generally high and housing inventory low, keeping a cap on homebuying activity.
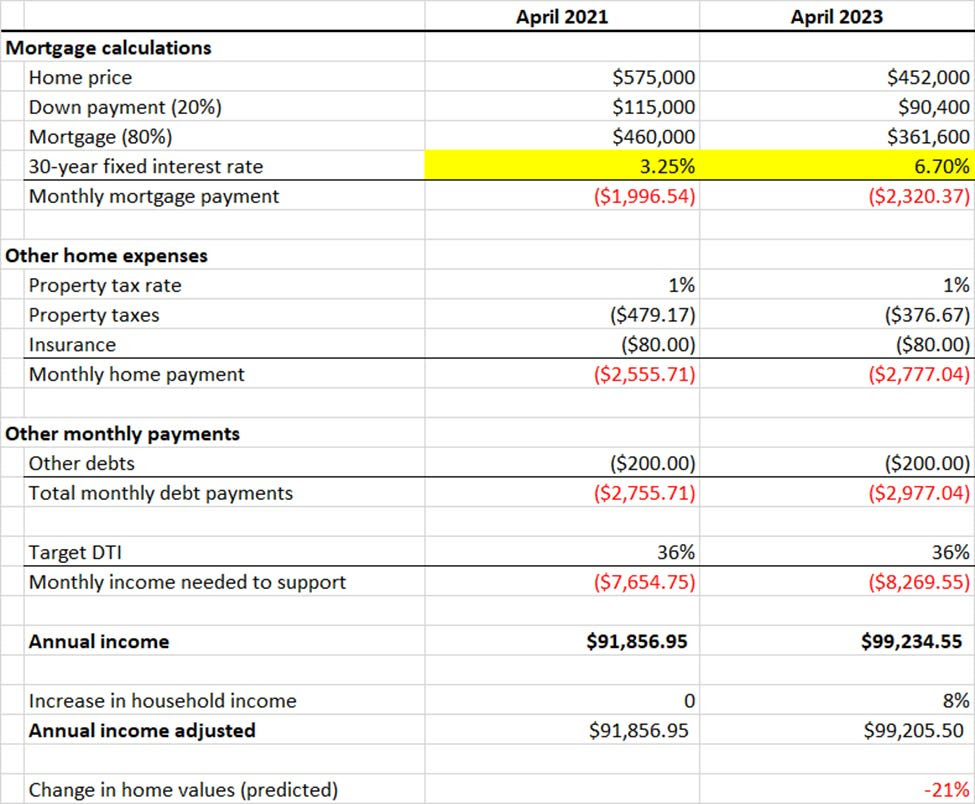
Notwithstanding, as explained by Akash Kanojia, for the housing market to “clear” on today’s affordability, home prices need to fall by about 20.00%.
To explain, typically, banks use a debt-to-income ratio to determine how much they will lend to a borrower to buy a house. Adding, they could enforce a limit of 80% on the purchase price of the house, and the remaining 20.00% is paid in cash by the borrower as a down payment.
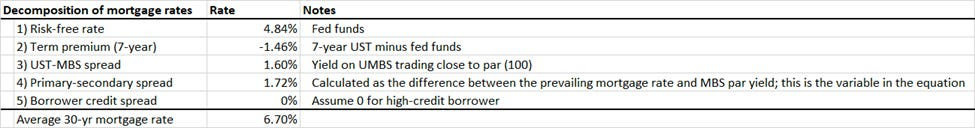
Mortgage rates comprise the short-term risk-free rate, term premium, the Treasury-MBS spread, the primary-secondary spread, and a credit spread based on the borrower’s creditworthiness. Any of these numbers changing can influence a borrower’s final payment to the lender.
Graphic: Retrieved from Negative Convexity.
An analysis starting with a home price in 2021 of $575,000.00 and a borrower whose income was $92,000.00, and adjusting all for inflation and movements in rates, the decrease in home values to boost affordability is 21.00%.
Graphic: Retrieved from Negative Convexity. “To do this analysis, I started with a home price in April 2021[1]($575,000) and figured out how much annual income a borrower would have needed at that time to buy the house (~$92,000). I then adjusted the annual income up by 8% for 2023, extrapolating from this, resulting in a person that would have earned ~$92,000 earning $99,205 today. Then I calculated how much house a person earning $99,205 can afford today at a mortgage rate of 6.70% ($452,000). Divide the two, and you get a decrease of 21%.”
A worst-case scenario is that the fed funds rate rises further to quell inflation. If the fed funds rate were to rise to 6.00-6.25%, matching the latest annualized CPI print, and “the market realizes the Fed is not going to cut, and the curve (e.g., 3m-7y UST) steepens to historical norms (~150 basis points long-term average), barring changes in the MBS spread, primary-secondary spread, and credit charges, this produces a ~40.00% decline in home prices.
Graphic: Retrieved from Negative Convexity.
Consequently, as the economy slows and layoffs increase, as we’re starting to see, it will negatively affect housing demand and affordability due to income stability and growth. On the bright side, inflation destroys the nominal value of debt, Kanojia says. Assuming wages keep up, buyers in hot markets may be spared if they can withhold from selling at market-clearing prices, Kanojia ends.
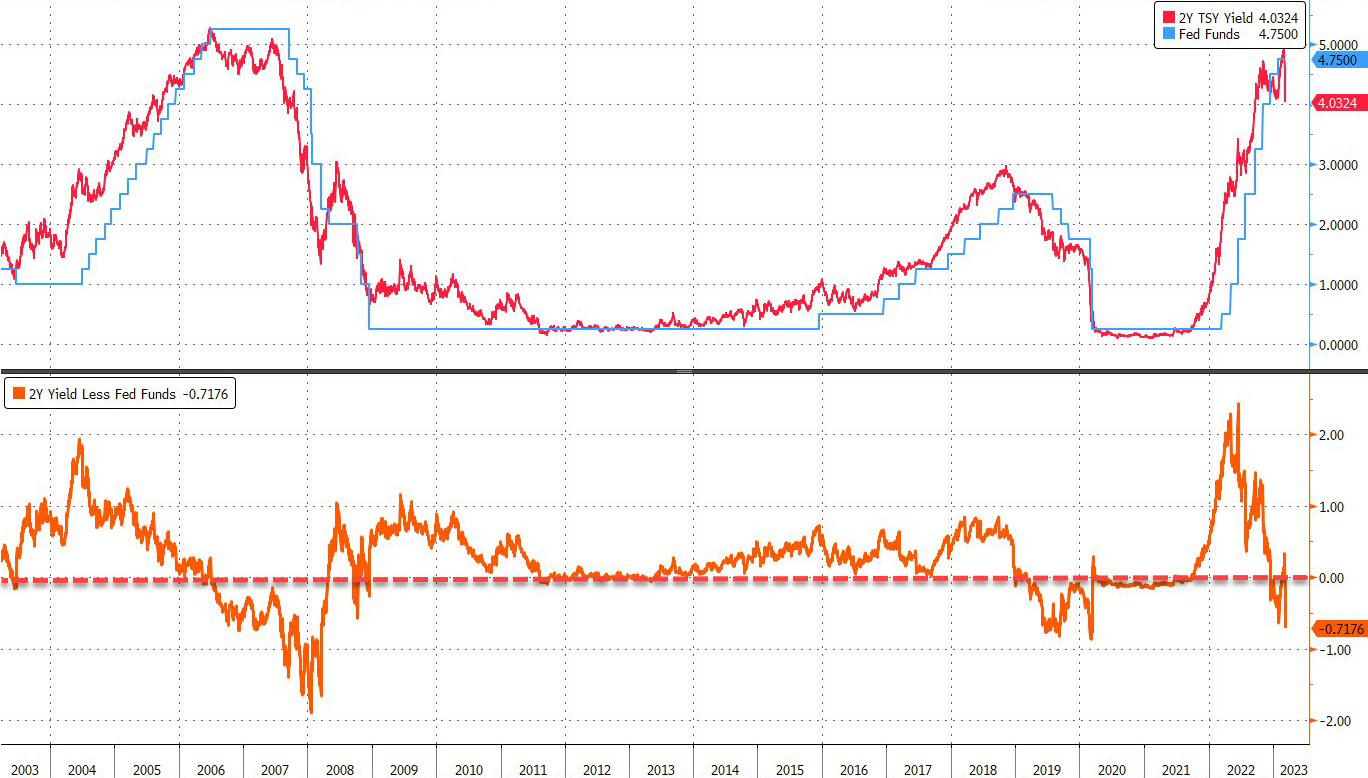
On a note about the doom and gloom (i.e., economy slowing and layoffs increasing, as well as yield curve steepening), JPMorgan Chase & Co’s (NYSE: JPM) Jamie Dimon says the following:
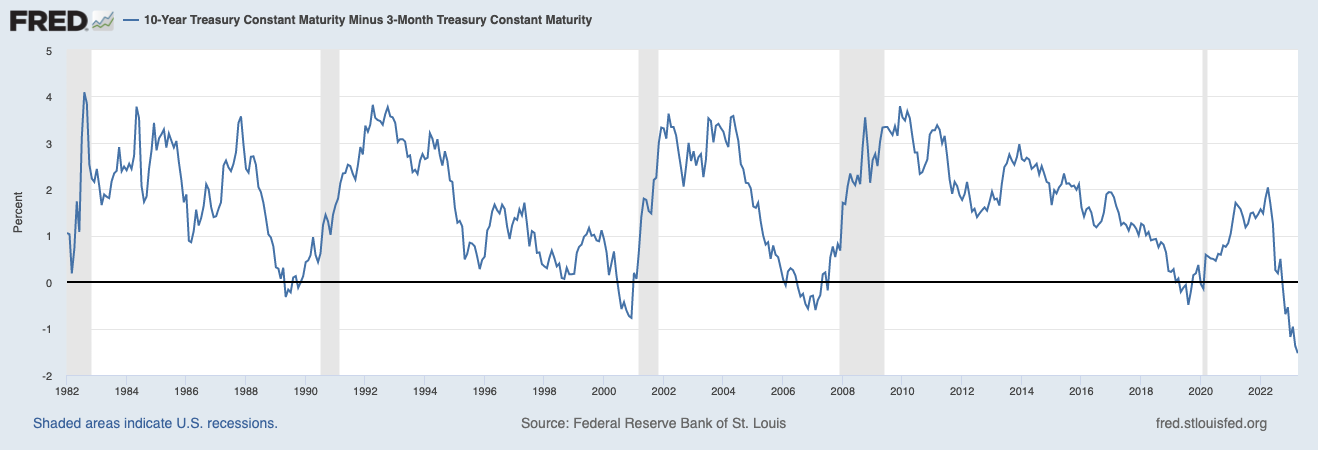
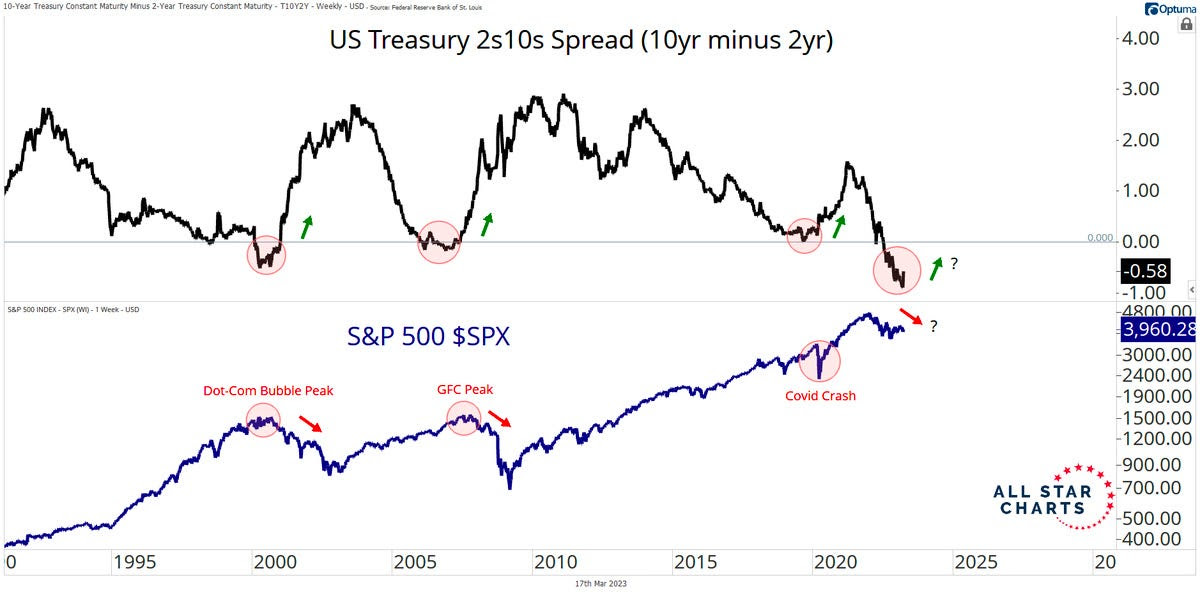
Today’s inverted yield curve implies that we are going into a recession. As someone once said, an inverted yield curve like this is ‘eight for eight’ in predicting a recession in the next 12 months. However, it may not be true this time because of the enormous effect of QT. As previously stated, longer-term rates are not necessarily controlled by central banks, and it is possible that the inversion we see today is still driven by prior QE and not the dramatic change in supply and demand that is going to take place in the future.
Dimon, the CEO of JPM, says that a graph showing the yields on bonds of different maturities is inverted, meaning that the yields on shorter-term bonds are higher than the yields on longer-term bonds. An inverted yield curve has often been a reliable indicator of an upcoming recession; it reflects investor demands for higher returns on short-term investments and expectations that short-term rates will fall in the future, which happens when the central bank cuts rates in response to a weak economy.
In other words, the conditions around the yield curve inversion are different this time.
Graphic: Retrieved from the Federal Reserve Bank of St. Louis. A normal yield curve is upward-sloping, meaning long-term interest rates are higher than short-term rates; investors demand a higher return for tying up their money for a longer period; the spread between the 10-year and 3-month treasury yield is positive.
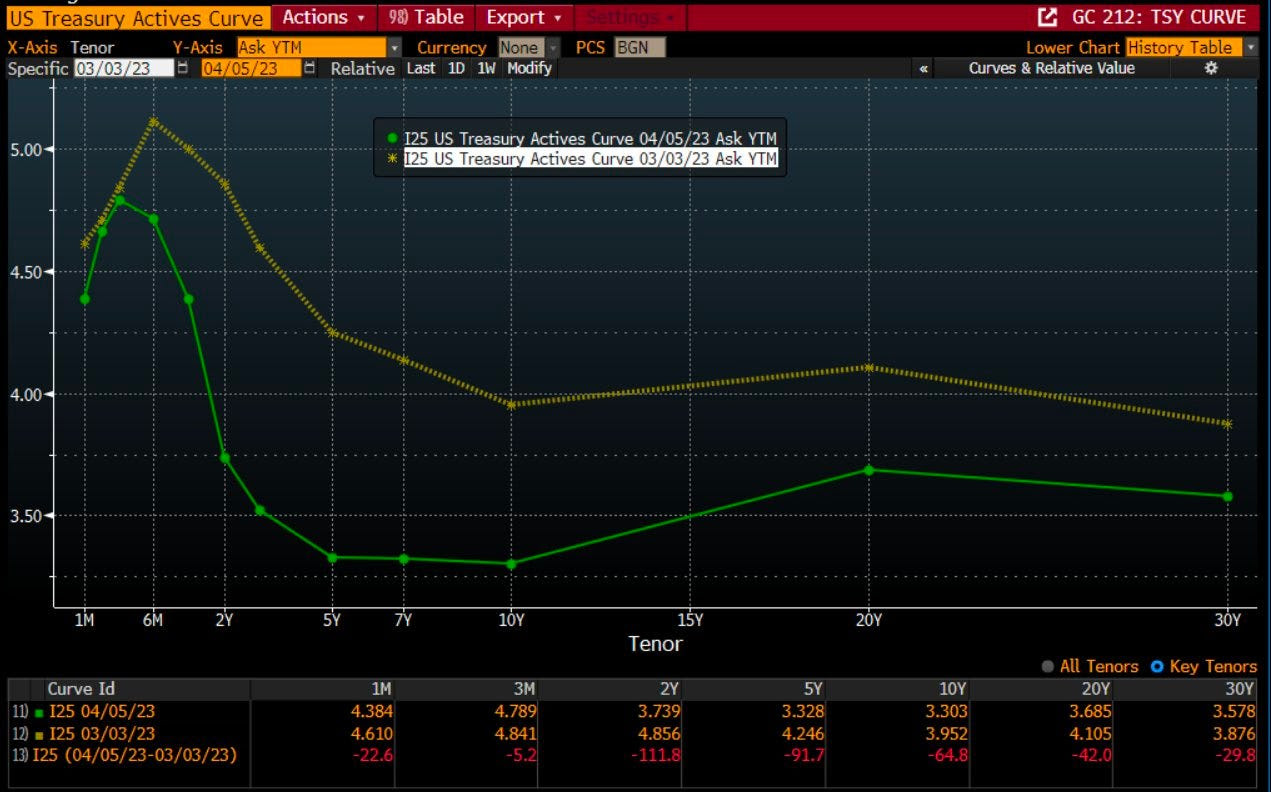
Further, a peek at the bond market shows cuts priced within six months.
Graphic: Retrieved from Bloomberg via @TheBondFreak.
Same thing with the Secured Overnight Financing Rate (SOFR) market, developed by the Federal Reserve to replace LIBOR, which was phased out due to manipulation concerns, among other things, as a benchmark interest rate.
Unlike LIBOR, which is based on unsecured lending transactions between banks, SOFR is based on actual transactions in the overnight repurchase agreement (repo) market, which makes it a more reliable benchmark. Consequently, the shift from the Eurodollar (FUTURE: /GE), used to intervene in support of the dollar and other currencies and allow lenders to lock in rates, to SOFR has accelerated, too.
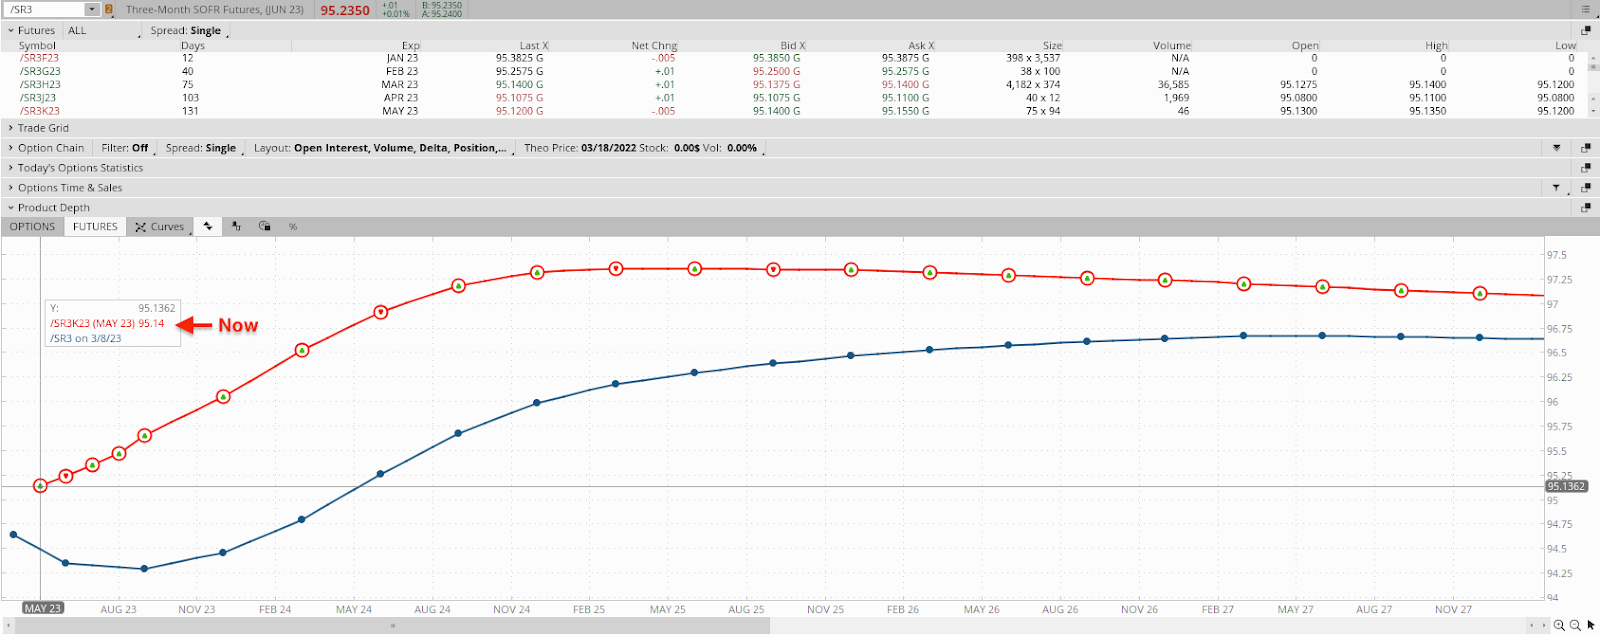
As stated yesterday, options activity in the SOFR market was centered around the 95.00 strikes. To calculate the implied interest rate using the value of the 3-month SOFR future, we can use the following formula:
Implied interest rate = 100 – future price; the implied interest rate calculated using the 3-month SOFR future is an annualized rate.
For example, if the current value of the 3-month SOFR future is 95.00, the implied interest rate would be 100.00 – 95.00 = 5.00%.
Graphic: Via Charles Schwab Corporation’s (NYSE: SCHW) thinkorswim platform. The three-month SOFR (FUTURE: /SR3) curve implies a 4.86% terminal rate today, followed by easing into year-end.
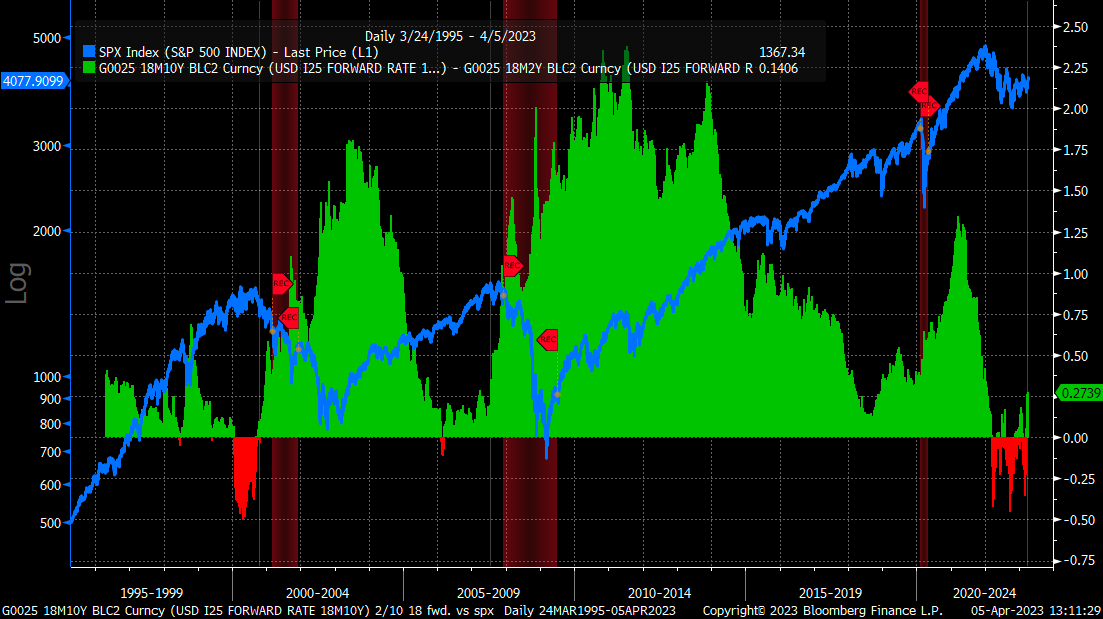
The S&P 500 (INDEX: SPX) has not bottomed based on these conditions. 3Fourteen Research concludes that the SPX has never bottomed during a Fed hike cycle, which one is still ongoing; typically, forward earnings stabilize and turn higher 3-6 months after a market bottom, which hasn’t happened; the 2-10 yield curve has never remained inverted six months after a major bear market bottom.
Graphic: Retrieved from Bloomberg via @MichaelMOTTCM.
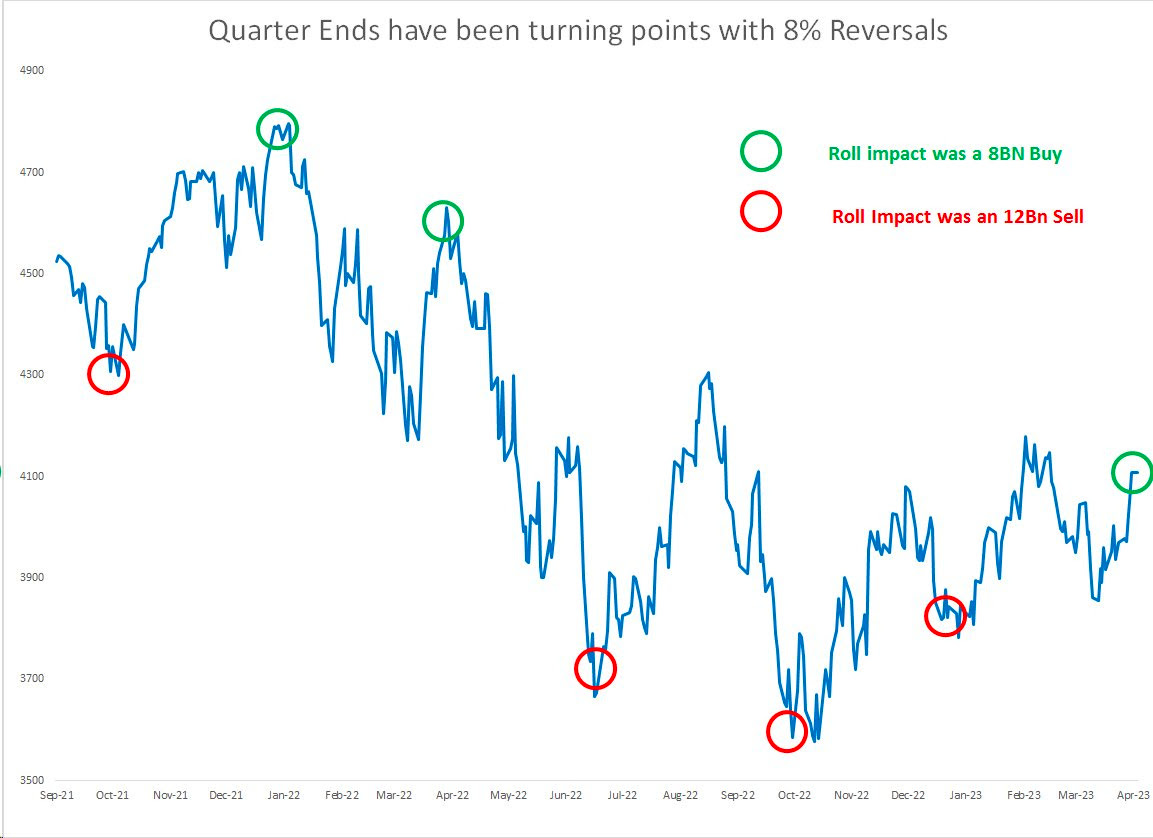
Notwithstanding all the doom and gloom, we explained in past letters that markets would likely remain strong through month-end March.
Graphic: Retrieved from Damped Spring Advisors’ Andy Constan. “6 of the last 6 quarters, the quarter end flow has resulted in a spike or dip and a subsequent 8%+ reversal.”
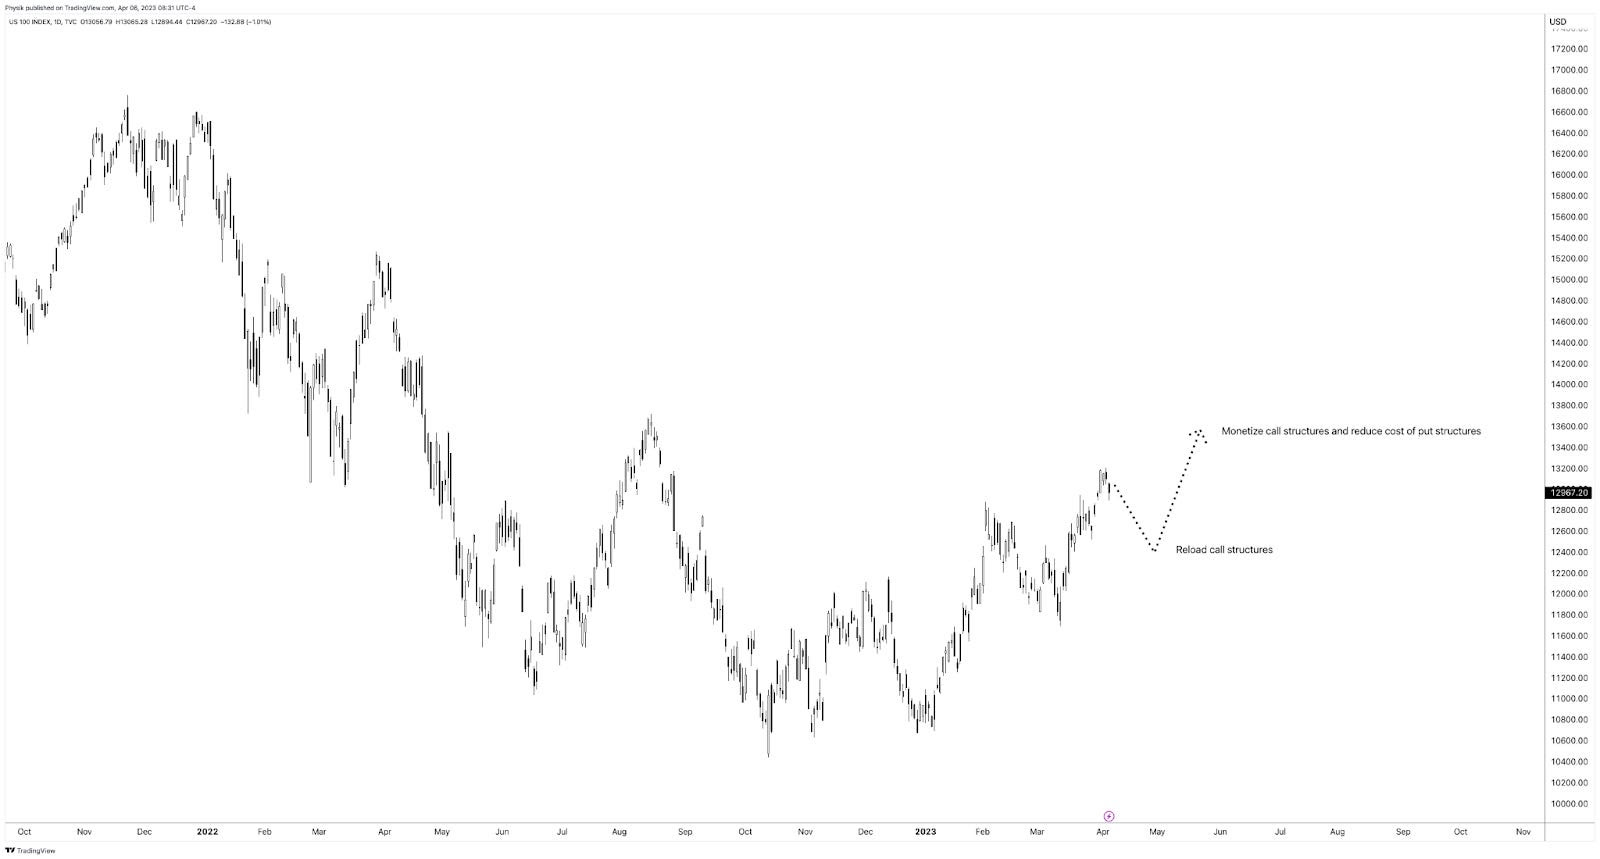
Accordingly, it made a lot of sense to own low- or no-cost call options structures in products like the Nasdaq 100 (INDEX: NDX), where many participants were caught offsides and bidding call volatility in response to the dramatic reversal; the reach for the right tail reduced the cost of ratio call spreads, making them the go-to structures.
It may make sense to re-load in similar call structures on pullbacks while using any proceeds or profits from those structures to reduce the cost of owning fixed-risk and less costly put structures (e.g., vertical) that may enable us to participate in equity market downside, as well as bet on lower rates in the future using call options structures on the /SR3 to express that opinion.
Graphic: Retrieved from TradingView via Physik Invest.
Disclaimer
Don’t use this free letter as advice; all content is for informational purposes, and derivatives carry a substantial risk of loss. At this time, Capelj and Physik Invest, non-professional advisors, will never solicit others for capital or collect fees and disbursements. Separately, you may view this letter’s content calendar at this link.
Welcome to the Daily Brief by Physik Invest, a soon-to-launch research, consulting, trading, and asset management solutions provider. Learn about our origin story here, and consider subscribing for daily updates on the critical contexts that could lend to future market movement.
JPMorgan Chase & Co’s (NYSE: JPM) Marko Kolanovic believes the equities rally will falter, with headwinds from bank turbulence, an oil shock, and slowing growth poised to send stocks back toward their 2022 lows over the coming months. Kolanovic says this is “the calm before the storm,” adding that the equity rally is masking weaknesses from recent bank collapses and a decline in corporate profits and growth.
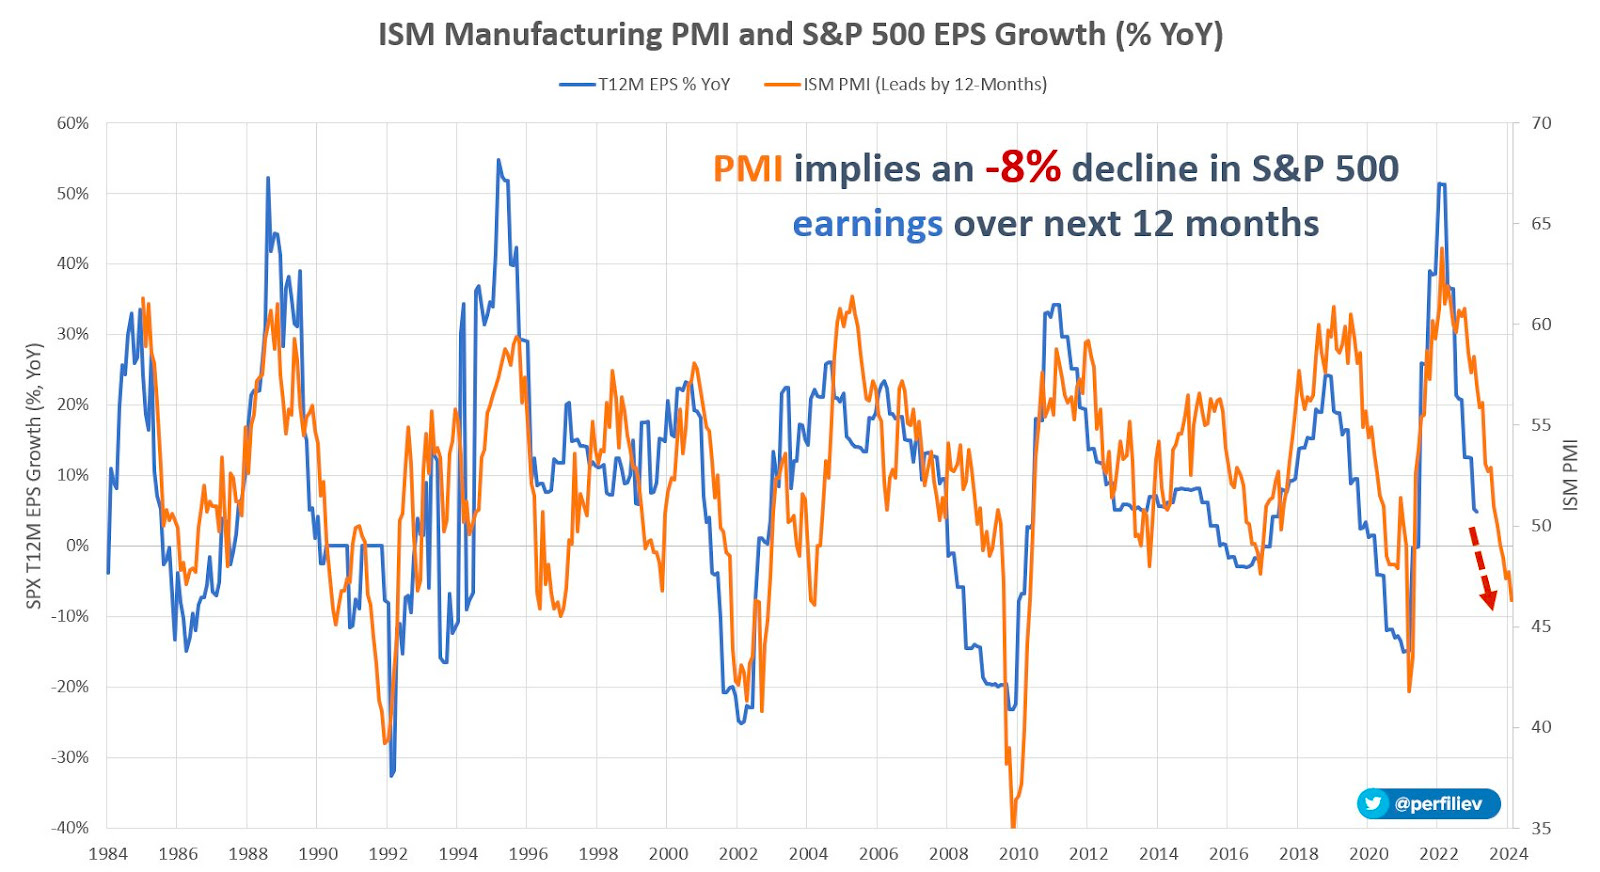
As a validation, we can look to ISM’s inventories exceeding that of new orders, and a dip in cost-push prices, Bloomberg’s John Authers explains. The overall ISM measure is recessionary; the upcoming earnings season may be unforgiving, and companies with weaker EPS are likely to be penalized more due to the prospects of a recession.
Graphic: Retrieved from Sergei Perfiliev. “Based on this relationship, today’s PMI reading of 46.3 implies an earnings contraction of about 8% over the next 12 months or an SPX EPS of 204. Using the current forward PE ratio of 18.7, this leads to an index level of about 3,815. A ‘recessionary’ PE ratio of 15 will see the index at ~3,060, assuming earnings don’t fall further.”
Graphic: Retrieved from @countdraghula. “We aren’t seeing the same thing for out-of-the-money calls on front-end futures. BUYING A CALL on front-end futures is taking a bet on Fed rates collapsing, especially if it is considerably out of the money, as below. Pricing for these is still sky high, despite some calm.”
Over the past weeks, we anticipated the markets trading “spiritedly for far longer,” quoting the likes of Kai Volatility’s Cem Karsan, who said the signs of a combustible situation would emerge when options implied volatility is sticky in a market rally.
Typically, as the market trades higher, volatility levels for fixed-strike options should decrease. If broad implied volatility measures are bid and fixed-strike volatility increases, this may lead to a more combustible situation as options counterparties begin to thin out on volatility, resulting in less support.
We maintain that you can monetize the example call structures we provided and roll some profits into bear put spreads (i.e., buy put and sell another at a lower strike), though you may limit your expectations. Some think there is a greater likelihood of a “crash-less selloff, a grinding de-leveraging.”
Don’t use this free letter as advice; all content is for informational purposes, and derivatives carry a substantial risk of loss. At this time, Capelj and Physik Invest, non-professional advisors, will never solicit others for capital or collect fees and disbursements. Separately, you may view this letter’s content calendar at this link.
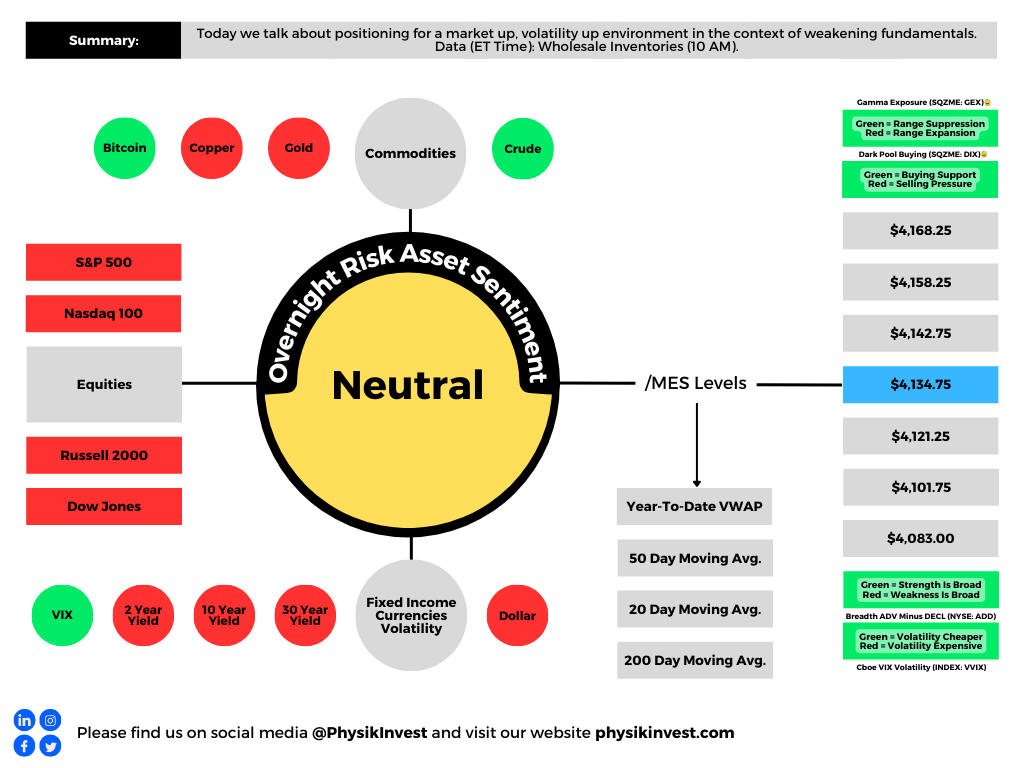
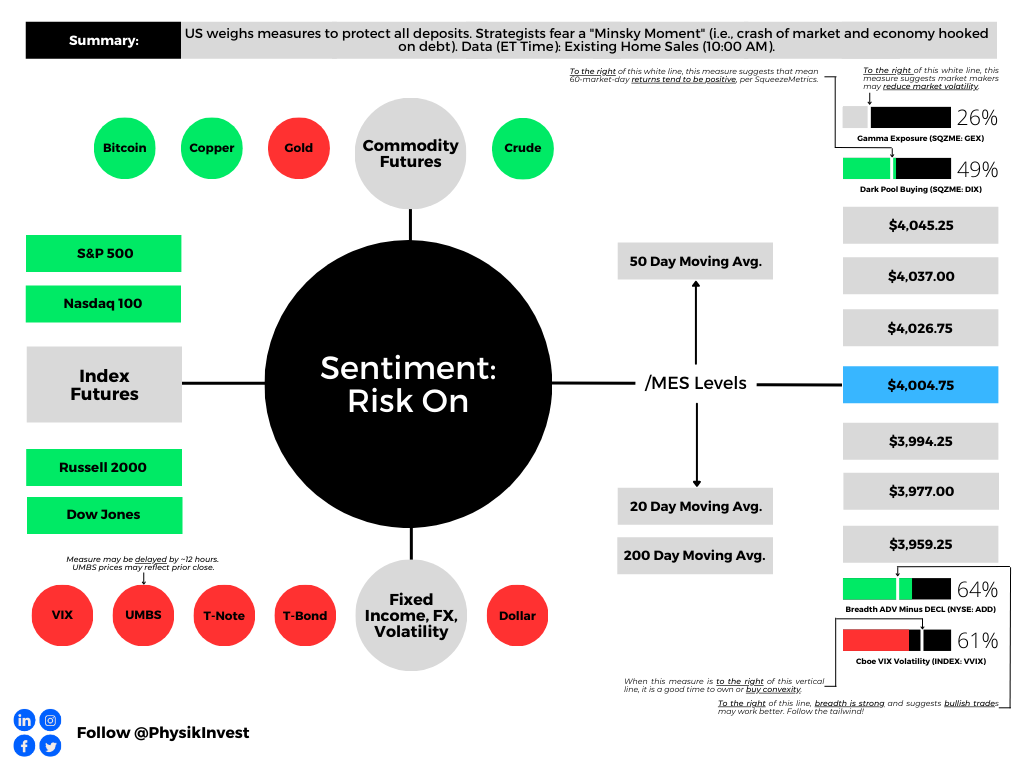
Graphic updated 6:30 AM ET. Sentiment Risk-On if expected /MES open is above the prior day’s range. /MES levels are derived from the profile graphic at the bottom of this letter. Click here for the latest levels. SqueezeMetrics Dark Pool Index (DIX) and Gamma (GEX) with the latter calculated based on where the prior day’s reading falls with respect to the MAX and MIN of all occurrences available. A higher DIX is bullish. The lower the GEX, the more (expected) volatility. Click to learn the implications of volatility, direction, and moneyness. Breadth reflects a reading of the prior day’s NYSE Advance/Decline indicator. The CBOE VIX Volatility Index (INDEX: VVIX) reflects the attractiveness of owning volatility. UMBS prices via MND. Click here for the economic calendar.
Administrative
Thanks for the feedback on the newsletter design! The technical section has returned for your viewing of crucial levels. We may update this section or merge it with another in the future. If you have any feedback, please comment or reply!
By the way, check out fx:macro’s neat market dashboard how-to-build guide! They have a fabulous newsletter, and this dashboard is an excellent component.
👉 A lot of people have asked about the Market Dashboard I'm using and how to build something similar
👉 I've put together a 35-page PDF with >50 screenshots going through the entire process using Excel and TradingView
In the coming sessions, there will be a dive into the geopolitical developments of late, far higher in quality than what we started this week with. For a sneak peek at what we will be talking about, look at this article, this podcast, and the Daily Brief for 1/4/23.
Positioning
In yesterday’s letter on positioning contexts, we concluded it was likely for markets to remain contained through month-end.
We said, “there is potential for markets to move into a far ‘more combustible’ position, … [and], with call skews far up meaningfully steep, still-present low- and zero-cost call structures” in previously depressed products like the Nasdaq 100 (INDEX: NDX), buoyed by financial tensions easing, were attractive to express the bullish view.
Graphic: Retrieved from JPMorgan Chase & Co (NYSE: JPM) via The Market Ear.
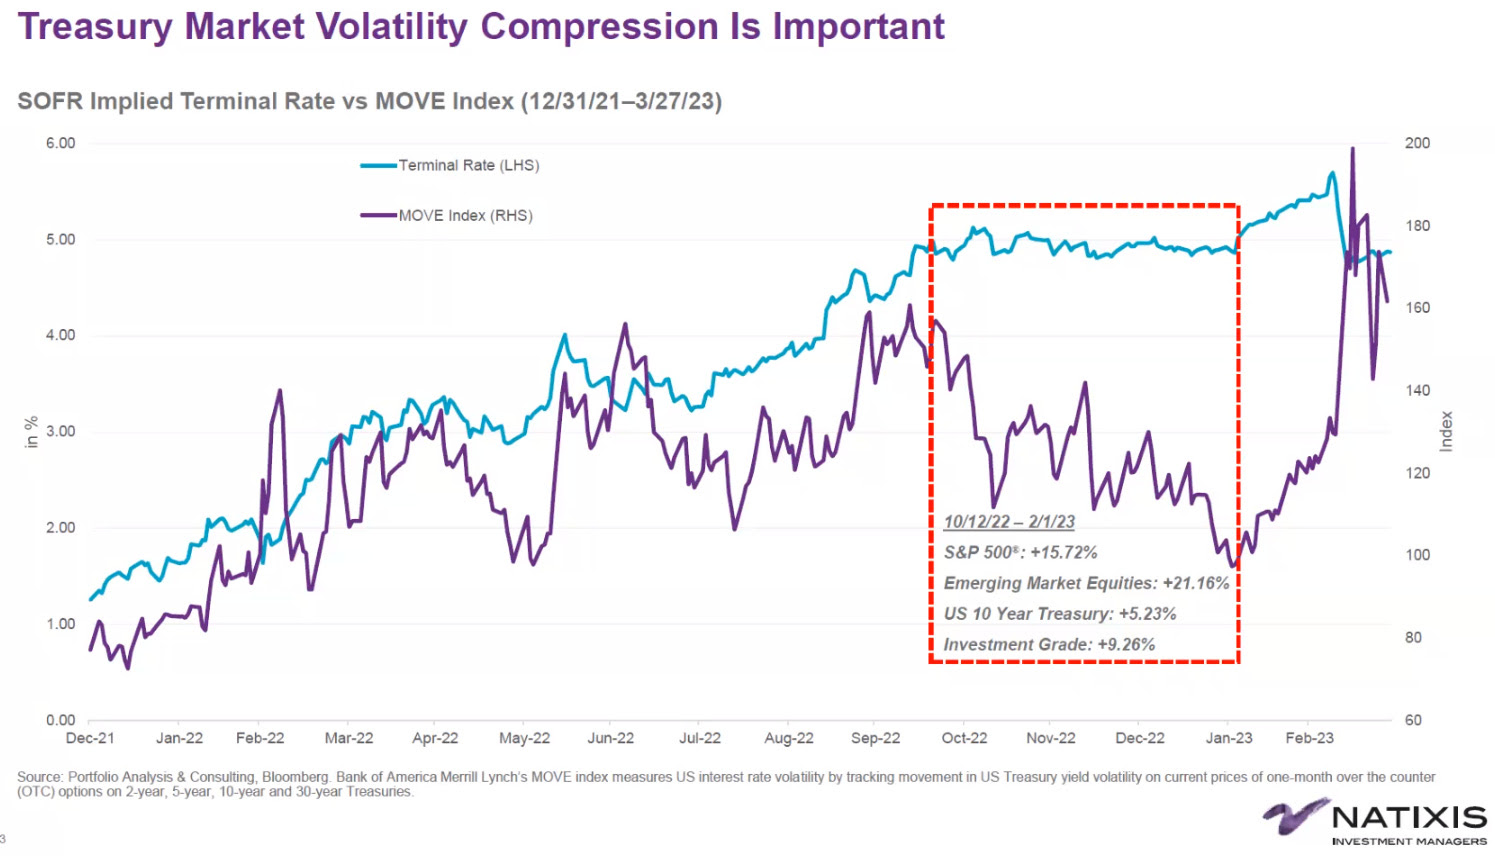
Though we weren’t too right about the potential for volatility to be sticky, which may be detrimental to some of the more expensive structures, such trades’ exposure to direction and movement appears to be offsetting time decay and volatility, sped up by the resolution of the liquidity crisis (i.e., the asset-liability mismatch at some banks that thought their depositors were far more loyal, hence less of a need to hedge risk) which prompted traders a few weeks back to demand protection and reprice options higher; the Merrill Lynch Option Volatility Estimate (INDEX: MOVE) and Cboe Volatility Index (INDEX: VIX) have come in dramatically. Please take a look at the full letter here.
As stated on 3/29, the fundamental view hasn’t changed. Therefore, we may consider monetizing our structures now and in the near future and using those credits to offset debit risk in plays such as far-dated bear put spreads (i.e., buy put and sell another at a lower strike); options data and insight platform SpotGamma says the juice has been squeezed now with S&P 500 (INDEX: SPX) 1-month at-the-money implied volatility or IVOL pricing at 17%. “For a decline to continue, we need a change in volatility regime (i.e., soft landing, bank crisis resolved, etc.) because, with 1-month realized at 15%, you can argue there isn’t much juice left to squeeze.” Caution on the upside plays.
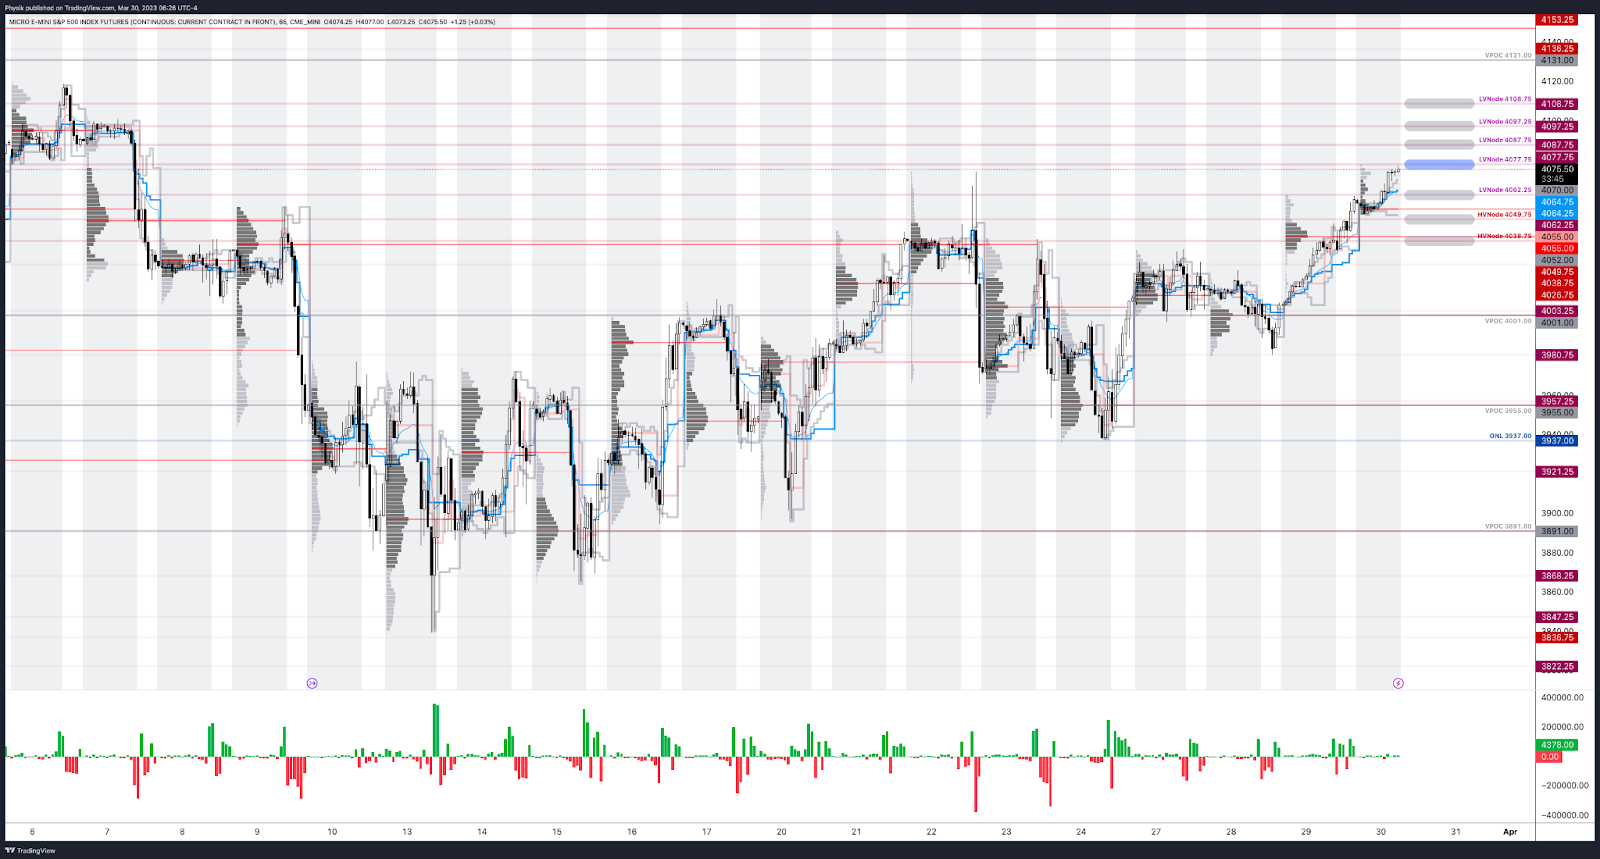
As of 6:30 AM ET, Thursday’s regular session (9:30 AM – 4:00 PM ET) in the S&P 500 will likely open in the upper part of a positively skewed overnight inventory, outside of the prior day’s range, suggesting a potential for immediate directional opportunity.
The S&P 500 pivot for today is $4,077.75.
Key levels to the upside include $4,087.75, $4,097.25, and $4,108.75.
Key levels to the downside include $4,062.25, $4,049.75, and $4,038.75.
Click here to load the updated key levels via the web-based TradingView platform.
New links are produced daily.
Quoted levels likely hold, barring an exogenous development.
Graphic: 65-minute profile chart of the Micro E-mini S&P 500 Futures.
About
The author, Renato Leonard Capelj, spends the bulk of his time at Physik Invest, an entity through which he invests and publishes free daily analyses to thousands of subscribers. The analyses offer him and his subscribers a way to stay on the right side of the market.
You may view this letter’s content calendar at this link.
Disclaimer
Do not construe this newsletter as advice; all content is for informational purposes, and derivatives carry a substantial risk of loss. Capelj and Physik Invest, non-professional advisors, will never solicit others for capital or collect fees and disbursements for their work.
Physik Invest’s Daily Brief is read free by thousands of subscribers. Join this community to learn about the fundamental and technical drivers of markets.
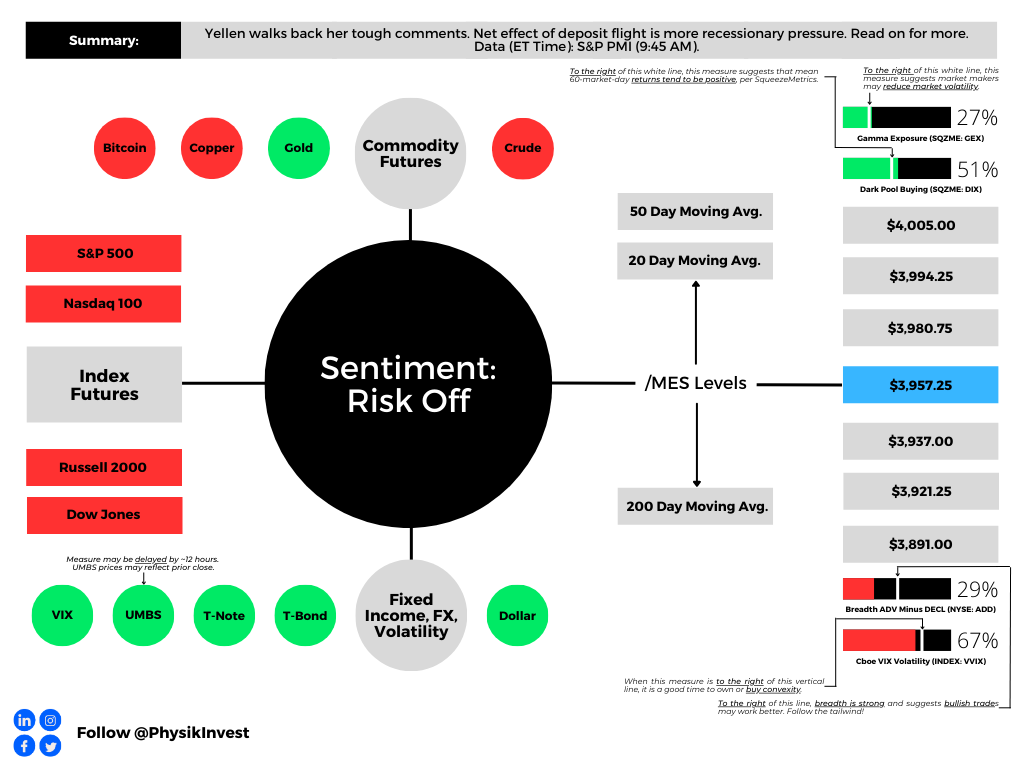
Graphic updated 9:20 AM ET. Sentiment Risk-Off if expected /MES open is below the prior day’s range. /MES levels are derived from the profile graphic at the bottom of this letter. Click here for the latest levels. SqueezeMetrics Dark Pool Index (DIX) and Gamma (GEX) with the latter calculated based on where the prior day’s reading falls with respect to the MAX and MIN of all occurrences available. A higher DIX is bullish. The lower the GEX, the more (expected) volatility. Click to learn the implications of volatility, direction, and moneyness. Breadth reflects a reading of the prior day’s NYSE Advance/Decline indicator. The CBOE VIX Volatility Index (INDEX: VVIX) reflects the attractiveness of owning volatility. UMBS prices via MND. Click here for the economic calendar.
Fundamental
Our Daily Brief for 3/23 discussed reactions to the Federal Reserve’s (Fed) interest rate decision being countered by Treasury secretary Janet Yellen’s deposit guarantee comments. Accordingly, doom and gloom are in full bloom prompting Yellen to walk back her toughness and tell lawmakers that regulators would protect the banking system if warranted. However, this did little to assuage markets, hence the neutral-to-risk-off sentiment this morning.
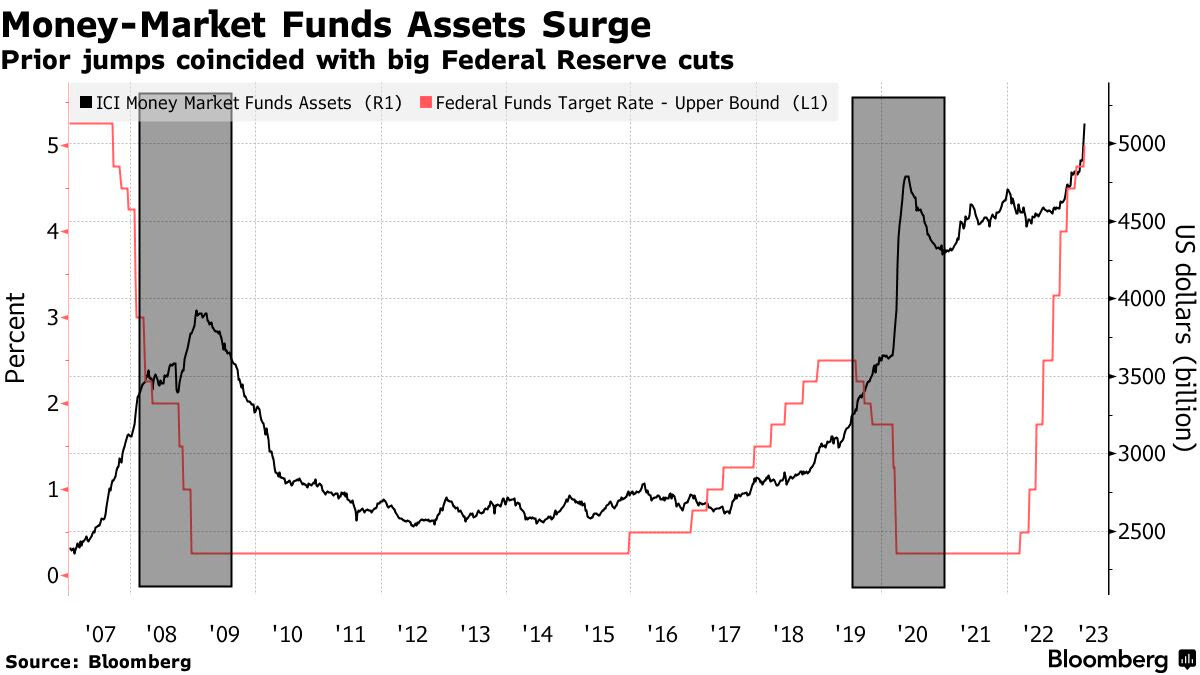
Based on the Fed’s Overnight Reverse Repo (RRP) and Bank Term Funding Program (BTFP), as well as money-market flows, strategists believe the deposit flight has not stabilized. To explain, policymakers intervened on the heels of the banking crisis in a way that’s not to be confused with quantitative easing or QE (i.e., flow of capital into markets). The Fed’s balance sheet swelled (from the discount window, the new bank funding facilities, and spillover from the FDIC insurance backstop). The balance sheet has continued to swell while money market funds and the RRP facility see big inflows.
Strategists like Andreas Steno Larsen allege that the maturity of 3-month T-bills and deposit flights partly drives this swell.
Rather than being used to boost liquidity (i.e., “lend or to finance trading activities,” as discussed in previous letters, including 9/20), reserves are being sterilized. “The Fed’s actions to stem the banking crisis are beginning to accelerate the effects of [quantitative tightening or] QT, causing money velocity to drop and intensifying the tightening of financial conditions,” Bloomberg’s Simon White reports. “In the coming weeks and months, we are likely to see reserves leaving the high-velocity world of smaller banks, where they were being lent out more, to the effectively zero-velocity black-hole of” money-market funds and RRP.
JPMorgan Chase & Co (NYSE: JPM) validates this view. They think the Fed’s rate hikes and QT have coincided with funds going to money-market funds and larger banks. They add that the banking crisis has accelerated this movement.
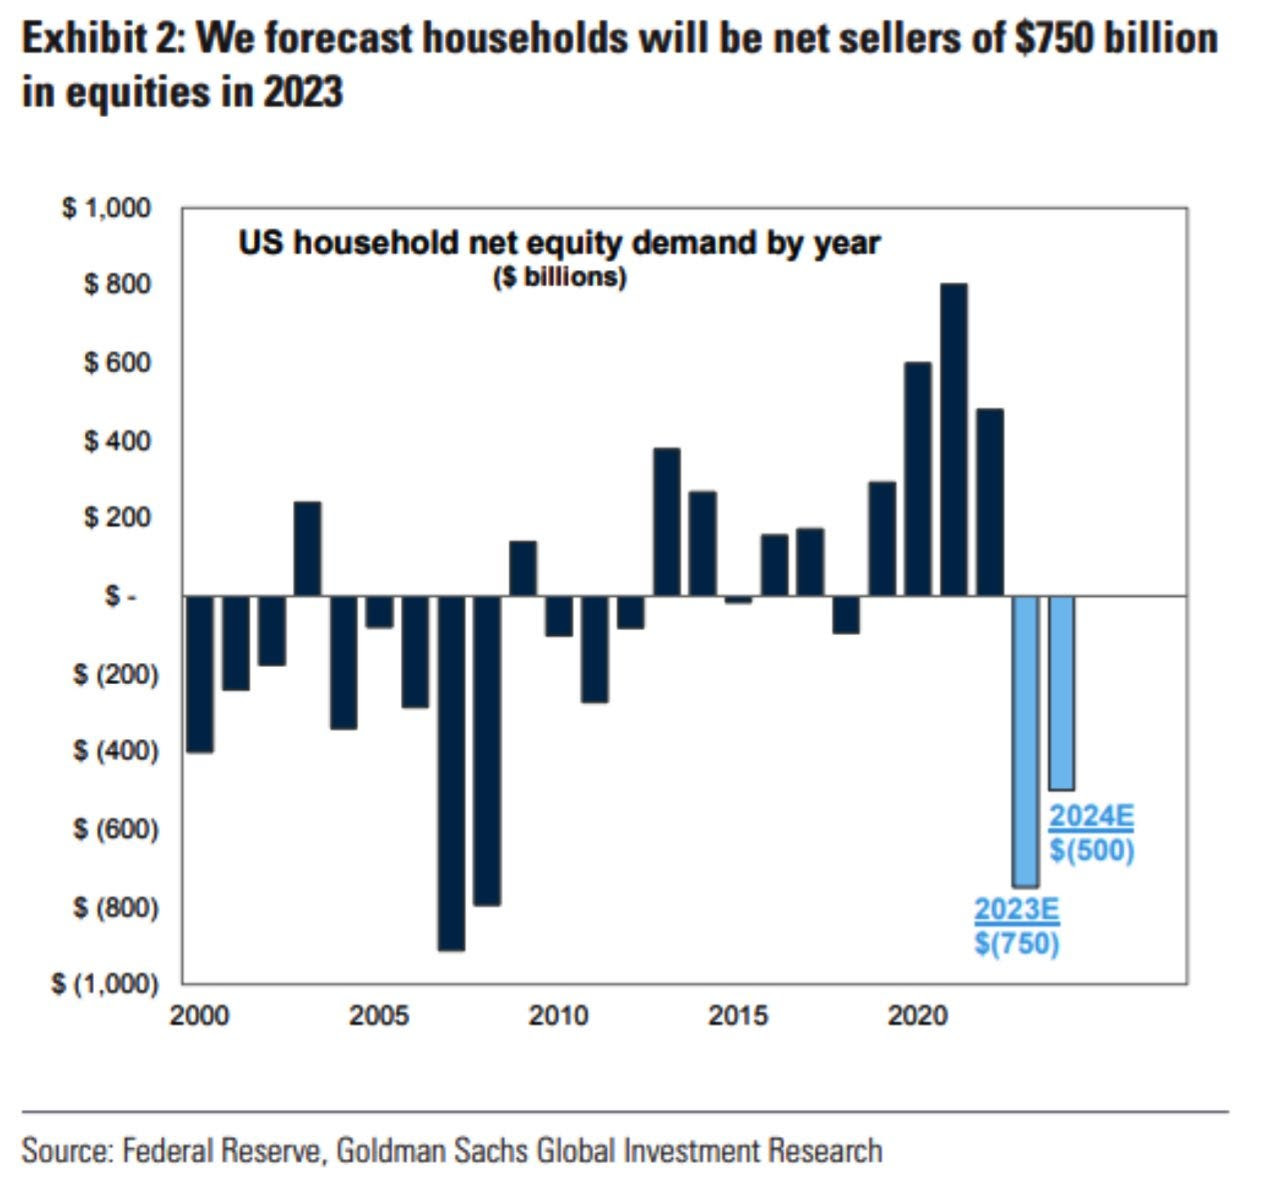
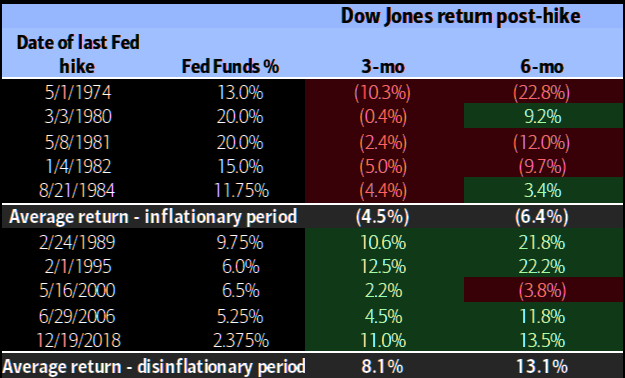
“Deposit movements could cause banks to be cautious on lending, with mid- and small-size banks playing a large role in US lending,” thus exacerbating recessionary pressures, they note. Bank of America Corporation (NYSE: BAC) strategists add that investors should sell equities after the last rate hike to sidestep “the biggest declines.”
Graphic: Retrieved from Goldman Sachs Group Inc (NYSE: GS).
Positioning
Brief positioning update.
As proposed in previous letters, low- or zero-cost call options structures have worked and may continue to work.
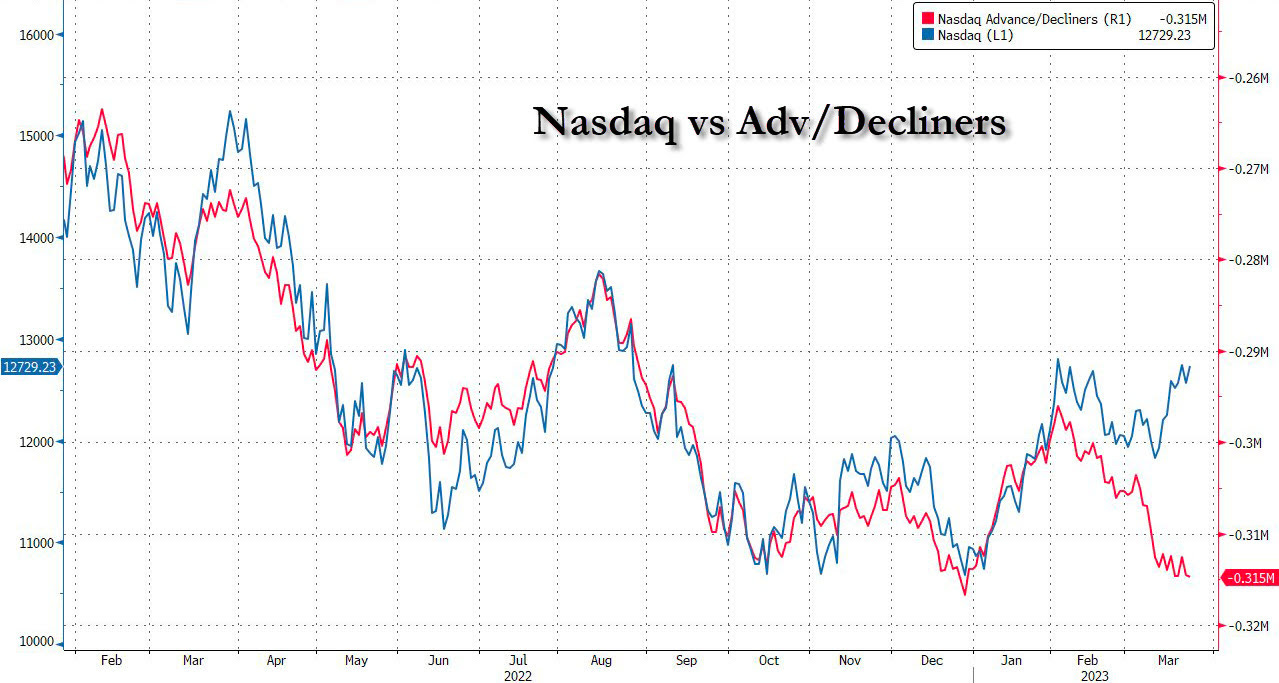
Notwithstanding, look for opportunities to play the downside as markets trade higher into a “more combustible” position. Attractive bear put spread trades are showing in the previously depressed Nasdaq 100, where boosts have, in part, been the result of “volatility compression and options decay.” If you’re participating in the Nasdaq, at least you have breadth on your side.
Graphic: Retrieved from ZeroHedge.
Technical
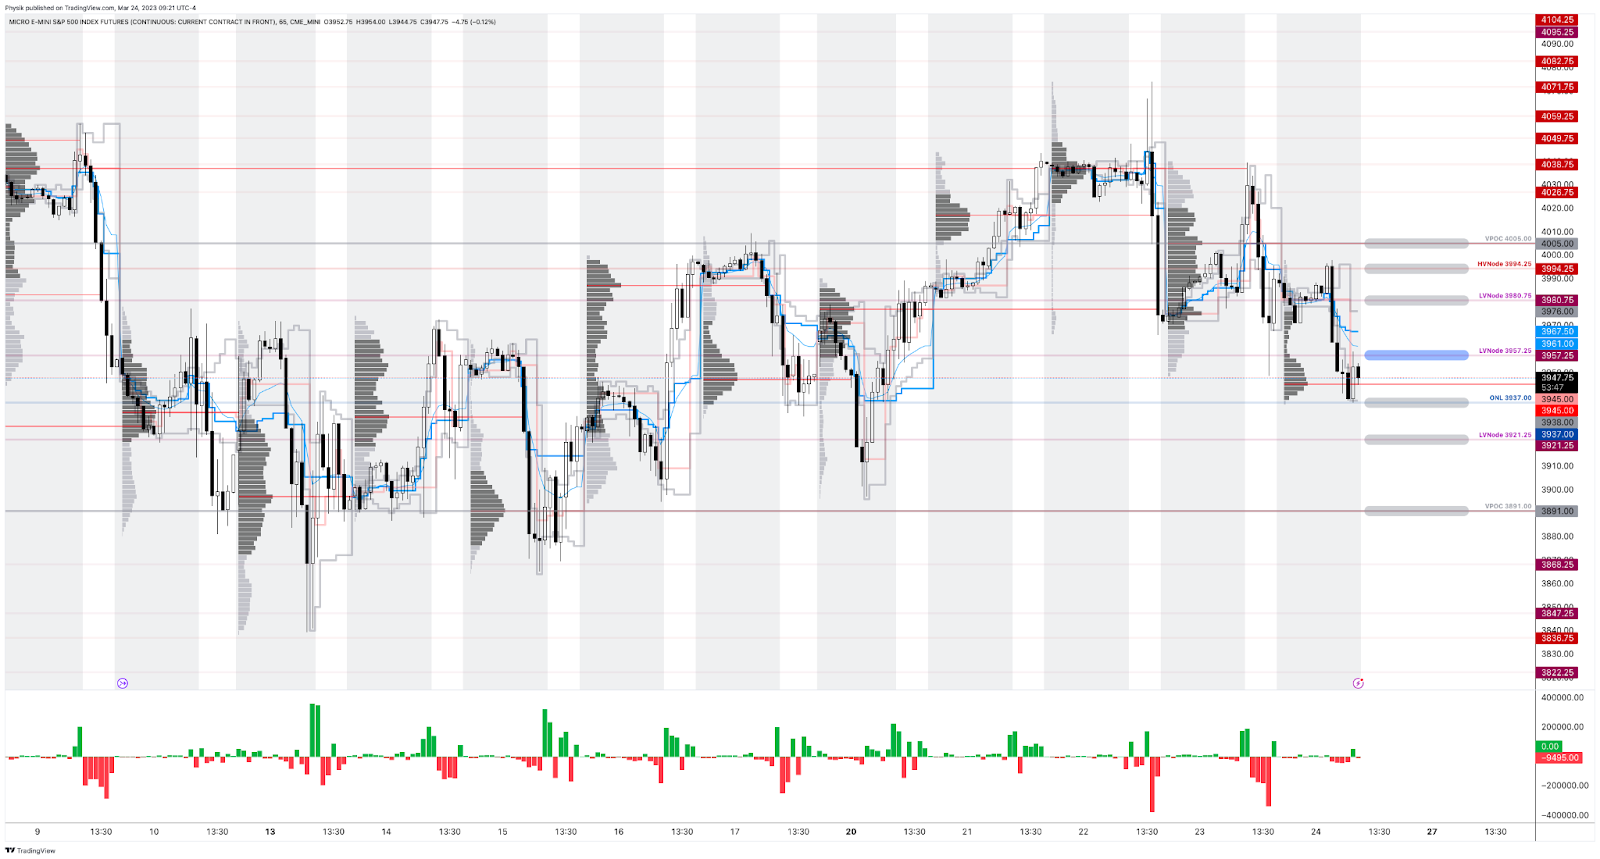
As of 9:20 AM ET, Friday’s regular session (9:30 AM – 4:00 PM ET) in the S&P 500 will likely open in the lower part of a negatively skewed overnight inventory, outside of the prior day’s range, suggesting a potential for immediate directional opportunity.
The S&P 500 pivot for today is $3,957.25.
Key levels to the upside include $3,980.75, $3,994.25, and $4,005.00.
Key levels to the downside include $3,937.00, $3,921.25, and $3,891.00.
Disclaimer: Click here to load the updated key levels via the web-based TradingView platform. New links are produced daily. Quoted levels likely hold, barring an exogenous development.
Graphic: 65-minute profile chart of the Micro E-mini S&P 500 Futures.
Definitions
Overnight Rally Highs (Lows): Typically, there is a low historical probability associated with overnight rally-highs (lows) ending the upside (downside) discovery process.
Volume Areas: Markets will build on areas of high-volume (HVNodes). Should the market trend for some time, this will be identified by a low-volume area (LVNodes). The LVNodes denote directional conviction and ought to offer support on any test.
If participants auction and find acceptance in an area of a prior LVNode, then future discovery ought to be volatile and quick as participants look to the nearest HVNodes for more favorable entry or exit.
POCs: Areas where two-sided trade was most prevalent in a prior day session. Participants will respond to future value tests as they offer favorable entry and exit.
About
The author, Renato Leonard Capelj, spends the bulk of his time at Physik Invest, an entity through which he invests and publishes free daily analyses to thousands of subscribers. The analyses offer him and his subscribers a way to stay on the right side of the market.
You may view this letter’s content calendar at this link.
Disclaimer
Do not construe this newsletter as advice. All content is for informational purposes. Capelj and Physik Invest manage their own capital and will not solicit others for it.
Physik Invest’s Daily Brief is read free by thousands of subscribers. Join this community to learn about the fundamental and technical drivers of markets.
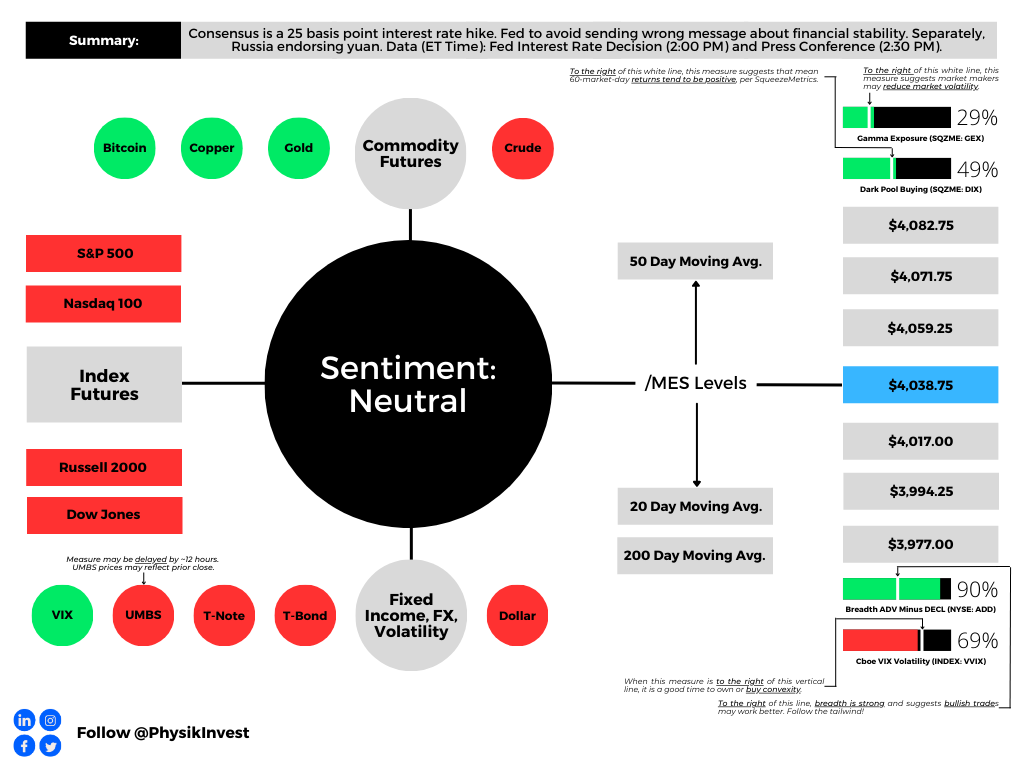
Graphic updated 8:20 AM ET. Sentiment Neutral if expected /MES open is inside of the prior day’s range./MES levels are derived from the profile graphic at the bottom of this letter. Click here for the latest levels. SqueezeMetrics Dark Pool Index (DIX) and Gamma (GEX) with the latter calculated based on where the prior day’s reading falls with respect to the MAX and MIN of all occurrences available. A higher DIX is bullish. The lower the GEX, the more (expected) volatility. Click to learn the implications of volatility, direction, and moneyness. Breadth reflects a reading of the prior day’s NYSE Advance/Decline indicator. The CBOE VIX Volatility Index (INDEX: VVIX) reflects the attractiveness of owning volatility. UMBS prices via MND. Click here for the economic calendar.
Administrative
Recall our past letters pondering the use of the yuan for settlements in the East. Well, there’s been progress on that end.
Putin: We are in favor of using the Chinese yuan for settlements between Russia and the countries of Asia, Africa, and Latin America. I am confident that these forms of settlement in yuan will develop between Russian partners and their counterparts in third countries. pic.twitter.com/Mnw1WfjW4Y
Also recall “the recycling of petrodollars by oil-rich nations” fueling “several emerging market debt crises” and prompting “the creation of a more speculative, debt-fueled economy in the US.” Is this a reversing trend? We shall unpack in a future letter, soon.
Fundamental
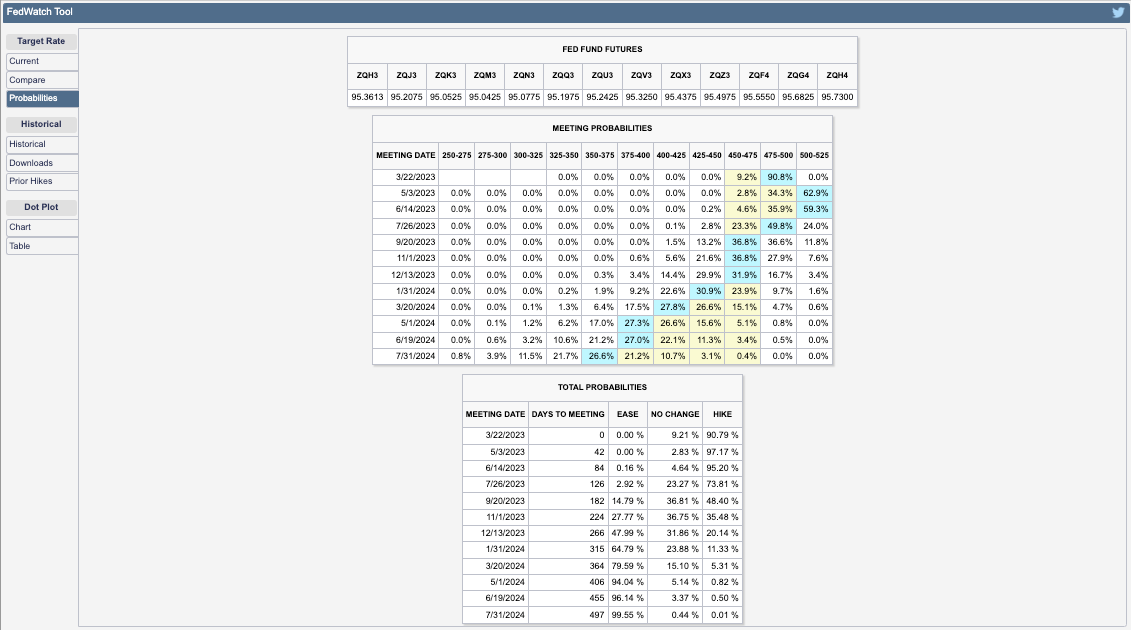
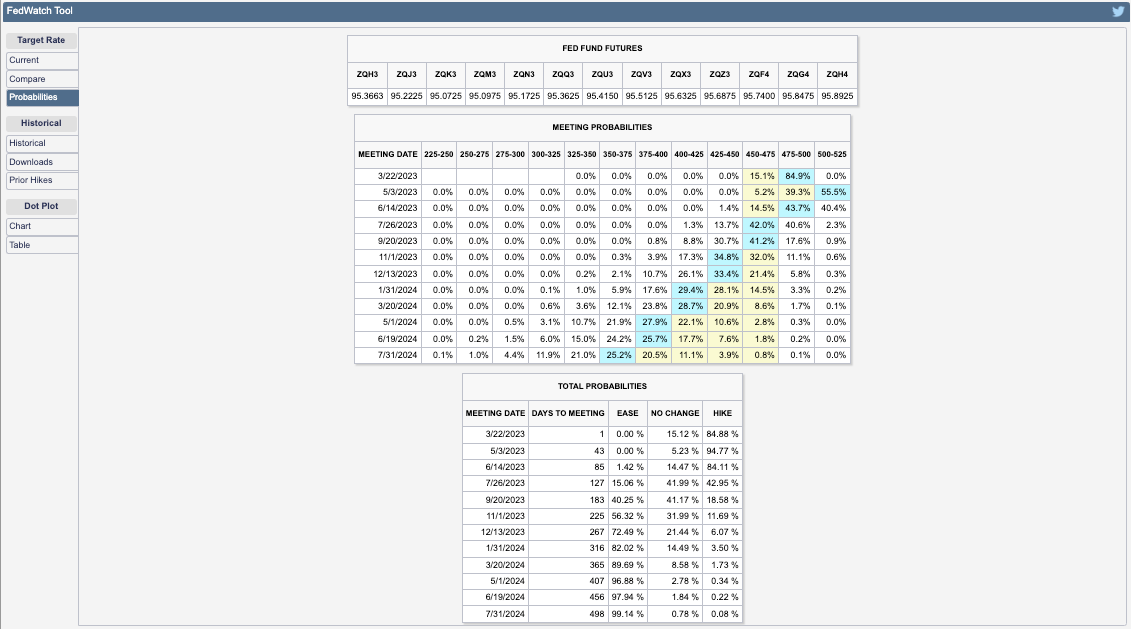
The Federal Reserve (Fed) is likely to bump its current target rate up 25 basis points to 4.75-5.00%. Failing to bump interest rates would likely send the wrong message about financial stability. To give up on the inflation fight (a pause or interest rate cut) would tell investors “look out below,” Bloomberg summarizes.
Graphic: Retrieved from CME Group Inc’s (NASDAQ: CME) FedWatch Tool.
The path after is less certain, though most think there is likely to be at least one additional hike in the coming months. The catch is that if market-induced financial tightening persists through the second quarter, it would substitute for rate hikes.
Assuming the Fed publishes its summary of economic projections (SEP) or dot plot, they will likely show the governors “getting less aggressive,” adds Bloomberg’s John Authers.
If we recall, Kai Volatility’s Cem Karsan talked about the Fed not wanting liquidations; they want a slow sale, not a fire sale. So, with there being a lag, the Fed may want to slow and assess, carefully telegraphing this being not a pivot. A pivot would probably inspire confidence among investors to own assets “mak[ing] things hotter,” Karsan explains, noting that the Fed really needs to walk up the long end of the yield curve. Recall that the long end fell considerably on the back of the turmoil and intervention, as well as recent data (e.g., housing starts showing more supply, likely a mortgage application booster that would further “make things hotter”).
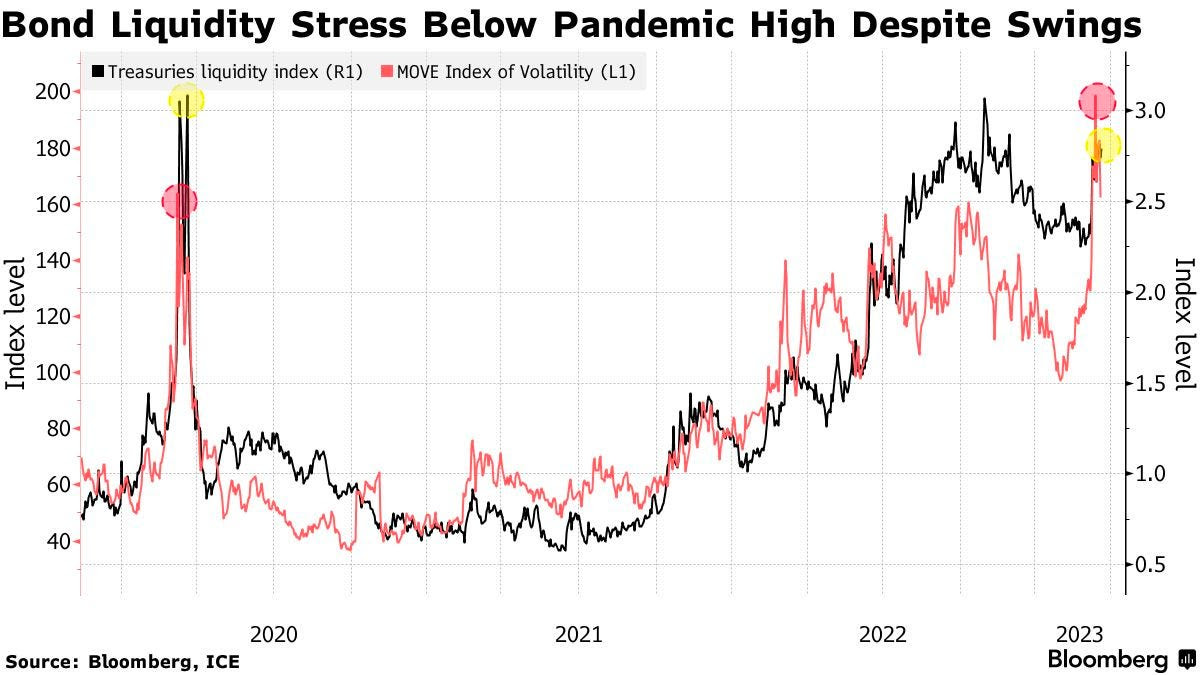
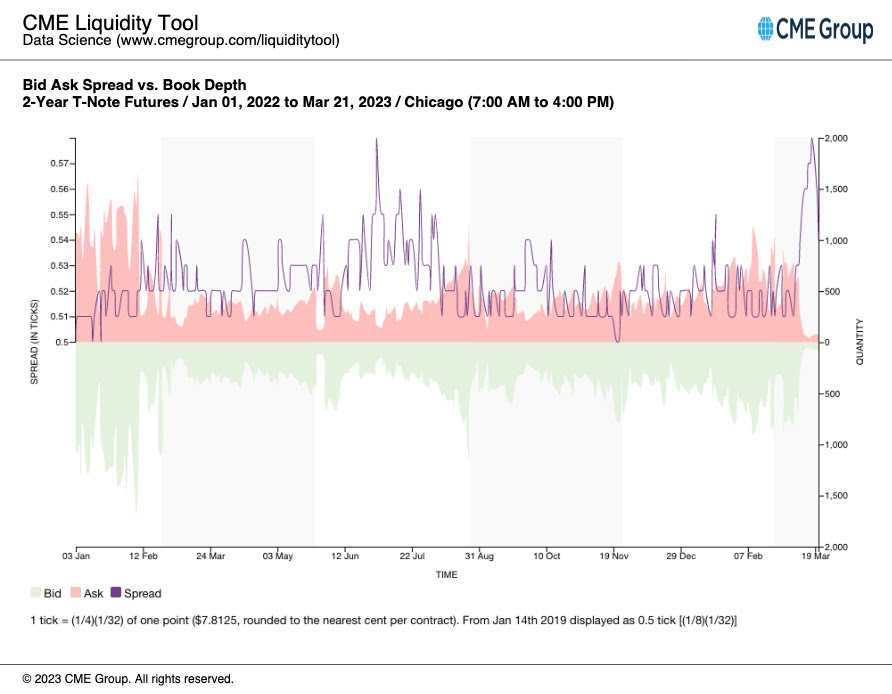
In large part the result of low liquidity, Treasury volatility could prompt the Fed to adjust their quantitative tightening or QT (i.e., the flow of capital out of capital markets) program, instead. Just as quantitative easing or QE (i.e., the flow of capital into capital markets) did little to spark off inflation, it’s unlikely that temping QT would disrupt efforts to rein inflation.
Graphic: Retrieved from CME Group Inc’s (NASDAQ: CME) Liquidity Tool. Per a Bloomberg article, “the spread between offered prices and what sellers will accept has widened for all maturities, … a sign of thinning market depth” and illiquidity.
Adjusting QT, which is contributing to the excessive volatility, “would be preferable to not raising rates … [since] an abrupt pause in rate hikes would likely resurrect the notion that there’s, indeed, a Fed ‘put’ designed to bail out Wall Street at the first sign of stress,” a potential catalyst for market upside, says Robert Burgess.
In Tuesday’s letter, we talked about the potential for fears of downside easing and fears of missing out (i.e., FOMO) on upside rising. Specifically, the letter said the following:
“A response may be FOMO-type demand for call options exposures, coupled with CTAs further ‘raising their equity exposure’ on trend signals and lower volatility, boosting markets into a ‘more combustible’ state as explained on 2/17. This fear of missing out is visible in options volatility skew; traders are hedging those tail outcomes.”
In support of the most recent strength, per JPMorgan Chase & Co’s (NYSE: JPM) trade desk commentary, there is a buy skew. Goldman Sachs Group Inc (NYSE: GS) strategists agree, noting that flows are almost entirely “cover-driven.”
Recall that traders sought protection amidst all the calamities recently. Accordingly, measures of implied volatility or IVOL including the Cboe Volatility Index or VIX rose (e.g. traders demand exposure to downside put protection by way of S&P 500 options which bids options prices and manifests higher IVOL and counterparty pressure from their equity future/stock sales to hedge this demand). These same measures of IVOL are now falling as traders’ closure of protection results in counterparty pressures being lifted (helping explain, in part, the above “cover-driven” remark by GS).
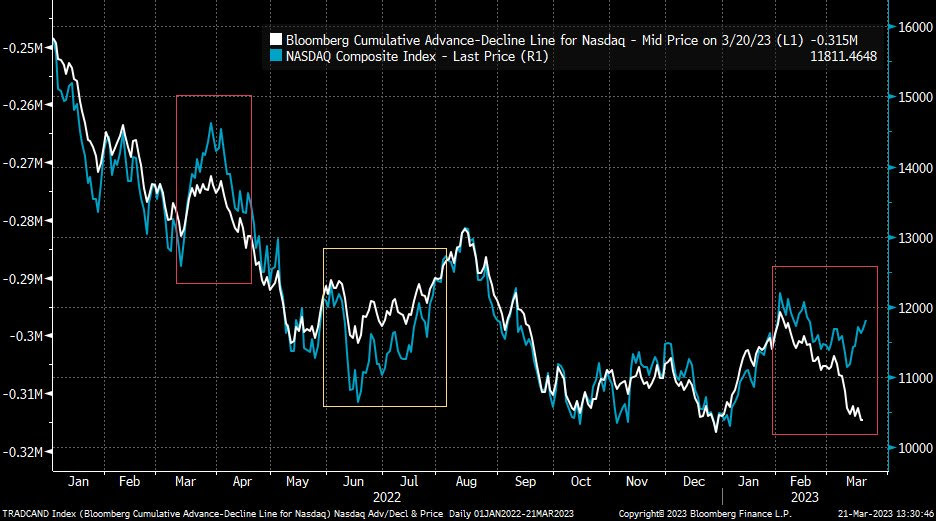
Does this rally have breadth behind it? Look no further than market internals.
Graphic: Retrieved from Bloomberg via Liz Young. “The Nasdaq’s Cumulative Advance-Decline line has parted ways with index direction in recent days. In other words, the index has rallied despite weak breadth (more stocks falling than rising), the two lines are likely to find their way back together somehow…”
A pause before the Fed announcement, and then breadth catches up to price?
Or, has the typical post-Fed IVOL boost been spent?
Regardless, we maintain that low-cost call options structures as proposed in previous letters worked (and may continue to work). Notwithstanding, look for opportunities to play the downside should markets trade higher into a “more combustible” position.
More on trade ideas in the next letters. Take care.
Technical
As of 8:15 AM ET, Wednesday’s regular session (9:30 AM – 4:00 PM ET), in the S&P 500, is likely to open in the upper part of a negatively skewed overnight inventory, inside of the prior day’s range, suggesting a limited potential for immediate directional opportunity.
The S&P 500 pivot for today is $4,038.75.
Key levels to the upside include $4,059.25, $4,071.75, and $4,082.75.
Key levels to the downside include $4,017.00, $3,994.25, and $3,977.00.
Disclaimer: Click here to load the updated key levels via the web-based TradingView platform. New links are produced daily. Quoted levels likely hold barring an exogenous development.
Graphic: 65-minute profile chart of the Micro E-mini S&P 500 Futures (bottom middle).
Definitions
Volume Areas: Markets will build on areas of high-volume (HVNodes). Should the market trend for a period of time, this will be identified by a low-volume area (LVNodes). The LVNodes denote directional conviction and ought to offer support on any test.
If participants auction and find acceptance in an area of a prior LVNode, then future discovery ought to be volatile and quick as participants look to the nearest HVNodes for more favorable entry or exit.
POCs: Areas where two-sided trade was most prevalent in a prior day session. Participants will respond to future tests of value as they offer favorable entry and exit.
About
The author, Renato Leonard Capelj, spends the bulk of his time at Physik Invest, an entity through which he invests and publishes free daily analyses to thousands of subscribers. The analyses offer him and his subscribers a way to stay on the right side of the market.
You may view this letter’s content calendar at this link.
Disclaimer
Do not construe this newsletter as advice. All content is for informational purposes. Capelj and Physik Invest manage their own capital and will not solicit others for it.
Physik Invest’s Daily Brief is read free by thousands of subscribers. Join this community to learn about the fundamental and technical drivers of markets.
Graphic updated 7:00 AM ET. Sentiment Risk-On if expected /MES open is above the prior day’s range. /MES levels are derived from the profile graphic at the bottom of this letter. Click here for the latest levels. SqueezeMetrics Dark Pool Index (DIX) and Gamma (GEX) with the latter calculated based on where the prior day’s reading falls with respect to the MAX and MIN of all occurrences available. A higher DIX is bullish. The lower the GEX, the more (expected) volatility. Click to learn the implications of volatility, direction, and moneyness. Breadth reflects a reading of the prior day’s NYSE Advance/Decline indicator. The CBOE VIX Volatility Index (INDEX: VVIX) reflects the attractiveness of owning volatility. UMBS prices via MND. Click here for the economic calendar.
Administrative
Not all doom and gloom. Make sure to read to the end!
Fundamental
In the Daily Brief for 3/20, we summarized the financial industry and policymaker responses that would turn asset fire sales into managed, orderly asset sales.
The net result of the intervention would be a reduction in credit creation, a tightening of financial conditions, as well as a slowing of the economy and inflation while, potentially, setting “a dangerous precedent that simply encourage[s] future irresponsible behavior” (e.g., risky lending/borrowing), the House Freedom Caucus put eloquently. Basically, the fear is in policymakers underwriting the losses of prevailing carry-type strategies and setting the stage for an even bigger unwind or so-called “Minsky moment,” the “sudden crash of markets and economies that are hooked on debt,” Bloomberg reports.
"Regional banks relied on a business model that relied on uninsured deposits," says @Lazard's @porszag. "The government needs to make explicit what a lot of people are assuming: that for the foreseeable future, uninsured deposits don't exist. Everything is insured." pic.twitter.com/GgZ9ZF2f7r
A systemic credit event is among strategists’ biggest fear, indeed. A Bank of America Corporation (NYSE: BAC) survey shows a credit event happening on the heels of a US shadow banking, corporate debt, and developed-market real-estate collapse. Recall this letter writer’s conversation with Simplify Asset Management’s Michael Green who said he sees “cracks in bubbles like commercial real estate” already appearing, too.
Bloomberg adds that JPMorgan Chase & Co (NYSE: JPM) strategists think the inverted yield curve signals recession and the stocks are likely nearing their high point.
Graphic: Retrieved from Callum Thomas’ Weekly S&P 500 ChartStorm.
JPM adds that market lows won’t occur until interest rate cuts ensue.
Graphic: Retrieved from BNP Paribas ADR (OTC: BNPQY).
Recall 3/20’s letter citing BAC research that finds selling markets on the last Fed rate hike is a good strategy. The “Minsky moment” comment/fear has others at JPM adding that investors should sell into relief bounces.
Graphic: Retrieved from Bank of American Corporation (NYSE: BAC) via The Market Ear.
Most participants foresee rates continuing to rise by at least 25 basis points, per the CME Group Inc’s (NASDAQ: CME) FedWatch Tool. Following Wednesday’s (expected) hike, the path forward appears uncertain. Yesterday, the terminal/peak rate was at 4.75-5.00%. Today, the peak has shifted higher to 5.00-5.25%.
Graphic: Retrieved from CME Group Inc (NASDAQ: CME).
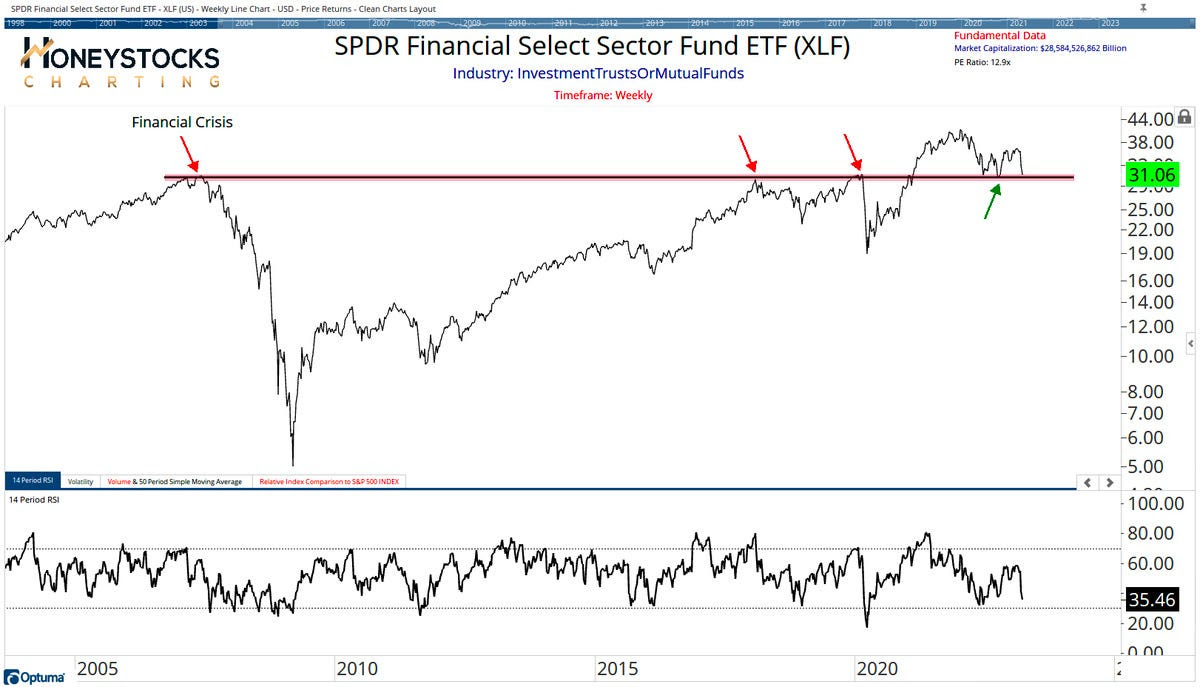
Financials look ready to fall off a cliff, to add. If they do, the whole market likely goes.
Graphic: Retrieved from Callum Thomas’ Weekly S&P 500 ChartStorm.
Positioning
We keep referring back to our Daily Briefs published last week (e.g., 3/13 and 3/14). In those letters, we talked about the growing concern about markets enduring some exogenous shocks.
We opted to take the less extreme side since policymakers’ response was likely to stem (or push into the future) turmoil. Additionally, with participants easing up on their long-equity exposure, equity markets were likely to stay contained, relative to bond markets where the lack of liquidity is an issue, some believe. Anyways, following important events including inflation updates (i.e., CPI) and derivatives expiries, short bursts of strength (particularly in some of the previously depressed products such as the Nasdaq 100 or NDX, as explained 3/17) were likely to ensue heading into the end of this month and next month. Additionally, certain rates trades via options we set forth on 3/14 were ripe for monetization, too.
Rotating into a money market or T-bill fund or box spreads, while allocating some remaining cash to leverage potential by way of some call options structures, appeared attractive. While the T-bill or box spread exposures did not budge much, call options structures as proposed on 3/14 worked (and are likely to continue to work) rather well. The monetization of the rate structures discussed on 3/14 was timely, also.
The potential for coming events including the Federal Reserve’s (Fed) interest rate decision on Wednesday 3/22 to assuage participants’ fears of slowing may, accordingly, prompt fears of missing out on the upside, Bloomberg reports. A response may be FOMO-type demand for call options exposures, coupled with CTAs further “raising their equity exposure” on trend signals and lower volatility, boosting markets into a “more combustible” state as explained on 2/17. This fear of missing out is visible in options volatility skew; traders are hedging those tail outcomes.
Technical
As of 7:00 AM ET, Tuesday’s regular session (9:30 AM – 4:00 PM ET), in the S&P 500, is likely to open in the upper part of a positively skewed overnight inventory, outside of the prior day’s range, suggesting a potential for immediate directional opportunity.
The S&P 500 pivot for today is $4,004.75.
Key levels to the upside include $4,026.75, $4,037.00, and $4,045.25.
Key levels to the downside include $3,994.25, $3,977.00, and $3,959.25.
Disclaimer: Click here to load the updated key levels via the web-based TradingView platform. New links are produced daily. Quoted levels likely hold barring an exogenous development.
Graphic: 65-minute profile chart of the Micro E-mini S&P 500 Futures.
Definitions
Volume Areas: Markets will build on areas of high-volume (HVNodes). Should the market trend for a period of time, this will be identified by a low-volume area (LVNodes). The LVNodes denote directional conviction and ought to offer support on any test.
If participants auction and find acceptance in an area of a prior LVNode, then future discovery ought to be volatile and quick as participants look to the nearest HVNodes for more favorable entry or exit.
POCs: Areas where two-sided trade was most prevalent in a prior day session. Participants will respond to future tests of value as they offer favorable entry and exit.
Options Expiration (OPEX): Reduction in dealer Gamma exposure. There may be an increase in volatility after the removal of large options positions and associated hedging.
Volume-Weighted Average Prices (VWAPs): A metric highly regarded by chief investment officers, among other participants, for quality of trade. Additionally, liquidity algorithms are benchmarked and programmed to buy and sell around VWAPs.
About
The author, Renato Leonard Capelj, spends the bulk of his time at Physik Invest, an entity through which he invests and publishes free daily analyses to thousands of subscribers. The analyses offer him and his subscribers a way to stay on the right side of the market.
You may view this letter’s content calendar at this link.
Disclaimer
Do not construe this newsletter as advice. All content is for informational purposes. Capelj and Physik Invest manage their own capital and will not solicit others for it.
Physik Invest’s Daily Brief is read free by thousands of subscribers. Join this community to learn about the fundamental and technical drivers of markets.
Graphic updated 6:15 AM ET. Sentiment Risk-Off if expected /MES open is below the prior day’s range. /MES levels are derived from the profile graphic at the bottom of this letter. Click here for the latest levels. SqueezeMetrics Dark Pool Index (DIX) and Gamma (GEX) with the latter calculated based on where the prior day’s reading falls with respect to the MAX and MIN of all occurrences available. A higher DIX is bullish. The lower the GEX, the more (expected) volatility. Click to learn the implications of volatility, direction, and moneyness. Breadth reflects a reading of the prior day’s NYSE Advance/Decline indicator. The CBOE VIX Volatility Index (INDEX: VVIX) reflects the attractiveness of owning volatility. UMBS prices via MND. Click here for the economic calendar.
Administrative
As indicated yesterday, through the end-of-this week, newsletters may be shorter due to the letter writer’s commitments. Therefore, please read the Daily Brief for March 14, if you haven’t already, for a big discussion on bond and equity market volatility, as well as the odds of the market falling apart or rising, and positioning contexts that support that movement. If there are any incomplete statements below, we shall complete them in the coming letters. We’re laying it all out for awareness. Take care!
Fundamental
Headline inflation via CPI (Consumer Price Index) fell most on energy and core goods while shelter, food, and services inflation continues to be sticky. Core prices continue to be high, risking “inflationary psychology [] becoming ingrained,” Bloomberg’s John Authers explains.
“There’s nothing in this report to suggest that inflation is defeated already,” explained Authers. “Not to raise the fed funds rate next week, with median inflation above 7%, would be a sign of panic,” and an acknowledgment of uncertainties with regard to the banking system, as talked about in the Daily Brief on March 14.
To note, however, contagion appears contained, despite Moody’s Corporation (NYSE: MCO) cutting its outlook for the banking system to negative from stable, and placing lenders including First Republic Bank (NYSE: FRC) on a downgrade review.
JPMorgan Chase & Co’s (NYSE: JPM) Marko Kolanovic did cut his equity allocation warning that not all carry trades, something this letter has talked about numerous times before (i.e., borrow at a low rate and invest in something that provides higher return), can be bailed out. Kolanovic appears worried about commercial real estate, which Simplify Asset Management’s Michael Green just told your letter writer is in a bubble that “we’re seeing crack,” finally.
Graphic: Retrieved from Bloomberg. The Federal Reserve’s new Bank Term Funding Program or BTFP is “QE in another name – assets will grow on the Fed balance sheet which will increase reserves.” Recall that QE is the flow of capital into capital markets while QT is the opposite. Q is for quantitative while E is for easing and T is for tightening.
Anyways, following yesterday’s CPI, traders price higher odds of a 25 basis point hike which puts the terminal or peak fed funds rate at 4.75-5.00%. Following this spring, factoring potential inflation plateau and financial system uncertainties, traders foresee the Fed easing. By year-end, traders expect rates to fall down to 3.75-4.00%. Recall that at the beginning of last week, there were no expectations of easing in 2023. Also, traders thought the Fed would raise as high as 5.50-5.75%.
Mortgage rates, determined by changes in the price of mortgage-backed securities or MBSs, fell too.
ARK Invest’s Cathie Wood, who your letter writer had the honor of interviewing in person for Benzinga articles, thinks we’re on the cusp of the “roaring twenties” as inflation “is likely to surprise on the low side of expectations” with the banking crisis also leading to “bad deflation.”
“Today, five major innovation platforms are evolving at the same time – multiomics sequencing, robotics, energy storage, artificial intelligence, and blockchain technology, all of which are converging,” she elaborates.
“Once the Fed stops looking backward at CPI inflation and starts addressing the deflationary banking crisis that a 19-fold increase in short rates and an inverted yield have caused, we would not be surprised to see a return to the Roaring Twenties.”
Graphic: Retrieved from Bloomberg.
On the backward-looking measures quote in the above paragraph, former Fed trader Joseph Wang notes that the Fed and central banks, in general, are aware segments of the market may break, but that won’t discourage them from tightening further.
“As the BOE saved the gilt market through purchases and kept tightening, so the Fed can save banks and keep tightening.”
Positioning
Tuesday’s letter said that following important events like CPI, the compression of wound implied volatility or IVOL, coupled with the nearing large options expirations (OpEx), sets the market up for potential short bursts of strength into the end of the month and next month.
That’s along the lines of what is happening. The S&P 500 rose mechanically after the release of CPI yesterday. Later, though the index succumbed, internally speaking the market remained strong through end-of-day, hence some short bursts boosted by some short-dated options activities, also.
As explained, yesterday, the recent re-grossing theme appears intact. Any further compression of wound IVOL and the passage of options expirations (OpEx) could support equities as month-end approaches. Though it may be too early to position for strength, one may consider it the way it was explained in the Daily Brief on March 14.
Technical
As of 6:15 AM ET, Wednesday’s regular session (9:30 AM – 4:00 PM ET), in the S&P 500, is likely to open in the middle part of a negatively skewed overnight inventory, inside of the prior day’s range, suggesting a limited potential for immediate directional opportunity.
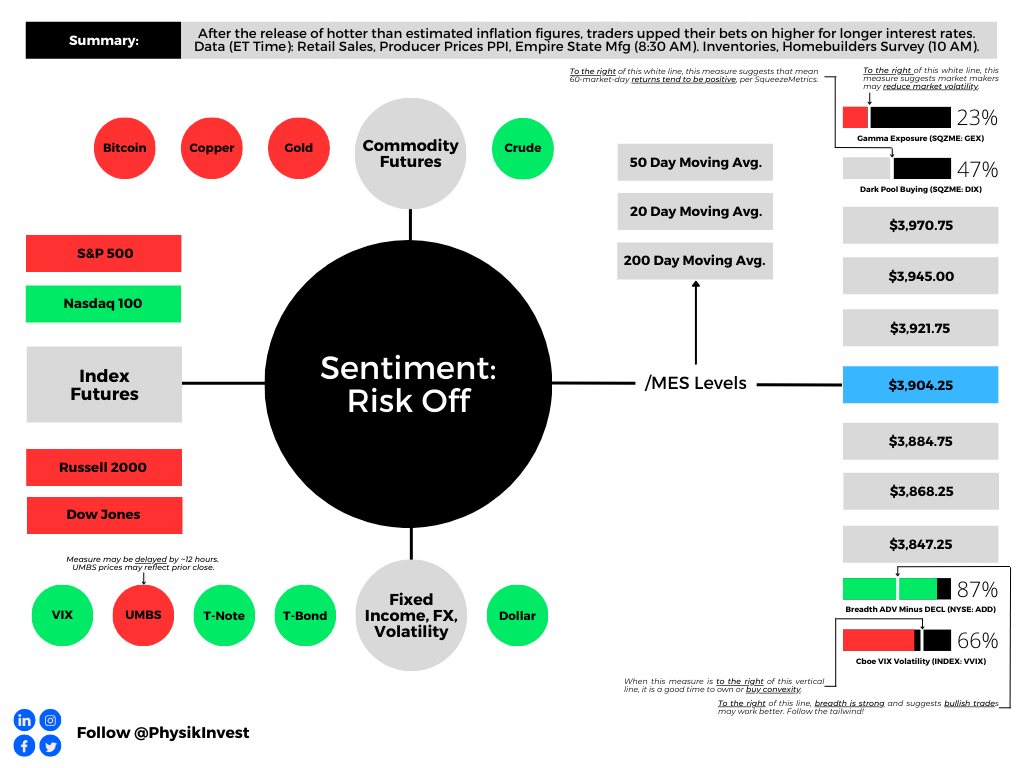
The S&P 500 pivot for today is $3,904.25.
Key levels to the upside include $3,921.75, $3,945.00, and $3,970.75.
Key levels to the downside include $3,884.75, $3,868.25, and $3,847.25.
Disclaimer: Click here to load the updated key levels via the web-based TradingView platform. New links are produced daily. Quoted levels likely hold barring an exogenous development.
Graphic: 65-minute profile chart of the Micro E-mini S&P 500 Futures.
Definitions
Volume Areas: Markets will build on areas of high-volume (HVNodes). Should the market trend for a period of time, this will be identified by a low-volume area (LVNodes). The LVNodes denote directional conviction and ought to offer support on any test.
If participants auction and find acceptance in an area of a prior LVNode, then future discovery ought to be volatile and quick as participants look to the nearest HVNodes for more favorable entry or exit.
POCs: Areas where two-sided trade was most prevalent in a prior day session. Participants will respond to future tests of value as they offer favorable entry and exit.
Volume-Weighted Average Prices (VWAPs): A metric highly regarded by chief investment officers, among other participants, for quality of trade. Additionally, liquidity algorithms are benchmarked and programmed to buy and sell around VWAPs.
About
The author, Renato Leonard Capelj, spends the bulk of his time at Physik Invest, an entity through which he invests and publishes free daily analyses to thousands of subscribers. The analyses offer him and his subscribers a way to stay on the right side of the market.
You may view this letter’s content calendar at this link.
Disclaimer
Do not construe this newsletter as advice. All content is for informational purposes. Capelj and Physik Invest manage their own capital and will not solicit others for it.
Physik Invest’s Daily Brief is read free by thousands of subscribers. Join this community to learn about the fundamental and technical drivers of markets.
Graphic updated 7:15 AM ET. Sentiment Risk-Off if expected /MES open is below the prior day’s range. /MES levels are derived from the profile graphic at the bottom of this letter. Click here for the latest levels. SqueezeMetrics Dark Pool Index (DIX) and Gamma (GEX) with the latter calculated based on where the prior day’s reading falls with respect to the MAX and MIN of all occurrences available. A higher DIX is bullish. The lower the GEX, the more (expected) volatility. Click to learn the implications of volatility, direction, and moneyness. Breadth reflects a reading of the prior day’s NYSE Advance/Decline indicator. The CBOE VIX Volatility Index (INDEX: VVIX) reflects the attractiveness of owning volatility. UMBS prices via MND. Click here for the economic calendar.
Administrative
Yesterday’s newsletter put forth the writer’s discussion with Simplify’s Mike Green, fresh after he spoke at Exchange Miami. The letter covered a lot, albeit in a messy way, given some unforeseen obligations. Today, we clarify those narratives for you. Hopefully, you enjoy it, and take care!
Fundamental
In summary, Simplify’s Michael Green trades 60/40-looking portfolios on macroeconomic signals while using derivative exposures to reduce volatility and amplify profit potential (e.g., responding to economic data in real-time by trading options on the CME Group Inc’s [NASDAQ: CME] Eurodollar [FUTURE: /GE], a tool to express views on future interest rates).
His conversation with your letter writer covered a variety of topics including the reliability of data and what that means for his active management, derivatives trading, strength potential in markets, as well as what he’s optimistic about. Here’s what you need to know.
1 – Green explains that his preferred macro guides for decision-making are unclear. He explains that traditional adjustments “ranging from seasonality to the birth-death models used in smoothing employment reports” are in question, and he jokes that developed market data sets are approaching emerging market data sets in terms of quality.
2 – Green reflects on 2022 noting options, colloquially referred to as volatility, were a big underperformer. “One-year variance swaps or implied volatility on an at-the-money S&P 500 put option would trade somewhere in the neighborhood of 25 to 30%,” he explains. “That implies a level of daily price movement that is difficult to achieve.”
Having learned their lesson, in 2023 investors swapped long-dated volatility exposures for ones with bounded risk (e.g., Bear Put Spread) and less time to expiry (e.g., 0 DTE).
Graphic: Retrieved from Goldman Sachs Group Inc (NYSE: GS).
Though both may leave counterparties with less risk, if news shocks the market far one way, market movements may become exaggerated when investors, and counterparties accordingly, scramble to adjust their risk.
Major Wall Street players and clearing houses have, too, just announced an investigation into the risks such activity poses as well.
One options trader is making a monster bet on market volatility exploding into the summer months.
Up until now, however, the activity has manifested a push-and-pull, mean-reverting-type action; investors lean short volatility in the morning and long volatility in the afternoon which, combined, tends to mute price action.
Graphic: Retrieved from Bank of America Corporation (NYSE: BAC).
Say one morning an “investor sells call options and a dealer receives them,” Green puts forth as an example. “The dealer will hedge their long call position by selling futures which will pressure the market and result in the options prices collapsing in value.”
To re-hedge falling options prices, “dealers have to buy back their futures exposure and this pushes the markets upward. This is the pattern that’s been playing out over and over again. It’s weakness in the morning followed by strength in the afternoon.”
Though this is a very smart exposure to have, Green says volatility that’s longer-dated is cheap and, when an eventual shock occurs, its payout may more than justify its cost, particularly as the outlook for equities, bonds, and commodities further blurs.
Graphic: Retrieved from Goldman Sachs Group Inc (NYSE: GS) via The Market Ear.
3 – Despite still-robust appearing economic data, Green sees clear signs the economy is starting to deteriorate.
Graphic: Retrieved from Bloomberg. “If the unemployment data this week is very strong then you’ve got 50 basis points back on the table,” explained Bob Michele, the chief investment officer of JPMorgan Asset Management. “But that is a pretty high hurdle to get to once you’ve down-shifted to 25 basis points.”
“We’re seeing cracks in bubbles like commercial real estate” and risk assets including crypto, presently maintained by a lack of inventory or supply that’s tied up in the bankruptcy proceedings of FTX (CRYPT0: FTT) and Voyager Digital Ltd (ex-OTC: VYGVF), of all things.
Graphic: Retrieved from JPMorgan Chase & Co (NYSE: JPM) via The Market Ear. “Excess liquidity is being withdrawn at an accelerating pace.”
“The question is whether higher interest rates ultimately drive a fraction of the market into distress with forced transactions,” Green wonders, pointing to the likes of Blackstone Inc (NYSE: BX) and Brookfield Corp (NYSE: BN) handing in keys to properties. “It takes one person being in distress to set a new clearing price which, in turn, changes valuations for everybody, and makes it more difficult to qualify for things like mortgages.”
So $SVIB has $200b in assets, of which $116 are securities. About $80b of that are high quality liquid assets that could be sold or repo'd for cash. Looks good until.. pic.twitter.com/SmX1JqLg9E
4 – Looking forward, over the short-term at least, Green says inflation is likely to trend higher for longer, particularly with monetary policy inspiring fiscal action and sparking off geopolitics.
“The world’s growing materially slower and manufacturing capacity, which is spreading around the world, requires labor and investment, which could be inflationary in the short-run,” Green puts forth. Traditionally, “lower rates and costs enable added capacity and a predictable rebound in consumption. However, we’re driving a stake through the vampire’s heart, now, and … there’s the multiplier effect driving fiscal policy, too.”
Graphic: Retrieved from CME Group Inc’s (NASDAQ: CME) FedWatch Tool. The terminal (peak) rate sits at 5.50-5.75%.
5 – In response to uncertainty, investors can park cash in Treasury bonds, as well as allocate some capital to volatility “to introduce a degree of convexity,” risking only the premium paid. Alternatively, investors can take a more optimistic long view and position in innovations like artificial intelligence or next-generation energy production.
Graphic: Retrieved from Goldman Sachs Group Inc (NYSE: GS) via The Market Ear. Investors are not concerned with tail risk.
“I’m optimistic about human innovation and the rise of AI, … as well as higher energy prices creating the impetus for tremendous innovations in energy generation that have the potential to lift us out of this period of perceived scarcity if we allow ourselves to embrace it.”
Technical
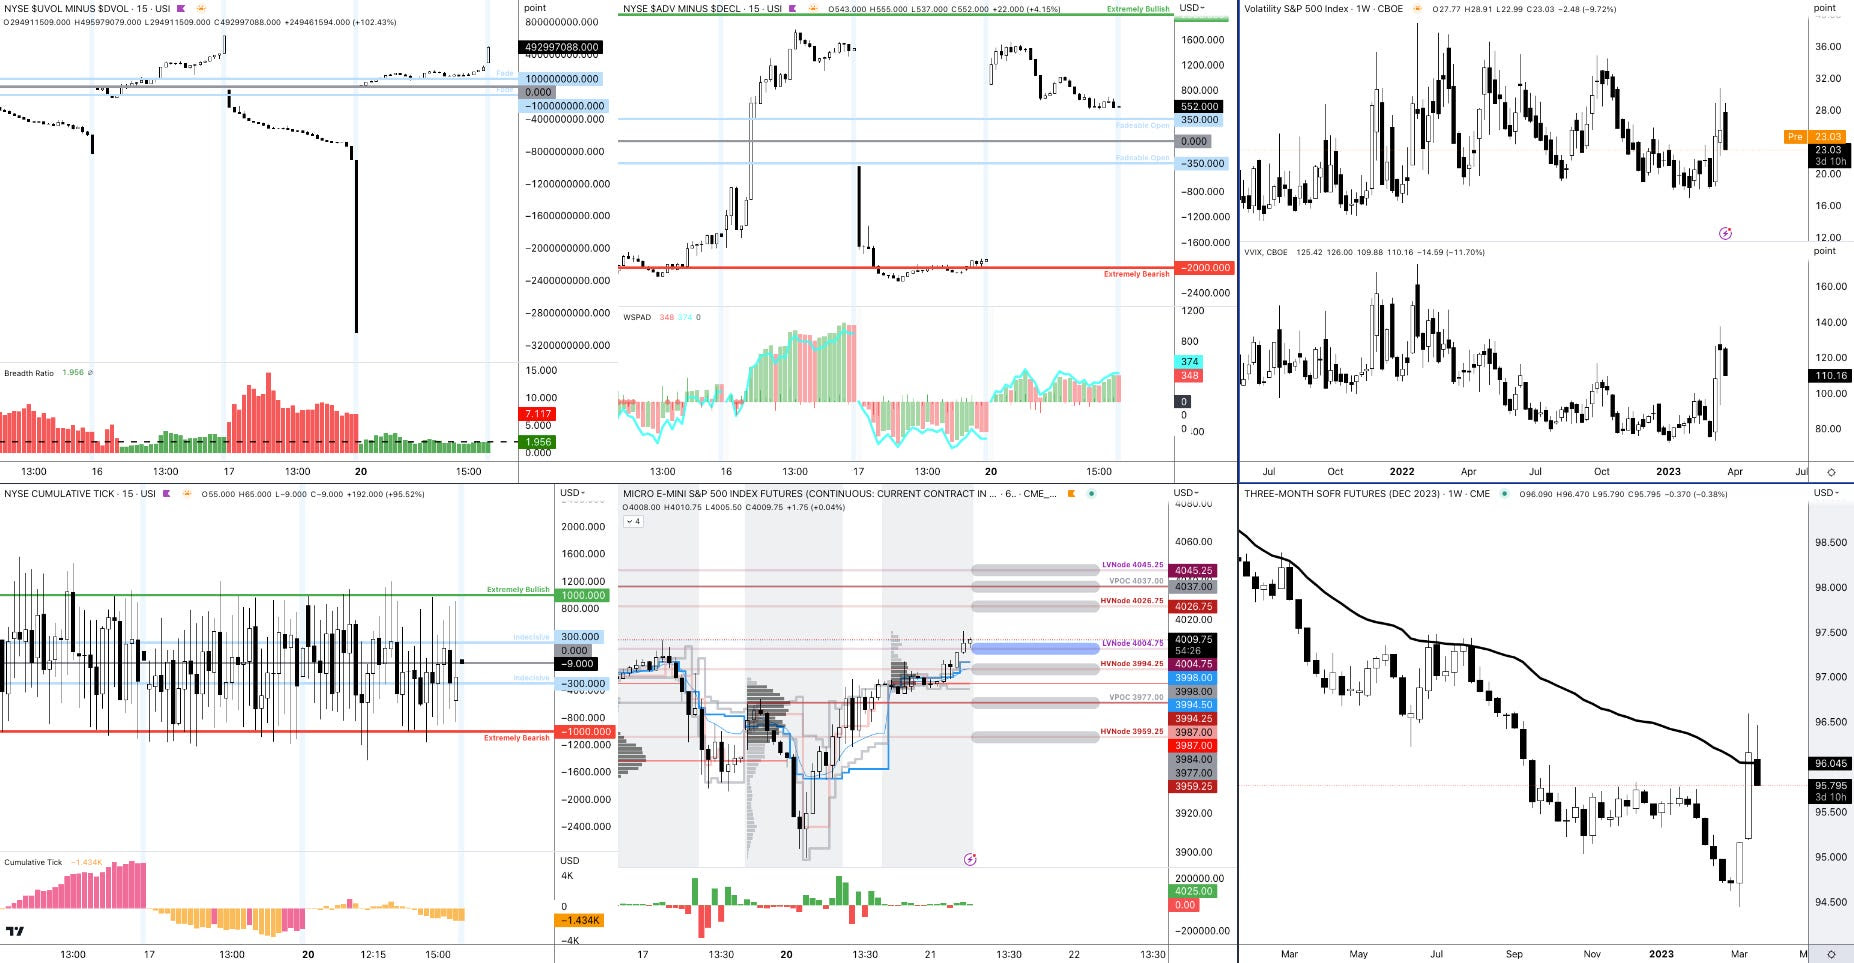
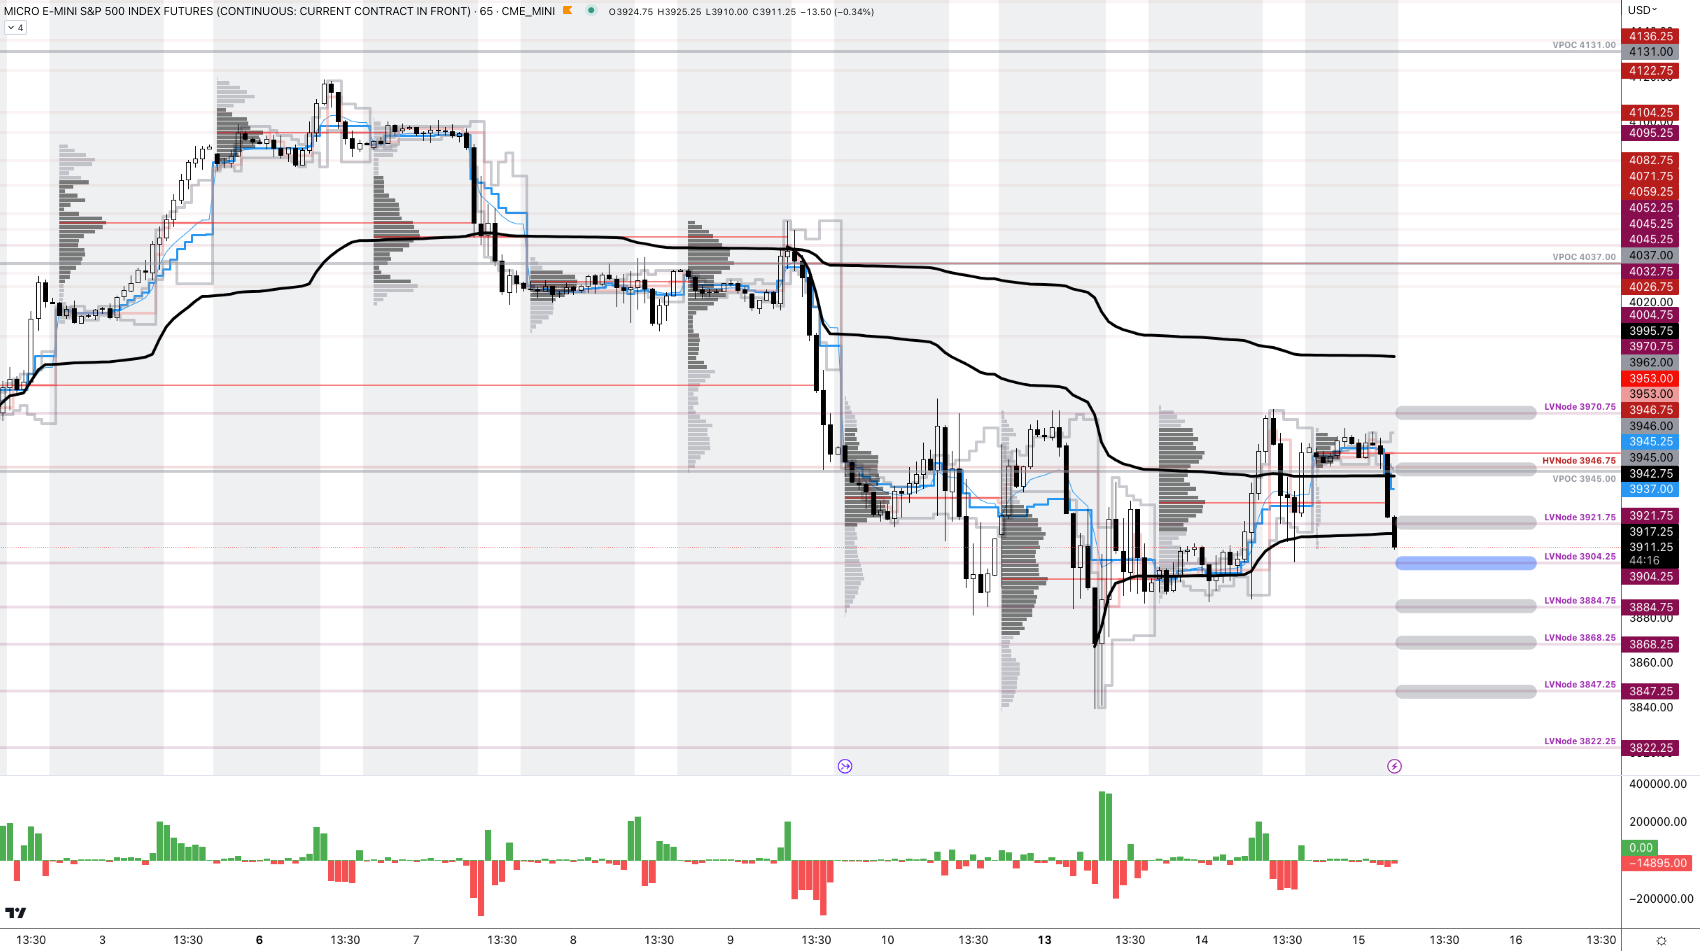
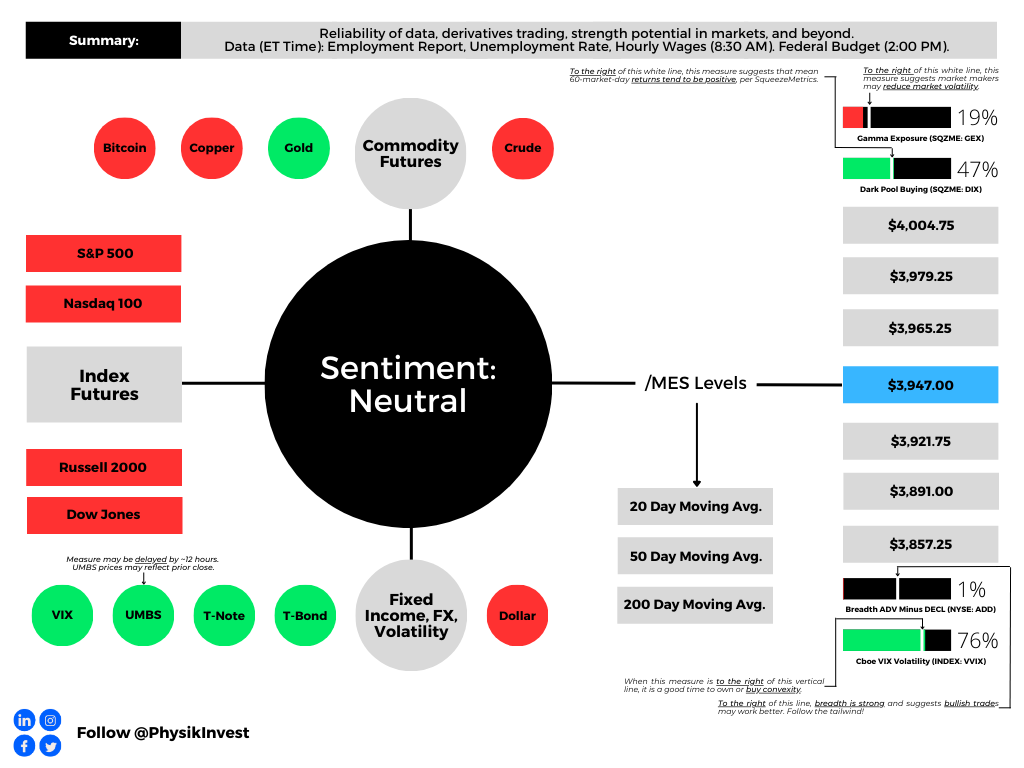
As of 8:00 AM ET, Friday’s regular session (9:30 AM – 4:00 PM ET), in the S&P 500, is likely to open in the upper part of a negatively skewed overnight inventory, outside of the prior day’s range, suggesting a potential for immediate directional opportunity.
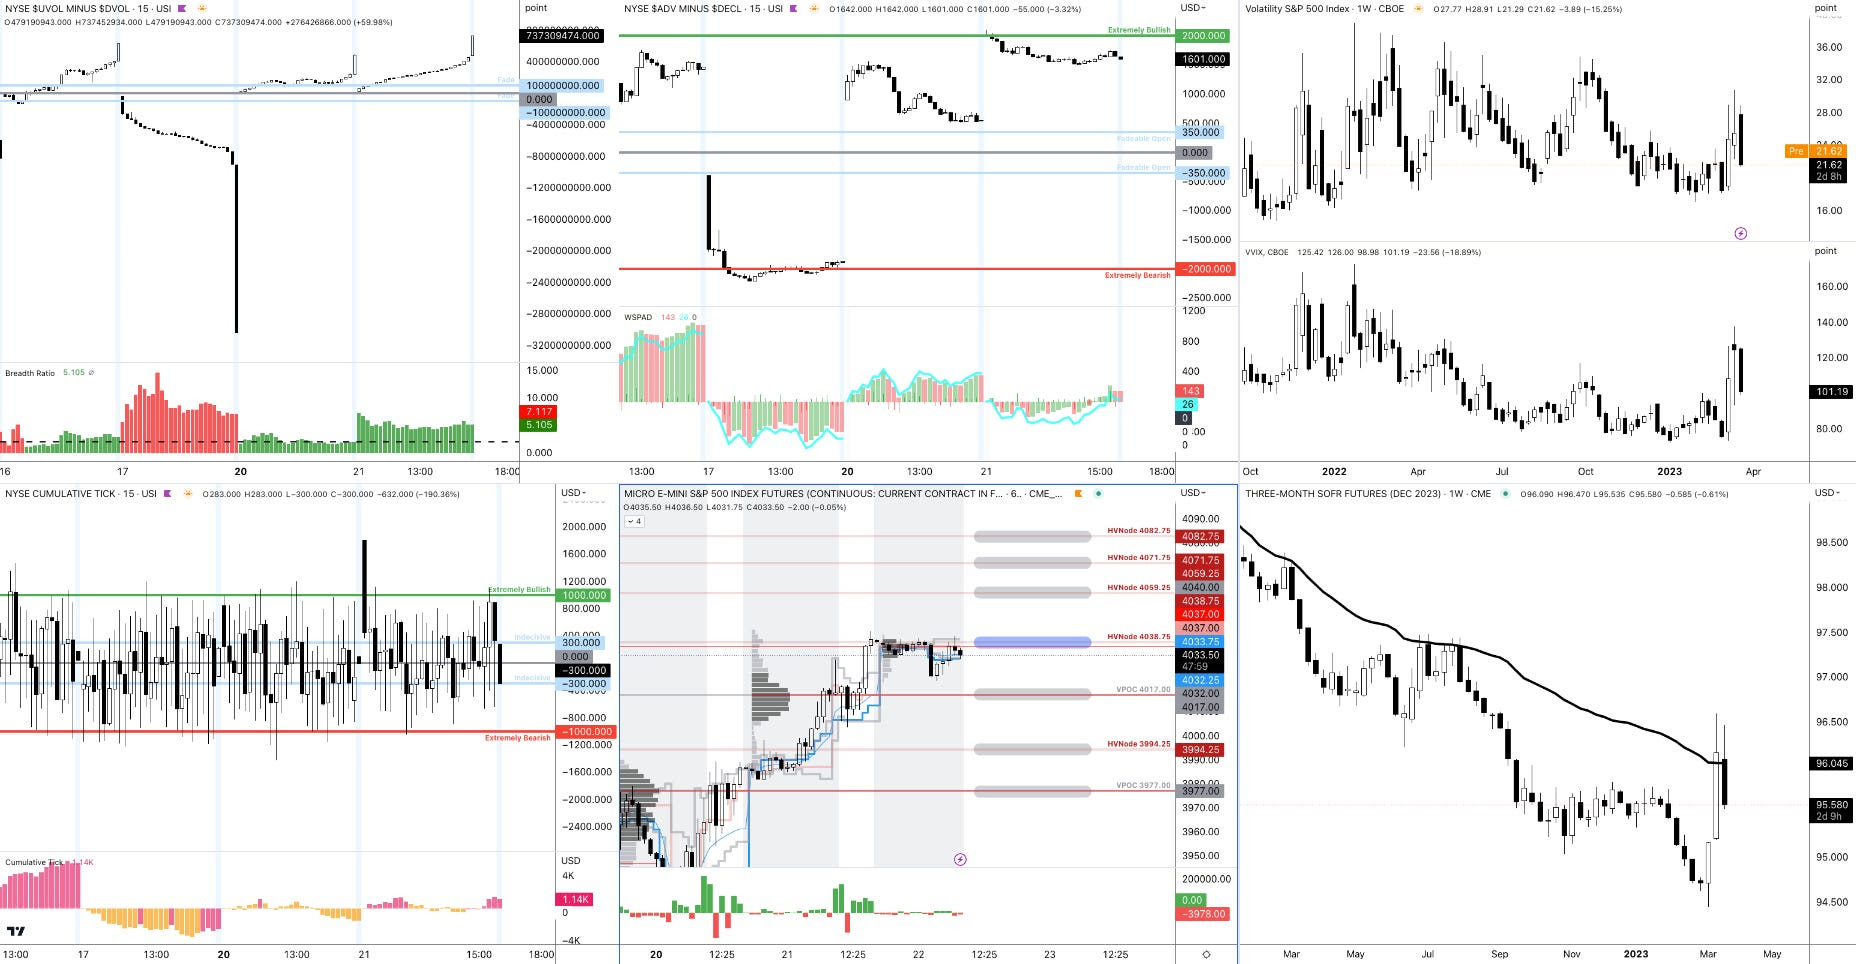
The S&P 500 pivot for today is $3,947.00.
Key levels to the upside include $3,965.25, $3,979.25, and $4,004.75.
Key levels to the downside include $3,921.75, $3,891.00, and $3,857.25.
Disclaimer: Click here to load the updated key levels via the web-based TradingView platform. New links are produced daily. Quoted levels likely hold barring an exogenous development.
Graphic: 65-minute profile chart of the Micro E-mini S&P 500 Futures (bottom middle) and market internals as taught by Peter Reznicek.
Definitions
Volume Areas: Markets will build on areas of high-volume (HVNodes). Should the market trend for a period of time, this will be identified by a low-volume area (LVNodes). The LVNodes denote directional conviction and ought to offer support on any test.
If participants auction and find acceptance in an area of a prior LVNode, then future discovery ought to be volatile and quick as participants look to the nearest HVNodes for more favorable entry or exit.
POCs: Areas where two-sided trade was most prevalent in a prior day session. Participants will respond to future tests of value as they offer favorable entry and exit.
MCPOCs: Denote areas where two-sided trade was most prevalent over numerous sessions. Participants will respond to future tests of value as they offer favorable entry and exit.
About
The author, Renato Leonard Capelj, spends the bulk of his time at Physik Invest, an entity through which he invests and publishes free daily analyses to thousands of subscribers. The analyses offer him and his subscribers a way to stay on the right side of the market.
You may view this letter’s content calendar at this link.
Disclaimer
Do not construe this newsletter as advice. All content is for informational purposes. Capelj and Physik Invest manage their own capital and will not solicit others for it.