Categories
Commentary

Daily Brief For February 24, 2022

Editor’s Note: The Daily Brief is a free glimpse into the prevailing fundamental and technical drivers of U.S. equity market products. Join the 200+ that read this report daily, below!

What Happened

Overnight, equity index futures added to losses after news that Russia invaded Ukraine

The MOEX Russia Index fell nearly 50% while, at home in the U.S., equity index futures were off about 3%. Bonds rose with commodities which were led by crude oil (up ~9%). 

The CBOE Volatility Index (INDEX: VIX), a measure of implied volatility or participants’ forecast of likely movement in prices, printed 37.79 a ~7.00 jump from Wednesday.

This high-level context suggests to us the need for patience. Ranges will be wide. Positioning will compound headline-driven moves. Technical analyses will fail. Caution.

Ahead is data on jobless claims, gross domestic product, gross domestic income (8:30 AM ET), as well as new home sales (10:00 AM ET).
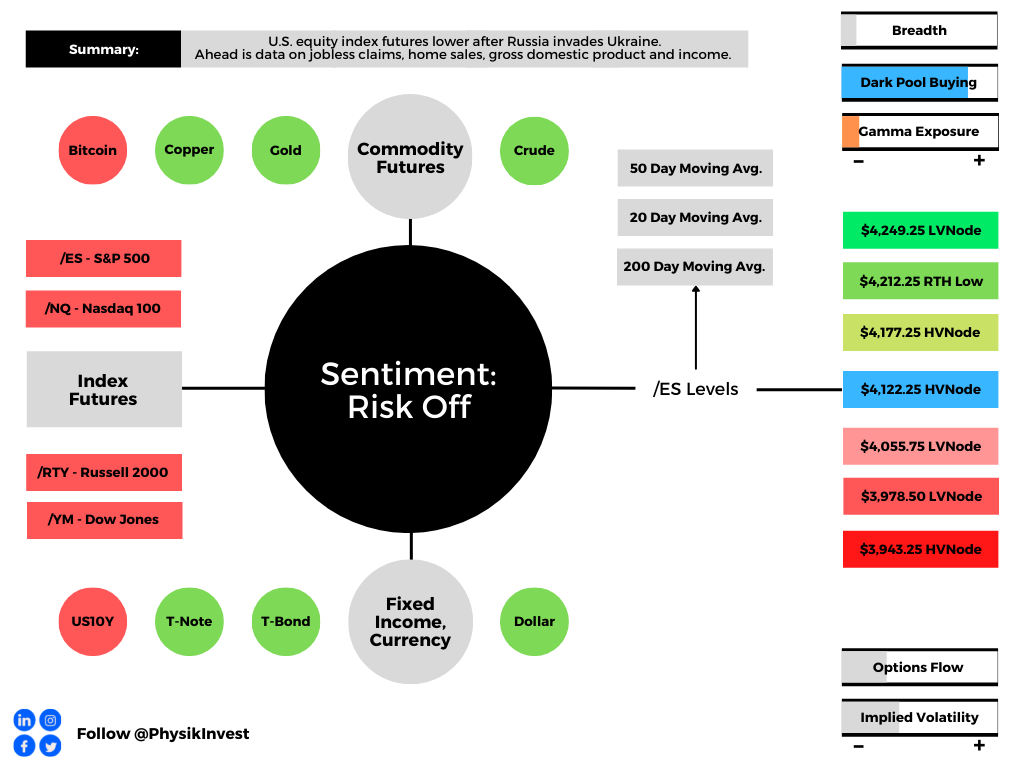
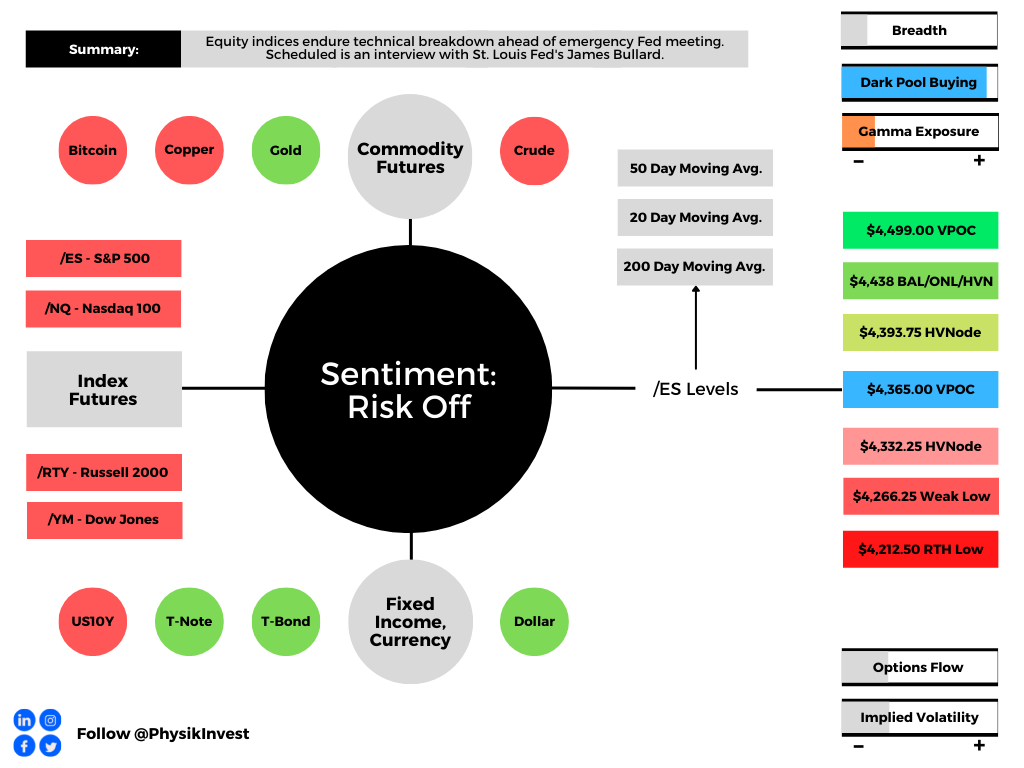
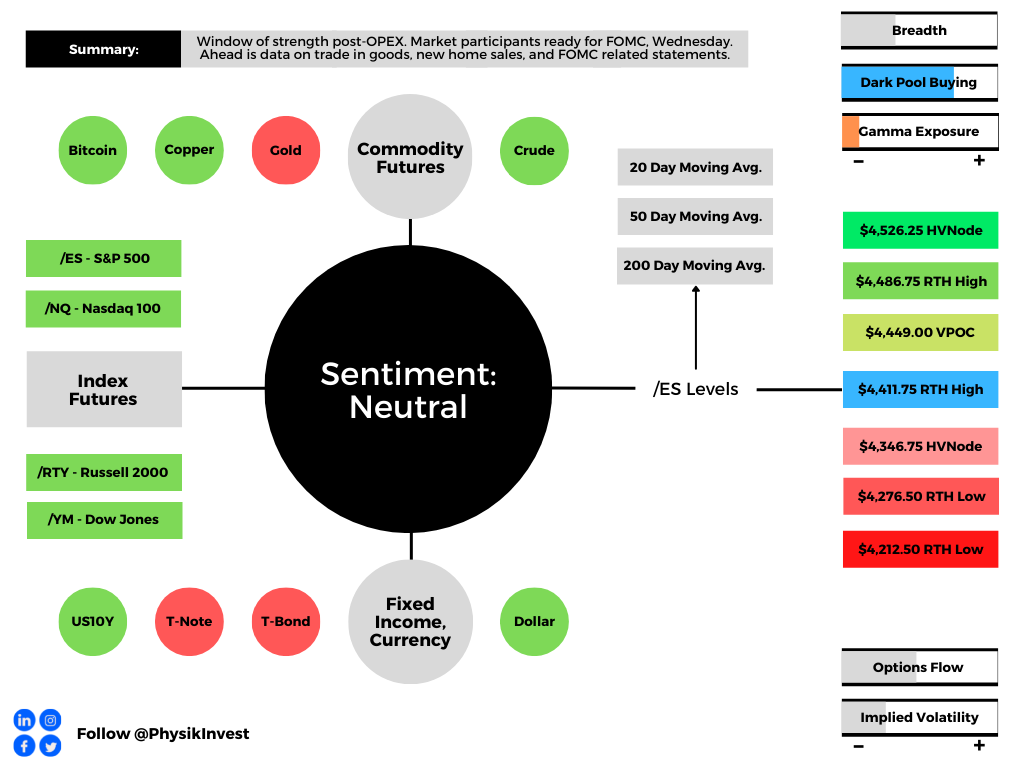
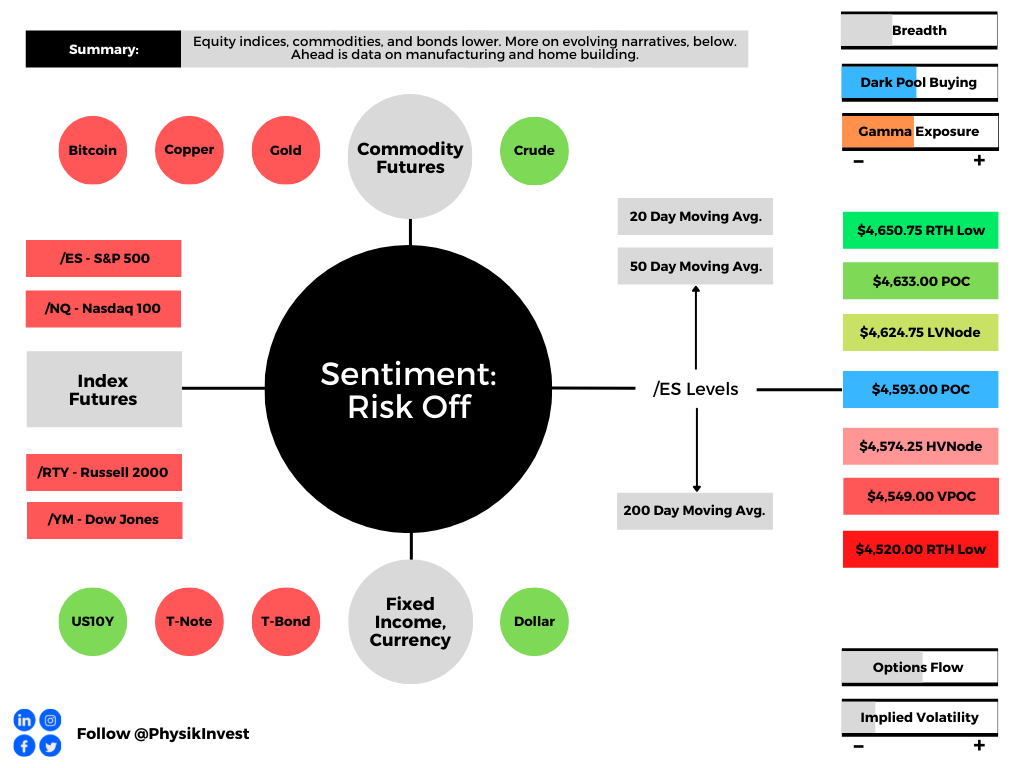
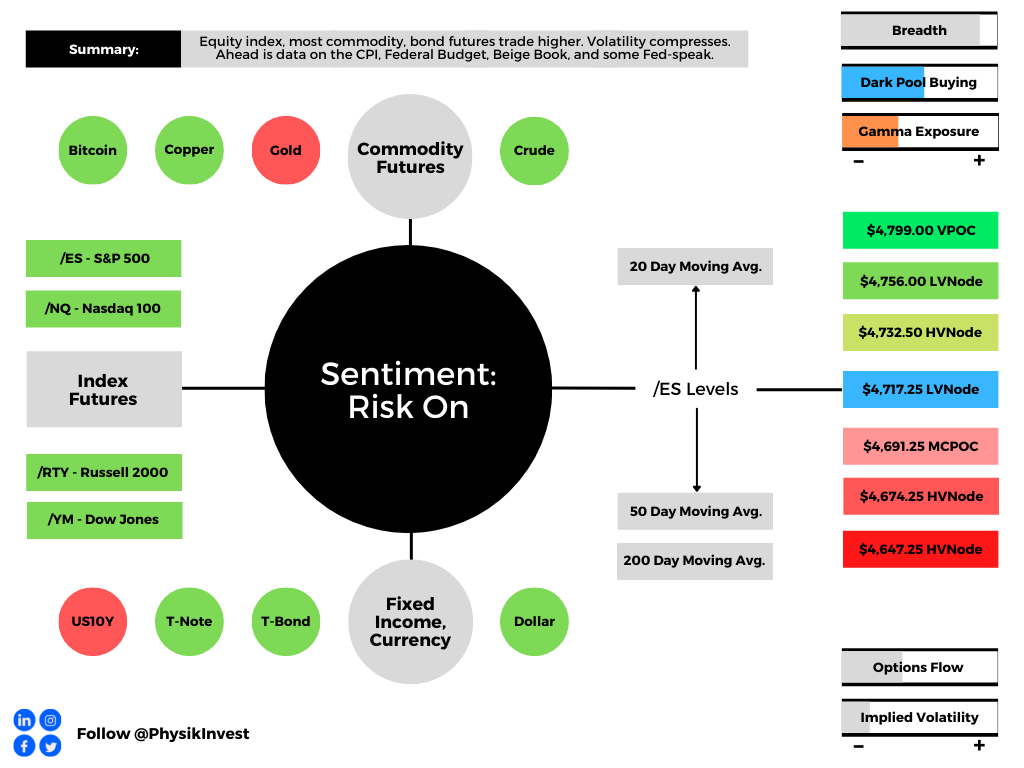
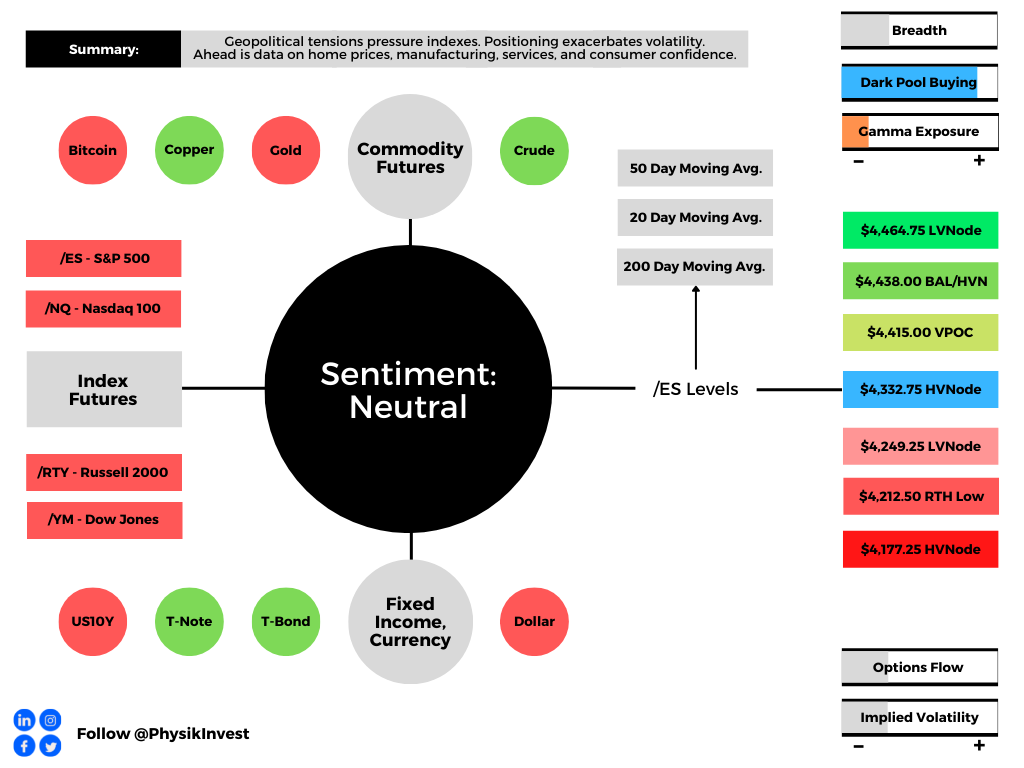
Graphic updated 6:45 AM ET. Risk-Off if expected /ES open is below the prior day’s range. /ES levels are derived from the profile graphic at the bottom of the following section. Levels may have changed since initially quoted; click here for the latest levels. SqueezeMetrics Dark Pool Index (DIX) and Gamma (GEX) calculations are based on where the prior day’s reading falls with respect to the MAX and MIN of all occurrences available. A higher DIX is bullish. At the same time, the lower the GEX, the more (expected) volatility. Learn the implications of volatility, direction, and moneyness. SHIFT data used for S&P 500 (INDEX: SPX) options activity. Note that options flow is sorted by the call premium spent; if more positive, then more was spent on call options. Breadth reflects a reading of the prior day’s NYSE Advance/Decline indicator. VIX reflects a current reading of the CBOE Volatility Index (INDEX: VIX) from 0-100.

What To Expect

Fundamental: “The ‘bad news = good news’ narrative for markets doesn’t work if the Fed is tightening amidst a slowdown and a military escalation risk. In this case, bad news = bad news.”

Pursuant to this remark by Alfonso Peccatiello, Russian equities fell the most on record (nearly 50%) after President Vladimir Putin ordered the demilitarization of Ukraine. 
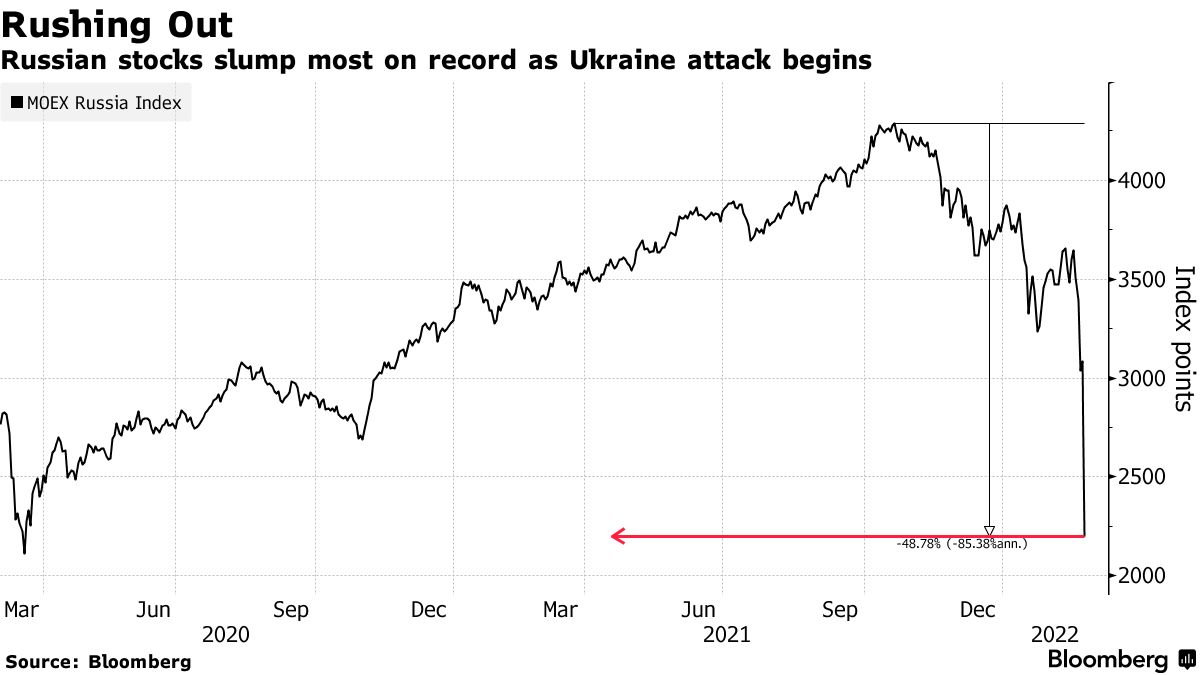
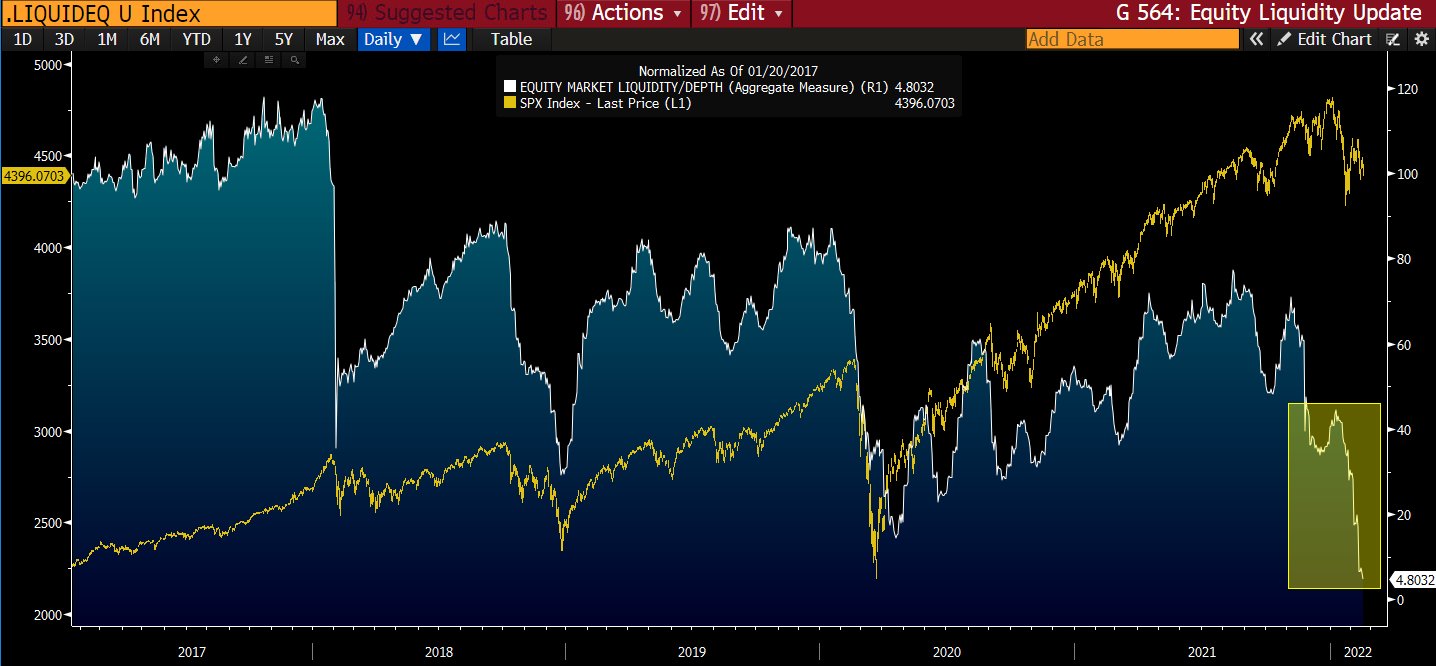
Graphic: Via Bloomberg.

According to Bloomberg, this crisis comes “after the U.S. and its allies crossed Russia’s ‘red lines’ by expanding the NATO alliance.”

In terms of the economic implications of Russia sanctions, it is “Cyprus and eastern European countries [that] are the most reliant on Russian imports in the EU.” 

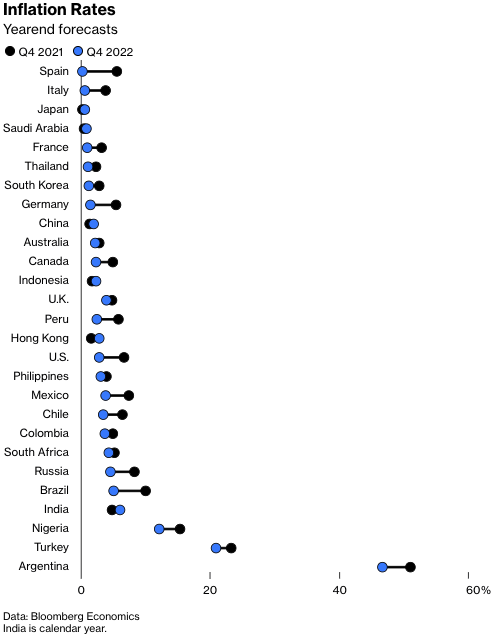
Ukraine’s crisis also throws a wrench at monetary tightening initiatives, abroad; “the European Central Bank will put even greater emphasis on its flexibility and options as it exits stimulus measures and shifts toward raising rates,” Governing Council member Francois Villeroy de Galhau said.
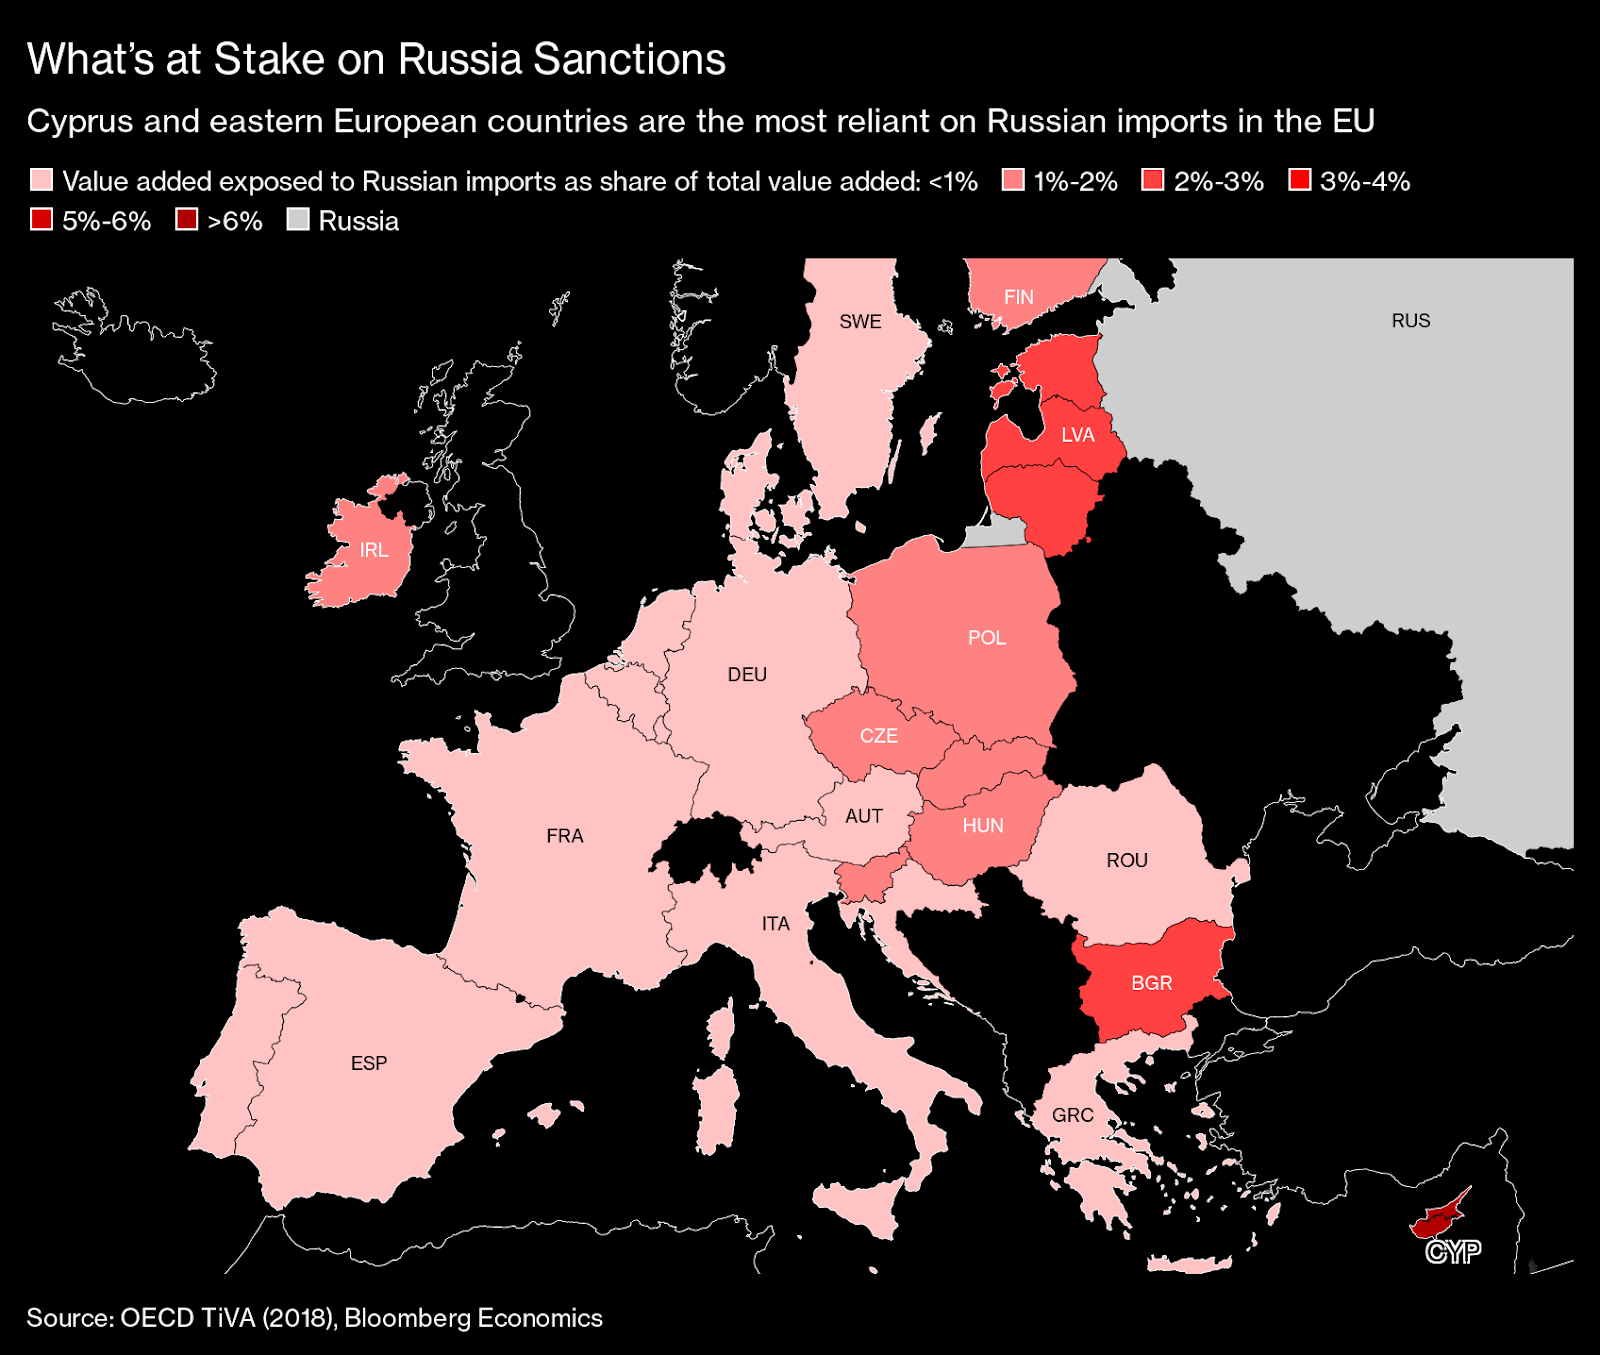
Graphic: Via Bloomberg.

Positioning: Implied volatility expands as heightened demand for protection is priced in.
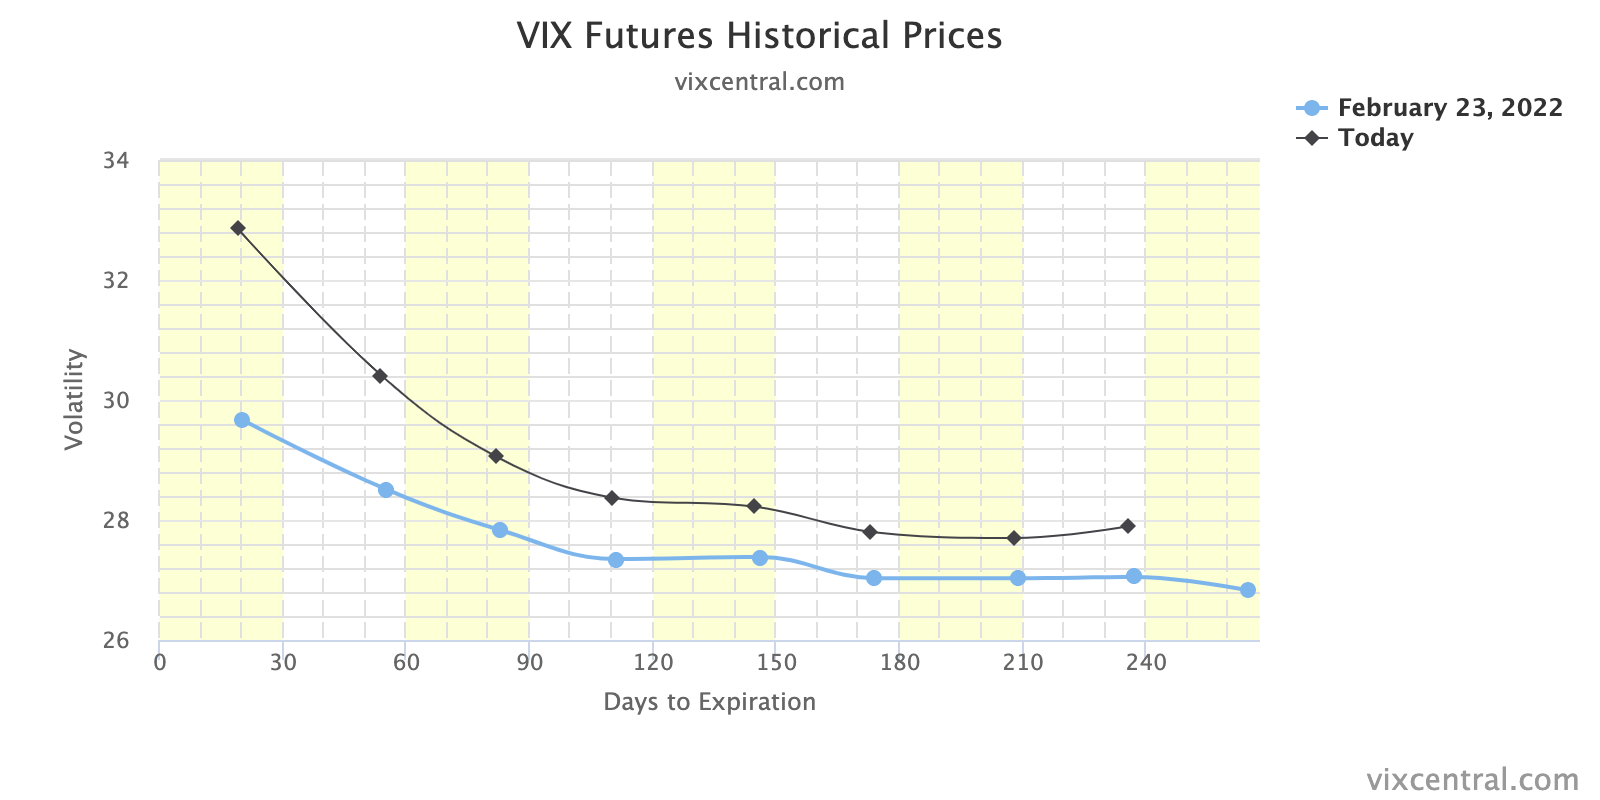
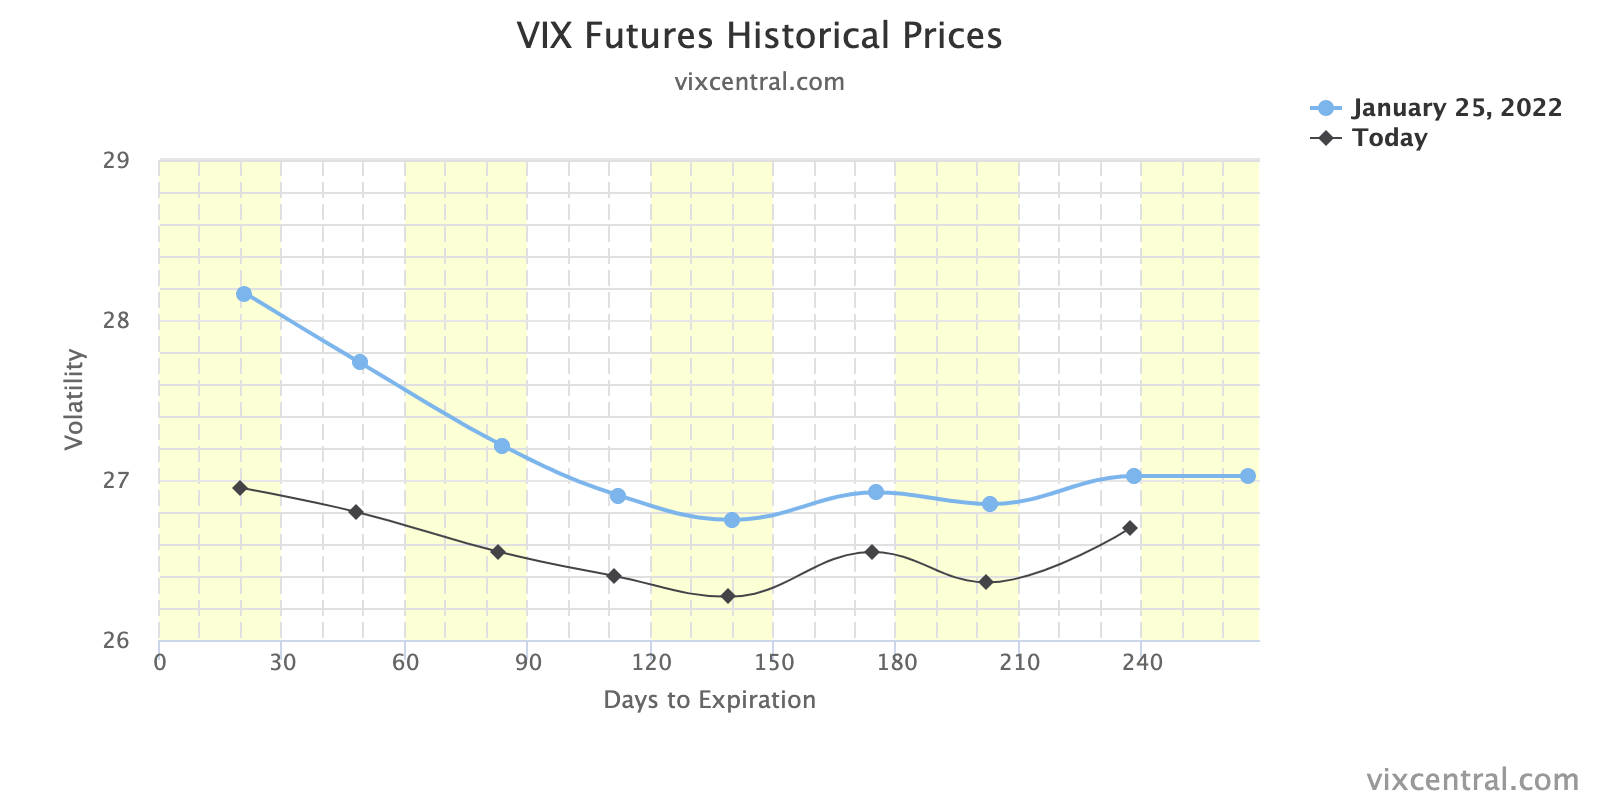
Graphic: VIX term structure shifts higher, especially at the front-end. This denotes the heightened potential for instability.

This comes after, according to views expressed by The Ambrus Group’s Kris Sidial, “we saw larger inflow[s] into equity funds, outflow[s] out of money markets, larger buying in the ATSs, with no real put buying.”

Graphic: Via EPFR, Barclays, and Bloomberg. Taken from The Market Ear.

In other words, measures of implied volatility were not performing; participants opportunistically buying the dip witnessed an SPX down, VIX down environment in which hedges were not being marked up accordingly.
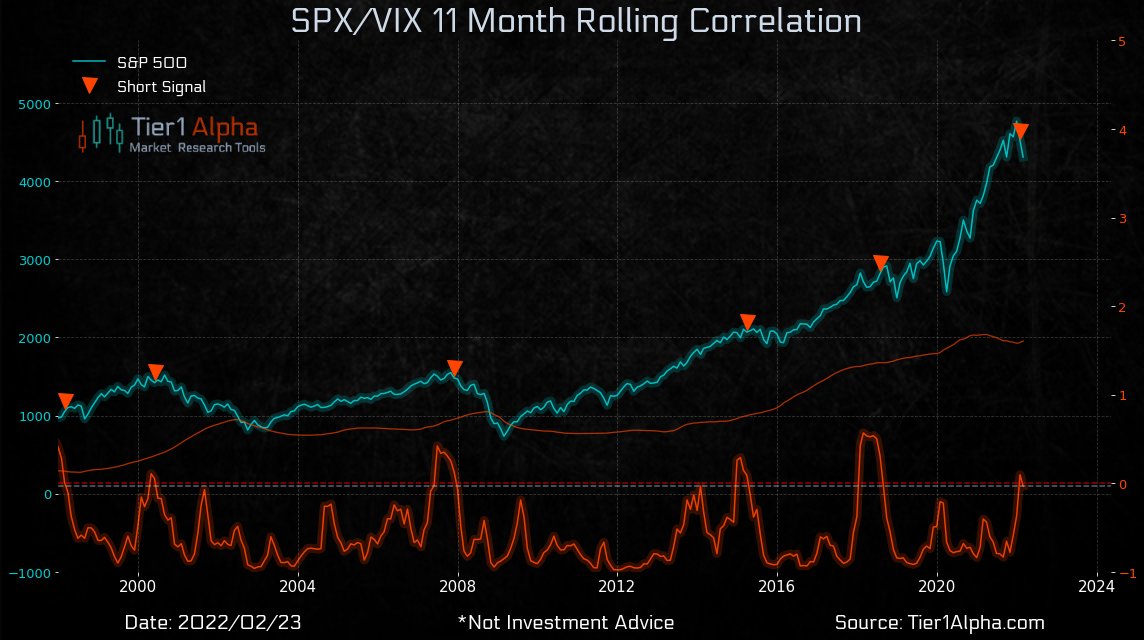
Graphic: Per Tier1Alpha, “In the past, when the $SPX/ $VIX correlation goes back to negative, there have been some pretty memorable volatility events. Worth keeping in mind.”

The implications of this action are staggering. 

As stated yesterday, as most participants, at least at the index level, own protection, the counterparties to this trade are short protection. 

These counterparties, therefore, have positive exposure to delta (i.e., as index falls [rises], position loses [makes] money) and negative exposure to gamma, or delta (directional) sensitivity to underlying price changes (i.e., as the index moves against short option exposure, losses are multiplied). 

With measures of implied volatility expanding, as is the case when there is heightened demand for downside put protection, protection is bid and the dealer’s exposure to positive delta rises, which solicits more selling in the underlying (addition of short-delta hedges).
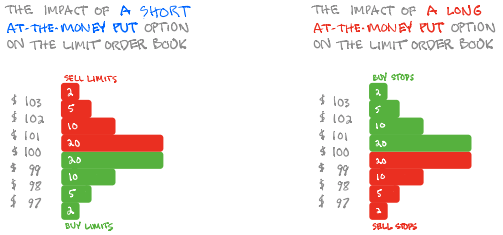
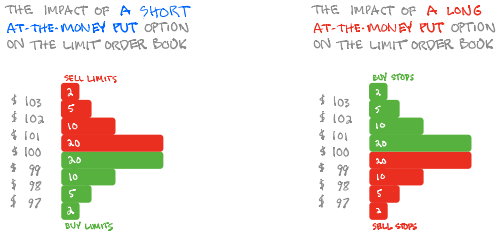
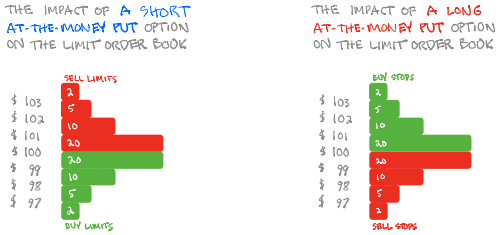
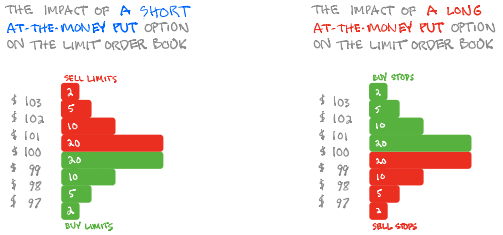
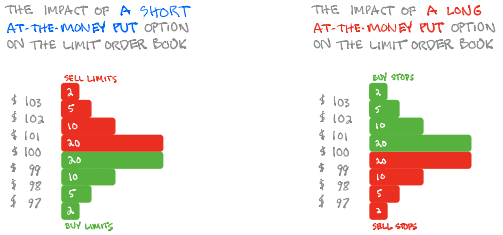
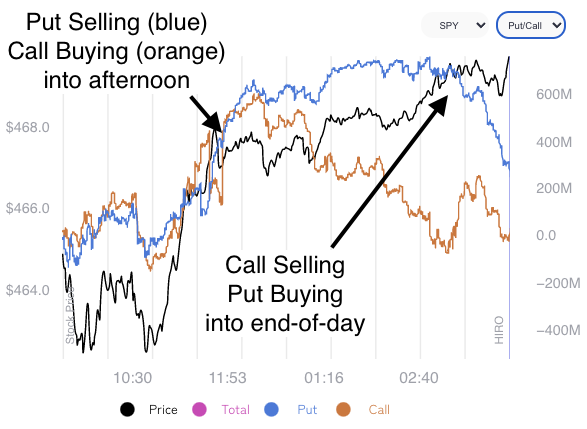
Graphic: SqueezeMetrics details the implications of customer activity in the options market, on the underlying’s order book. For instance, in selling a put, customers add liquidity and stabilize the market. How? The market maker long the put will buy (sell) the underlying to neutralize directional risk as price falls (rises).

To monitor for capitulation, we may look for when the volatility expectations of implied volatility metrics rise to extremes. Learn more about VVIX, here.
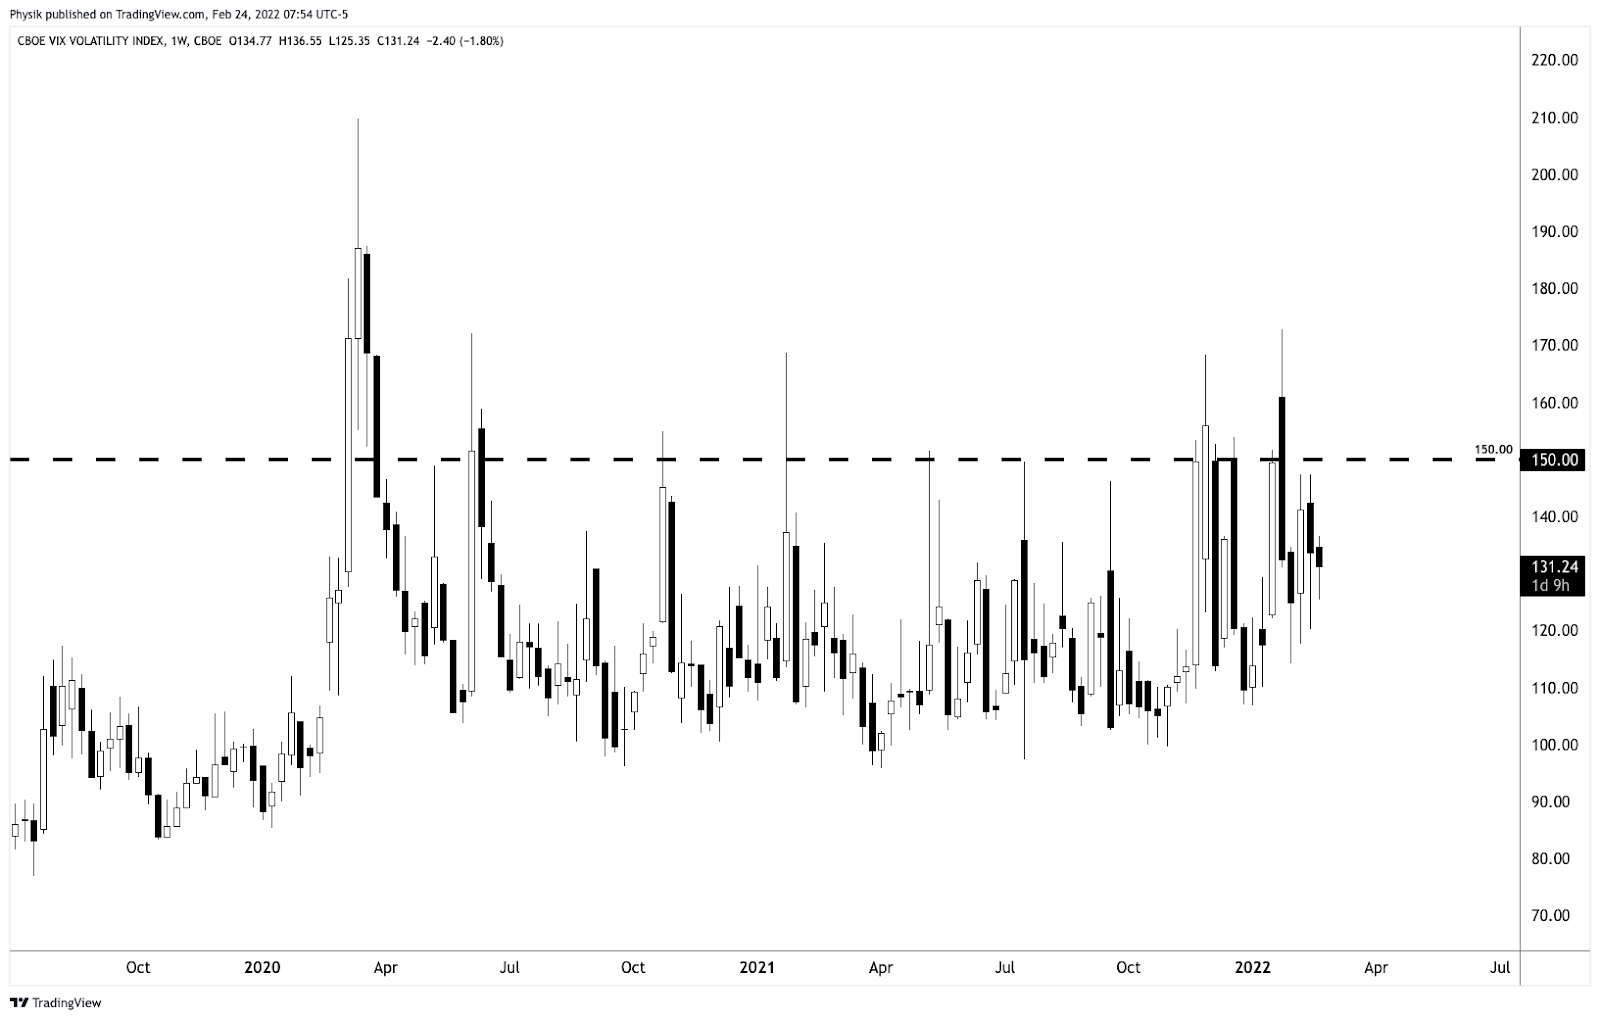
Graphic: Charting the CBOE Volatility-Of-Volatility Index (INDEX: VVIX). In that reach for highly “convex” options, counterparties react in a manner that exacerbates underlying price movement.

We may also measure for one-sidedness in sentiment by looking to naive metrics like the put/call ratio. Learn more about PCALL, here.
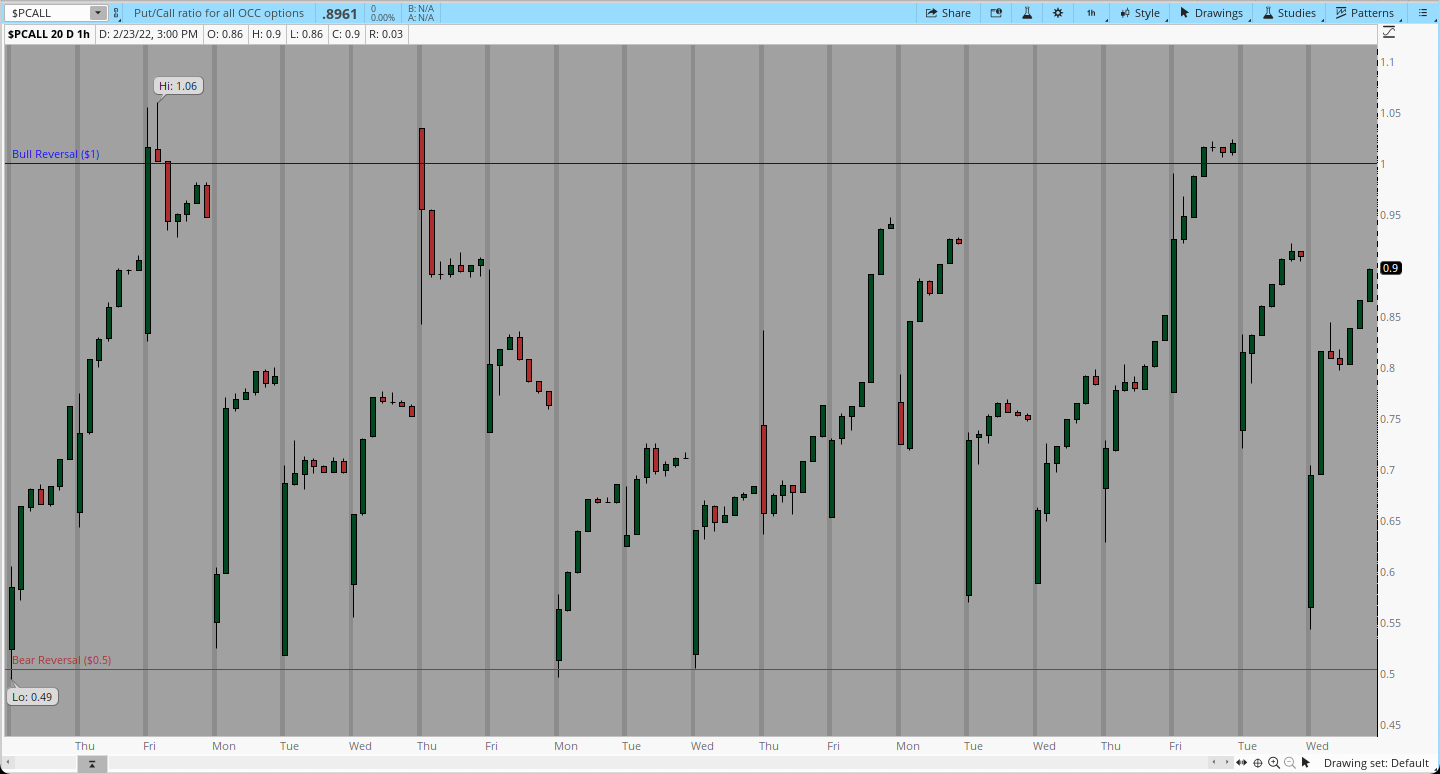
Graphic: Using the put/call ratio to gauge sentiment.

Technical: As of 6:30 AM ET, Thursday’s regular session (9:30 AM – 4:00 PM ET), in the S&P 500, will likely open in the lower part of a negatively skewed overnight inventory, outside of prior-range and -value, suggesting a potential for immediate directional opportunity.

Gap Scenarios: Gaps ought to fill quickly. Should they not, that’s a signal of strength; do not fade. Leaving value behind on a gap-fill or failing to fill a gap (i.e., remaining outside of the prior session’s range) is a go-with indicator.

Auctioning and spending at least 1-hour of trade back in the prior range suggests a lack of conviction; in such a case, do not follow the direction of the most recent initiative activity.

In the best case, the S&P 500 trades higher; activity above the $4,122.25 high volume area (HVNode) puts in play the $4,177.25 HVNode. Initiative trade beyond the HVNodes could reach as high as the $4,212.25 regular trade low (RTH Low) and $4,249.25 low volume area (LVNode), or higher.

In the worst case, the S&P 500 trades lower; activity below the $4,122.25 HVNode puts in play the $4,055.75 LVNode. Initiative trade beyond the latter could reach as low as the $3,978.50 LVNode and $3,943.25 HVNode, or lower.

Considerations: If you are not well-versed in navigating trade at heightened levels of volatility, it is best to sit on your hands (SOH) or trade with a smaller size. Often, on large gaps, indexes may move sideways (and not up or down). This can be frustrating. 

Also, in high volatility, negative-gamma environments, headlines matter, and technical analyses often fail. Do not think “this time is as others” and let this event lead to your demise. Caution.

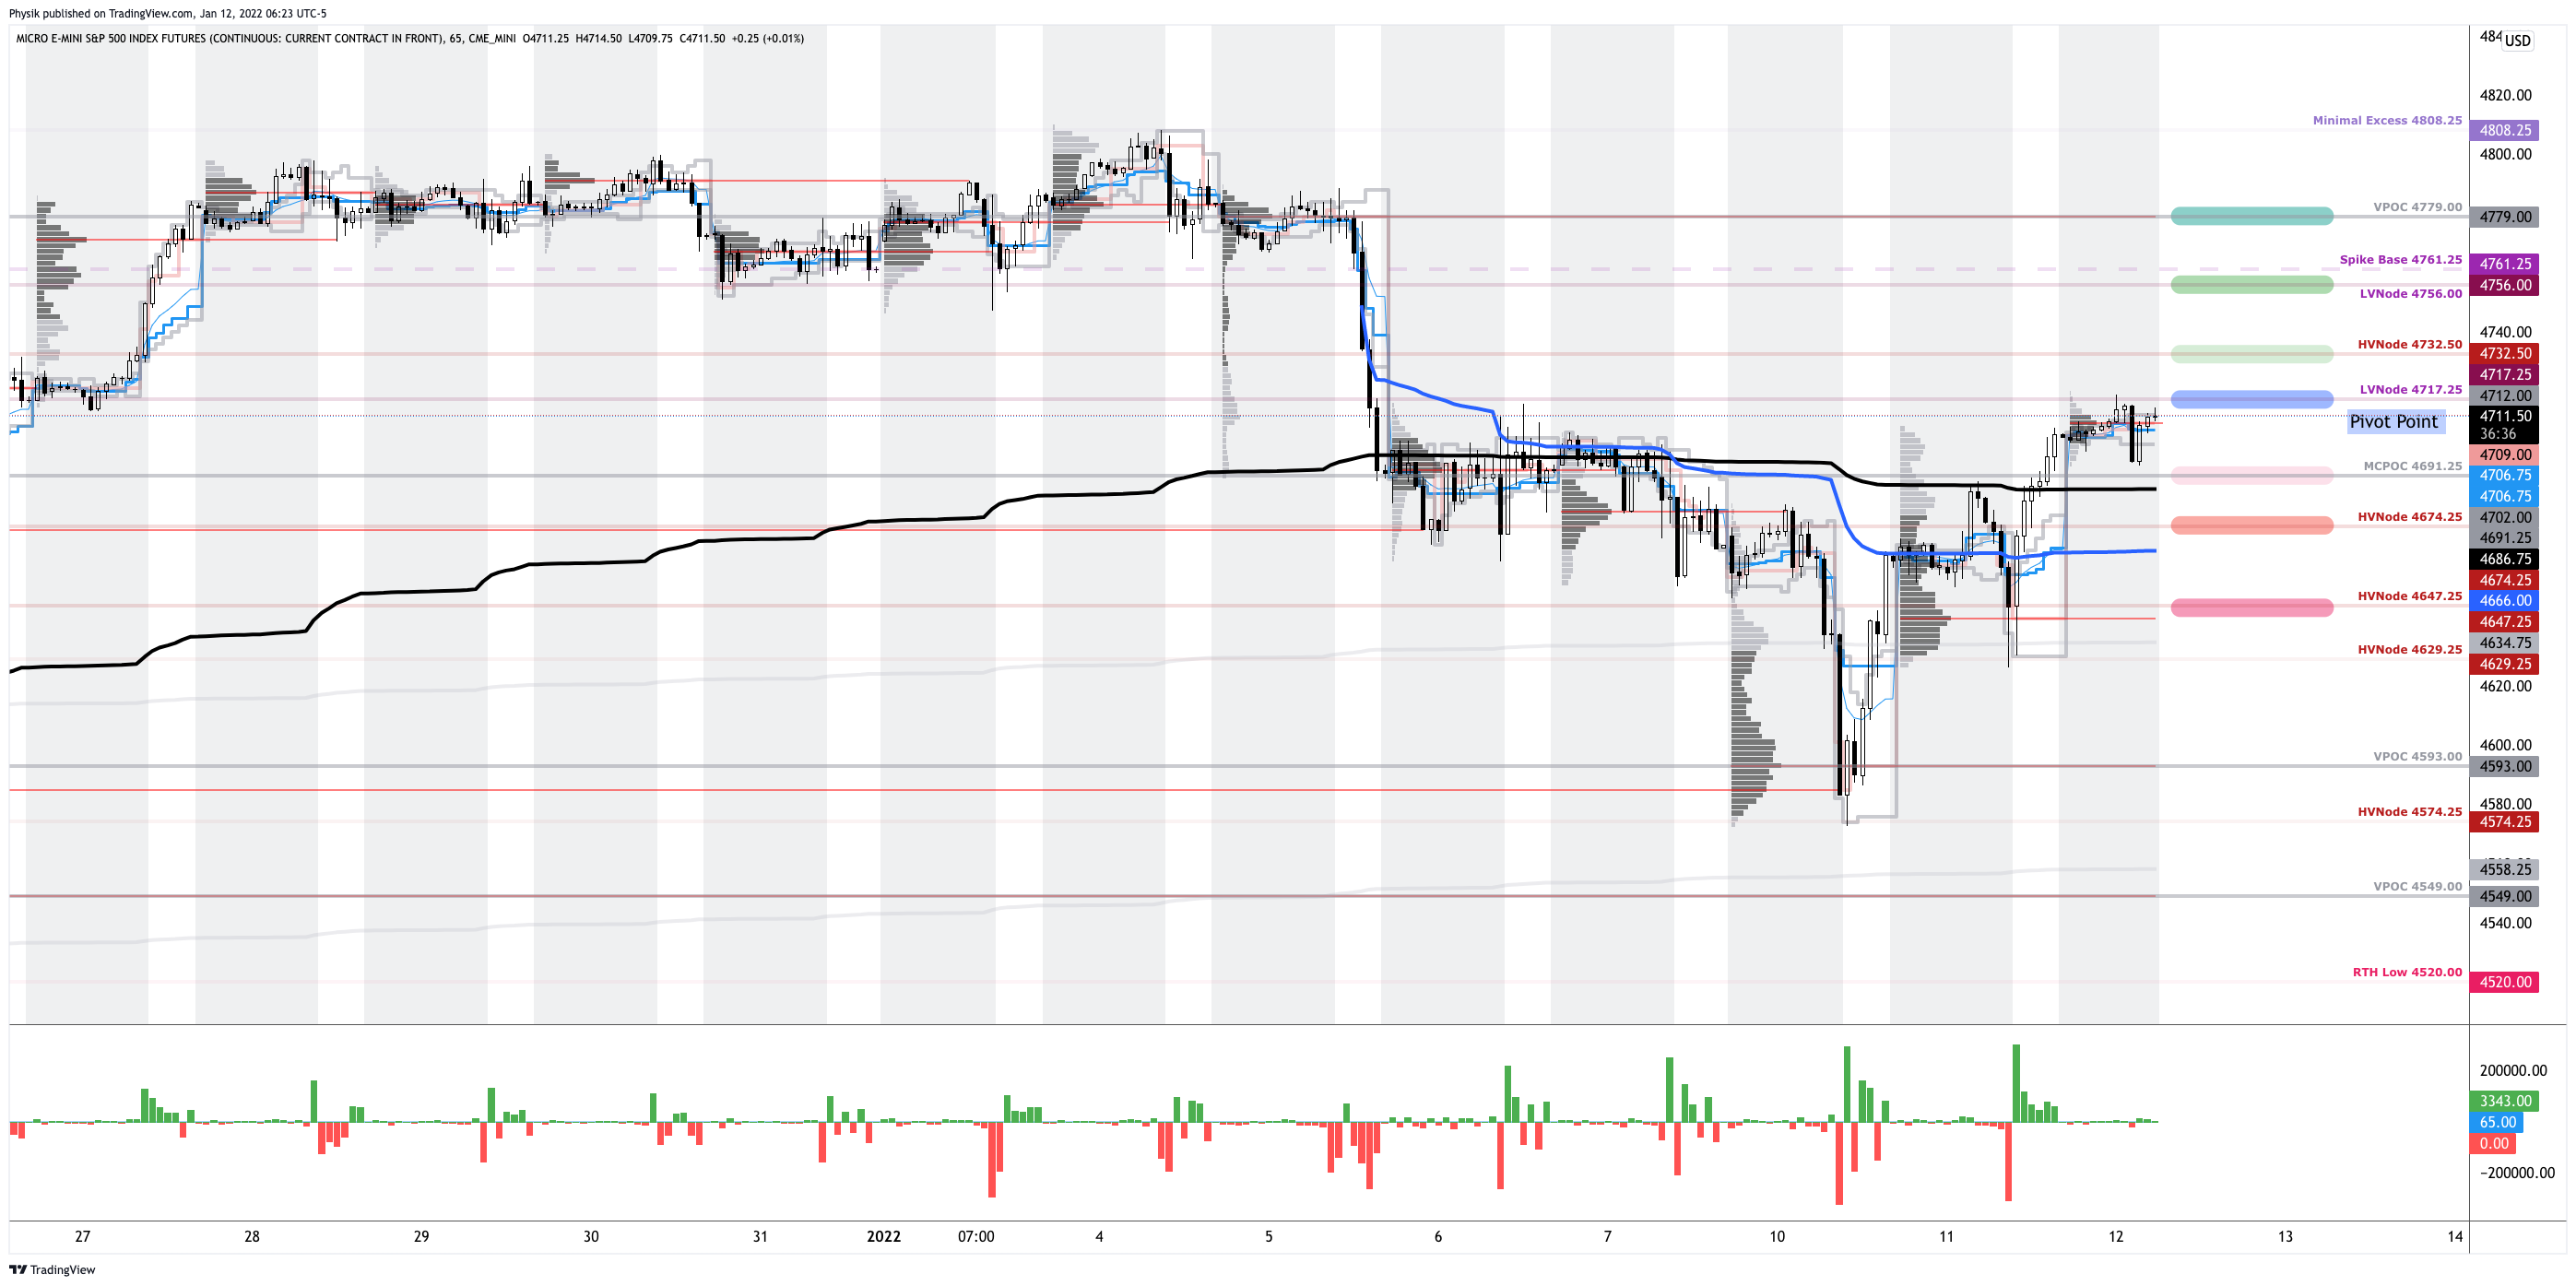
Click here to load today’s key levels into the web-based TradingView charting platform. Note that all levels are derived using the 65-minute timeframe. New links are produced, daily.
Graphic: 65-minute profile chart of the Micro E-mini S&P 500 Futures.

What People Are Saying

Definitions

Volume Areas: A structurally sound market will build on areas of high volume (HVNodes). Should the market trend for long periods of time, it will lack sound structure, identified as low volume areas (LVNodes). LVNodes denote directional conviction and ought to offer support on any test. 

If participants were to auction and find acceptance into areas of prior low volume (LVNodes), then future discovery ought to be volatile and quick as participants look to HVNodes for favorable entry or exit.

About

After years of self-education, strategy development, mentorship, and trial-and-error, Renato Leonard Capelj began trading full-time and founded Physik Invest to detail his methods, research, and performance in the markets.

Capelj is also a Benzinga finance and technology reporter interviewing the likes of Shark Tank’s Kevin O’Leary, JC2 Ventures’ John Chambers, FTX’s Sam Bankman-Fried, and ARK Invest’s Catherine Wood, as well as a SpotGamma contributor developing insights around impactful options market dynamics.

Disclaimer

Physik Invest does not carry the right to provide advice.

In no way should the materials herein be construed as advice. Derivatives carry a substantial risk of loss. All content is for informational purposes only.
Categories
Commentary

Daily Brief For February 22, 2022

Editor’s Note: The Daily Brief is a free glimpse into the prevailing fundamental and technical drivers of U.S. equity market products. Join the 200+ that read this report daily, below!

What Happened

During holiday and overnight trade, U.S. equity index futures probed below trading ranges established the week prior. Strong buying surfaced after a test of a key visual area.

Increased implied volatility (IV) to pressure markets as counterparties hedge directional risks. Present options positioning, combined with liquidity measures, suggest big moves up and down.

Ahead is data on the S&P Case-Shiller home price index and FHFA home price index (9:00 AM ET), Markit manufacturing and services PMI (9:45 AM ET), as well as the consumer confidence index (10:00 AM ET).

Graphic updated 6:40 AM ET. Sentiment Neutral if expected /ES open is inside of the prior day’s range. /ES levels are derived from the profile graphic at the bottom of the following section. Levels may have changed since initially quoted; click here for the latest levels. SqueezeMetrics Dark Pool Index (DIX) and Gamma (GEX) calculations are based on where the prior day’s reading falls with respect to the MAX and MIN of all occurrences available. A higher DIX is bullish. At the same time, the lower the GEX, the more (expected) volatility. Learn the implications of volatility, direction, and moneyness. SHIFT data used for S&P 500 (INDEX: SPX) options activity. Note that options flow is sorted by the call premium spent; if more positive, then more was spent on call options. Breadth reflects a reading of the prior day’s NYSE Advance/Decline indicator. VIX reflects a current reading of the CBOE Volatility Index (INDEX: VIX) from 0-100.

What To Expect

Fundamental: Are markets in turmoil?

Depends. Abroad, yes. At home, yes (but not as much).

Russian stocks, alongside Russia-Ukraine angst, sank the most since the 2008 financial crisis, pressuring markets in other parts of the world, as well. Russia’s MOEX Index plunged ~14% Monday.

The geopolitical disputes come alongside the threat of contractionary monetary policy. 

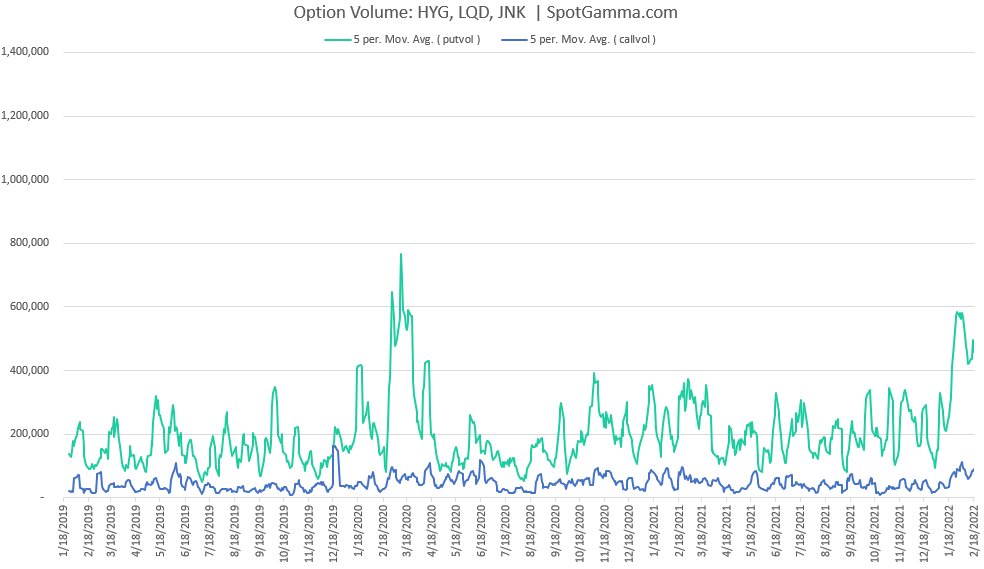
Graphic: Via SpotGamma. “There’s been a big pop in put volumes for the higher yield bond ETFs: JNK, HYG, and LQD. This syncs with the idea this sell-off is based mainly on rates with a side of geopolitics.”

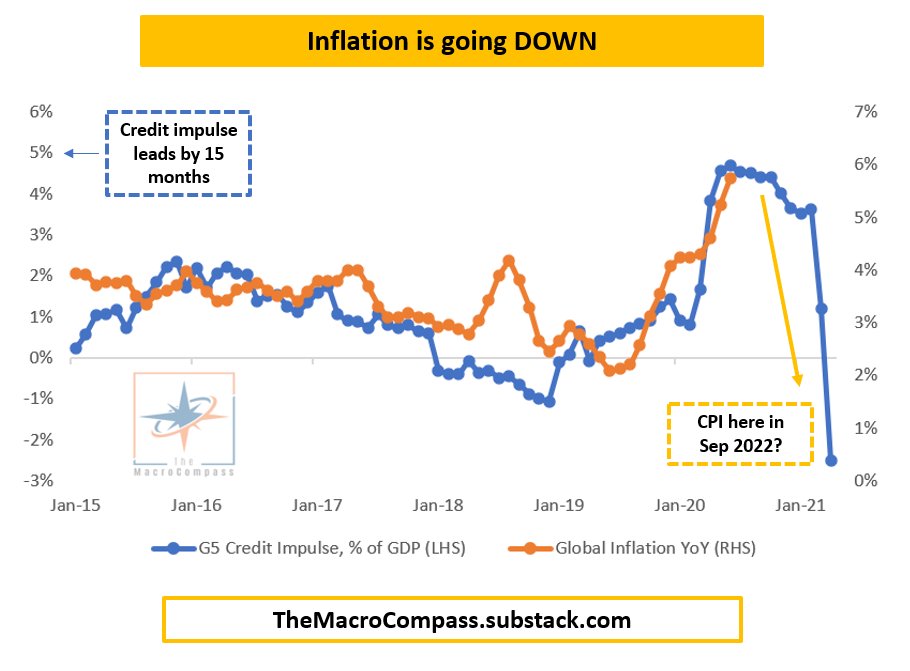
Some, however, say the risk premium expansion driven by inflation and tightening fears has run its course. 

Graphic: G5 credit impulse suggests inflation ought to trend lower. This particular metric, per Alfonso Peccatiello of The Macro Compass, leads GDP, CPI, and market returns by quarters.

According to a note published by Andy Constan of Damped Spring Advisors, “We believe that risk premium expansion has peaked. A new low … will require more than frontrunning but Fed action that is not currently priced into markets.”

That is as Mark Haefele, chief investment officer at UBS Group AG’s (NYSE: UBS) Global Wealth Management arm says that “Despite the recent volatility, it’s important to remember that we are still in an environment of robust economic and earnings growth.”

“Our base case we expect upside for equity markets over the balance of the year.”

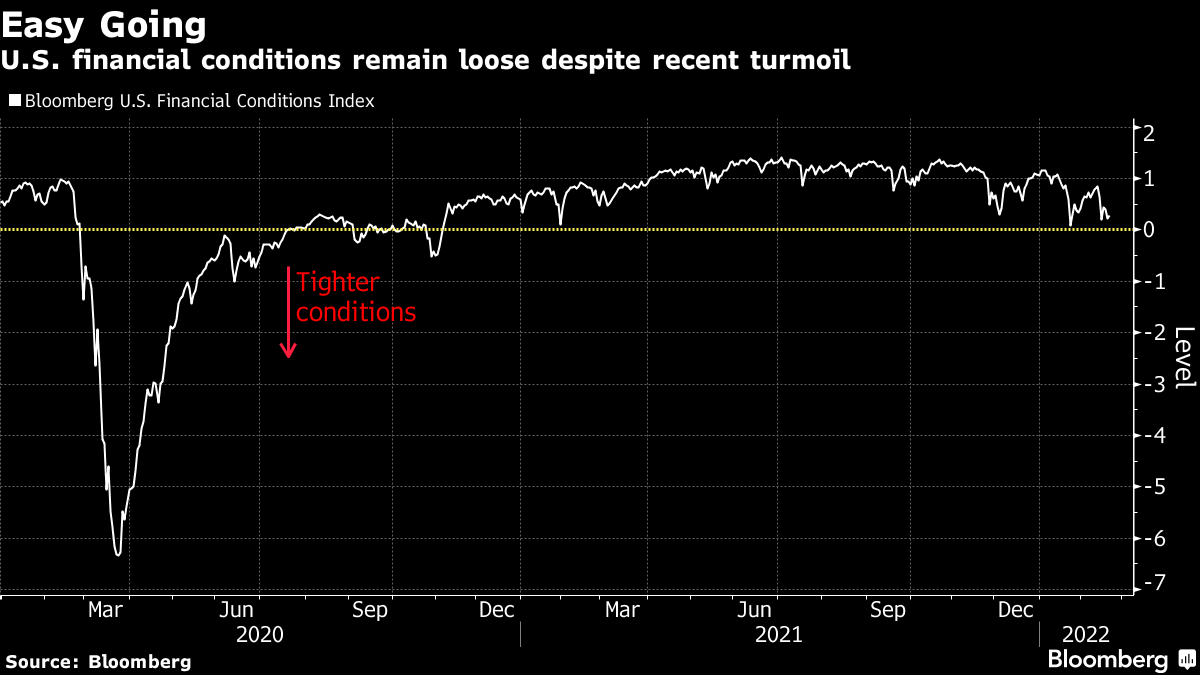
Graphic: Via Bloomberg. “If market dysfunction is reflected in tighter conditions, then this chart shows we’re nowhere near stressed levels — after all, central bank policy globally is historically loose.”

JPMorgan Chase & Co’s (NYSE: JPM) Mislav Matejka adds that stock pessimism is wrong and positioning for a recession would be too early given favorable financing conditions, strong labor, an underleveraged consumer, as well as strong cash flows and bank balance sheets. 

“We believe one should look through the widespread ‘slowdown’ calls that are currently in vogue, and stay bullish on banks, mining, energy, insurance, autos, travel and telecoms,” Matejka and his team wrote noting, too, that market internals are “bullish again.”

Does this mean that markets are positioned for a near-term bounce? Let’s see.

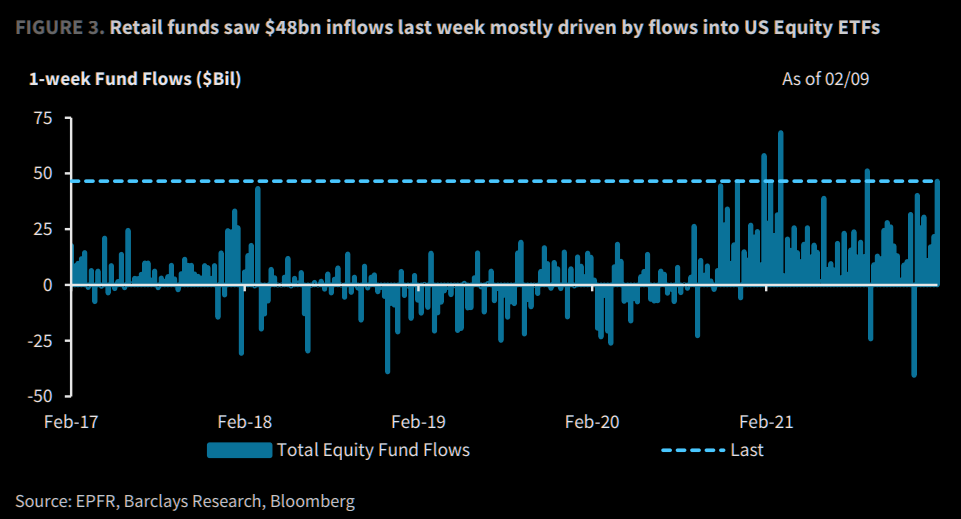
Positioning: As noted last week, passive buying flows continue to persist alongside a drop in bearish sentiment readings and bond market outflow readings which “have actually lined up closer to bottoms in the equity market.”

Graphic: Via EPFR, Barclays, and Bloomberg. Taken from The Market Ear.

This is as participants’ demand for protection (negative delta exposure) left dealers (on the other side and warehousing risk) adding negative delta exposure linearly (via stock and futures sales) to hedge.

To note, owning an option offers someone positive exposure to gamma or convexity (to have profits multiplied if the direction is correct, all else equal). On the other side, though, participants who are short gamma or convexity may have their losses multiplied if incorrect.

Making some naive assumptions on the build-in interest in options strikes at lower prices, we may surmise that dealers were exposed to increased negative gamma exposure. 

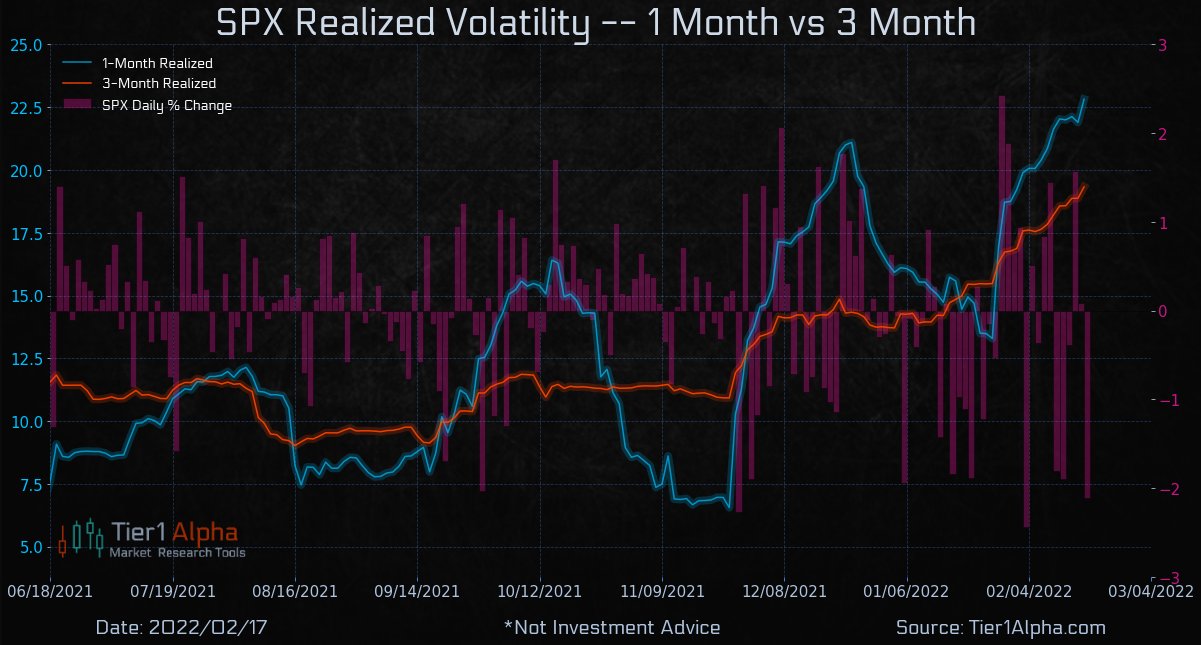
Graphic: Via Tier1Alpha. “Short Gamma Exposure -> Forces Option dealers to sell  -> Causes Higher realized volatility -> Triggering vol controlled funds to sell -> Forcing options dealers to de-risk/ and sell even more. rVol just keeps moving forcing vol control funds to sell even more.”

To hedge this, if volatility were to remain unchanged, dealers would sell (buy) into weakness (strength) to hedge increasing (decreasing) negative gamma exposure. 

If volatility rises (drops), then more stock and futures must be sold (bought/covered).

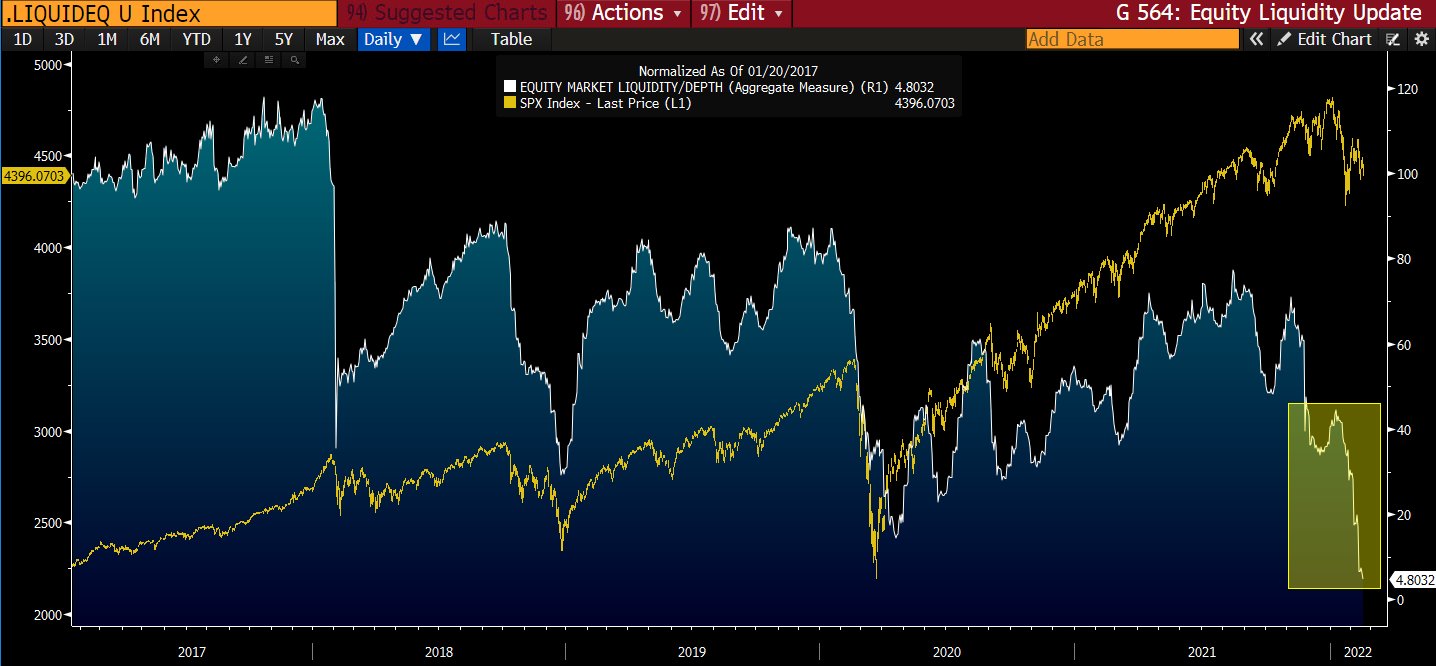
Graphic: Via Stretching Spreads. Customers indirectly taking liquidity through trading of options, in the face of a lower liquidity environment, results in more whipsaw, two-sided action. 

Moreover, Friday’s monthly options expiration (OPEX) coincided with the removal of lots of put-heavy exposures. This will decrease the dealers’ positive exposure to delta and make gamma exposures less negative.

Therefore, absent some exogenous event that increases demand for protection, again, there is the potential for strength, post-OPEX. Volatility compression would mark down dealer positive delta and therefore coincide with positive “vanna” flows that bolster attempts higher.

Technical: As of 6:30 AM ET, Monday’s regular session (9:30 AM – 4:00 PM ET), in the S&P 500, will likely open in the upper part of its overnight inventory, inside of prior-range and -value, suggesting a limited potential for immediate directional opportunity.

Gap Scenarios May Be In Play: Gaps ought to fill quickly. Should they not, that’s a signal of strength; do not fade. Leaving value behind on a gap-fill or failing to fill a gap (i.e., remaining outside of the prior session’s range) is a go-with indicator.

Auctioning and spending at least 1-hour of trade back in the prior range suggests a lack of conviction; in such a case, do not follow the direction of the most recent initiative activity.

In the best case, the S&P 500 trades higher; activity above the $4,332.75 high volume area (HVNode) puts in play the $4,415.00 untested point of control (VPOC). Initiative trade beyond the VPOC could reach as high as the $4,438.00 key response area and $4,464.00 low volume area (LVNode), or higher.

In the worst case, the S&P 500 trades lower; activity below the $4,332.75 HVNode puts in play the $4,249.00 LVNode. Initiative trade beyond the LVNode could reach as low as the $4,212.50 regular trade low (RTH Low) and $4,177.25 HVNode, or lower.

Click here to load today’s key levels into the web-based TradingView charting platform. Note that all levels are derived using the 65-minute timeframe. New links are produced, daily.
Graphic: 65-minute profile chart of the Micro E-mini S&P 500 Futures.

What People Are Saying

Definitions

Volume Areas: A structurally sound market will build on areas of high volume (HVNodes). Should the market trend for long periods of time, it will lack sound structure, identified as low volume areas (LVNodes). LVNodes denote directional conviction and ought to offer support on any test. 

If participants were to auction and find acceptance into areas of prior low volume (LVNodes), then future discovery ought to be volatile and quick as participants look to HVNodes for favorable entry or exit.

Liquidation Breaks: The profile shape suggests participants were “too” long and had poor 

Vanna: The rate at which the delta of an option changes with respect to volatility.

Charm: The rate at which the delta of an option changes with respect to time.

Options: If an option buyer was short (long) stock, he or she would buy a call (put) to hedge upside (downside) exposure. Option buyers can also use options as an efficient way to gain directional exposure.

POCs: POCs are valuable as they denote areas where two-sided trade was most prevalent in a prior day session. Participants will respond to future tests of value as they offer favorable entry and exit.

About

After years of self-education, strategy development, mentorship, and trial-and-error, Renato Leonard Capelj began trading full-time and founded Physik Invest to detail his methods, research, and performance in the markets.

Capelj is also a Benzinga finance and technology reporter interviewing the likes of Shark Tank’s Kevin O’Leary, JC2 Ventures’ John Chambers, FTX’s Sam Bankman-Fried, and ARK Invest’s Catherine Wood, as well as a SpotGamma contributor developing insights around impactful options market dynamics.

Disclaimer

Physik Invest does not carry the right to provide advice.

In no way should the materials herein be construed as advice. Derivatives carry a substantial risk of loss. All content is for informational purposes only.
Categories
Commentary

Daily Brief For February 15, 2022

Editor’s Note: The Daily Brief is a free glimpse into the prevailing fundamental and technical drivers of U.S. equity market products. Join the 200+ that read this report daily, below!

What Happened

Overnight, equity index futures auctioned sharply higher after Russia announced a pullback of some forces near Ukraine.

Ahead is data on the Producer Price Index and Empire State Manufacturing Index (8:30 AM ET).

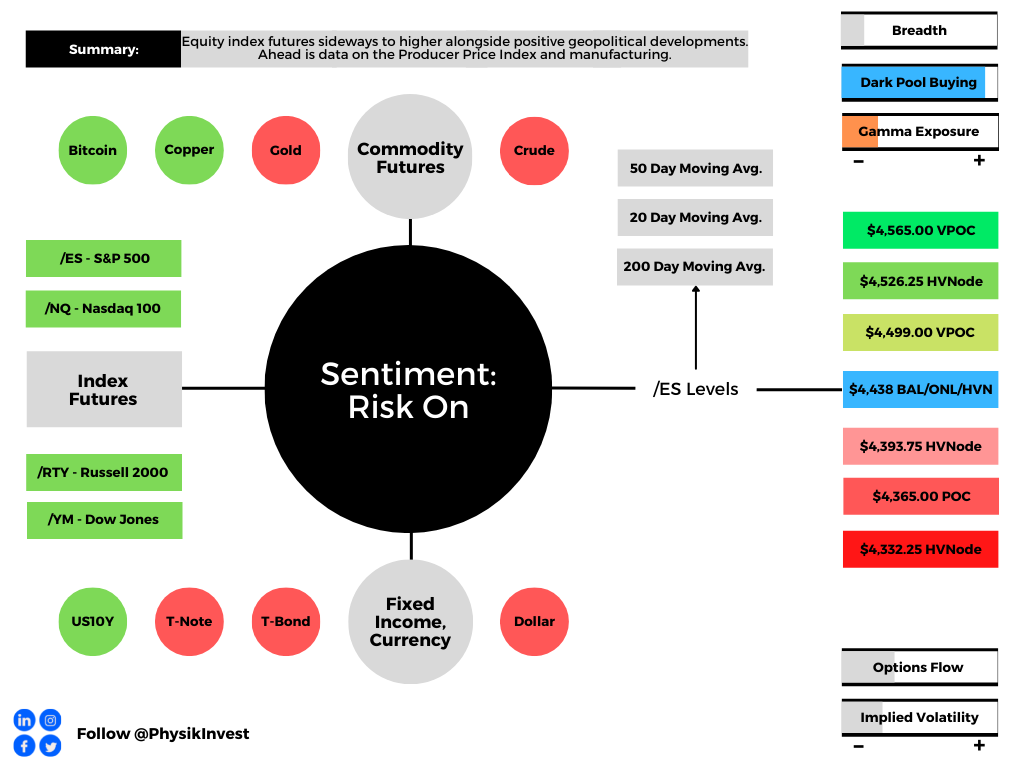
Graphic updated 6:30 AM ET. Sentiment Risk-On if expected /ES open is above the prior day’s range. /ES levels are derived from the profile graphic at the bottom of the following section. Levels may have changed since initially quoted; click here for the latest levels. SqueezeMetrics Dark Pool Index (DIX) and Gamma (GEX) calculations are based on where the prior day’s reading falls with respect to the MAX and MIN of all occurrences available. A higher DIX is bullish. At the same time, the lower the GEX, the more (expected) volatility. Learn the implications of volatility, direction, and moneyness. SHIFT data used for S&P 500 (INDEX: SPX) options activity. Note that options flow is sorted by the call premium spent; if more positive, then more was spent on call options. Breadth reflects a reading of the prior day’s NYSE Advance/Decline indicator. VIX reflects a current reading of the CBOE Volatility Index (INDEX: VIX) from 0-100.

What To Expect

Fundamental: In the face of what participants feel will be an aggressive wave of monetary tightening and geopolitical tensions, markets had sold.

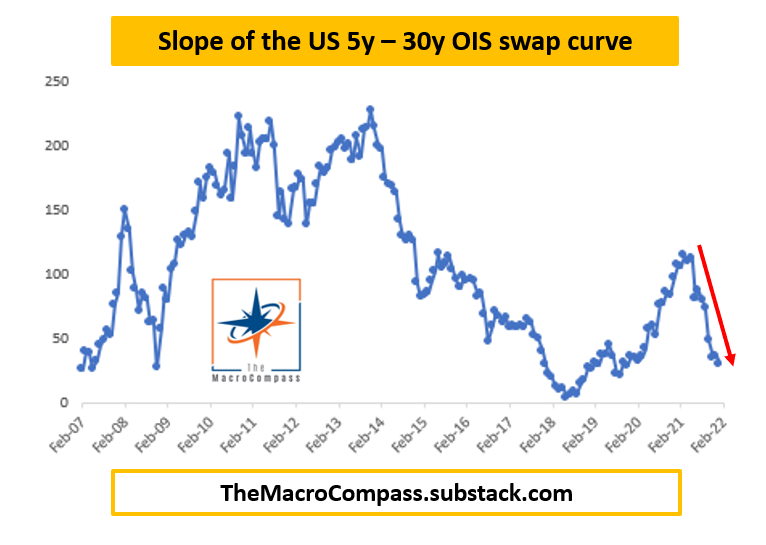
The number of interest-rate increases implied by the market for overnight index swaps, according to Bloomberg, increased to seven. Higher rates ding valuations, hurting most high-flying technology stocks and junk bonds.

Graphic: Via The Macro Compass – The 5y-30y OIS curve, which is may eventually invert, “trades at a meager 16 bps and Powell didn’t remove the hawkish Fed tail risks (e.g. 50 bps hike in March or hiking at every meeting) and validated the aggressive hiking cycle pricing amidst a clear slowdown in economic growth impulse.”

JPMorgan Chase & Co strategists led by Marko Kolanovic suggest what the market is pricing will not materialize. 

“We believe risky asset markets have mostly adjusted to monetary policy shifts by now,” the JPMorgan analysts wrote. “Short-term rates markets have likely moved too far vs. what CBs will ultimately deliver in hikes this year.”  

The team at JPMorgan concludes that though the risk of conflict in Ukraine is high, the impact on global equity markets would be limited and “likely prompt a dovish reassessment by CBs.” 

“We expect risky asset markets to rebound as they digest these risks and sentiment improves, aided by inflows from systematic investors and corporate buybacks.” 

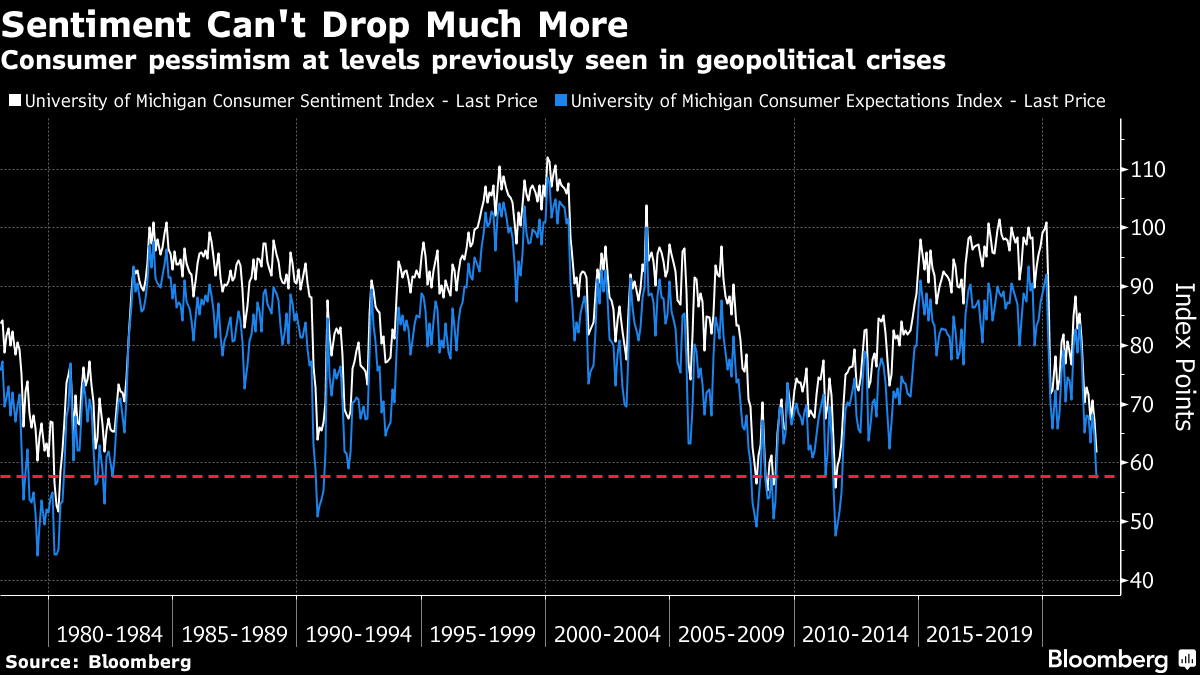
Graphic: Sentiment via Bloomberg.

Pursuant to those remarks, Goldman Sachs Group Inc (NYSE: GS) “saw the largest net buying since late December (+1.0SDs), driven by risk-on flows with long buys outpacing short sales 8 to 1.”

“All regions were net bought led by North America (driven by long buys) and to a lesser extent DM Asia (driven by short covers). 8 of 11 global sectors were net bought led in $ terms by Info Tech, Materials, Financials, and Consumer Disc. Net buying in US Info Tech continued this week.”

Positioning: As much as this newsletter sounds like a broken record, not much has changed in terms of positioning.

Lower prices and higher implied volatility (the byproduct of demand for protection) compounded macro flows, exacerbating weakness.

Graphic: SqueezeMetrics details the implications of customer activity in the options market, on the underlying’s order book.

According to options modeling and analysis provider SpotGamma, “When long a put, investors are offered the potential to make asymmetric payouts. They are long gamma and have positive exposure to convexity.”

Dealers, on the other side, have the potential to realize multiplied losses if markets trade down. 

“To protect against ‘blowout’ situations, dealers can and will buy puts against their existing exposure. At a certain point, the convexity of the dealers’ own insurance kicks in and basically reduces the amount of added hedges needed on increases in volatility or lower markets.”

Therefore, markets have reached a potential lower bound, in light of this dynamic. Participants, en masse, would have to commit more capital to strike prices much further down and out in time to indirectly add pressure.

Taking into account this options positioning, versus buying pressure (measured via short sales or liquidity provision on the market-making side), positioning metrics remain positively skewed.

Graphic: Data SqueezeMetrics. Graph via Physik Invest.

To conclude, the dip lower and demand for protection may prime the market for upside (when volatility starts to compress again and counterparties unwind hedges to put-heavy exposures). 

Technical: As of 6:30 AM ET, Tuesday’s regular session (9:30 AM – 4:00 PM ET), in the S&P 500, will likely open in the upper part of a positively skewed overnight inventory, outside of prior-range and -value, suggesting a potential for immediate directional opportunity.

Gap Scenarios: Gaps ought to fill quickly. Should they not, that’s a signal of strength; do not fade. Leaving value behind on a gap-fill or failing to fill a gap (i.e., remaining outside of the prior session’s range) is a go-with indicator.

Auctioning and spending at least 1-hour of trade back in the prior range suggests a lack of conviction; in such a case, do not follow the direction of the most recent initiative activity.

In the best case, the S&P 500 trades higher; activity above the $4,438.00 puts in play the $4,499.00 untested point of control (VPOC). Initiative trade beyond the VPOC could reach as high as the $4,526.25 high volume area (HVNode) and $4,565.00 VPOC, or higher.

In the worst case, the S&P 500 trades lower; activity below the $4,438.00 puts in play the $4,393.75 HVNode. Initiative trade beyond the HVNode could reach as low as the $4,365.00 POC and $4,332.25 HVNode, or lower.

Click here to load today’s key levels into the web-based TradingView charting platform. Note that all levels are derived using the 65-minute timeframe. New links are produced, daily.
Graphic: 65-minute profile chart of the Micro E-mini S&P 500 Futures.

What People Are Saying

Definitions

Overnight Rally Highs (Lows): Typically, there is a low historical probability associated with overnight rally-highs (lows) ending the upside (downside) discovery process.

Volume Areas: A structurally sound market will build on areas of high volume (HVNodes). Should the market trend for long periods of time, it will lack sound structure, identified as low volume areas (LVNodes). LVNodes denote directional conviction and ought to offer support on any test. 

If participants were to auction and find acceptance into areas of prior low volume (LVNodes), then future discovery ought to be volatile and quick as participants look to HVNodes for favorable entry or exit.

POCs: POCs are valuable as they denote areas where two-sided trade was most prevalent in a prior day session. Participants will respond to future tests of value as they offer favorable entry and exit.

About

After years of self-education, strategy development, mentorship, and trial-and-error, Renato Leonard Capelj began trading full-time and founded Physik Invest to detail his methods, research, and performance in the markets.

Capelj is also a Benzinga finance and technology reporter interviewing the likes of Shark Tank’s Kevin O’Leary, JC2 Ventures’ John Chambers, FTX’s Sam Bankman-Fried, and ARK Invest’s Catherine Wood, as well as a SpotGamma contributor developing insights around impactful options market dynamics.

Disclaimer

Physik Invest does not carry the right to provide advice.

In no way should the materials herein be construed as advice. Derivatives carry a substantial risk of loss. All content is for informational purposes only.
Categories
Commentary

Daily Brief For February 14, 2022

Editor’s Note: The Daily Brief is a free glimpse into the prevailing fundamental and technical drivers of U.S. equity market products. Join the 200+ that read this report daily, below!

What Happened

Overnight, equity index futures auctioned sideways to lower, extending the sell-off that began with the release of Consumer Price Index (CPI) data.

The Federal Reserve will convene, today, at 11:30 AM ET for an unscheduled meeting of the Board of Governors to discuss “the advance and discount rates to be charged by the Federal Reserve banks.”

Scheduled is an interview with St. Louis Fed President James Bullard (8:30 AM ET).

Graphic updated 6:50 AM ET. Sentiment Risk-Off if expected /ES open is below the prior day’s range. /ES levels are derived from the profile graphic at the bottom of the following section. Levels may have changed since initially quoted; click here for the latest levels. SqueezeMetrics Dark Pool Index (DIX) and Gamma (GEX) calculations are based on where the prior day’s reading falls with respect to the MAX and MIN of all occurrences available. A higher DIX is bullish. At the same time, the lower the GEX, the more (expected) volatility. Learn the implications of volatility, direction, and moneyness. SHIFT data used for S&P 500 (INDEX: SPX) options activity. Note that options flow is sorted by the call premium spent; if more positive, then more was spent on call options. Breadth reflects a reading of the prior day’s NYSE Advance/Decline indicator. VIX reflects a current reading of the CBOE Volatility Index (INDEX: VIX) from 0-100.

What To Expect

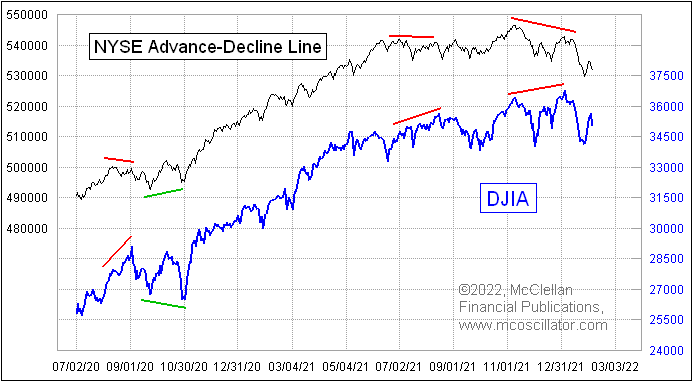
Fundamental: Markets are catching up to divergences in breadth, trading down in the face of narratives around the Federal Reserve’s (Fed) response to heightened inflation, a challenging economic growth outlook, and geopolitical tensions.

Graphic: NYSE A-D Line versus the Dow Jones Industrial Average. Taken from Tom McClellan.

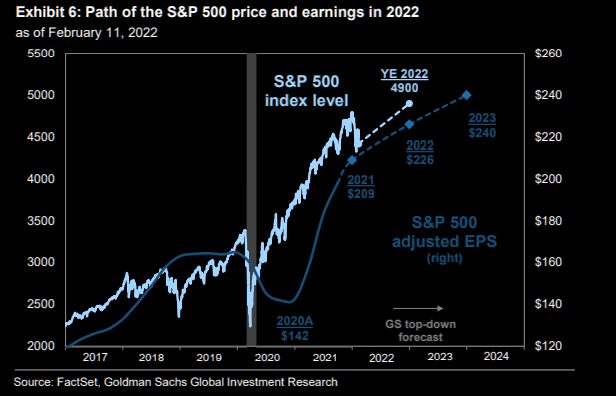
Pursuant to these narratives, Goldman Sachs Group Inc (NYSE: GS) lowered its targets for the S&P 500 from $5,100.00 to $4,900.00. 

“The macro backdrop this year is considerably more challenging than in 2021. However, we continue to expect that equity prices will rise alongside earnings and reach a new all-time high in 2022,” strategists said on earnings growth in light of the impact of higher rates on valuations.

“During the last 50 years, a ‘goldilocks’ environment of accelerating GDP  growth and stable real yields has typically been associated with a 12-month S&P 500 return of +16%. However, when growth is decelerating and real yields are rising, 12-month S&P 500 returns have averaged +8%.”

Graphic: Via Goldman Sachs Group Inc (NYSE: GS). Taken from The Market Ear

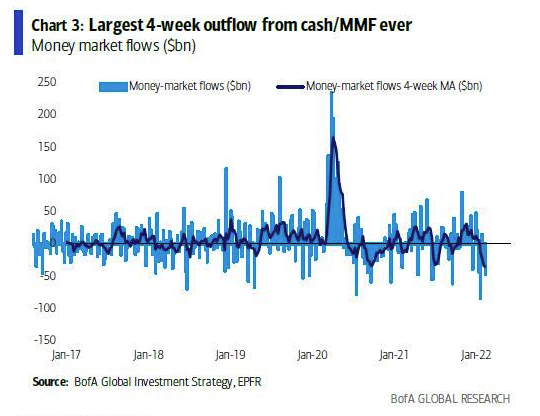
At the same time, participants are withdrawing their cash and assets held in money market funds in size.

Graphic: Via Bank of America Corporation (NYSE: BAC).

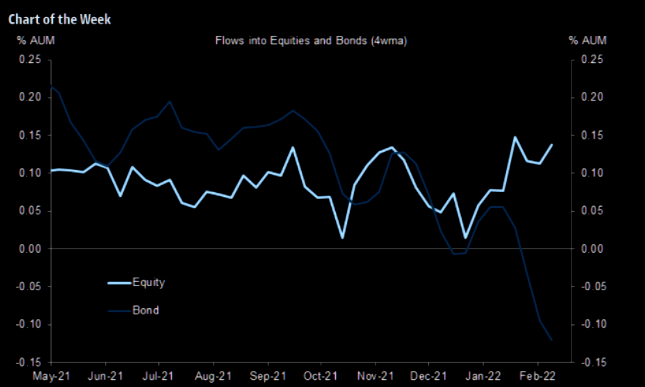
Based on flows into equities, participants appear to be opportunistically buying the dip.

Graphic: Via EPFR. Retrieved from The Market Ear.

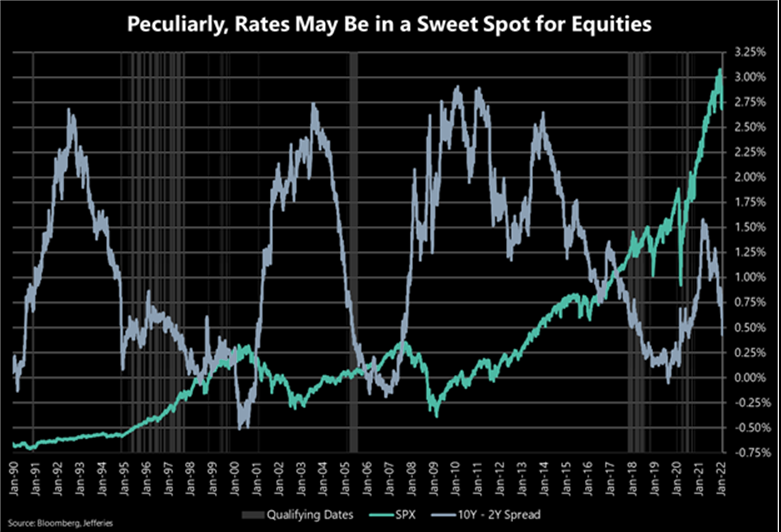
Looking back, when the yield curve – e.g., spread between 10- and 2-year – is between 75 and 25 basis points, stocks actually perform well. 

According to The Market Ear, “[S]imilar periods of time have typically coincided with the middle of prior cycles when economic expansion was broad-based. Worth highlighting the mid-90s, mid-00s, and late-10s.”

“Both short and long-term SPX performance following similar instances were well above typical return profiles. Average 6M performance is over 9% and average 12M performance is over 17%. Almost more notably, SPX performance was positive 90%+ of the time.”

Graphic: Via Jefferies Financial Group Inc (NYSE: JEF). Retrieved from The Market Ear.

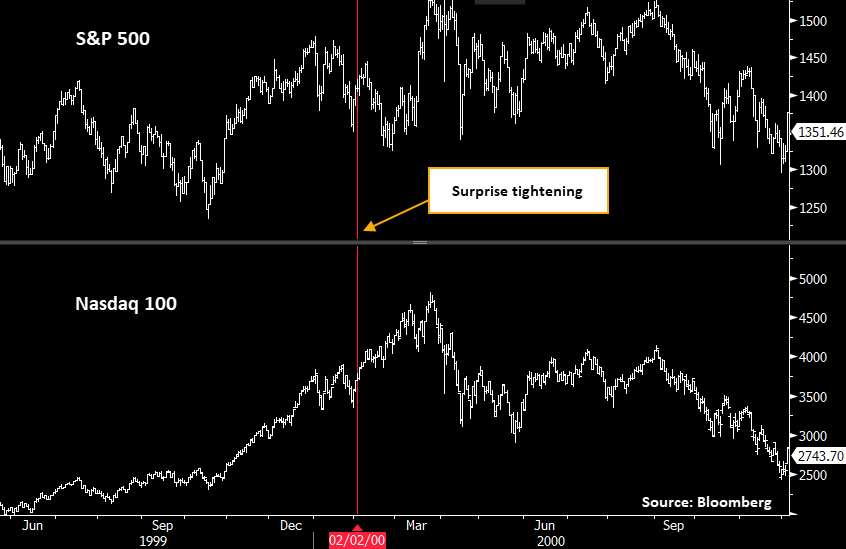
To end this section, we point to the so-called unscheduled Fed meeting, today, and the potential for surprise rate increases, despite some policymakers, like Kansas City Fed President Esther George, attempting to cool expectations.

The historical reaction, months out, is not what participants expect would happen by default.

Graphic: Via SentimenTrader.

Positioning: As stated, Friday, Thursday’s post-CPI trade disrupted the balance of trade.

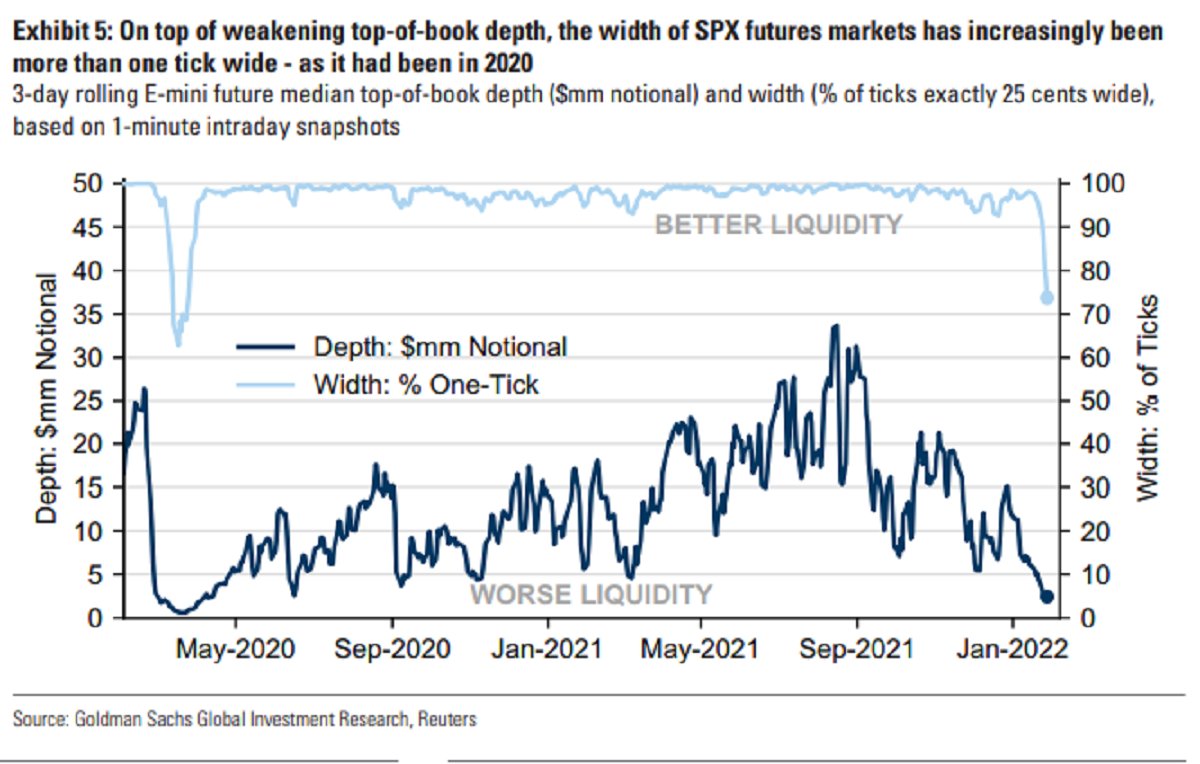
Lower prices and demand for protection, in the face of lower levels of “on-screen liquidity,” solicited dealer selling to hedge increased exposure to the positive delta from demanded short-dated, highly convex options.

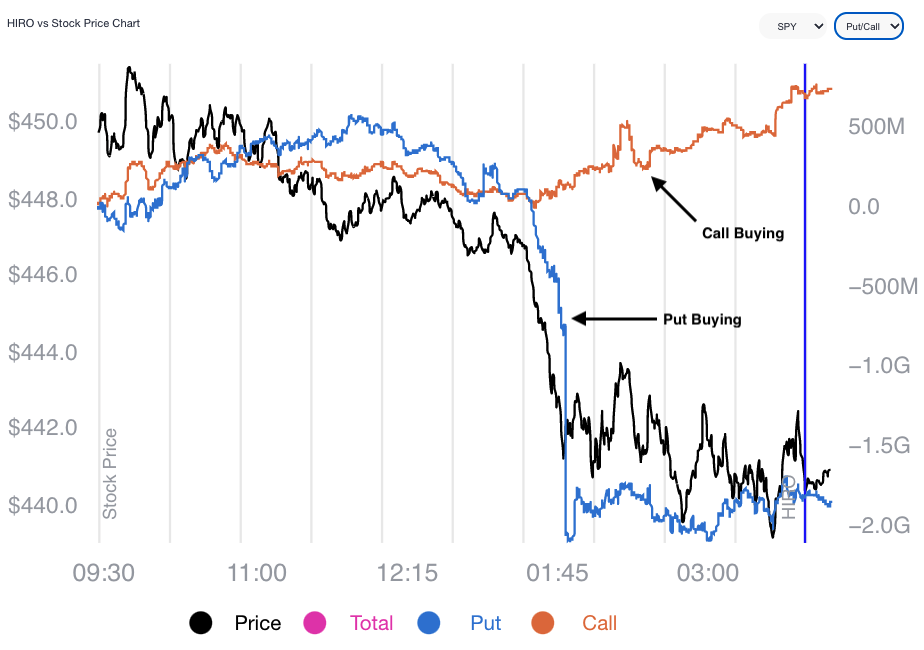
Graphic: SpotGamma’s Hedging Impact of Real-Time Options (HIRO) indicator; “customers bought put options (a negative delta trade) leaving dealers short (a positive delta trade).” 

Lower prices and higher volatility compound macro flows, exacerbating weakness.

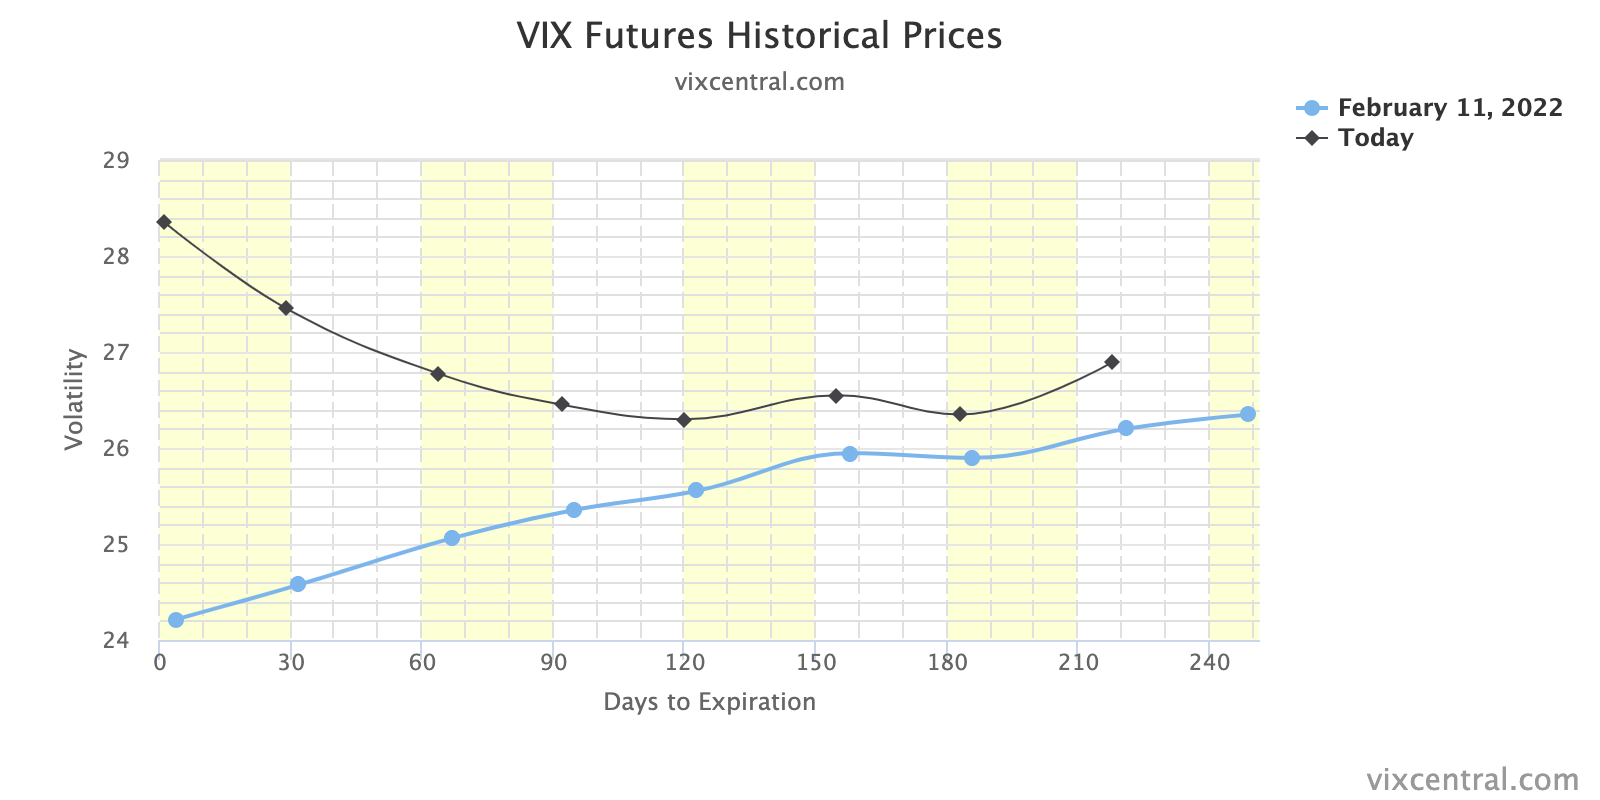
To note, much of the demand for protection is concentrated in shorter-dated options that are more sensitive to changes in implied volatility and direction. The demand is well visualized by the VIX term structure which shifted markedly at the front-end, Friday.

Graphic: VIX term structure shifts higher (dramatically at the front-end).

Going forward, there is a large monthly options expiration (OPEX) this week. OPEX is a sort-of reset; options roll-off, as do the counterparties’ hedges.

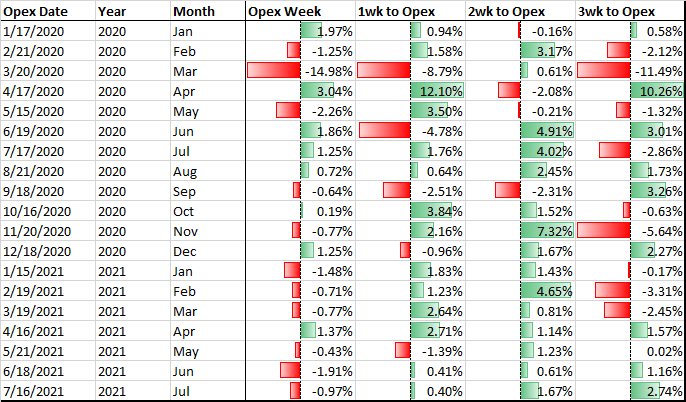
According to data compiled and analyzed by Pat Hennessy a while back, “OPEX week returns peaked in 2016 and have trended lower since.”

Graphic: @pat_hennessy breaks down returns for the S&P 500, categorized by the week relative to OPEX. 

Post-OPEX, though, according to SpotGamma, “In an environment characterized by negative gamma (wherein an options delta falls with stock price rises and rises when stock prices fall), options expiries ought to make gamma less negative.”

“Therefore, a reset that may make gamma exposures less negative, there will be a removal of [counterparties’] linear short (-delta) hedges which may further bolster attempts higher.”

So, the dip lower and demand for protection could serve to prime the market for upside (when volatility starts to compress again and counterparties unwind hedges to put-heavy exposures). 

Commitment to higher prices would likely coincide with increased interest in options at higher strike prices. We have yet to see this occur.

Technical: As of 6:30 AM ET, Monday’s regular session (9:30 AM – 4:00 PM ET), in the S&P 500, will likely open in the lower part of a negatively skewed overnight inventory, outside of prior-range and -value, suggesting a potential for immediate directional opportunity.

Balance-Break + Gap Scenarios: A change in the market (i.e., the transition from two-time frame trade, or balance, to one-time frame trade, or trend) occurred.

Acceptance (i.e., more than 1-hour of trade) outside of the balance area has been established.

Leaving value behind on a gap-fill or failing to fill a gap (i.e., remaining outside of the prior session’s range) is a go-with indicator (i.e., nothing has changed since Friday).

Rejection (i.e., return inside of balance) portends a move to the opposite end of the balance.

In the best case, the S&P 500 trades higher; activity above the $4,365.00 point of control (POC) puts in play the $4,393.75 high volume area (HVNode). Initiative trade beyond the HVNode could reach as high as the $4,438.00 key response area and $4,499.00 POC, or higher.

In the worst case, the S&P 500 trades lower; activity below the $4,365.00 POC puts in play the $4,332.25 HVNode. Initiative trade beyond the HVNode could reach as low as the $4,266.25 Weak Low and $4,212.50 regular trade low (RTH Low), or lower.

Click here to load today’s key levels into the web-based TradingView charting platform. Note that all levels are derived using the 65-minute timeframe. New links are produced, daily.
Graphic: 65-minute profile chart of the Micro E-mini S&P 500 Futures.

What People Are Saying

Definitions

Overnight Rally Highs (Lows): Typically, there is a low historical probability associated with overnight rally-highs (lows) ending the upside (downside) discovery process.

Volume Areas: A structurally sound market will build on areas of high volume (HVNodes). Should the market trend for long periods of time, it will lack sound structure, identified as low volume areas (LVNodes). LVNodes denote directional conviction and ought to offer support on any test. 

If participants were to auction and find acceptance into areas of prior low volume (LVNodes), then future discovery ought to be volatile and quick as participants look to HVNodes for favorable entry or exit.

Gamma: Gamma is the sensitivity of an option to changes in the underlying price. Dealers that take the other side of options trades hedge their exposure to risk by buying and selling the underlying. When dealers are short-gamma, they hedge by buying into strength and selling into weakness. When dealers are long-gamma, they hedge by selling into strength and buying into weakness. The former exacerbates volatility. The latter calms volatility.

Vanna: The rate at which the delta of an option changes with respect to volatility.

Charm: The rate at which the delta of an option changes with respect to time.

POCs: POCs are valuable as they denote areas where two-sided trade was most prevalent in a prior day session. Participants will respond to future tests of value as they offer favorable entry and exit.

Options Expiration (OPEX): Traditionally, option expiries mark an end to pinning (i.e, the theory that market makers and institutions short options move stocks to the point where the greatest dollar value of contracts will expire) and the reduction dealer gamma exposure.

Volume-Weighted Average Prices (VWAPs): A metric highly regarded by chief investment officers, among other participants, for quality of trade. Additionally, liquidity algorithms are benchmarked and programmed to buy and sell around VWAPs.

About

After years of self-education, strategy development, mentorship, and trial-and-error, Renato Leonard Capelj began trading full-time and founded Physik Invest to detail his methods, research, and performance in the markets.

Capelj is also a Benzinga finance and technology reporter interviewing the likes of Shark Tank’s Kevin O’Leary, JC2 Ventures’ John Chambers, FTX’s Sam Bankman-Fried, and ARK Invest’s Catherine Wood, as well as a SpotGamma contributor developing insights around impactful options market dynamics.

Disclaimer

Physik Invest does not carry the right to provide advice.

In no way should the materials herein be construed as advice. Derivatives carry a substantial risk of loss. All content is for informational purposes only.
Categories
Commentary

Daily Brief For February 9, 2022

Editor’s Note: The Daily Brief is a free glimpse into the prevailing fundamental and technical drivers of U.S. equity market products. Join the 200+ that read this report daily, below!

What Happened

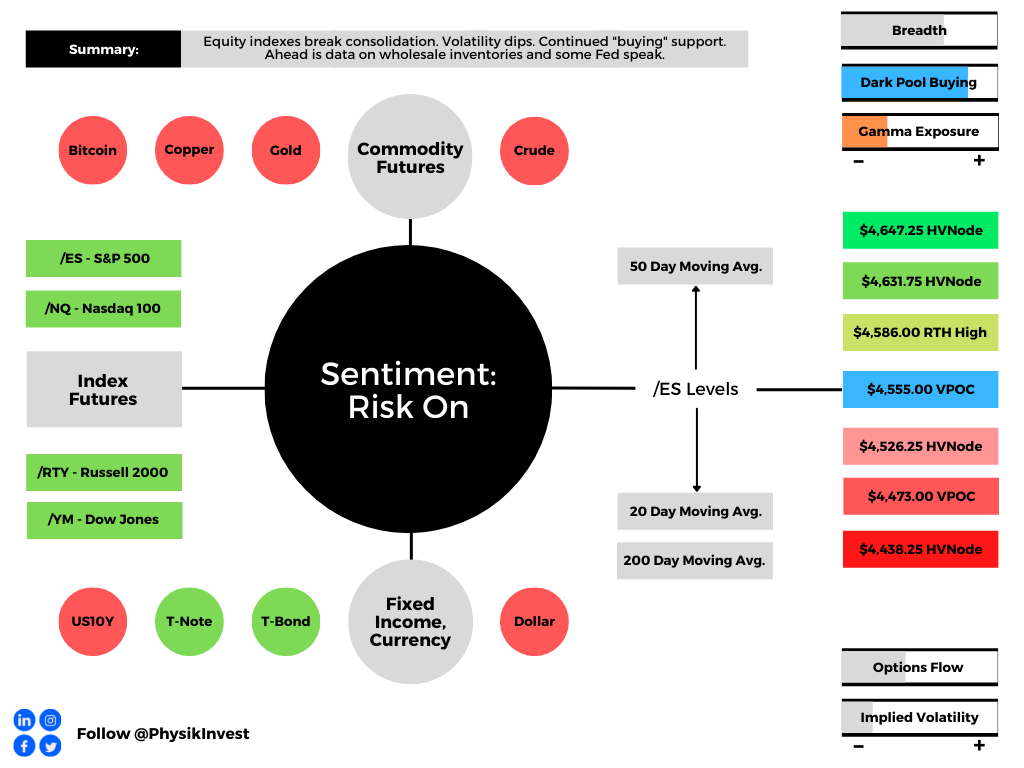
Overnight, equity index futures broke the confines of tight consolidation. 

As stated some commentaries ago, the odds pointed to a continued counter-trend rally; volatility compression, coupled with metrics that point to buying support, was to bolster follow-through.

Ahead is data on Wholesale Inventories (10:00 AM ET), as well as Fed-speak by Governor Michelle Bowman (10:30 AM ET) and President Loretta Mester (12:00 PM ET).

Graphic updated 6:30 AM ET. Sentiment Risk-On if expected /ES open is above the prior day’s range. /ES levels are derived from the profile graphic at the bottom of the following section. Levels may have changed since initially quoted; click here for the latest levels. SqueezeMetrics Dark Pool Index (DIX) and Gamma (GEX) calculations are based on where the prior day’s reading falls with respect to the MAX and MIN of all occurrences available. A higher DIX is bullish. At the same time, the lower the GEX, the more (expected) volatility. Learn the implications of volatility, direction, and moneyness. SHIFT data used for S&P 500 (INDEX: SPX) options activity. Note that options flow is sorted by the call premium spent; if more positive, then more was spent on call options. Breadth reflects a reading of the prior day’s NYSE Advance/Decline indicator. VIX reflects a current reading of the CBOE Volatility Index (INDEX: VIX) from 0-100.

What To Expect

Fundamental: Equity indices resolve higher in the face of hawkishness from the Federal Reserve (Fed) and data showing slowing growth at home and abroad.

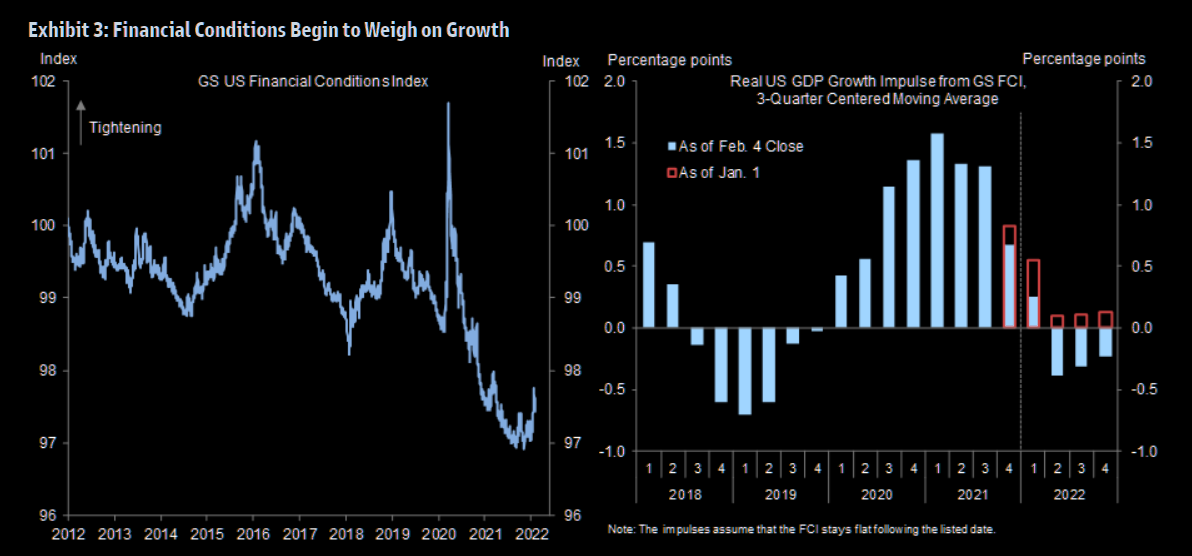
“Fiscal policy is turning more restrictive, the Q4 inventory boost is now behind us, and the financial conditions impulse will go from sharply positive in 2021 to (at least) modestly negative in 2022,” Goldman Sachs Group Inc (NYSE: GS) strategists explain. 

“For these reasons, our 2022 GDP forecast of 2¼% on a Q4/Q4 basis is 0.8pp below the latest Bloomberg consensus and 1.8pp below the FOMC’s last published forecast (as of the December meeting).”

Graphic: Via Goldman Sachs. Retrieved through The Market Ear.

At the same time, according to Moody’s Corporation (NYSE: MCO), the Fed has not pushed “against market expectations for three to four rate hikes this year.” 

Instead, Chair Jerome Powell “signaled the central bank will have zero tolerance for any upside surprises in inflation.”

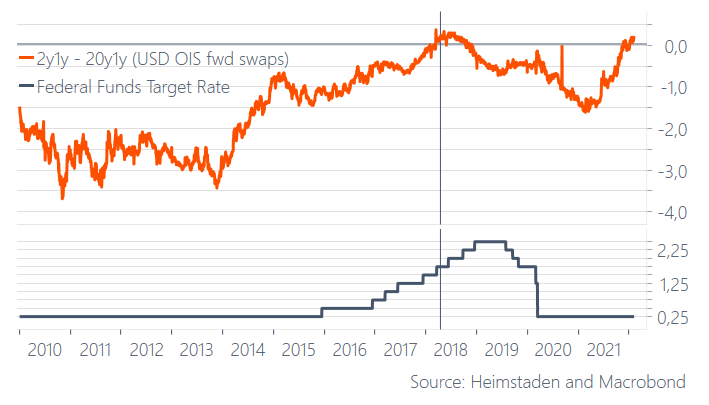
To note, though, the consensus expectation – five rate hikes or more – is ahead of itself, according to Andreas Steno Larsen of Heimstaden. 

“Direct transfers and fiscal deficits are behind the current inflation spikes,” he explains. “If they were the root causes of inflation, they will also turn into the root causes of disinflation again during H2-2022.”

Steno Larsen adds that the 20y1y and 2y1y curve is inverted, “as it was when the 2015-2018 hiking cycle was very mature,” and only three hikes occurred after inversion.

Graphic: “Good luck hiking 6-7 times this year, … 3-4 max,” via Steno Larsen

The net effect, according to Steno Larsen, is that long bond yields will likely not rise over the next quarters; rate-sensitive technology and innovation products may rebound while cyclical assets may suffer.

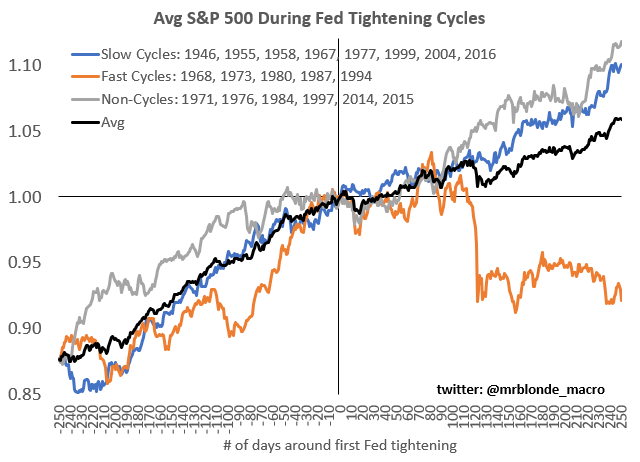
In line with the above comments is the average S&P 500 trend into Fed tightening cycles. 

Graphic: Retrieved from Callum Thomas’ Weekly S&P 500 ChartStorm newsletter.

Positioning: Ranges compressed as participants committed capital to bets on lower volatility.

Such bets (expressed via the selling of protection on both sides of the market) left counterparties warehousing the other side (long puts and calls). 

In hedging this exposure on a move higher, the counterparties increased +delta exposure is offset via the addition in -delta (sell futures)

In hedging this exposure on a move lower, the counterparties increased -delta exposure is offset via the addition of +delta (buy futures).

Moreover, as (1) participants continue to bet on lower ranges and (2) time and volatility trend to zero for the expiries most open interest is concentrated in, gamma, the sensitivity of options to changes in underlying price (delta) increases. 

What that means is that counterparties’ near-the-money exposure to options delta rises and portends increased liquidity (e.g., the counterparty will buy futures into weakness and sell futures into strength).

Given a lower liquidity environment, these hedging flows therefore have a bigger impact.

Graphic: Via SpotGamma, “gamma flows increasingly important in a lower liquidity environment. If the counterparty is taking on more exposure to positive gamma, then their addition of liquidity to hedge may suppress ranges.”

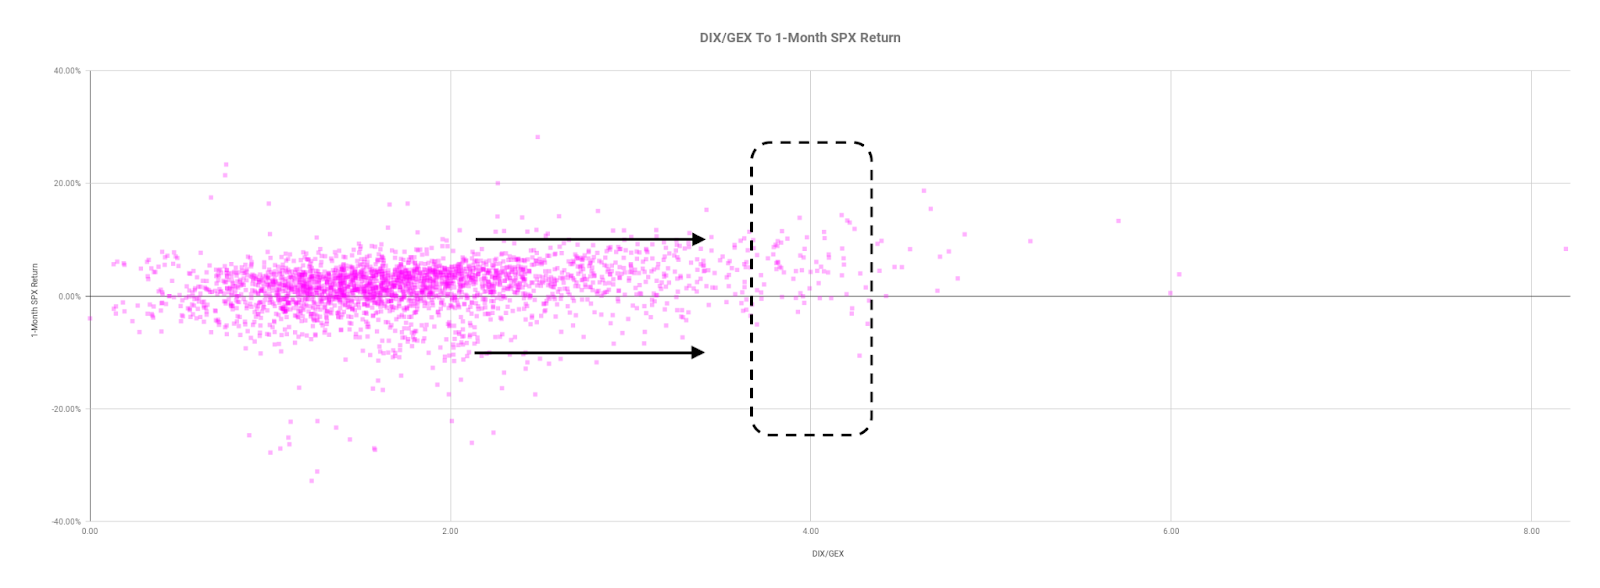
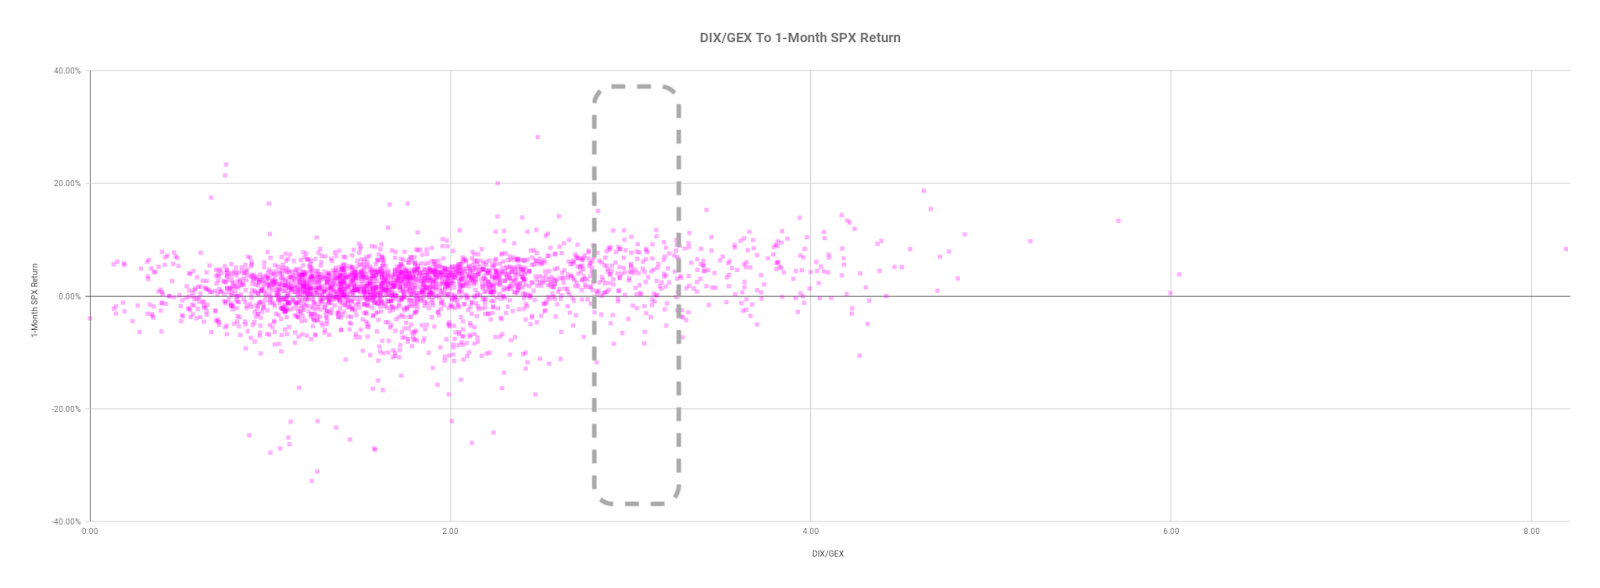
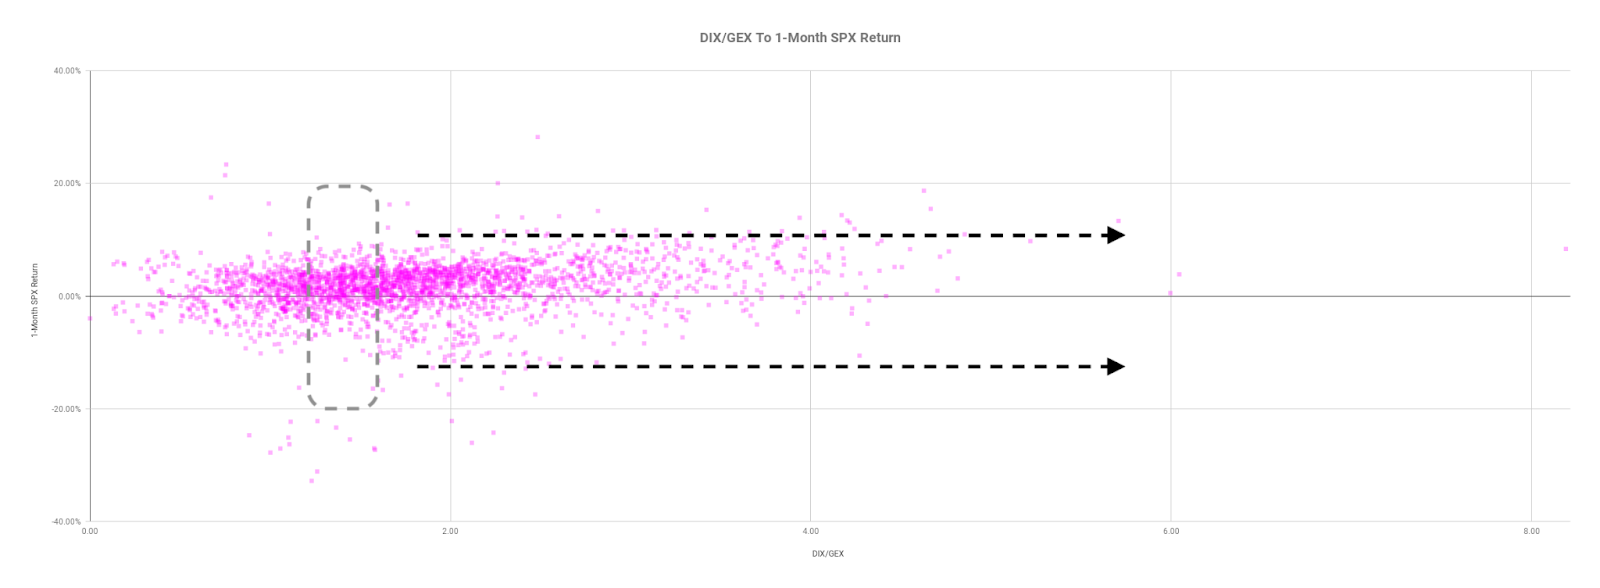
The resolve of this consolidation, coupled with decaying out-of-the-money protection and supportive hedging flows with respect to time (charm) and volatility (vanna), and buying proxies, point to “[m]odest bullishness on the 1-month timeframe.”

Graphic: Data via SqueezeMetrics. Graph via Physik Invest.

Technical: As of 6:30 AM ET, Wednesday’s regular session (9:30 AM – 4:00 PM ET), in the S&P 500, will likely open in the upper part of a positively skewed overnight inventory, outside of prior-range and -value, suggesting a potential for immediate directional opportunity.

Balance-Break + Gap Scenarios: A change in the market (i.e., the transition from two-time frame trade, or balance, to one-time frame trade, or trend) is occurring.

Monitor for acceptance (i.e., more than 1-hour of trade) outside of the balance area. 

Leaving value behind on a gap-fill or failing to fill a gap (i.e., remaining outside of the prior session’s range) is a go-with indicator. 

Rejection (i.e., return inside of balance) portends a move to the opposite end of the balance.

In the best case, the S&P 500 trades higher; activity above the $4,555.00 untested point of control (VPOC) puts in play the $4,586.00 regular trade high (RTH High). Initiative trade beyond the RTH High could reach as high as the $4,631.75 and $4,647.25 HVNode, or higher.

In the worst case, the S&P 500 trades lower; activity below the $4,555.00 VPOC puts in play the $4,526.25 HVNode. Initiative trade beyond the $4,526.25 HVNode could reach as low as the $4,473.00 VPOC and $4,438.25 HVNode, or lower.

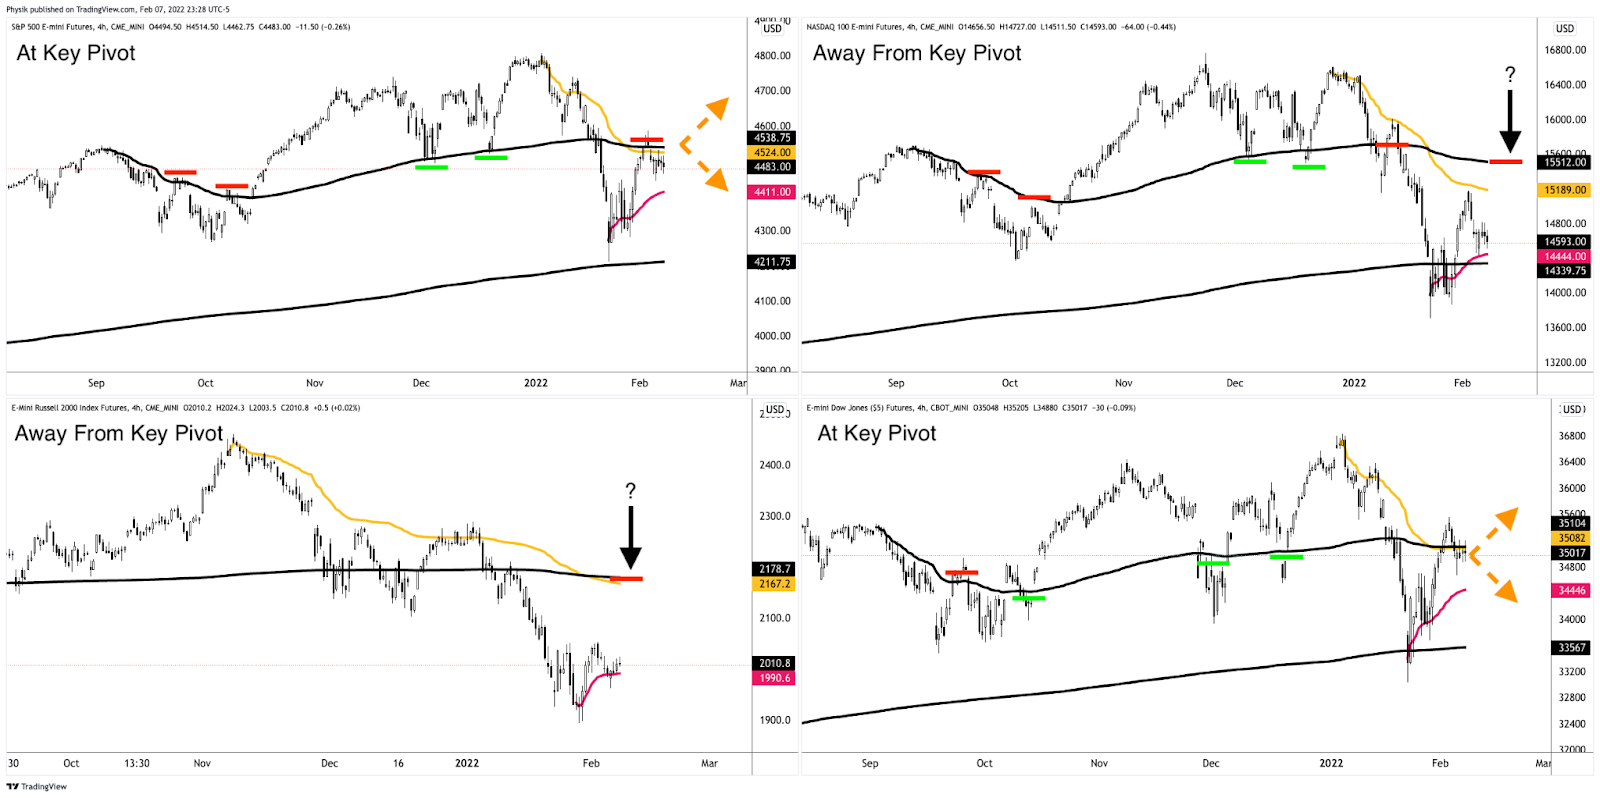
Consideration: All equity index products have resolved tight consolidation’s higher. The Nasdaq 100 and Russell 2000 are the furthest away from clear areas of resistance. 

On the other hand, the S&P 500 and Dow Jones Industrial Average have little in the way of higher prices.

Graphic: Updated 2/8/2022. Anchored Volume Weighted Average Price (VWAP) analysis via Physik Invest. Notice Dow Jones Industrial Average (bottom right) and S&P 500 (top left) strength, as well as Nasdaq 100 (top right) and Russell 2000 (bottom left) weakness. Key pivots marked off.
Click here to load today’s key levels into the web-based TradingView charting platform. Note that all levels are derived using the 65-minute timeframe. New links are produced, daily.
Graphic: 65-minute profile chart of the Micro E-mini S&P 500 Futures.

What People Are Saying

Definitions

Volume Areas: A structurally sound market will build on areas of high volume (HVNodes). Should the market trend for long periods of time, it will lack sound structure, identified as low volume areas (LVNodes). LVNodes denote directional conviction and ought to offer support on any test. 

If participants were to auction and find acceptance into areas of prior low volume (LVNodes), then future discovery ought to be volatile and quick as participants look to HVNodes for favorable entry or exit.

POCs: POCs are valuable as they denote areas where two-sided trade was most prevalent in a prior day session. Participants will respond to future tests of value as they offer favorable entry and exit.

About

After years of self-education, strategy development, mentorship, and trial-and-error, Renato Leonard Capelj began trading full-time and founded Physik Invest to detail his methods, research, and performance in the markets.

Capelj is also a Benzinga finance and technology reporter interviewing the likes of Shark Tank’s Kevin O’Leary, JC2 Ventures’ John Chambers, FTX’s Sam Bankman-Fried, and ARK Invest’s Catherine Wood, as well as a SpotGamma contributor developing insights around impactful options market dynamics.

Disclaimer

Physik Invest does not carry the right to provide advice.

In no way should the materials herein be construed as advice. Derivatives carry a substantial risk of loss. All content is for informational purposes only.
Categories
Commentary

Daily Brief For January 28, 2022

Editor’s Note: Thanks for subscribing to The Daily Brief, a free glimpse into the prevailing fundamental and technical drivers of U.S. equity market products. 

In the coming week, commentaries are set to pause as I go on vacation. Look forward to providing valuable market color when I return, on February 7, 2022

Talk to you soon!

What Happened

Despite certain index heavy-weights trading higher in light of earnings announcements, equity index futures remain weak, trading sideways to lower overnight with bonds. 

Measures of implied volatility (IV) remain bid while certain metrics continue to show buying support. Given the way counterparties to customer options trades hedge, a compression in volatility may bolster a move higher.

Though the odds point to a counter-trend rally, continued selling is not out of the question. A break of multi-session support levels, combined with rising IV, would pressure indices further.

Ahead is data on PCE Inflation, incomes, spending, and the Employment Cost Index (8:30 AM ET). After is University of Michigan data on sentiment and inflation expectations (10:00 AM ET).

Graphic updated 6:55 AM ET. Sentiment Risk-Off if expected /ES open is below the prior day’s range. /ES levels are derived from the profile graphic at the bottom of the following section. Levels may have changed since initially quoted; click here for the latest levels. SqueezeMetrics Dark Pool Index (DIX) and Gamma (GEX) calculations are based on where the prior day’s reading falls with respect to the MAX and MIN of all occurrences available. A higher DIX is bullish. At the same time, the lower the GEX, the more (expected) volatility. Learn the implications of volatility, direction, and moneyness. SHIFT data used for S&P 500 (INDEX: SPX) options activity. Note that options flow is sorted by the call premium spent; if more positive, then more was spent on call options. Breadth reflects a reading of the prior day’s NYSE Advance/Decline indicator. VIX reflects a current reading of the CBOE Volatility Index (INDEX: VIX) from 0-100.

What To Expect

Fundamental: Equity indices are struggling to catch a bid amidst a more hawkish Fed, persistent geopolitical tensions, and data showing slowing growth at home and abroad.

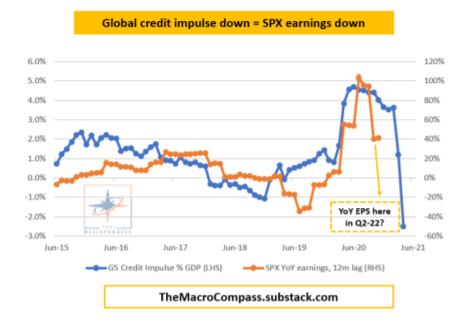
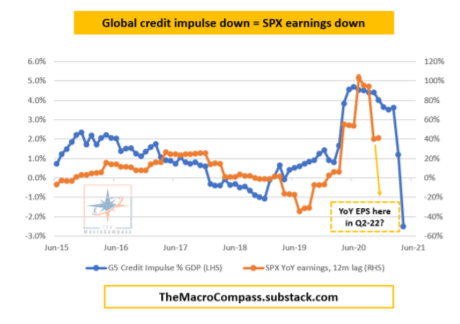
Graphic: @MacroAlf plots credit impulse as a percent of GDP and SPX year-over-year earnings.

This is in the face of heavyweights, like Apple Inc (NASDAQ: AAPL) which posted its highest-ever quarterly earnings after sales climbed 11% to a record $124 billion, trading higher.

Coming back to comments from yesterday, the Federal Open Market Committee (FOMC) revealed asset purchases would stop in March. Then, in the face of an economy that’s much stronger than at the start of the last hiking cycle, the window for higher rates would be opened. 

What spooked markets was Fed Chair Jerome Powell “saying that the Fed has plenty of room to raise interest rates without harming the labor market,” according to an analysis by Moody’s Corporation (NYSE: MCO).

“Powell didn’t push back against market expectations for three to four rate hikes this year, but he signaled the central bank will have zero tolerance for any upside surprises in inflation.”

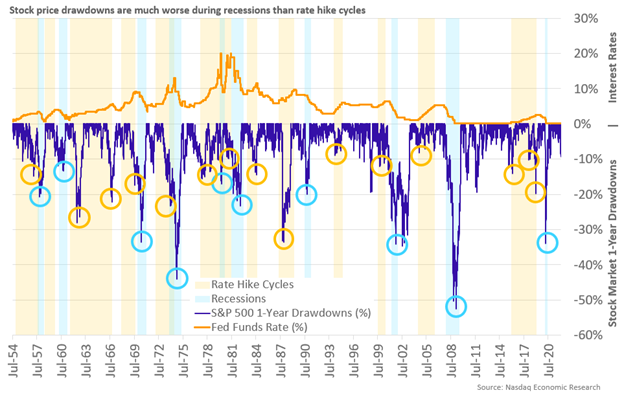
According to a write-up by Nasdaq Inc’s (NASDAQ: NDAQ) Phil Mackintosh, “some economists are already worrying whether the Fed can engineer a ‘soft landing’ for the economy, which is where rate hikes slow the economy and inflation but don’t cause a recession.”

Based on the data, though, “selloffs in rate hike cycles, especially since 1975, are mostly much smaller corrections,” Mackintosh adds.

“So, it seems we should worry much more about a recession than hikes.”

Graphic: Per Nasdaq, “[S]tock market corrections are much more dependent on the business cycle than the rates cycle. That makes sense—during rate-hike cycles, companies have strong demand and revenue growth recessions. Whereas, during recessions, unemployment and spending usually contract.”

Complicating the Fed’s job, per Nasdaq, are outside influences such as waning fiscal stimulus and further supply shocks (the good and bad ones). 

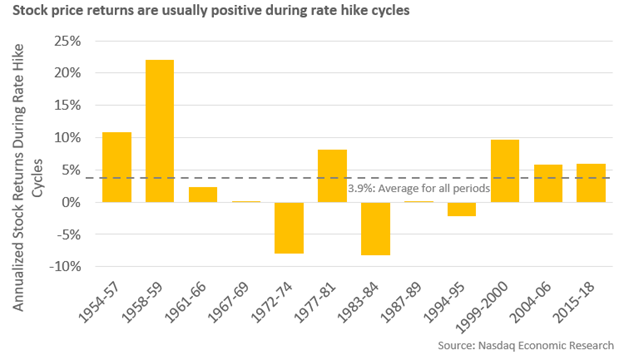
However, “annualized returns for the S&P 500 during rate hike cycles are mostly positive, … [as] rising rates usually equals a strong economy, which is usually good for companies, leading to earnings growth.”

“That earnings growth more than offsets the valuation impact of higher rates.”

Graphic: Per Nasdaq, annualized S&P 500 returns during rate-hike cycles.

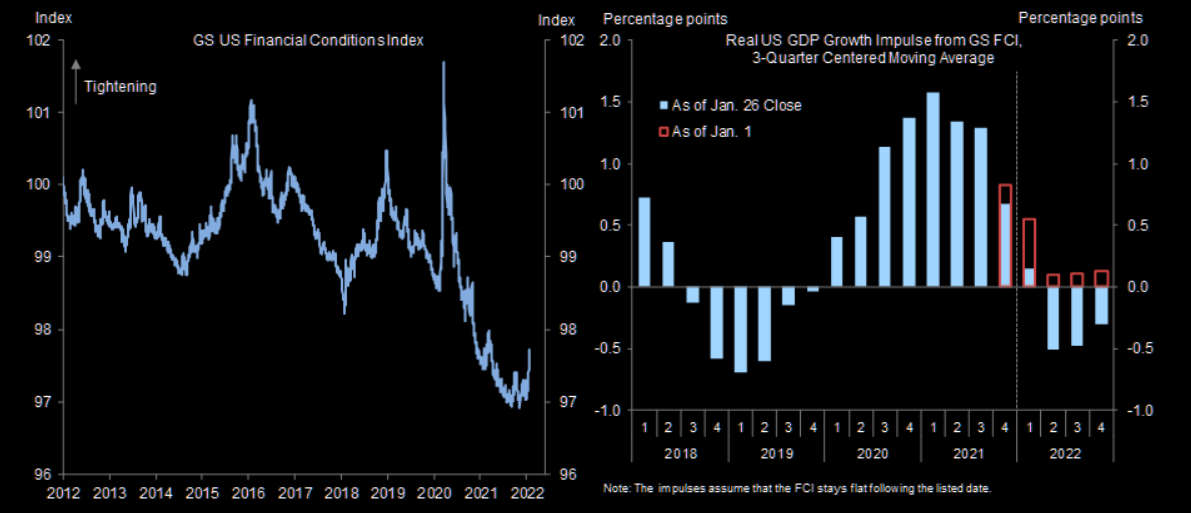
To assuage some fears, Goldman Sachs Group Inc (NYSE: GS) thinks that the “interplay of Fed policy, financial conditions, and the growth outlook could make it hard for the Fed to actually deliver consecutive hikes, even if they feel like a natural forecast along the way.”

Graphic: Goldman Sachs sees a (small) tightening in financial conditions. Graphic retrieved from The Market Ear. According to Bloomberg, “there is quite a long way to go before the Fed would feel any great need to come to their rescue.”

Positioning: A short-gamma environment (wherein an options delta falls with stock price rises and rises when stock prices fall) portends increased two-way volatility.

This is as the counterparties to customer options trades hedge in a manner that exacerbates movement (i.e., buying strength and selling weakness).

Graphic: SqueezeMetrics details the implications of customer activity in the options market, on the underlying’s order book. For instance, in selling a put, customers add liquidity and stabilize the market. How? The market maker long the put will buy (sell) the underlying to neutralize directional risk as price falls (rises).

As noted in past commentaries, the removal of put-heavy exposure, after the January monthly options expiration (OPEX), as well as the reduction in event premiums tied to FOMC, opened a window of strength, wherein dealers would have less positive delta to sell against.

In other words, as measures of implied volatility were to compress, as is the case when there is less demand (or more supply) of downside put protection (a positive-delta trade for the dealers), the dealer’s exposure to positive delta declines.

However, the failure to expand range is punishing toward highly demanded protection with a shorter time to maturity. These options, which are more “convex” and sensitive to changes in direction and volatility, have the most to lose as markets settle and “decay returns with vengeance,” according to SpotGamma, an options modeling and data service.

“As time and volatility trend to zero (as all options expire), given the current market environment, dealers’ exposure to the risk of out-of-the-money protection will decline.”

That solicits the dealers’ unwind of “short-delta hedges to decaying positive-delta protection.”

Those delta hedging flows with respect to time (charm) and volatility (vanna) are to reinforce the strong buying support (as measured by liquidity provision on the market-making side).

Graphic: From SpotGamma. SPX prices X-axis. Option delta Y-axis. When the factors of implied volatility and time change, hedging ratios change. For instance, if SPX is at $4,700.00 and IV jumps 15% (all else equal), the dealer may sell an additional 0.2 deltas to hedge their exposure to the addition of a positive 0.2 delta. The graphic is for illustrational purposes, only.

At present, in putting it simply, markets would really have to (1) fall out of bed or (2) demand for protection to explode for options counterparties, at least, to pressure markets much further.

As SpotGamma (which you can check out by clicking here) puts well: 

“In other words, the frantic hedging that destabilizes markets as customers reach for protection en masse has already happened. There would have to be an addition of macro flows for sale and/or new put buying for dealers to sell.”

Technical: As of 6:55 AM ET, Friday’s regular session (9:30 AM – 4:00 PM ET), in the S&P 500, will likely open in the lower part of a negatively skewed overnight inventory, outside of prior-range and -value, suggesting a potential for immediate directional opportunity.

Gap Scenarios: Gaps ought to fill quickly. Should they not, that’s a signal of strength; do not fade. Leaving value behind on a gap-fill or failing to fill a gap (i.e., remaining outside of the prior session’s range) is a go-with indicator.

Auctioning and spending at least 1-hour of trade back in the prior range suggests a lack of conviction; in such a case, do not follow the direction of the most recent initiative activity.

In the best case, the S&P 500 trades higher; activity above the $4,332.25 high volume area (HVNode) puts in play the $4,370.25 low volume area (LVNode). Initiative trade beyond the LVNode could reach as high as the $4,393.75 HVNode and $4,421.50 regular trade high (RTH High), or higher.

In the worst case, the S&P 500 trades lower; activity below the $4,332.25 HVNode puts in play the $4,299.25 RTH Low. Initiative trade beyond the RTH Low could reach as low as the $4,263.25 overnight low (ONL) and $4,212.50 RTH Low, or lower.

Click here to load today’s key levels into the web-based TradingView charting platform. Note that all levels are derived using the 65-minute timeframe. New links are produced, daily.
Graphic: 65-minute profile chart of the Micro E-mini S&P 500 Futures.

Definitions

Overnight Rally Highs (Lows): Typically, there is a low historical probability associated with overnight rally-highs (lows) ending the upside (downside) discovery process.

Volume Areas: A structurally sound market will build on areas of high volume (HVNodes). Should the market trend for long periods of time, it will lack sound structure, identified as low volume areas (LVNodes). LVNodes denote directional conviction and ought to offer support on any test. 

If participants were to auction and find acceptance into areas of prior low volume (LVNodes), then future discovery ought to be volatile and quick as participants look to HVNodes for favorable entry or exit.

Gamma: Gamma is the sensitivity of an option to changes in the underlying price. Dealers that take the other side of options trades hedge their exposure to risk by buying and selling the underlying. When dealers are short-gamma, they hedge by buying into strength and selling into weakness. When dealers are long-gamma, they hedge by selling into strength and buying into weakness. The former exacerbates volatility. The latter calms volatility.

Vanna: The rate at which the delta of an option changes with respect to volatility.

Charm: The rate at which the delta of an option changes with respect to time.

Options Expiration (OPEX): Traditionally, option expiries mark an end to pinning (i.e, the theory that market makers and institutions short options move stocks to the point where the greatest dollar value of contracts will expire) and the reduction dealer gamma exposure.

About

After years of self-education, strategy development, mentorship, and trial-and-error, Renato Leonard Capelj began trading full-time and founded Physik Invest to detail his methods, research, and performance in the markets.

Capelj is also a Benzinga finance and technology reporter interviewing the likes of Shark Tank’s Kevin O’Leary, JC2 Ventures’ John Chambers, FTX’s Sam Bankman-Fried, and ARK Invest’s Catherine Wood, as well as a SpotGamma contributor developing insights around impactful options market dynamics. 

Disclaimer

Physik Invest does not carry the right to provide advice.

In no way should the materials herein be construed as advice. Derivatives carry a substantial risk of loss. All content is for informational purposes only.
Categories
Commentary

Daily Brief For January 26, 2022

Editor’s Note: Our newsletter service provider is not working, today. Our apologies if you were not able to receive the note via email, as usual.

What Happened

Overnight, equity index futures auctioned sideways to higher as some metrics show investors bought the dip, aggressively, after Monday’s liquidation. 

At the same time measures of implied volatility compressed and the flows associated with that, too, are supporting the recovery.

Still “a rising interest rate environment [which] is leading to a revaluation,” is a key concern, and investors will be looking for clarity on monetary policy from the Federal Open Market Committee, today, after 2:00 PM ET

Other data to be released today include trade in goods (8:30 AM ET) and new home sales (10:00 AM ET).

Graphic updated 6:00 AM ET. Sentiment Neutral if expected /ES open is inside of the prior day’s range. /ES levels are derived from the profile graphic at the bottom of the following section. Levels may have changed since initially quoted; click here for the latest levels. SqueezeMetrics Dark Pool Index (DIX) and Gamma (GEX) calculations are based on where the prior day’s reading falls with respect to the MAX and MIN of all occurrences available. A higher DIX is bullish. At the same time, the lower the GEX, the more (expected) volatility. Learn the implications of volatility, direction, and moneyness. SHIFT data used for S&P 500 (INDEX: SPX) options activity. Note that options flow is sorted by the call premium spent; if more positive, then more was spent on call options. Breadth reflects a reading of the prior day’s NYSE Advance/Decline indicator. VIX reflects a current reading of the CBOE Volatility Index (INDEX: VIX) from 0-100.

What To Expect

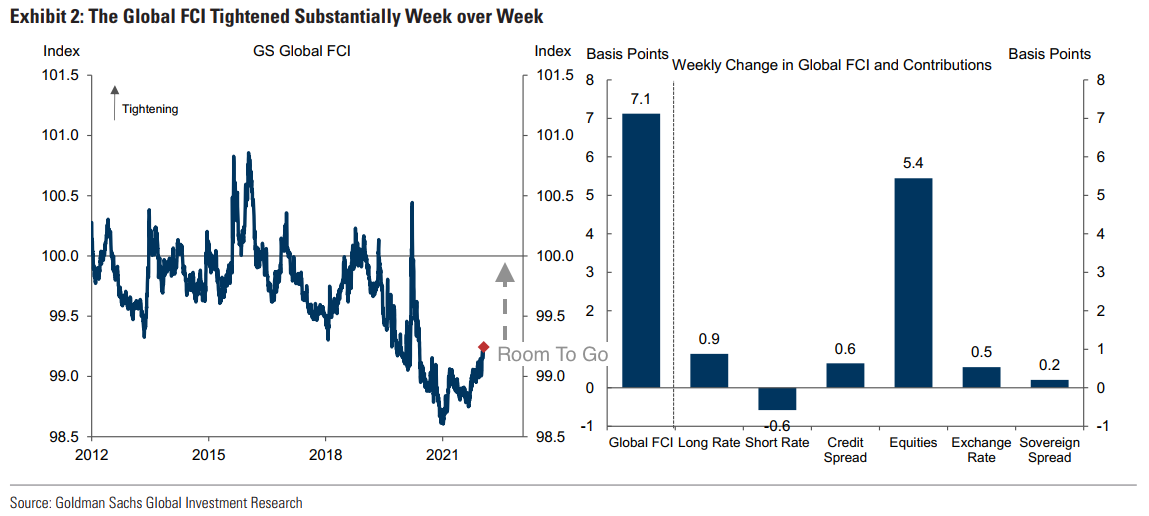
Fundamental: As Bloomberg’s John Authers puts it well, drops in the market may make it more difficult to raise capital and this can tighten financial conditions.

“This leads to the hope that the stock market has already done some of the Fed’s job, so there will be less need for higher fed funds rates — and also that the Fed might have to act at some point if the stock market fall tightens conditions too much.”

Graphic: The “annual rate of change in the Fed Funds rate” via topdowncharts.com.

Though this most recent liquidation tightened financial conditions, it is not likely that the Federal Reserve (Fed) will change its tone amidst heightened inflation, among other things.

Graphic: Per Bloomberg, “there is quite a long way to go before the Fed would feel any great need to come to their rescue.”

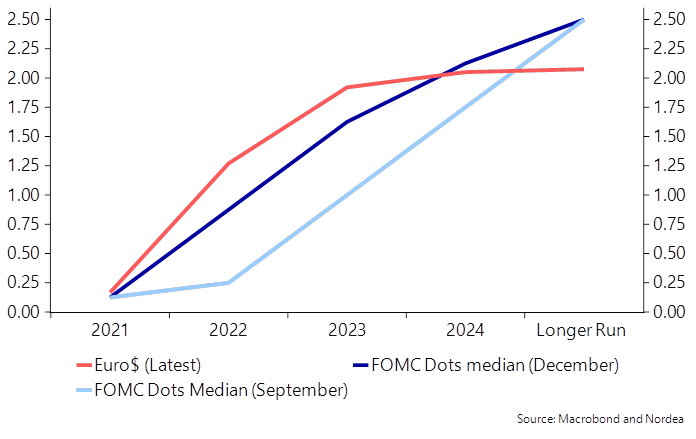
In fact, according to Nordea Bank’s (OTC: NRDBY) research arm, though there are lower odds of a much “faster tapering,” the Fed is to continue “building towards a March hike.” 

Flexibility in policy, as well as a potential dismissal of a 50 basis point hike given geopolitical tensions, some poor responses to earnings results, and disappointments in real demand and growth, “could make for a brief market relief.”

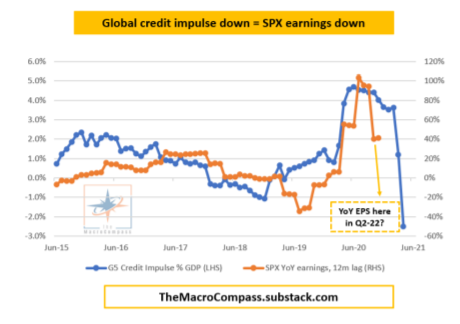
Graphic: @MacroAlf plots credit impulse as a percent of GDP and SPX year-over-year earnings.

“Our forecast includes four hikes for the year, which is consistent with current market pricing,” Nordea adds on in a statement on the Fed not hiking by more than 25 basis points since the early 2000s. “In our view balances are tilted towards balance sheet tightening rather than adding a fifth or sixth hike this year.”

Graphic: Nordea says that “short-end pricing could take a break in the short-term.”

In the end, though, monetary frameworks and max liquidity promoted a divergence in price from fundamentals. Expected monetary policy evolution will make valuations much less justifiable. 

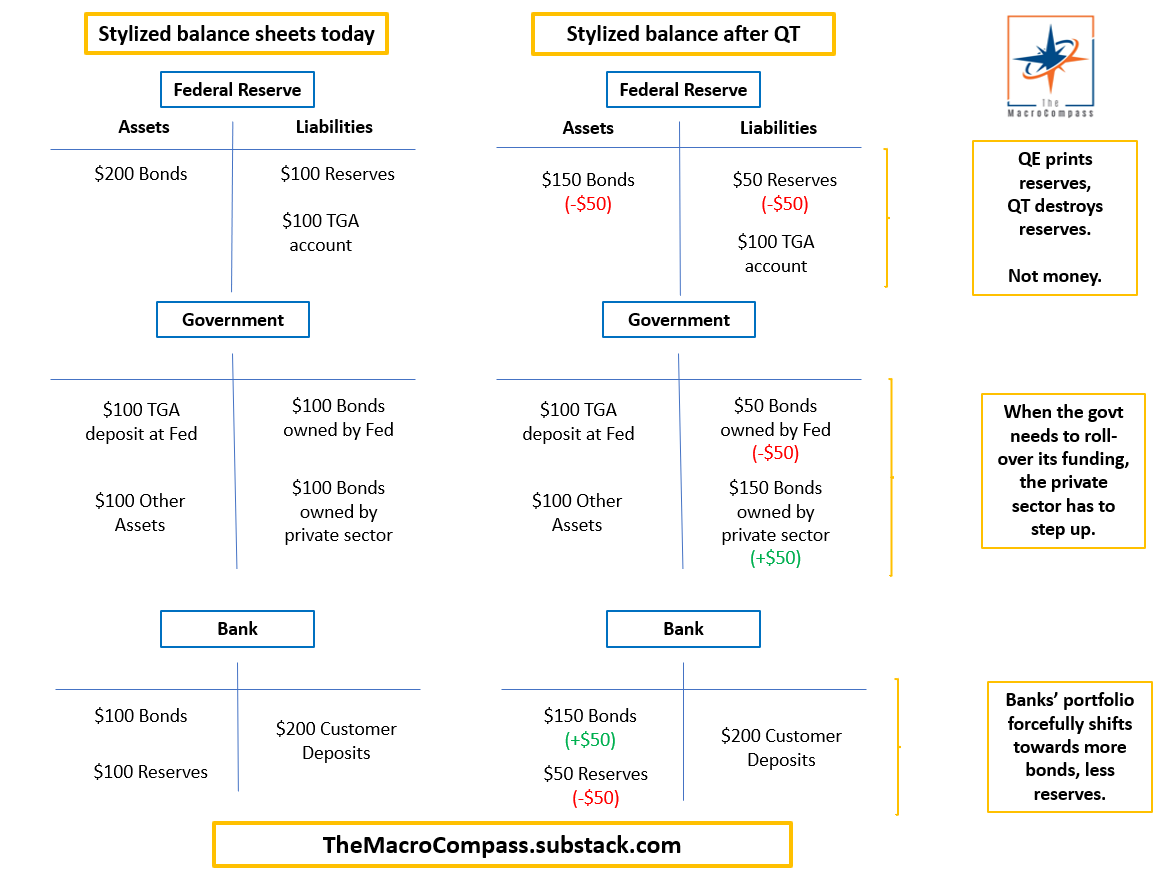
“The mechanical impact of QT should result in less liquidity and more net issuance thereby rising rates, but the empirical story, supported by growth prospects, [] is different,” Nordea says. 

Still, an “abundance of excess liquidity could provide a cushion as the Fed drains liquidity, a cushion that did not exist in 2018.”

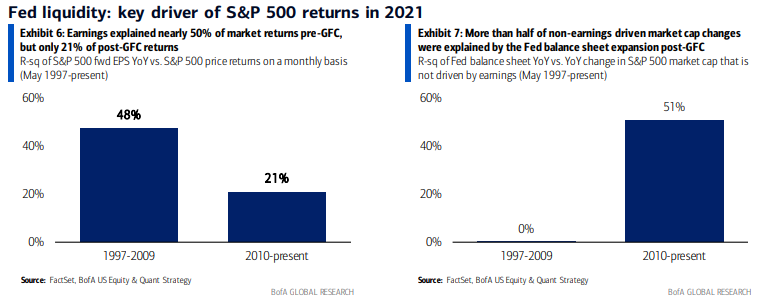
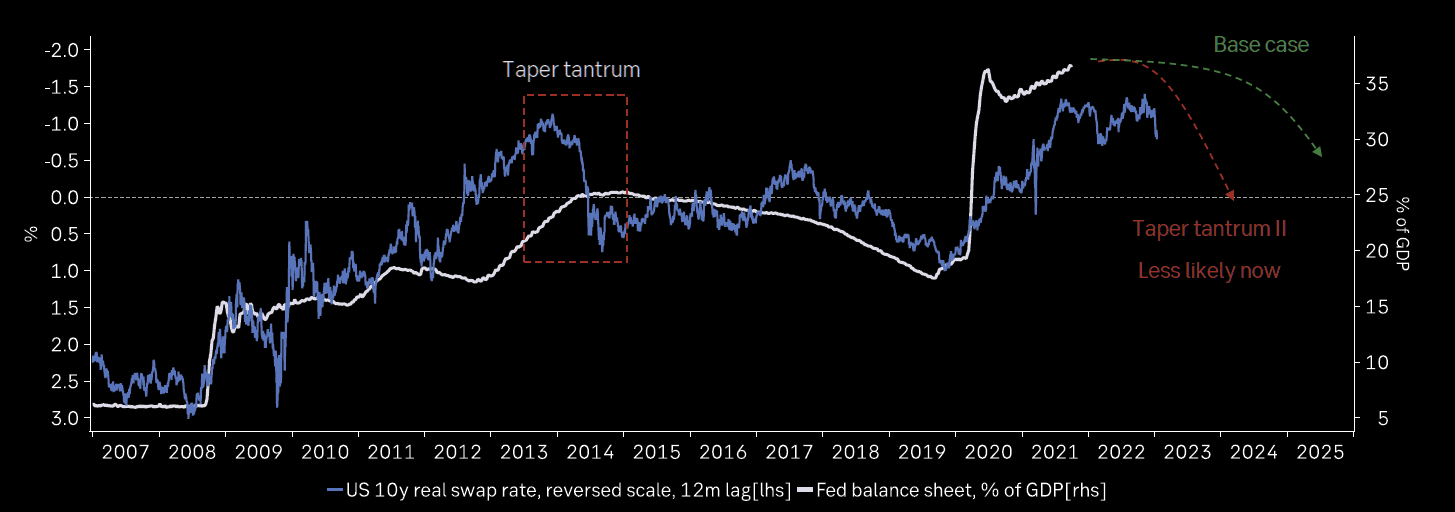
Graphic: Per Bloomberg, “As Savita Subramanian of Bank of America Corporation (NYSE: BAC) shows in the following chart, expected earnings are far less helpful in explaining market outcomes since 2010 than they were before. Meanwhile, changes in the Fed’s balance sheet, the amount of money it’s making available to markets, have become hugely important.”

Perspectives: Matt Maley of Miller Tabak + Co. suggests “the amount of leverage that built up over the past several years will take longer to unwind,” and “we’ve moved into a period where investors should sell the rallies rather than buy the dips.”

This is somewhat in opposition to JPMorgan Chase & Co’s (NYSE: JPM) Mark Kolanovic statements that “worries around rates and corporate margins are overdone,” and “the earnings season [will] reassure, and in a worst-case scenario could see a return of the ‘Fed put.’”

When examining extraordinary actions by the Fed, “the average ‘exercise price’ is a -23.8% peak to trough (equating currently to SPX 3,670.00),” Evercore Inc (NYSE: EVR) adds.

“The Fed is likely to ‘exercise the Fed put’ should the average -23.8% strike price come into view.”

Positioning: A lower liquidity, short-gamma environment (wherein an options delta falls with stock price rises and rises when stock prices fall) has led to more erratic moves, as a result of counterparty hedging activities.

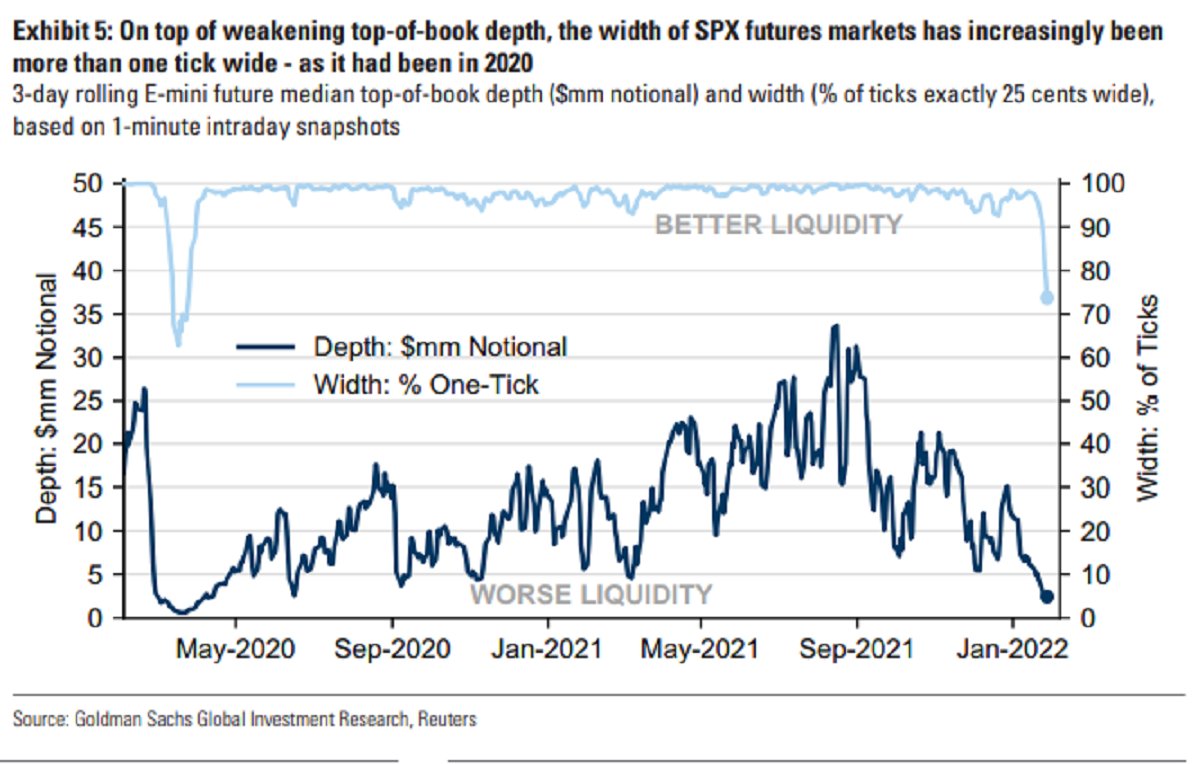
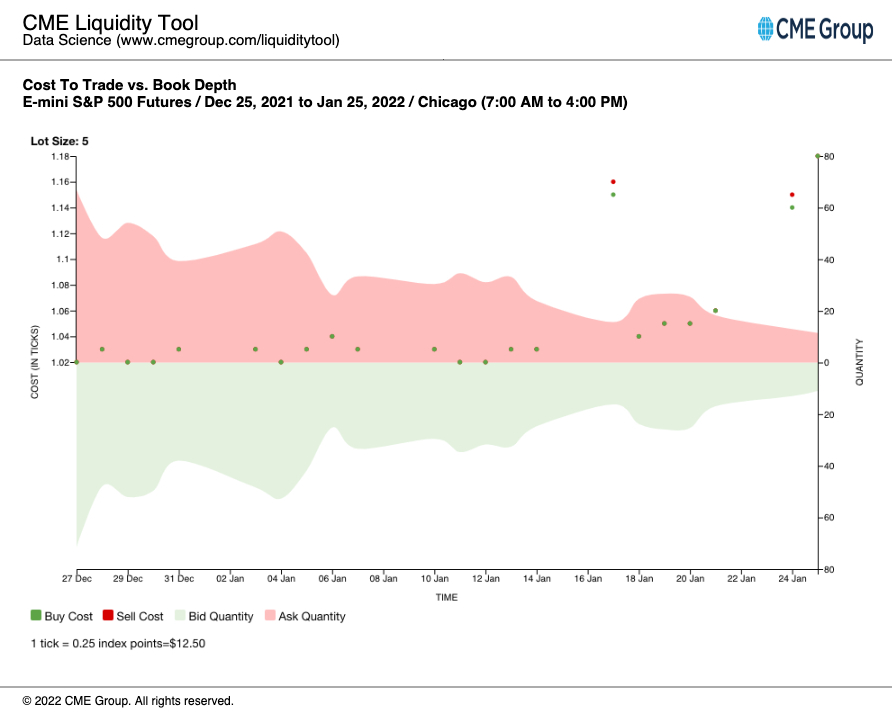
Graphic: Analysis of book depth for the E-mini S&P 500 futures contract, via CME Group Inc’s (NASDAQ: CME) Liquidity Tool. For more on the implications of participants’ options positioning and dealer hedging, read here.

The removal of put-heavy exposure, post-monthly options expiration (OPEX), and a reduction in embedded event premiums tied to the approaching FOMC, opens up a window of strength, wherein dealers have less positive delta exposure to sell against.

In other words, as measures of implied volatility compress, as is the case when there is less demand for downside put protection (a positive-delta trade for the dealers), the dealer’s exposure to positive delta declines.

Graphic: VIX term structure compresses.

All else equal, this solicits dealer buying of the underlying (a reduction of short-delta hedges).

Graphic: SqueezeMetrics details the implications of customer activity in the options market, on the underlying’s order book. For instance, in selling a put, customers add liquidity and stabilize the market. How? The market maker long the put will buy (sell) the underlying to neutralize directional risk as price falls (rises).

Taking into account options positioning, versus buying pressure (measured via short sales or liquidity provision on the market-making side), metrics are positively skewed, much more than yesterday. Tuesday the tone changed and the dip was bought.

Graphic: Data SqueezeMetrics. Graph via Physik Invest.

Technical: As of 6:00 AM ET, Wednesday’s regular session (9:30 AM – 4:00 PM ET), in the S&P 500, will likely open in the upper part of a positively skewed overnight inventory, just inside of prior-range and -value, suggesting a limited potential for immediate directional opportunity.

Gap Scenarios In Play (Potentially): Gaps ought to fill quickly. Should they not, that’s a signal of strength; do not fade. Leaving value behind on a gap-fill or failing to fill a gap (i.e., remaining outside of the prior session’s range) is a go-with indicator.

Auctioning and spending at least 1-hour of trade back in the prior range suggests a lack of conviction; in such a case, do not follow the direction of the most recent initiative activity.

In the best case, the S&P 500 trades higher; activity above the $4,411.75 regular trade high (RTH High) puts in play the $4,449.00 untested point of control (VPOC). Initiative trade beyond the VPOC could reach as high as the $4,486.76 RTH High and $4,526.25 high volume area (HVNode), or higher.

In the worst case, the S&P 500 trades lower; activity below the $4,411.75 RTH High puts in play the $4,346.75 HVNode. Initiative trade beyond the HVNode could reach as low as the $4,276.50 and $4,212.50 RTH Low, or lower.

Click here to load today’s key levels into the web-based TradingView charting platform. Note that all levels are derived using the 65-minute timeframe. New links are produced, daily.
Graphic: 65-minute profile chart of the Micro E-mini S&P 500 Futures.

What People Are Saying

Definitions

Volume Areas: A structurally sound market will build on areas of high volume (HVNodes). Should the market trend for long periods of time, it will lack sound structure, identified as low volume areas (LVNodes). LVNodes denote directional conviction and ought to offer support on any test. 

If participants were to auction and find acceptance into areas of prior low volume (LVNodes), then future discovery ought to be volatile and quick as participants look to HVNodes for favorable entry or exit.

Gamma: Gamma is the sensitivity of an option to changes in the underlying price. Dealers that take the other side of options trades hedge their exposure to risk by buying and selling the underlying. When dealers are short-gamma, they hedge by buying into strength and selling into weakness. When dealers are long-gamma, they hedge by selling into strength and buying into weakness. The former exacerbates volatility. The latter calms volatility.

Vanna: The rate at which the delta of an option changes with respect to volatility.

POCs: POCs are valuable as they denote areas where two-sided trade was most prevalent in a prior day session. Participants will respond to future tests of value as they offer favorable entry and exit.

Options Expiration (OPEX): Traditionally, option expiries mark an end to pinning (i.e, the theory that market makers and institutions short options move stocks to the point where the greatest dollar value of contracts will expire) and the reduction dealer gamma exposure.

About

After years of self-education, strategy development, mentorship, and trial-and-error, Renato Leonard Capelj began trading full-time and founded Physik Invest to detail his methods, research, and performance in the markets.

Capelj is also a Benzinga finance and technology reporter interviewing the likes of Shark Tank’s Kevin O’Leary, JC2 Ventures’ John Chambers, FTX’s Sam Bankman-Fried, and ARK Invest’s Catherine Wood, as well as a SpotGamma contributor developing insights around impactful options market dynamics.

Disclaimer

Physik Invest does not carry the right to provide advice.

In no way should the materials herein be construed as advice. Derivatives carry a substantial risk of loss. All content is for informational purposes only.
Categories
Commentary

Daily Brief For January 24, 2022

The Daily Brief is a free glimpse into the prevailing fundamental and technical drivers of U.S. equity market products. Join the 200+ that read this report daily, below!

What Happened

Overnight, equity index futures auctioned sideways to lower while measures of implied volatility expanded, which suggests increased fear and demand for protection.

This is in the context of an environment wherein the equity market, in particular, is positioned for heightened volatility, albeit potential strength, after Friday’s large monthly options expiration.

Ahead is data on Markit Manufacturing and Services PMI (9:45 AM ET).

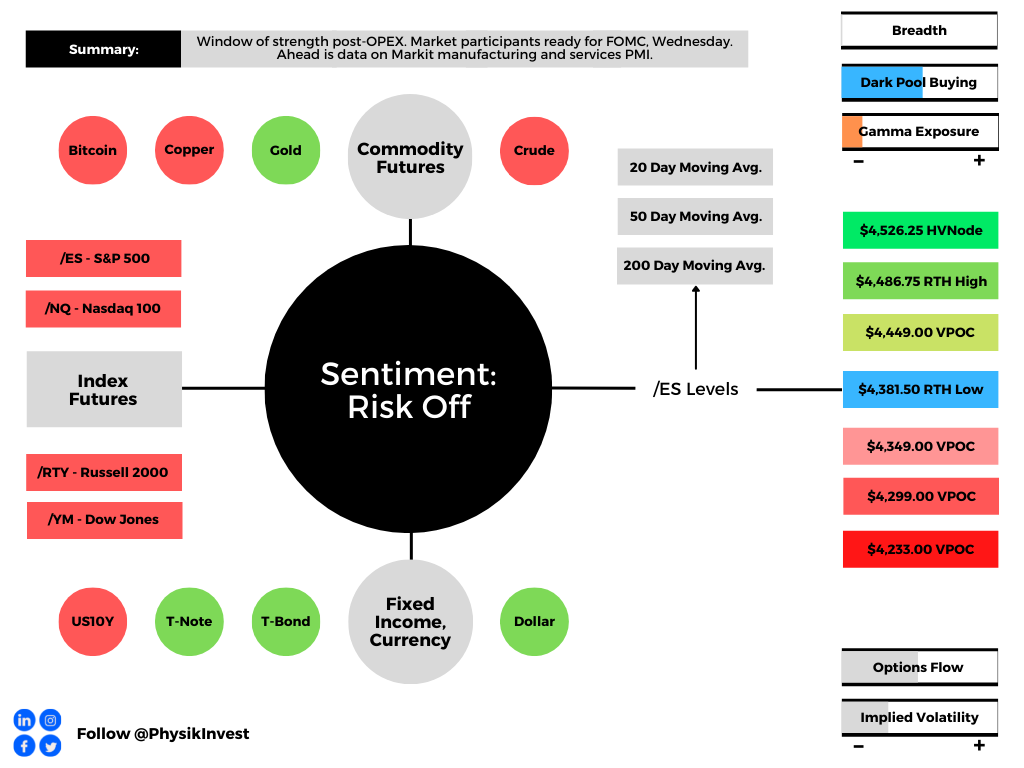
Graphic updated 6:15 AM ET. Sentiment Risk-Off if expected /ES open is below the prior day’s range. /ES levels are derived from the profile graphic at the bottom of the following section. Levels may have changed since initially quoted; click here for the latest levels. SqueezeMetrics Dark Pool Index (DIX) and Gamma (GEX) calculations are based on where the prior day’s reading falls with respect to the MAX and MIN of all occurrences available. A higher DIX is bullish. At the same time, the lower the GEX, the more (expected) volatility. Learn the implications of volatility, direction, and moneyness. SHIFT data used for S&P 500 (INDEX: SPX) options activity. Note that options flow is sorted by the call premium spent; if more positive, then more was spent on call options. Breadth reflects a reading of the prior day’s NYSE Advance/Decline indicator. VIX reflects a current reading of the CBOE Volatility Index (INDEX: VIX) from 0-100.

What To Expect

Fundamental: “The ratio of stocks hitting 52-week lows is at the highest since March 2020,” according to The Market Ear

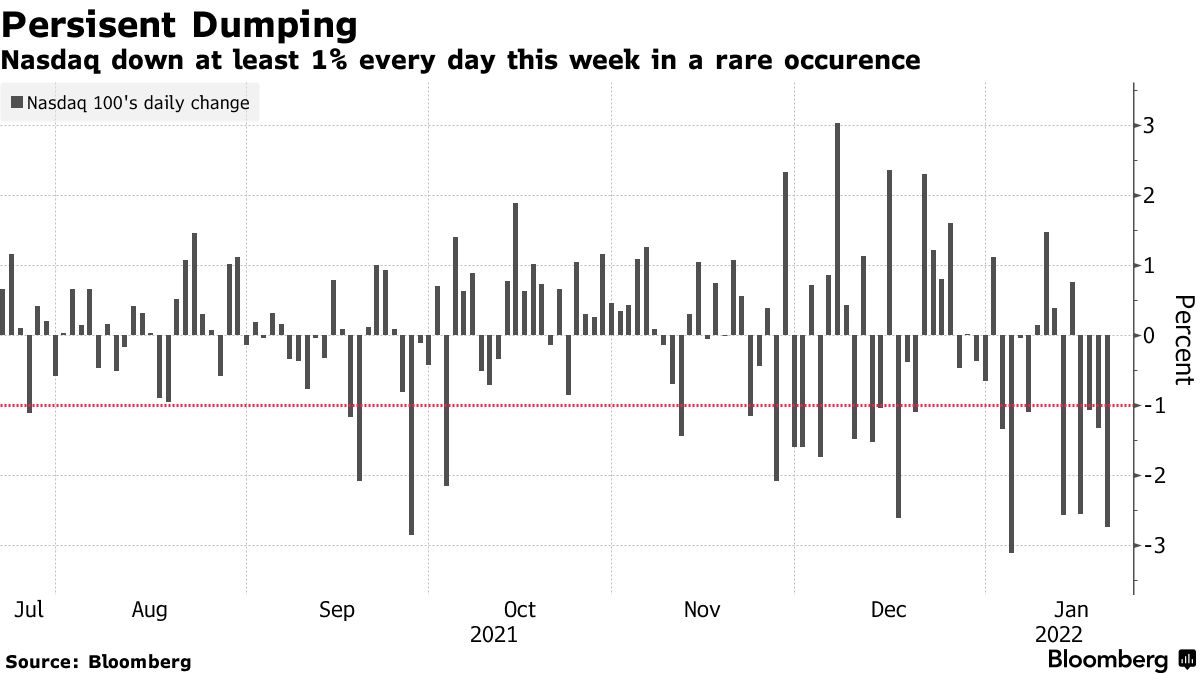
In fact, in the face of a traditionally bullish period, seasonally, this is the worst January on record for the Nasdaq.

Graphic: Per Bloomberg, “Down almost 12% in January, the Nasdaq 100 is on course for its worst month since the 2008 global financial crisis. On any four-day basis, the current streak of 1% drops was the first since 2018.”

This weakness is in the context of months of divergent breadth by lesser weighted index constituents, geopolitical tensions, the prospects of reduced stimulus to combat high inflation, poor responses to earnings results, and disappointments in real demand and growth.

Graphic: @MacroAlf plots credit impulse as a percent of GDP and SPX year-over-year earnings.

The tone amongst retail participants is changing, too, with outflows starting for the first time since a major rush in account openings. When asked whether the selling is over, JPMorgan Chase & Co’s (NYSE: JPM) prime brokerage data suggests no.

This is in opposition to the typical trend into the start of the Federal Reserve (Fed) hiking cycles.

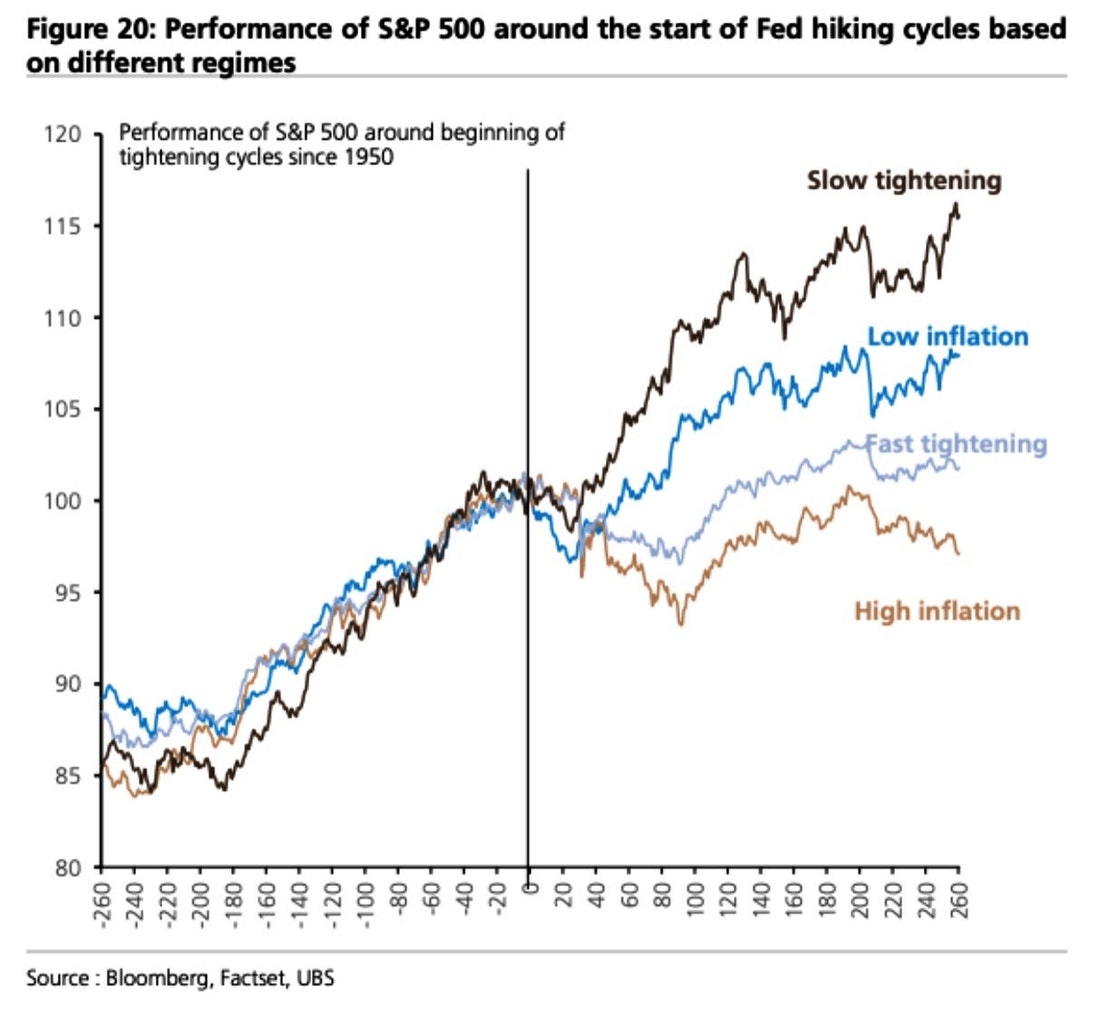
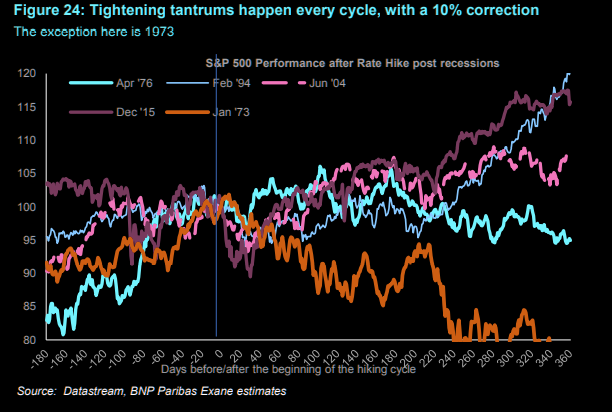
“U.S. equities have stumbled significantly on their way toward the first hike of this cycle, which is not the norm,” Jefferies Financial Group (NYSE: JEF) explained. “Performance tends to be poor immediately after the first hike, and can be worse if stocks are weakly into the first hike.”

Notwithstanding, Jefferies adds, “the SPX was higher in the 12 months that followed the start of each of the last 7 hike cycles.”

Graphic: S&P 500 performance before and after rate hikes.

With some of that context in mind, what is there to look forward to? The corporate buyback blackout window ended after the close of business, Friday, and equity inflows remain robust.

What is there to be wary of? 

Well, given that “risk is being repriced to fit the world where real rates are a lot higher, and the Fed put [is] much lower thanks to the Fed’s need to fight inflation,” this week’s Federal Open Market Committee (FOMC) meeting shall provide market participants more context as to the “timing and pace of QT” which may assuage fears unless the Fed is all out to “drop QE next week itself.”

The odds of that happening are low.

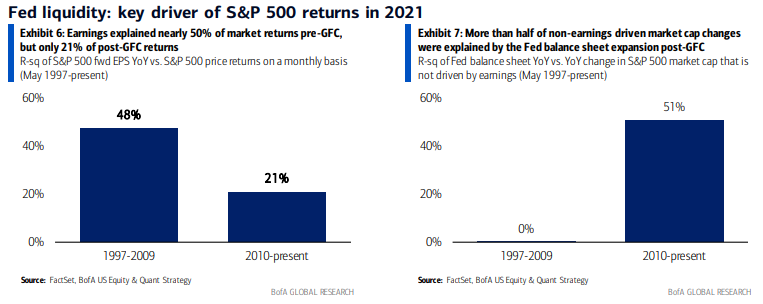
Graphic: Per Bloomberg, “As Savita Subramanian of Bank of America Corporation (NYSE: BAC) shows in the following chart, expected earnings are far less helpful in explaining market outcomes since 2010 than they were before. Meanwhile, changes in the Fed’s balance sheet, the amount of money it’s making available to markets, have become hugely important.”

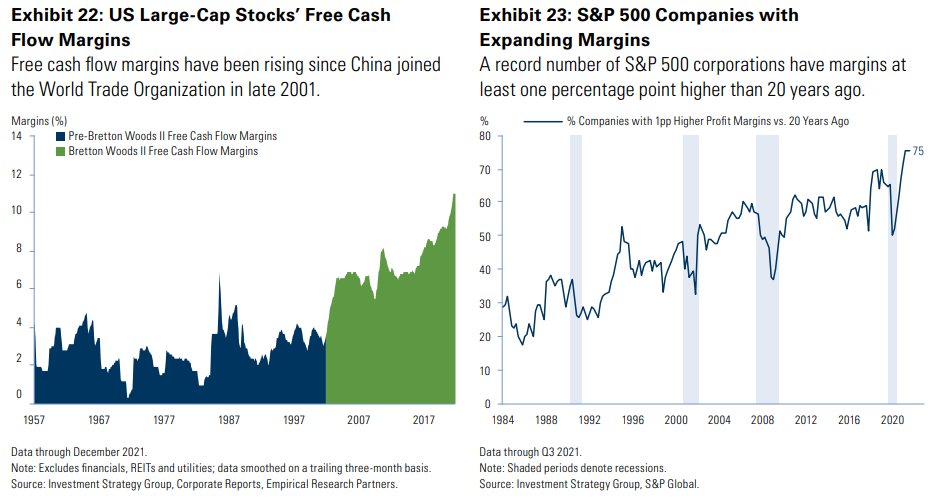
As Bloomberg’s John Authers puts it well: “Despite many scares, money has stayed plentiful for the last decade, rates have fallen, and anyone who did much to protect themselves against the risk of a decline would have done badly by it.”

Graphic: As Goldman Sachs Group Inc (NYSE: GS) “shows in this chart, companies are becoming ever more profitable in a way that seems to be sustained.”

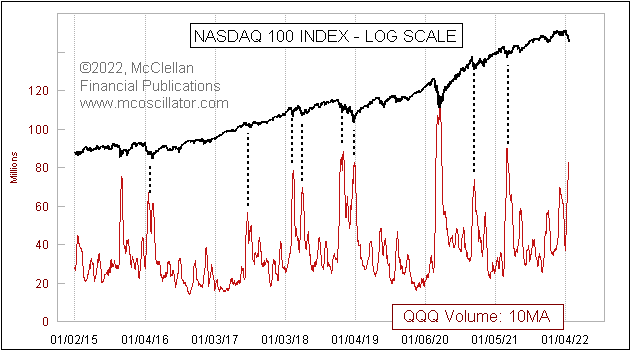
Positioning: The major broad market indices – the S&P 500, Nasdaq 100, and Russell 2000 – are in an environment characterized by negative gamma and heightened volumes. 

Graphic: Per Tom McClellan, “Persistently high volume late in QQQ is a sign of overly bearish sentiment worthy of a bottom. Key caveat: just because one notices a sentiment indication which should matter does not mean it has to matter right away.”

The negative gamma – in reference to the options counterparties reaction “when a position’s delta falls (rises) with stock or index price rises (falls)” – is what compounds the selling. 

With measures of implied volatility expanding, as is the case when there is heightened demand for downside put protection (a positive-delta trade for the dealers), protection is bid and the dealer’s exposure to positive delta rises, which solicits more selling in the underlying (addition of short-delta hedges).

Graphic: SqueezeMetrics details the implications of customer activity in the options market, on the underlying’s order book. For instance, in selling a put, customers add liquidity and stabilize the market. How? The market maker long the put will buy (sell) the underlying to neutralize directional risk as price falls (rises).

Moreover, in negative-gamma, dealers are selling weakness and buying strength, taking liquidity. 

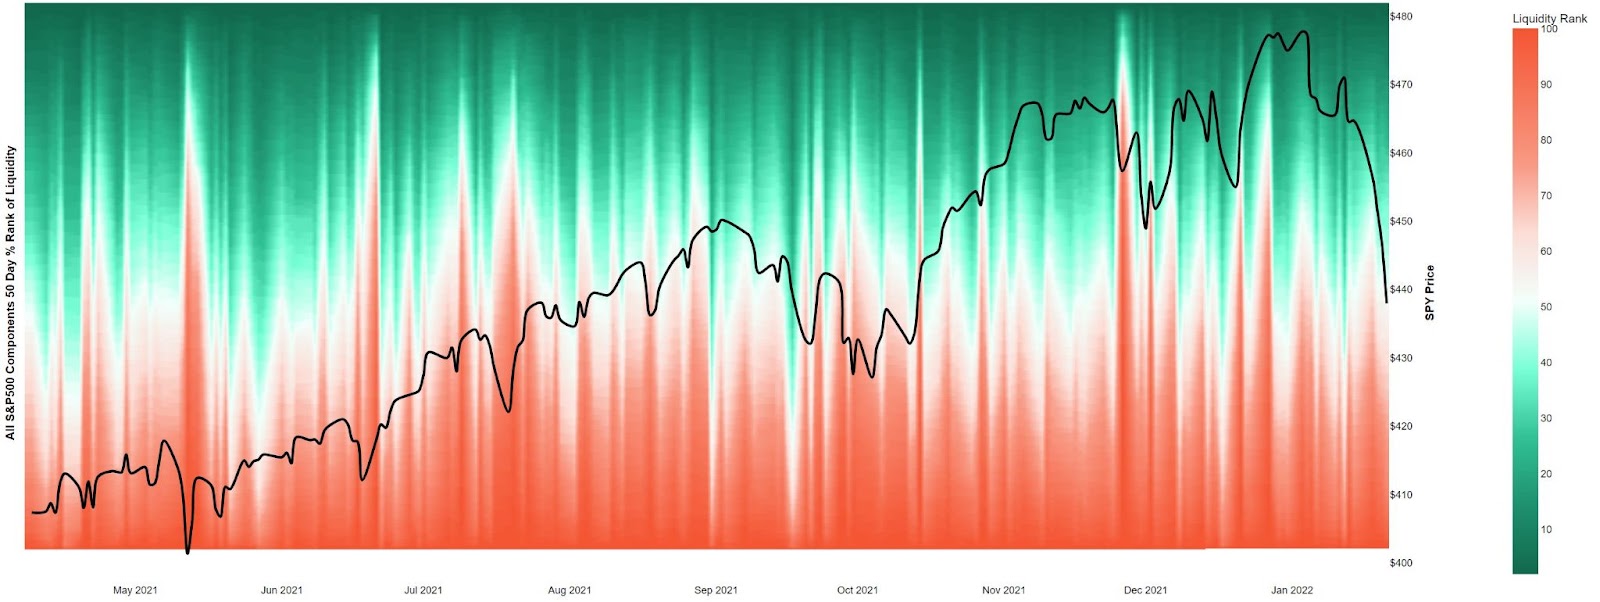
That’s destabilizing but it appears that “Friday in the markets did not have abnormal liquidity across S&P500 stocks.”

Graphic: Per @HalfersPower on Twitter, liquidity rankings for S&P 500 components. 

High readings in indicators like the put/call volume ratio, which denotes heightened trade of puts, relative to calls, as well as how calm equity market volatility is relative to rate volatility, could be the result of adequate hedging into the monthly options expiration (OPEX) and this week’s FOMC meeting.

“A very nasty flush out on a key polarized psychological level (S&P 500 $4,500.00) on the highest negative gamma day on an OPEX,” said Kris Sidial of The Ambrus Group on the increased potential for relief as a result of aggressive dip-buying. 

“Aggressive shorts piling in on an already dismantled tech selloff, leading into FOMC meeting after an 8% decline in the market, and Apple Inc (NASDAQ: AAPL) reporting earnings.”

Sidial’s opinion that the market is due for a counter-trend rally, in the face of an environment in which “there does not seem to be a direct hazard,” is aligned with the expectation that removal of put-heavy exposure, post-OPEX, and a reduction in embedded event premiums tied to the approaching FOMC, opens up a window of strength, wherein dealers have less positive delta exposure to sell against.

Technical: As of 6:15 AM ET, Monday’s regular session (9:30 AM – 4:00 PM ET), in the S&P 500, will likely open in the lower part of a balanced skewed overnight inventory, outside of prior-range and -value, suggesting a potential for immediate directional opportunity.

Gap Scenarios: Gaps ought to fill quickly. Should they not, that’s a signal of strength; do not fade. Leaving value behind on a gap-fill or failing to fill a gap (i.e., remaining outside of the prior session’s range) is a go-with indicator.

Auctioning and spending at least 1-hour of trade back in the prior range suggests a lack of conviction; in such a case, do not follow the direction of the most recent initiative activity.

In the best case, the S&P 500 trades higher; activity above the $4,381.50 regular trade low (RTH Low) puts in play the $4,449.00 untested point of control (VPOC). Initiative trade beyond the VPOC could reach as high as the $4,486.75 RTH High and $4,526.25 high volume area (HVNode), or higher.

In the worst case, the S&P 500 trades lower; activity below the $4,381.50 RTH Low puts in play the $4,349.00 VPOC. Initiative trade beyond the $4,349.00 VPOC could reach as low as the $4,299.00 and $4,233.00 VPOC, or lower.

Considerations: The daily, weekly, and monthly charts are in alignment. 

The loss of trend across higher timeframes suggests a clear change in tone. This does not discount the potential for fast, but short-lived counter-trend rallies.

Click here to load today’s key levels into the web-based TradingView charting platform. Note that all levels are derived using the 65-minute timeframe. New links are produced, daily.
Graphic: 65-minute profile chart of the Micro E-mini S&P 500 Futures.

Definitions

Volume Areas: A structurally sound market will build on areas of high volume (HVNodes). Should the market trend for long periods of time, it will lack sound structure, identified as low volume areas (LVNodes). LVNodes denote directional conviction and ought to offer support on any test. 

If participants were to auction and find acceptance into areas of prior low volume (LVNodes), then future discovery ought to be volatile and quick as participants look to HVNodes for favorable entry or exit.

POCs: POCs are valuable as they denote areas where two-sided trade was most prevalent in a prior day session. Participants will respond to future tests of value as they offer favorable entry and exit.

Options Expiration (OPEX): Traditionally, option expiries mark an end to pinning (i.e, the theory that market makers and institutions short options move stocks to the point where the greatest dollar value of contracts will expire) and the reduction dealer gamma exposure.

About

After years of self-education, strategy development, mentorship, and trial-and-error, Renato Leonard Capelj began trading full-time and founded Physik Invest to detail his methods, research, and performance in the markets.

Capelj is also a Benzinga finance and technology reporter interviewing the likes of Shark Tank’s Kevin O’Leary, JC2 Ventures’ John Chambers, FTX’s Sam Bankman-Fried, and ARK Invest’s Catherine Wood, as well as a SpotGamma contributor developing insights around impactful options market dynamics.

Disclaimer

Physik Invest does not carry the right to provide advice.

In no way should the materials herein be construed as advice. Derivatives carry a substantial risk of loss. All content is for informational purposes only.

Categories
Commentary

Daily Brief For January 18, 2022

The Daily Brief is a free glimpse into the prevailing fundamental and technical drivers of U.S. equity market products. Join the 200+ that read this report daily, below!

What Happened

Overnight, equity index futures auctioned lower alongside a surge in bond yields. Rate-sensitive sectors were weakest in pre-market trade, in comparison to the value and cyclical names. 

Earnings are now in focus. Participants shall use earnings updates to gauge how companies are performing in spite of omicron, among other challenges.

Ahead is data on the Empire Manufacturing Index (8:30 AM ET) and NAHB Home Builders Index (10:00 AM ET). 

Graphic updated 6:30 AM ET. Sentiment Risk-Off if expected /ES open is below the prior day’s range. /ES levels are derived from the profile graphic at the bottom of the following section. Levels may have changed since initially quoted; click here for the latest levels. SqueezeMetrics Dark Pool Index (DIX) and Gamma (GEX) calculations are based on where the prior day’s reading falls with respect to the MAX and MIN of all occurrences available. A higher DIX is bullish. At the same time, the lower the GEX, the more (expected) volatility. Learn the implications of volatility, direction, and moneyness. SHIFT data used for S&P 500 (INDEX: SPX) options activity. Note that options flow is sorted by the call premium spent; if more positive, then more was spent on call options. Breadth reflects a reading of the prior day’s NYSE Advance/Decline indicator. VIX reflects a current reading of the CBOE Volatility Index (INDEX: VIX) from 0-100.

What To Expect

Fundamental: Ahead of earnings releases from Goldman Sachs Group (NYSE: GS), Morgan Stanley (NYSE: MS), Bank of America (NYSE: BAC), and Netflix (NASDAQ: NFLX), as well as key rate decisions, indices sold heavy. 

The Nasdaq 100 led the decline after holiday-trade, Monday, as yields surged alongside concerns central banks would tighten monetary policy sooner than expected.

This is as higher rates have the potential to decrease the present value of future earnings, making stocks, especially those that are high growth, less attractive. 

“The rationale behind this is the trade-off,” Grit Capital put well in a recent newsletter

“Why would I park my money somewhere that is only yielding 1%, when I can invest in riskier assets that can raise my return?”

Graphic: Per Grit Capital, “A common proxy that a lot of people look at is the S&P500’s earnings yield (yellow) vs. the 10yr (white).”

At the same time, narratives around quantitative tightening (i.e., the reduction in the size of the Federal Reserve’s balance sheet) are growing louder.

Graphic: QT mechanics per The Macro Compass.

This is what Andy Constan of Damped Spring Advisors refers to as the QT drumbeat. 

This drumbeat is to intensify in spite of strong economic and earnings growth, as well as a moderation in inflation, Constan says

“The lack of additional liquidity provided by Fed purchase will also remove a damper for the market and the economy keeping asset volatility well bid, while also causing asset diversification benefit to fall, generating rising portfolio volatility and the risk demanded to hold assets.”

Note: Check out this Constan’s really interesting story, below!

Graphic: Via The Market Ear, “Temporary relief from Powell – slow reverse QE’ confirmed. Powell says Fed will stop replacing maturing bonds, but will not sell holdings: slow QT.”

“If current, priced in, inflation and growth expectations are exactly realized we predict that risk premiums on 30-year yields will increase by 15bp and equity risk premium by 30bp,” Constan adds. “These risk premium expansions will generate a 2% headwind on long bond prices and a 10% headwind for equity prices.”

Constan’s comments line up with that of Morgan Stanley’s which sees markets selling down 10-20% during H1 2022, as expectations call for five 25 bp hikes. History is in alignment, below.

Graphic: S&P 500 performance before and after rate hikes, via The Market Ear.

So, despite recent inflows and “light positioning,” taking all of the above comments together, the window for stocks to rally is closing.

Positioning: The coming January 19 expiration of options on the Cboe Volatility Index (INDEX: VIX) and January 21 monthly equity options expiration (OPEX) has major implications.

According to Constan, the “[o]ptions expiration which includes lots of LEAP contracts will be a catalyst for a squeeze rally and a post-OpEx sell-off.”

This is as, according to Kai Volatility’s Cem Karsan, there is a constant structural positioning that naturally drives markets higher.

“I use this analogy of a jet,” he explained, referencing the three factors – the change in the underlying price (gamma), implied volatility (vanna), and time (charm) – that are well known to impact an options exposure to directional risk or delta. 

“[T]he hedging vanna and charm flows, and whatnot will push the markets higher.”

To note, though, with narratives around higher rates and QT strengthening, so to speak, divergences between the S&P 500 and metrics like the Bond Closed-End Fund (CEF) Advance-Decline line have already appeared.

As McClellan Financial Publications explains, “liquidity has suddenly become a problem, and it is affecting the more liquidity-sensitive issues first. That can be a prelude to that same illiquidity coming around and biting the big cap stocks that drive the major averages.”

Graphic: Bond CEF A-D showing liquidity problems, via McClellan Financial Publications.

As an aside, some believe that the Fed’s removal of liquidity has the potential to prick the bubble, prompting a cascading reaction that exacerbates underlying price movements.

“It’s not a coincidence that the mid-February to mid-March 2020 downturn literally started the day after February expiration and ended the day of March quarterly expiration,” Karsan adds. 

“These derivatives are incredibly embedded in how the tail reacts and there’s not enough liquidity, given the leverage, if the Fed were to taper.”

Technical: As of 6:30 AM ET, Tuesday’s regular session (9:30 AM – 4:00 PM ET), in the S&P 500, will likely open in the lower part of a negatively skewed overnight inventory, outside of prior-range and -value, suggesting a potential for immediate directional opportunity.

Gap Scenarios: Gaps ought to fill quickly. Should they not, that’s a signal of strength; do not fade. Leaving value behind on a gap-fill or failing to fill a gap (i.e., remaining outside of the prior session’s range) is a go-with indicator.

Auctioning and spending at least 1-hour of trade back in the prior range suggests a lack of conviction; in such a case, do not follow the direction of the most recent initiative activity.

In the best case, the S&P 500 trades higher; activity above the $4,593.00 point of control (POC) puts in play the $4,624.75 low volume area (LVNode). Initiative trade beyond the LVNode could reach as high as the $4,633.00 POC and $4,650.75 regular trade low (RTH Low), or higher.

In the worst case, the S&P 500 trades lower; activity below the $4,593.00 POC puts in play the $4,574.25 high volume area (HVNode). Initiative trade beyond the HVNode could reach as low as the $4,549.00 VPOC and $4,520.00 RTH Low, or lower.

Considerations: The S&P 500 remains above its 200-day simple moving average. The long-term trend remains up.

Click here to load today’s key levels into the web-based TradingView charting platform. Note that all levels are derived using the 65-minute timeframe. New links are produced, daily.
Graphic: 65-minute profile chart of the Micro E-mini S&P 500 Futures.

Definitions

Volume Areas: A structurally sound market will build on areas of high volume (HVNodes). Should the market trend for long periods of time, it will lack sound structure, identified as low volume areas (LVNodes). LVNodes denote directional conviction and ought to offer support on any test. 

If participants were to auction and find acceptance into areas of prior low volume (LVNodes), then future discovery ought to be volatile and quick as participants look to HVNodes for favorable entry or exit.

POCs: POCs are valuable as they denote areas where two-sided trade was most prevalent in a prior day session. Participants will respond to future tests of value as they offer favorable entry and exit.

MCPOCs: POCs are valuable as they denote areas where two-sided trade was most prevalent over numerous day sessions. Participants will respond to future tests of value as they offer favorable entry and exit.

Options Expiration (OPEX): Traditionally, option expiries mark an end to pinning (i.e, the theory that market makers and institutions short options move stocks to the point where the greatest dollar value of contracts will expire) and the reduction dealer gamma exposure.

About

After years of self-education, strategy development, mentorship, and trial-and-error, Renato Leonard Capelj began trading full-time and founded Physik Invest to detail his methods, research, and performance in the markets.

Capelj is also a Benzinga finance and technology reporter interviewing the likes of Shark Tank’s Kevin O’Leary, JC2 Ventures’ John Chambers, FTX’s Sam Bankman-Fried, and ARK Invest’s Catherine Wood, as well as a SpotGamma contributor developing insights around impactful options market dynamics.

Disclaimer

Physik Invest does not carry the right to provide advice.

In no way should the materials herein be construed as advice. Derivatives carry a substantial risk of loss. All content is for informational purposes only.

Categories
Commentary

Daily Brief For January 12, 2022

The Daily Brief is a free glimpse into the prevailing fundamental and technical drivers of U.S. equity market products. Join the 200+ that read this report daily, below!

What Happened

Overnight, equity index, as well as most commodity, and bond futures were higher ahead of data releases on the Consumer Price Index (8:30 AM ET), Federal Budget, and Beige Book (2:00 PM ET), as well as Fed-speak by Neel Kashkari (1:00 PM ET).

Graphic updated 6:30 AM ET. Sentiment Risk-On if expected /ES open is above the prior day’s range. /ES levels are derived from the profile graphic at the bottom of the following section. Levels may have changed since initially quoted; click here for the latest levels. SqueezeMetrics Dark Pool Index (DIX) and Gamma (GEX) calculations are based on where the prior day’s reading falls with respect to the MAX and MIN of all occurrences available. A higher DIX is bullish. At the same time, the lower the GEX, the more (expected) volatility. Learn the implications of volatility, direction, and moneyness. SHIFT data used for S&P 500 (INDEX: SPX) options activity. Note that options flow is sorted by the call premium spent; if more positive, then more was spent on call options. Breadth reflects a reading of the prior day’s NYSE Advance/Decline indicator. VIX reflects a current reading of the CBOE Volatility Index (INDEX: VIX) from 0-100.

What To Expect

Fundamental: The focus, today, is whether or not the headline inflation rate tops 7%. 

Graphic: Inflation forecasts via Bloomberg.

This is as improvements in the U.S. labor market and increased hawkishness from the Federal Reserve (Fed) are playing into a recent rotation (into value) and broad market slump.

As stocks recover from their multi-day slump; Jerome Powell reassured investors, Tuesday, that the Fed would stem increasing inflation and shrink its balance sheet. 

“Hawkish Fed repricing is likely largely done for now,” and “resilient earnings should help equities rebound,” Barclays Plc (NYSE: BCS) strategists explained in a recent note. 

Graphic: Via @biancoresearch, “we are in a rare period when what the market has priced in is the outlier call.”

JPMorgan Chase & Co (NYSE: JPM) agrees. Equities should be able to withstand hikes and balance sheet runoff amidst above-trend growth and a rebound in some international markets.

“As long as yields are rising for the right reasons, including better growth, we believe that equities should be able to tolerate the move,” a JPMorgan note said. 

“The rise in real rates should not be hurting equity markets, or economic activity, at least until they move into positive territory, or even as long as real rates are below the real potential growth.”

In support of JPMorgan’s comments on real rates and growth, Sanford Bernstein outlines a bull case stating: “[H]istorically, when real yields normalized back to zero from negative levels, equities have had positive returns.”

As a bonus, per Ryan Detrick of LPL Financial, “Yes, the Fed will probably hike rates for the first time in a new cycle some time during the first half of 2022. Remember though, looking at the past 8 first hikes, stocks were higher a year later every single time.”

Graphic: S&P 500 performance post-hiking, via LPL Financial.

In opposition to the bull-narrative, Jim Bianco of Bianco Research puts it well: “So, if the bond market is having epic convulsions in the wake Fed printer getting turned off, do not take solace that the stock market ‘doesn’t get it.’ 

“This is how financial markets turn, the stock market often stays too long and turns last.”

Positioning: To keep things fresh, recall that in buying a put, for instance, customers indirectly take liquidity as the counterparties hedge short put exposure by selling underlying.

Higher implied volatility marks up options delta (exposure to direction) and this leads to more selling, as hedging pressures exacerbate weakness. Higher volatility, higher delta, more selling.

As implied volatility compresses, options delta (exposure to direction) is marked down. This leads to buying by the counterparty.

Per SpotGamma’s (unreleased) Hedging Impact of Real-Time Options indicator, over the past sessions, positive delta trade on the part of counterparties, as a result of customer put selling and call buying, has supported the near-vertical price rise from Monday’s lows.

Graphic: SpotGamma’s (beta) Hedging Impact of Real-Time Options (HIRO) indicator.

As visualized, above, positive delta trade tapered off into the close, Tuesday, while S&P 500 prices continued higher. Interesting, right? Part of that rally has to do with volatility compression.

The VIX term structure remains upward sloping and volatility (via the INDEX: VIX) has fallen. As stated, above, compression marks options delta down and leads to buying by the counterparty.

Technical: As of 6:30 AM ET, Wednesday’s regular session (9:30 AM – 4:00 PM ET), in the S&P 500, will likely open in the middle part of a positively skewed overnight inventory, just outside of prior-range and -value, suggesting a potential for immediate directional opportunity.

Gap Scenarios: Gaps ought to fill quickly. Should they not, that’s a signal of strength; do not fade. Leaving value behind on a gap-fill or failing to fill a gap (i.e., remaining outside of the prior session’s range) is a go-with indicator.
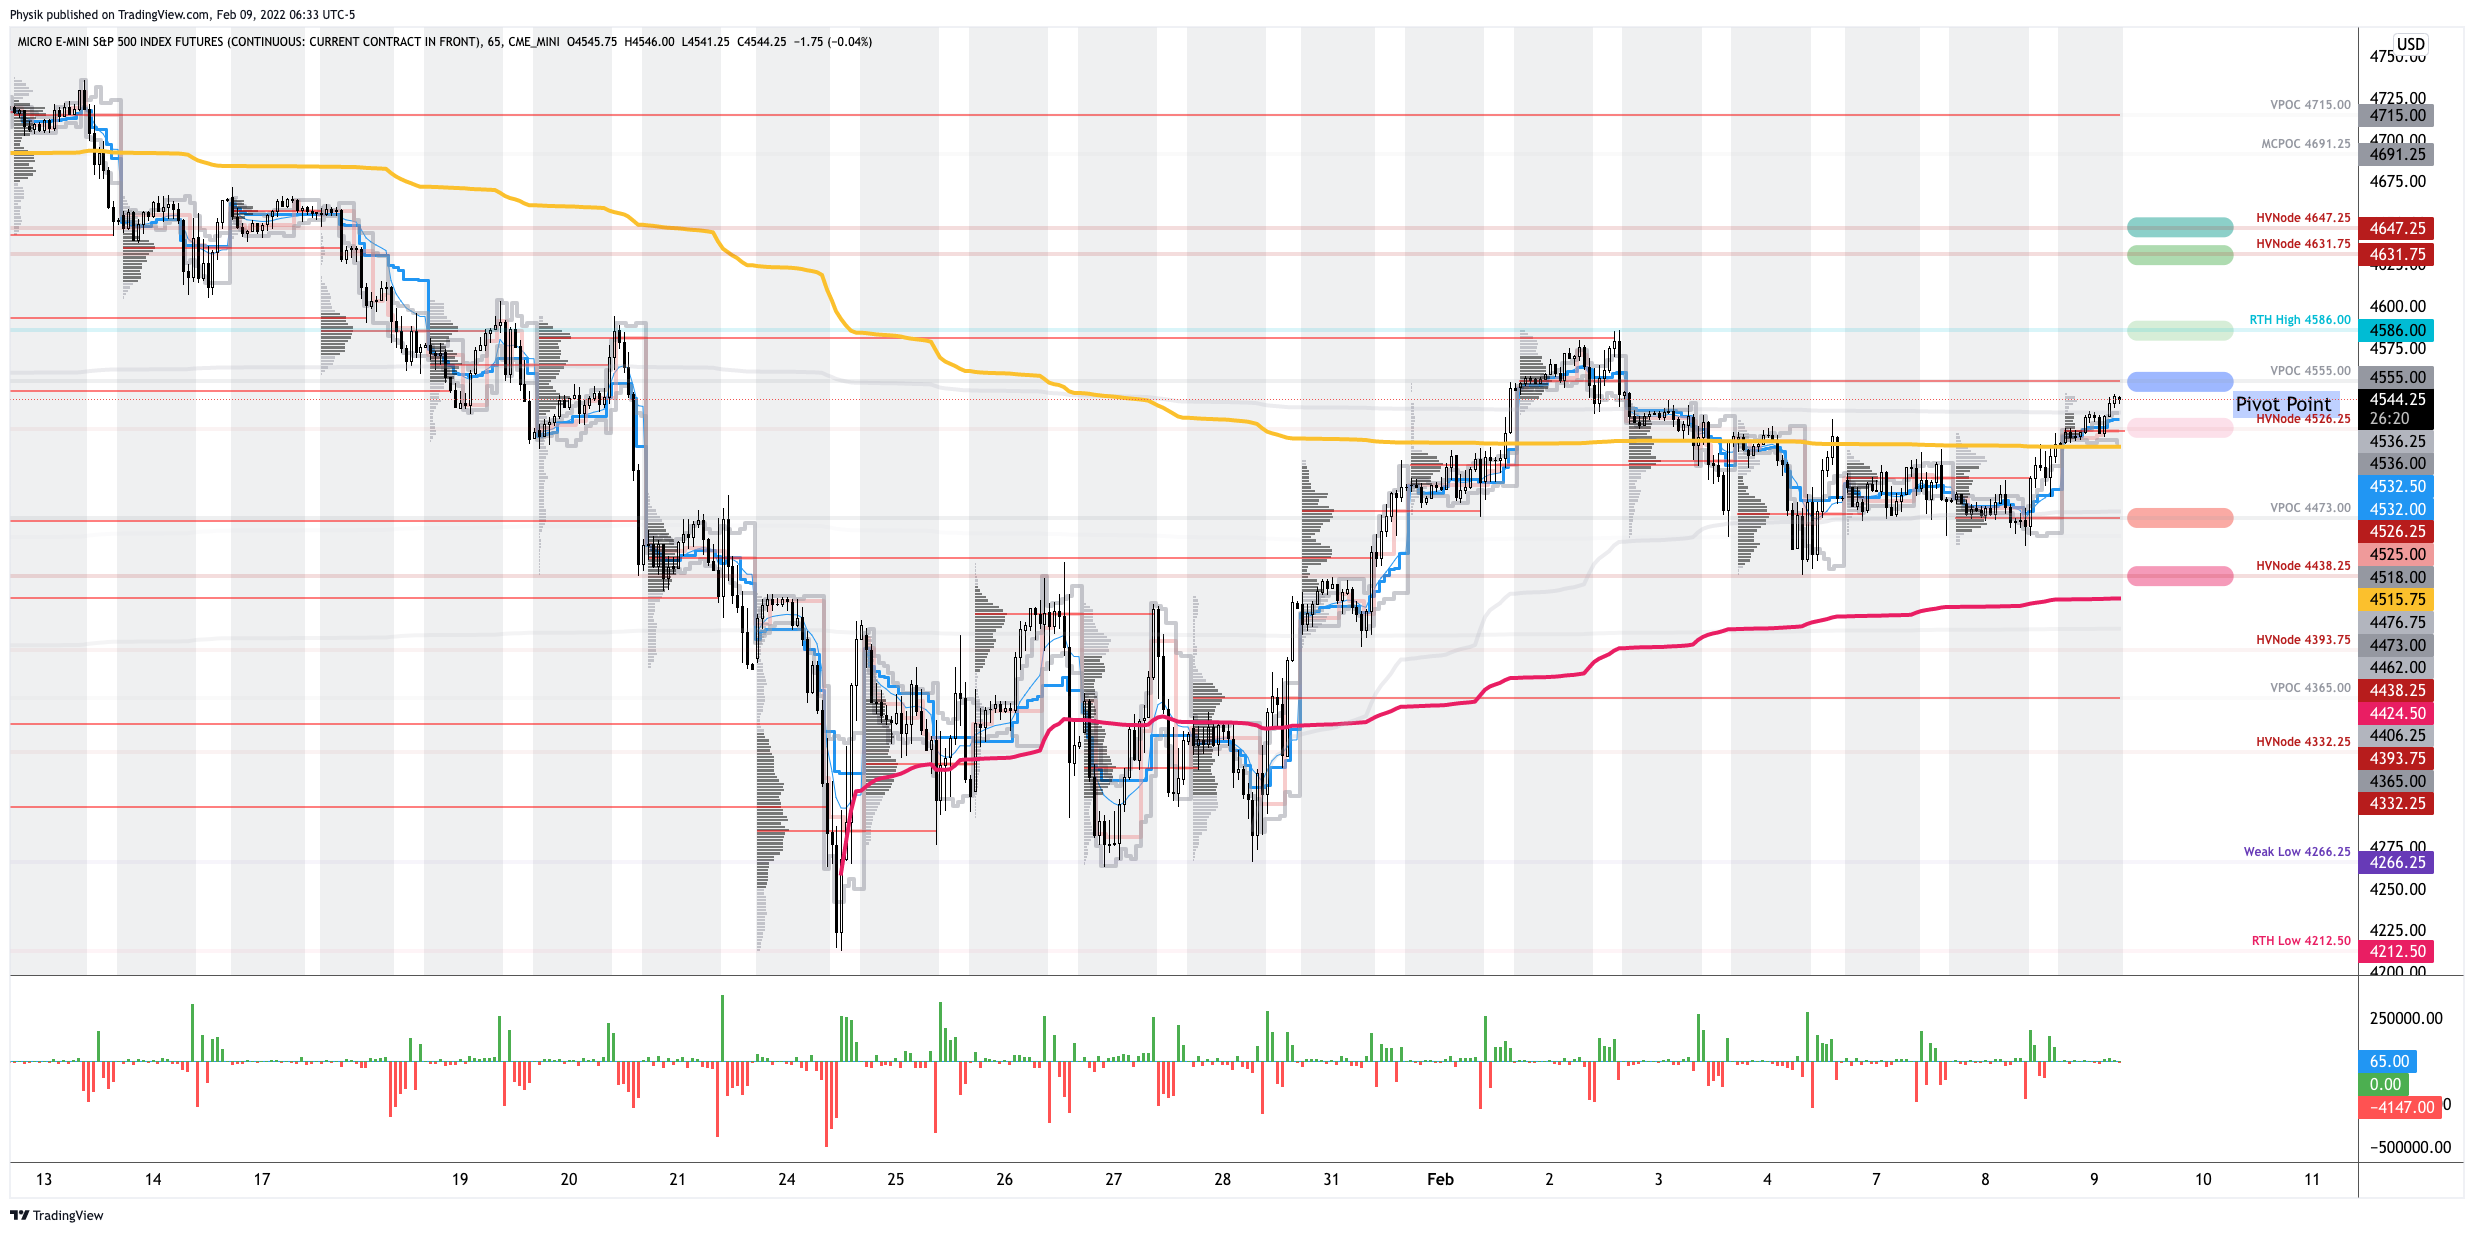
Auctioning and spending at least 1-hour of trade back in the prior range suggests a lack of conviction; in such a case, do not follow the direction of the most recent initiative activity.

In the best case, the S&P 500 trades higher; activity above the $4,717.25 low volume area (LVNode) puts in play the $4,732.50 high volume area (HVNode). Initiative trade beyond the HVNode could reach as high as the $4,756.00 LVNode and $4,779.00 untested point of control (VPOC), or higher.
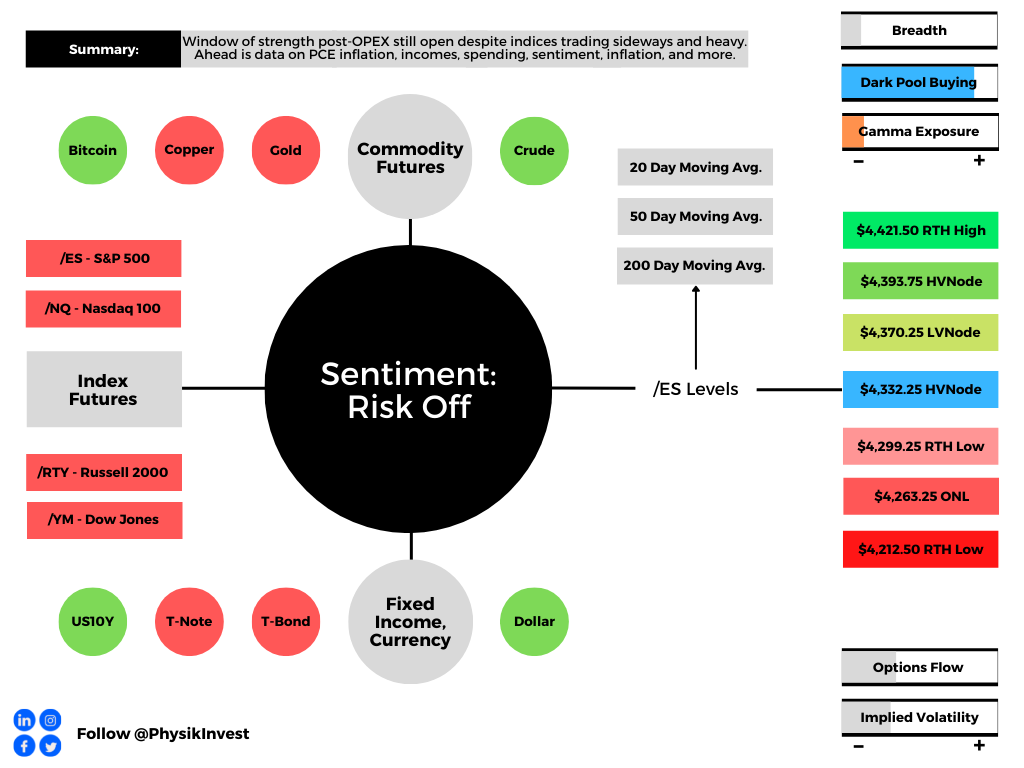
In the worst case, the S&P 500 trades lower; activity below the $4,717.25 LVNode puts in play the $4,691.25 micro composite point of control (MCPOC). Initiative trade beyond the MCPOC could reach as low as the $4,674.25 and $4,647.25 HVNode, or lower.

Click here to load today’s key levels into the web-based TradingView charting platform. Note that all levels are derived using the 65-minute timeframe. New links are produced, daily.
Graphic: 65-minute profile chart of the Micro E-mini S&P 500 Futures.

What People Are Saying

Definitions

Volume Areas: A structurally sound market will build on areas of high volume (HVNodes). Should the market trend for long periods of time, it will lack sound structure, identified as low volume areas (LVNodes). LVNodes denote directional conviction and ought to offer support on any test. 

If participants were to auction and find acceptance into areas of prior low volume (LVNodes), then future discovery ought to be volatile and quick as participants look to HVNodes for favorable entry or exit.

POCs: POCs are valuable as they denote areas where two-sided trade was most prevalent in a prior day session. Participants will respond to future tests of value as they offer favorable entry and exit.

MCPOCs: POCs are valuable as they denote areas where two-sided trade was most prevalent over numerous day sessions. Participants will respond to future tests of value as they offer favorable entry and exit.

About

After years of self-education, strategy development, mentorship, and trial-and-error, Renato Leonard Capelj began trading full-time and founded Physik Invest to detail his methods, research, and performance in the markets.

Capelj is also a Benzinga finance and technology reporter interviewing the likes of Shark Tank’s Kevin O’Leary, JC2 Ventures’ John Chambers, FTX’s Sam Bankman-Fried, and ARK Invest’s Catherine Wood, as well as a SpotGamma contributor developing insights around impactful options market dynamics.

Disclaimer

Physik Invest does not carry the right to provide advice.

In no way should the materials herein be construed as advice. Derivatives carry a substantial risk of loss. All content is for informational purposes only.