Editor’s Note: The Daily Brief is a free glimpse into the prevailing fundamental and technical drivers of U.S. equity market products. Join the 200+ that read this report daily, below!
What Happened
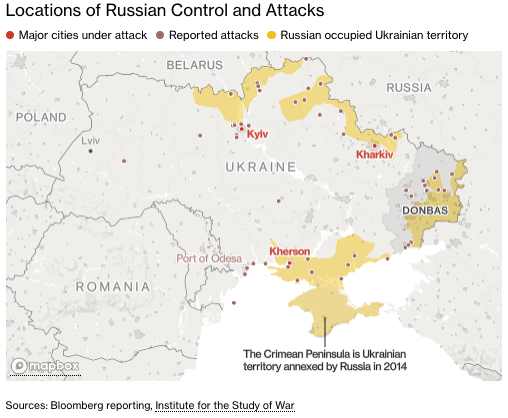
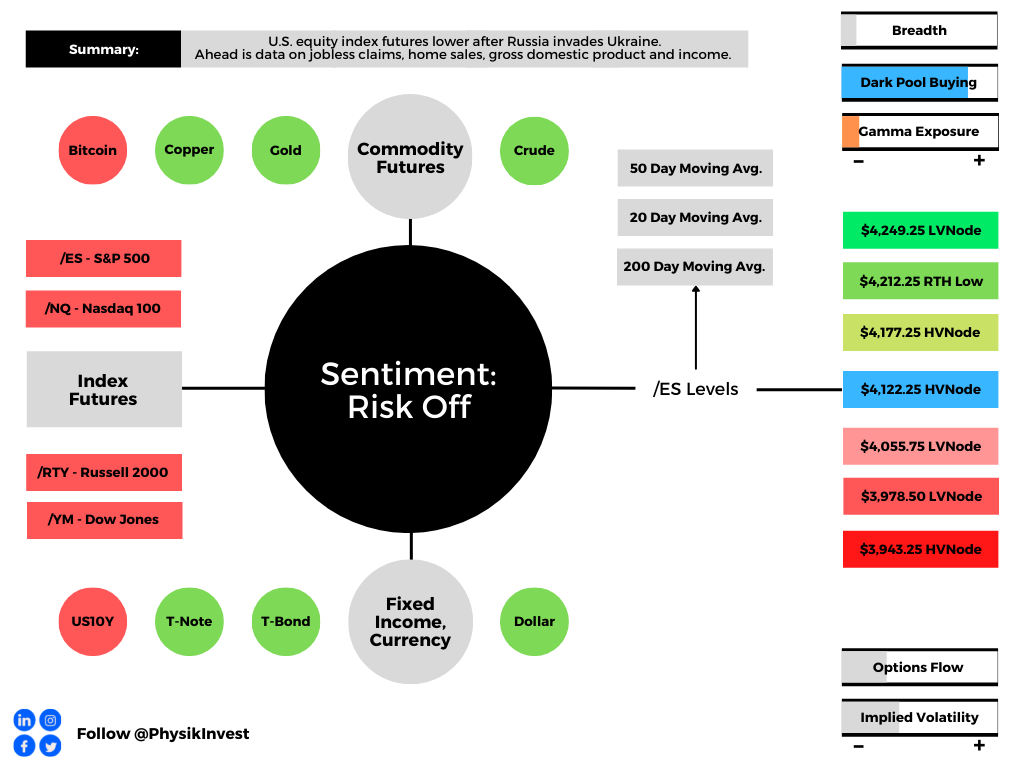
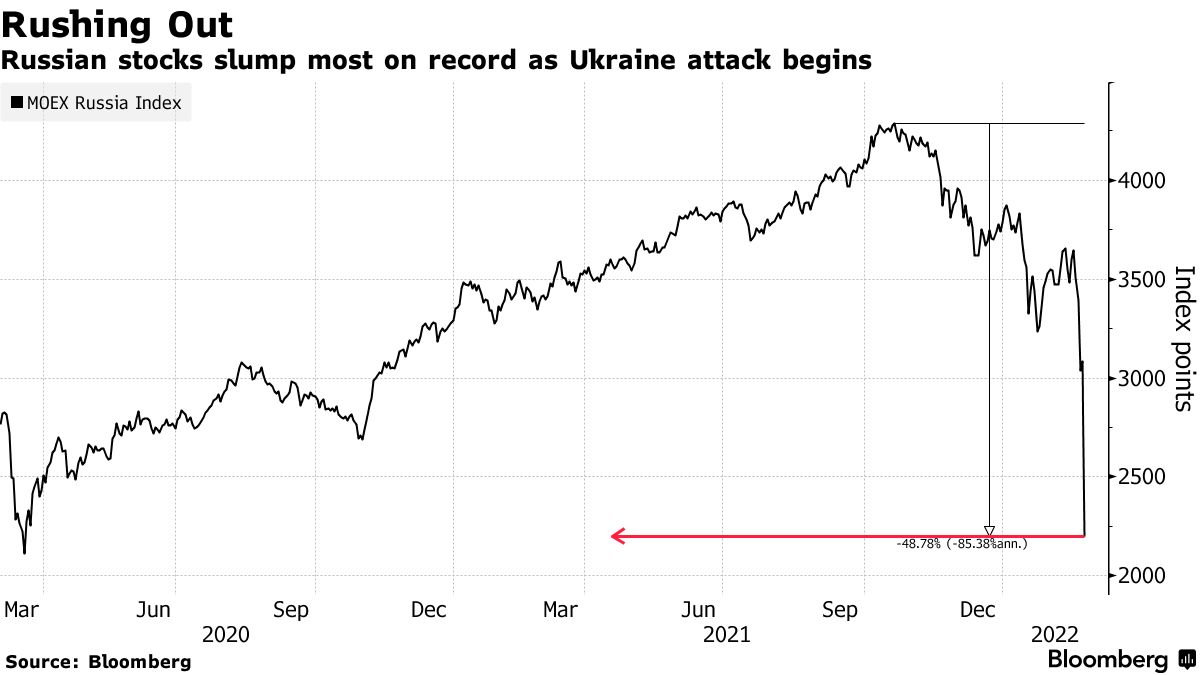
Overnight, equity index futures auctioned lower practically negating the prior day’s advance. Per the news, Ukraine and Russia failed in their efforts to end the war.
Adding, similar to days prior, areas where there are key technical nuances served as supports and resistances. One may construe this as short-term traders’ dominance in the smaller time horizons while the other time frames are positioning for expansive moves (yet to happen).
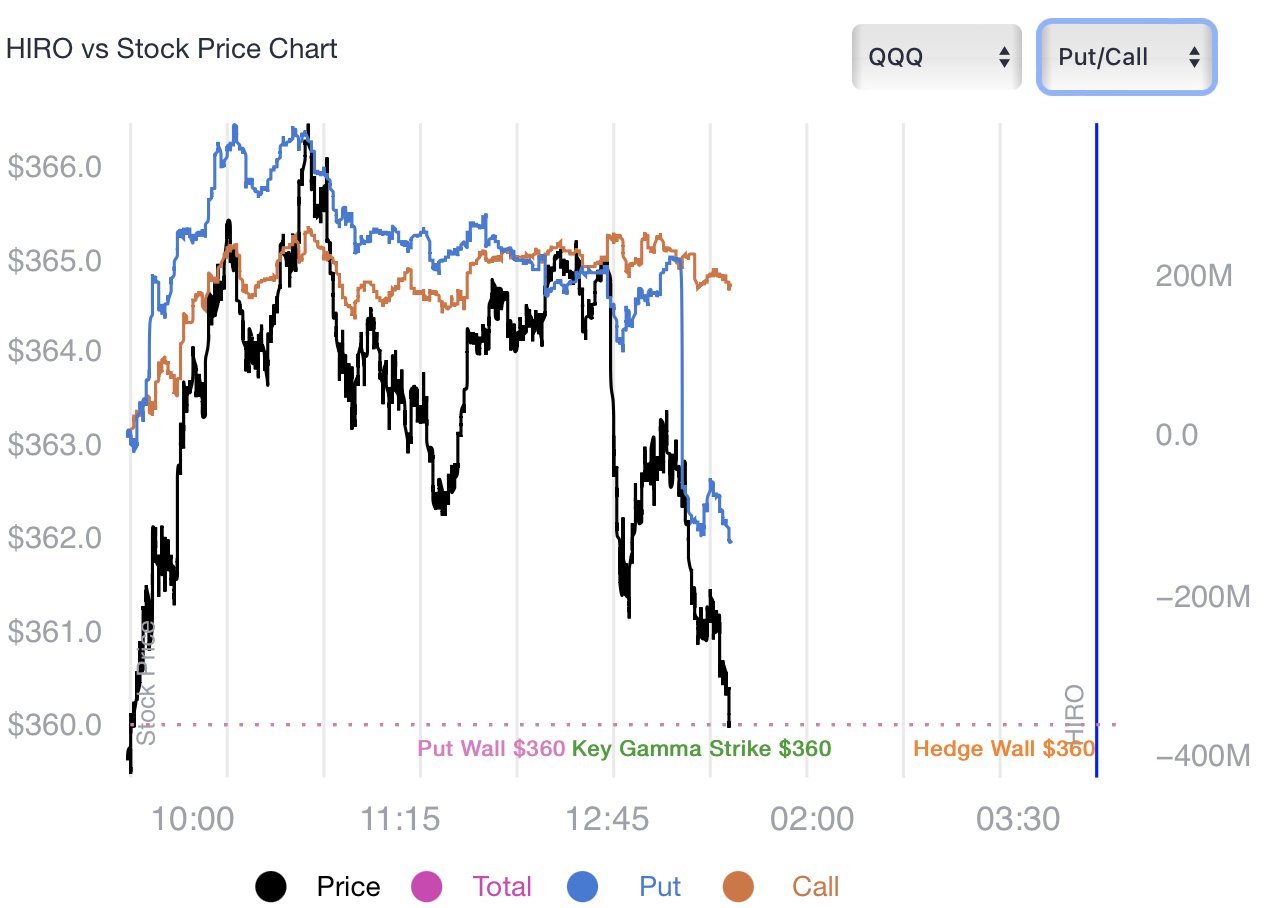
To note, key metrics under the hood (SpotGamma’s HIRO, among other things) yesterday, further validated the status quo and short-covering.
Moreover, ahead is data on jobless claims and the consumer price index (8:30 AM ET). Later, participants get data on real domestic nonfinancial debt and wealth (1:00 PM ET), as well as the budget deficit (2:00 PM ET).

What To Expect
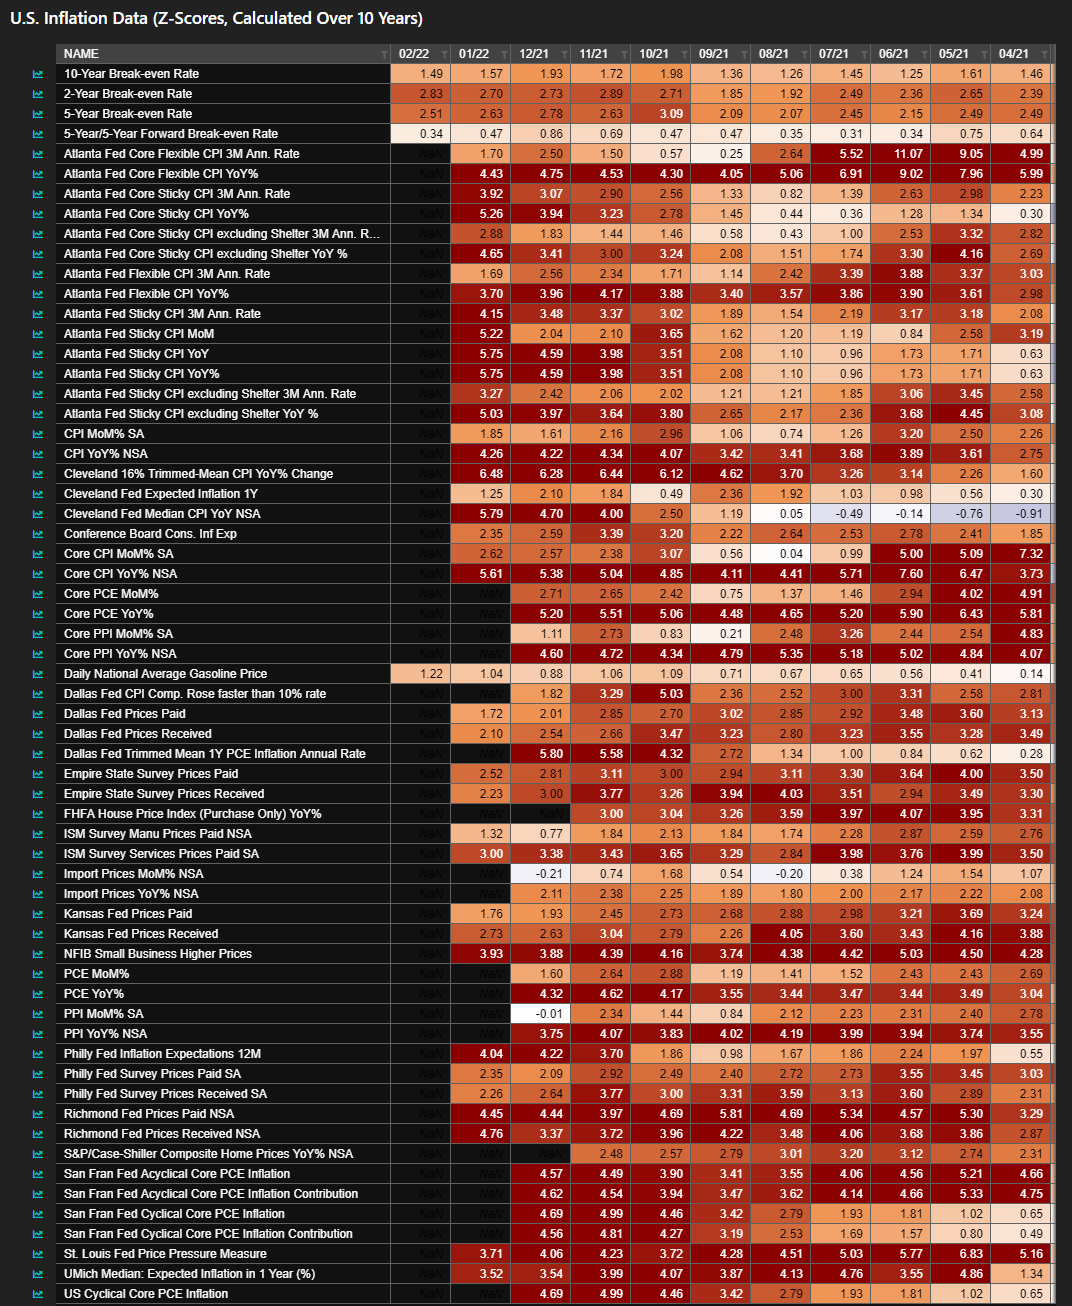
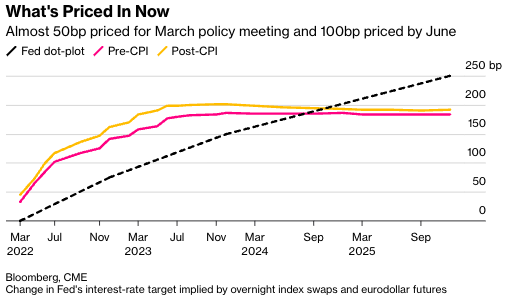
Fundamental: The consumer price index (CPI) is to likely accelerate to 7.8% from a year ago.
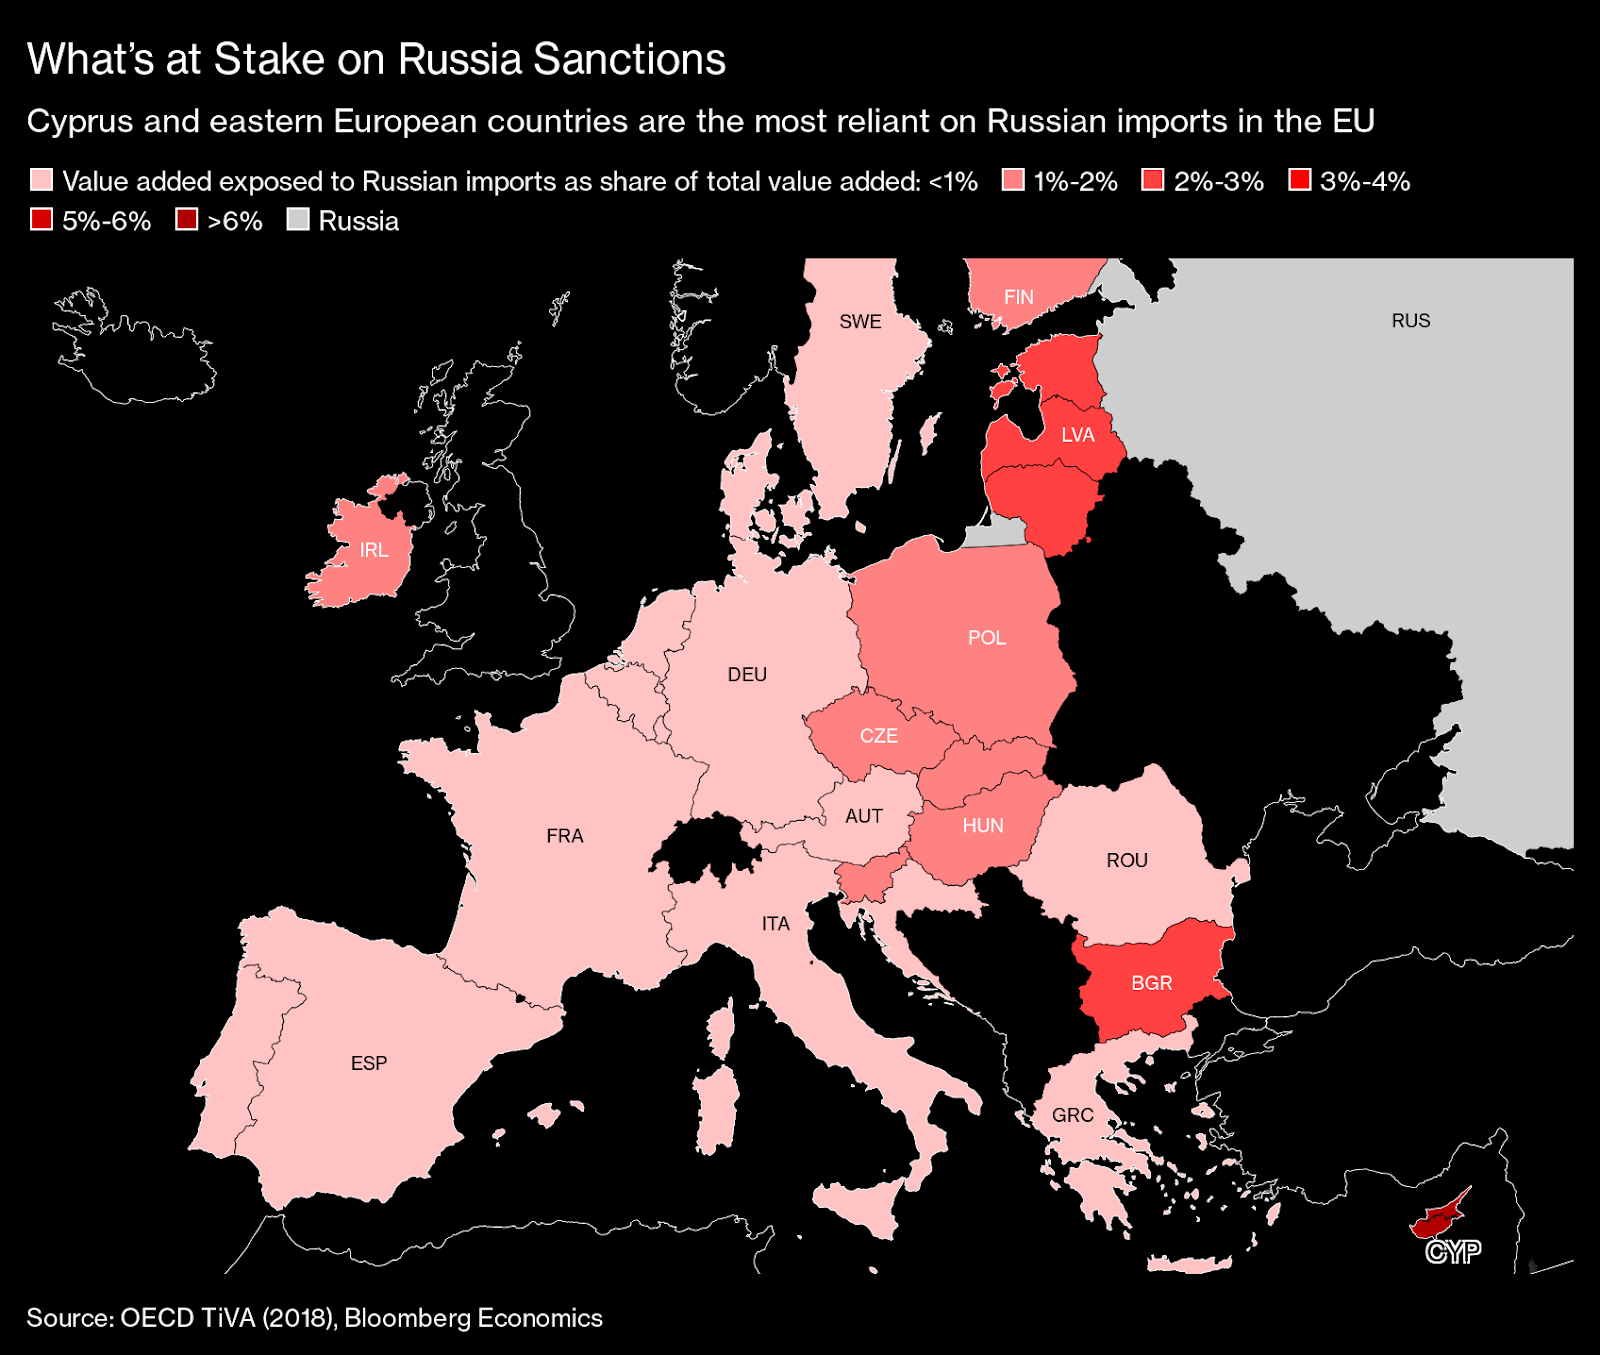
This forecast varies widely, however, based on economic analysis with respect to the implications of Russia’s invasion of Ukraine and the sanction that resulted after.
“There’s going to be a lot of noise in the next six months that’s going to be extremely difficult to disentangle,” said Omair Sharif of Inflation Insights LLC.
“If you thought it was difficult to figure out what used car prices were doing and whether that was transitory, multiply that by a thousand.”
In a mention on energy market volatility, while today’s economy is less dependent on oil (i.e., less likely to kill the expansion), the action in that market (and the responses it may solicit from policymakers, later) is noteworthy.
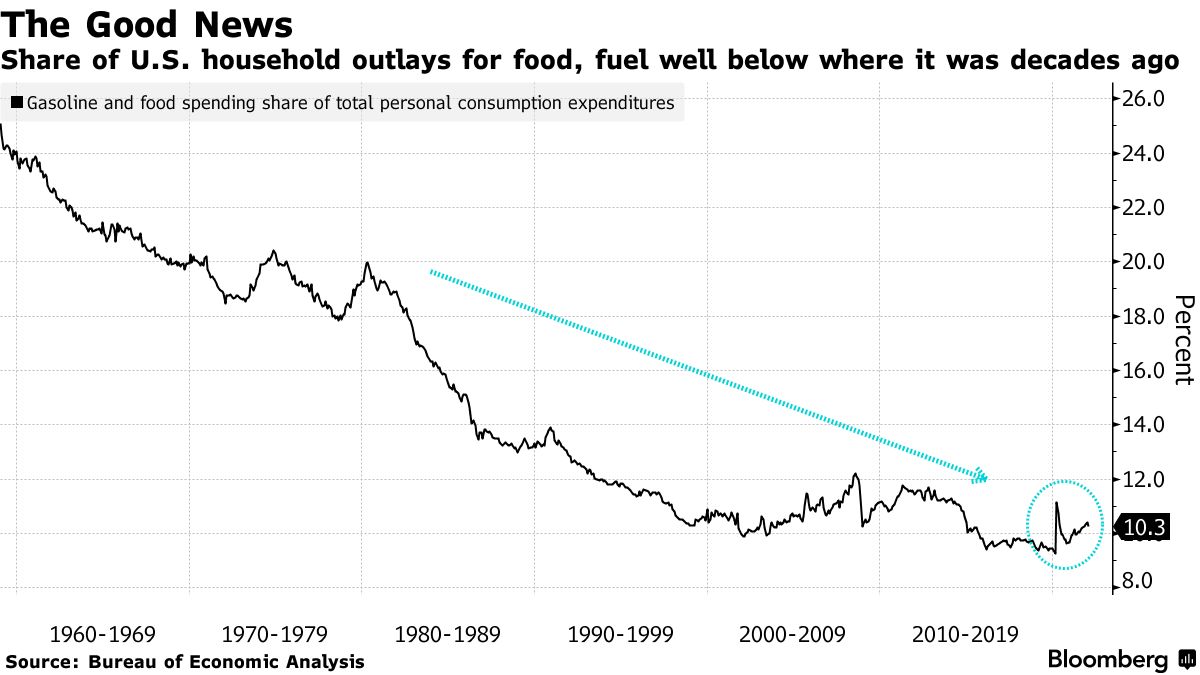
Despite a deterioration in the relationship between prices of crude and inflation, oil is “a major input in the economy – it is used in critical activities such as fueling transportation and heating homes – and if input costs rise, so should the cost of end products,” Investopedia says well.
Further, according to Reuters’ John Kemp, fuel oil inventories fell last week to the lowest seasonal level in more than 15 years.
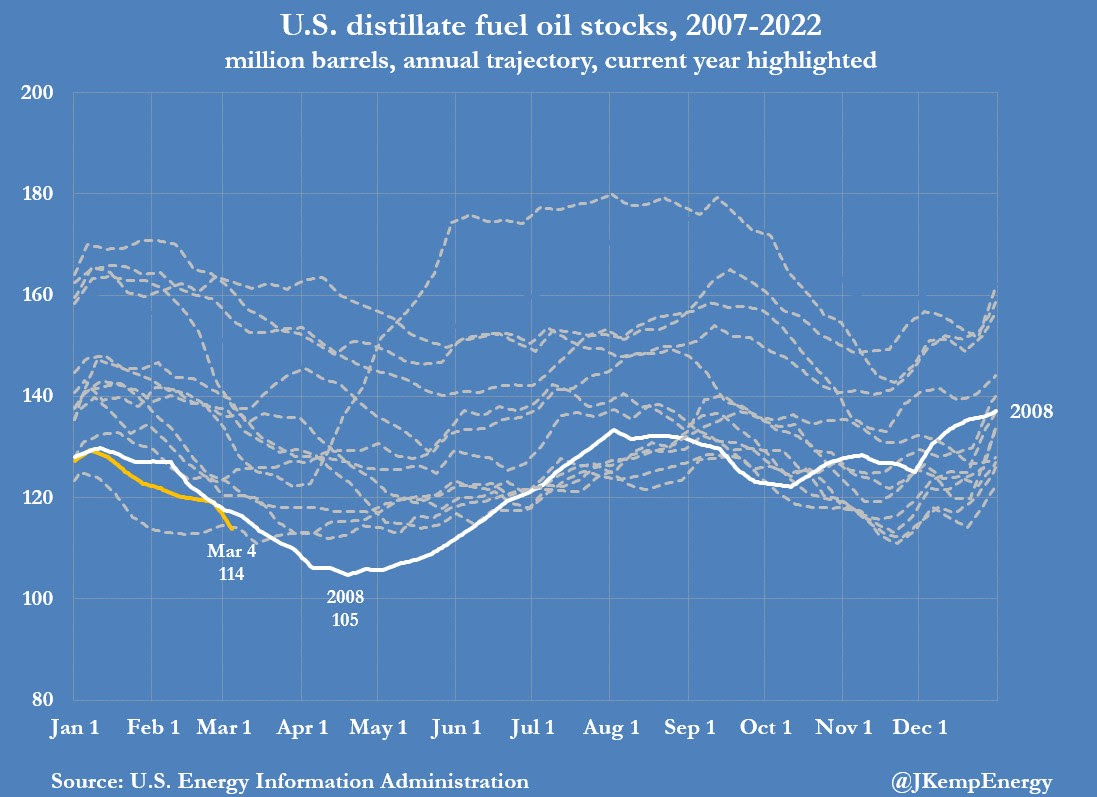
“Stocks are on track to hit an even lower seasonal level than 2008 when the distillate shortages helped propel crude oil prices to a record high at the middle of the year,” Kemp says.
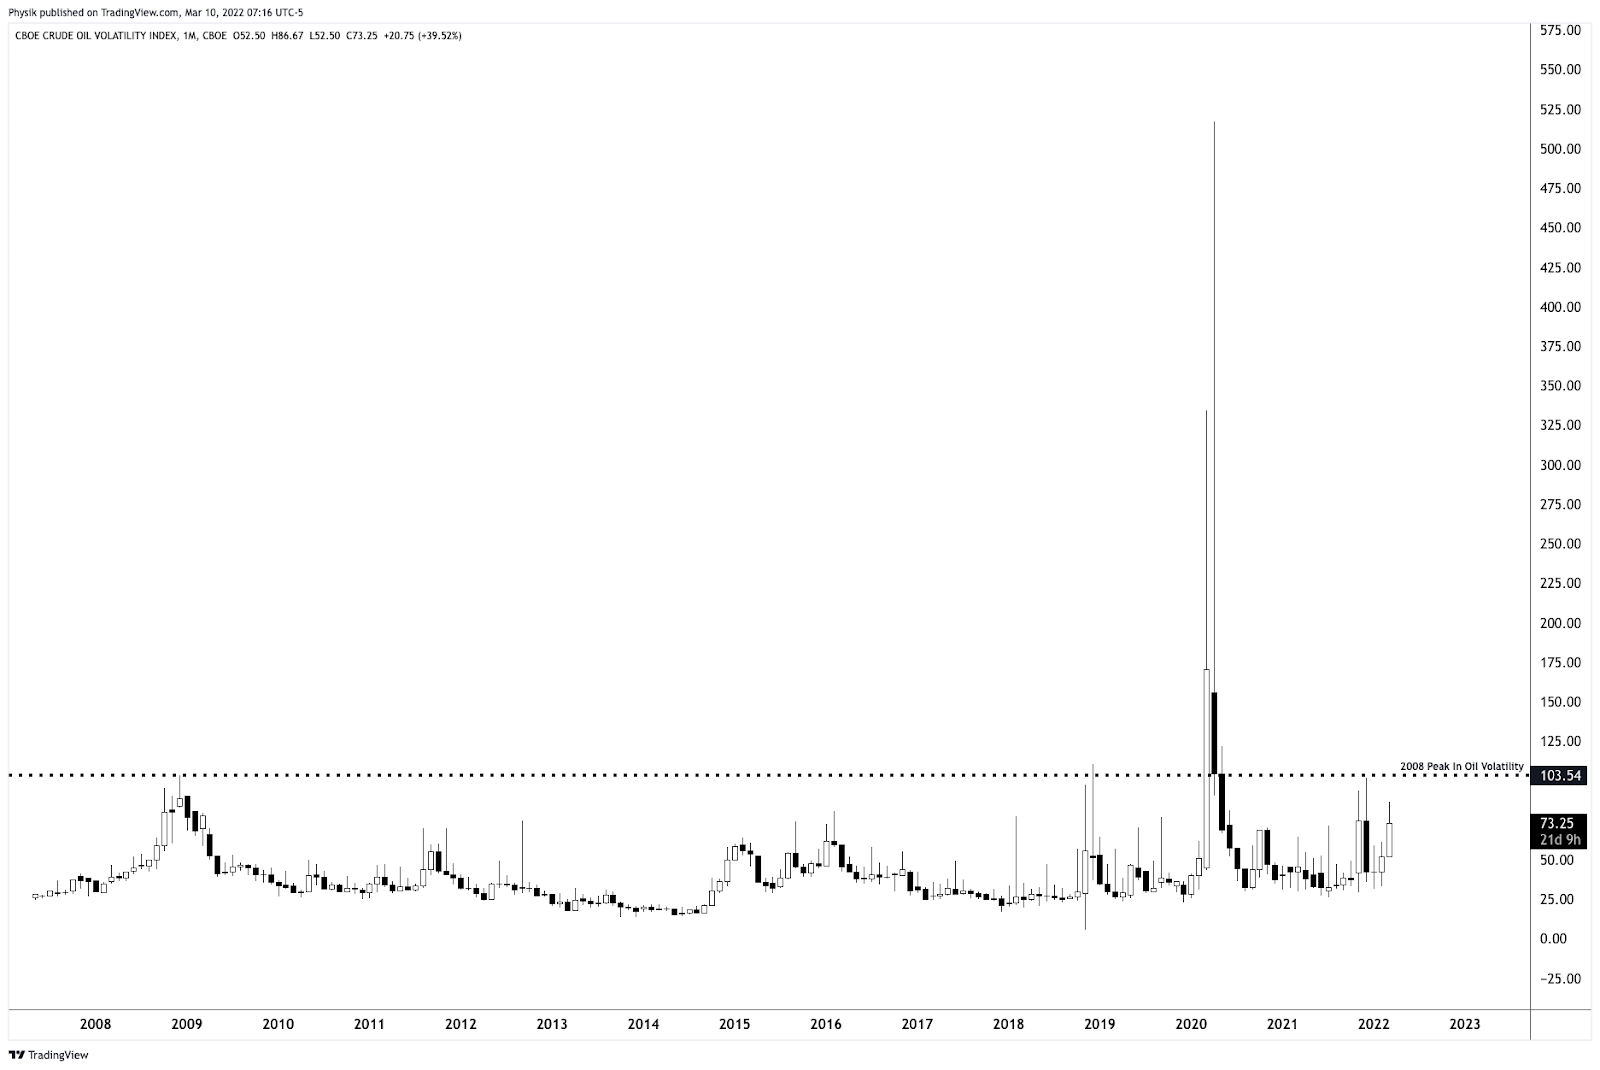
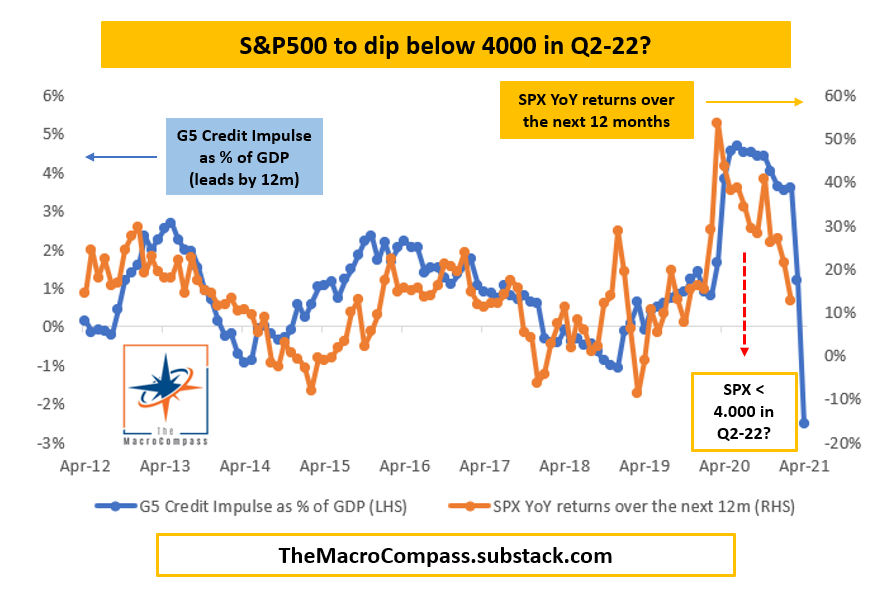
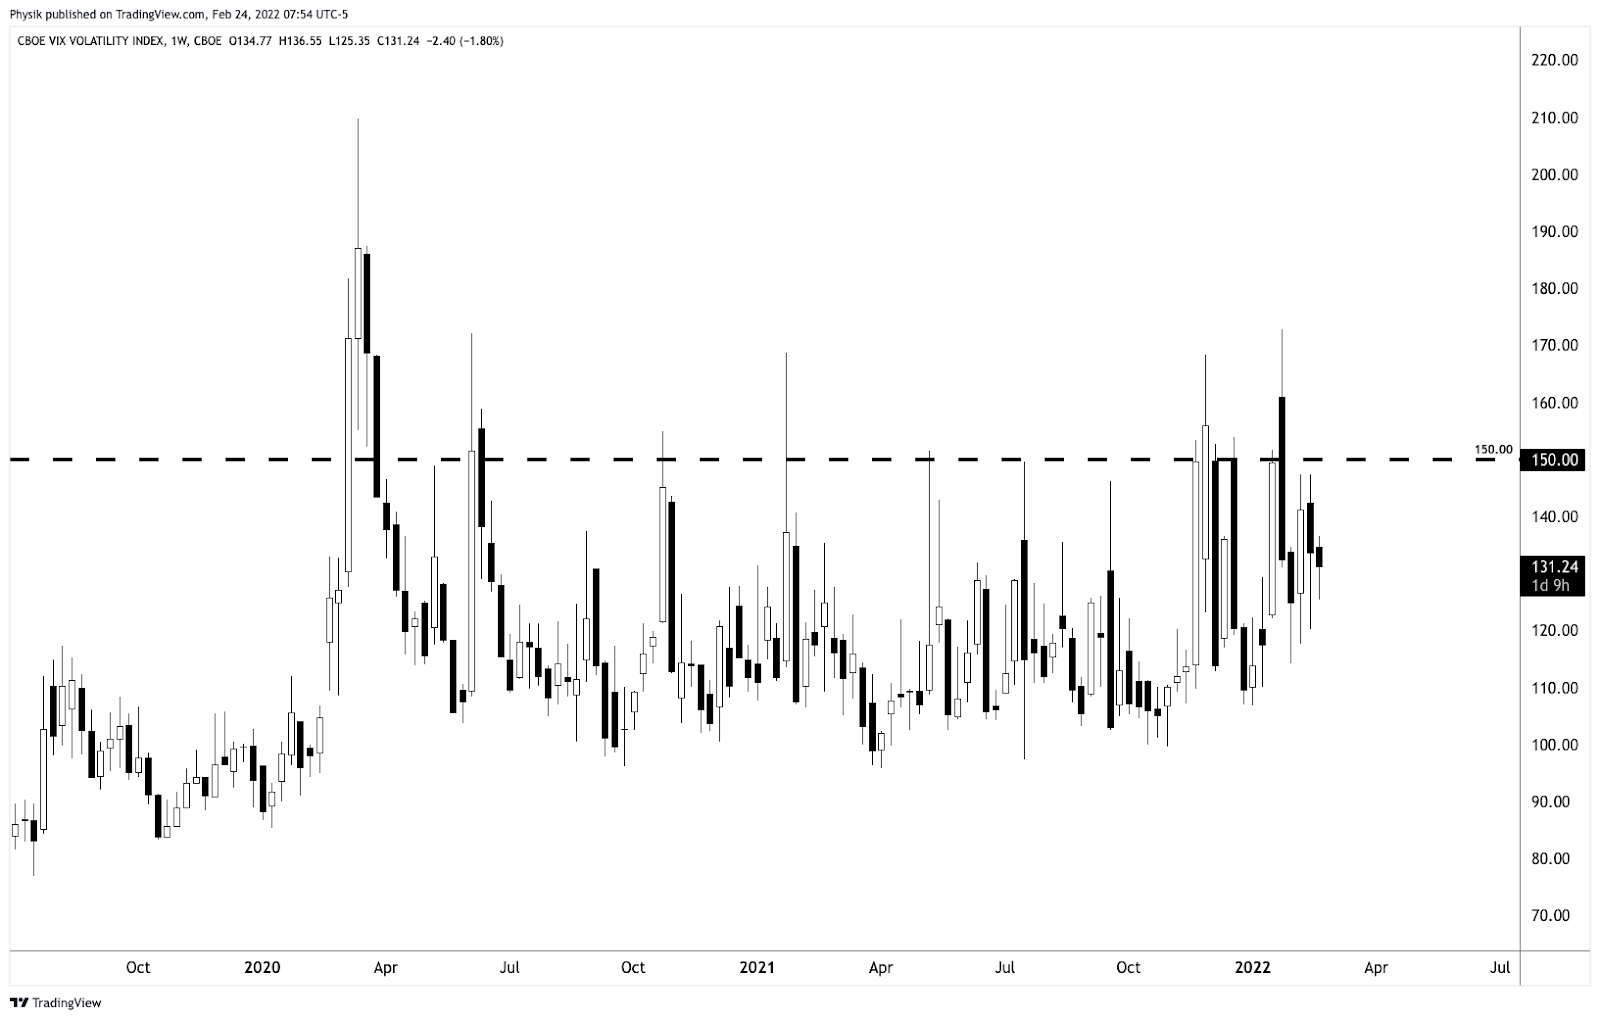
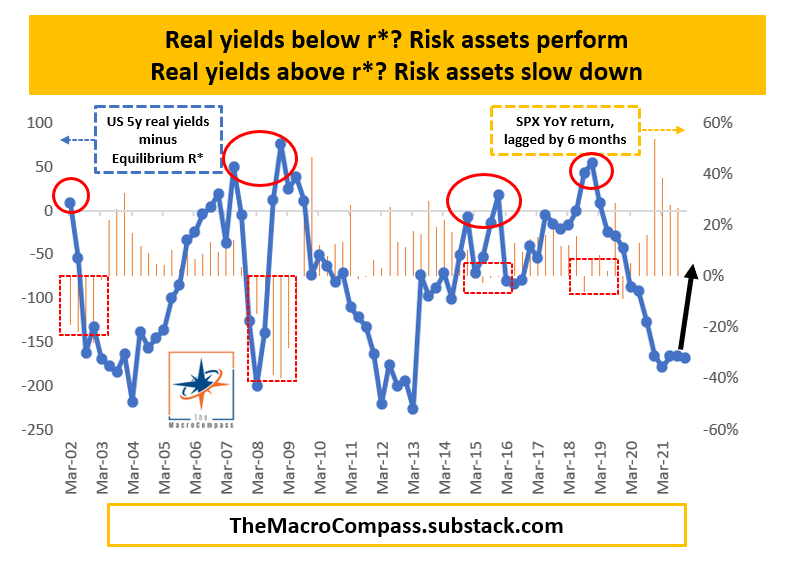
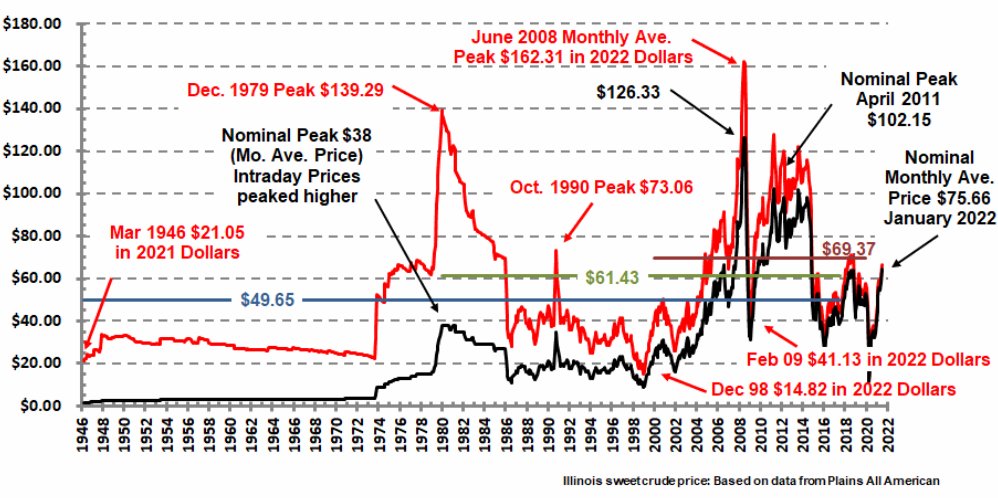
The highest oil prices ~$150/bbl had printed in 2008. As Alfonso Peccatiello of The Macro Compass hypothesizes, “Oil is denominated in fiat currency, and there has been A LOT of spendable money printing over the last 15 years. If you think the market gets as extreme as 2008, the equivalent oil price in today’s USD would be above $250/bbl.”
Given wage growth and the like, consumers likely start “to feel the heat way below $250.”
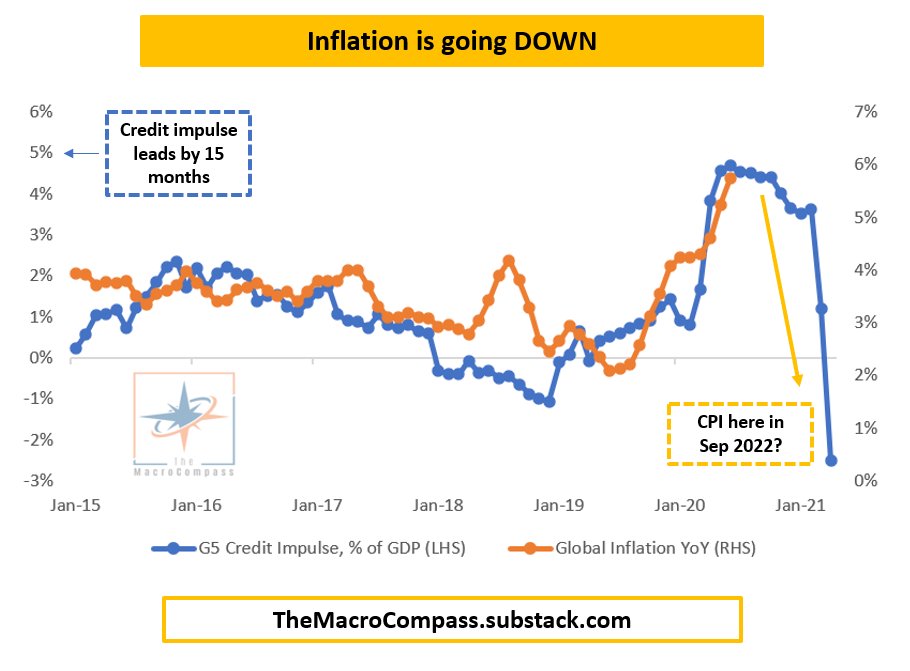
Why mention any of this? Fast moves higher in some of these commodity markets may impact end-consumer prices and behavior, quickly. In a bid to rein inflation – ”very high CPI in 2022, [and] still high in 2023 – central bankers will tighten.
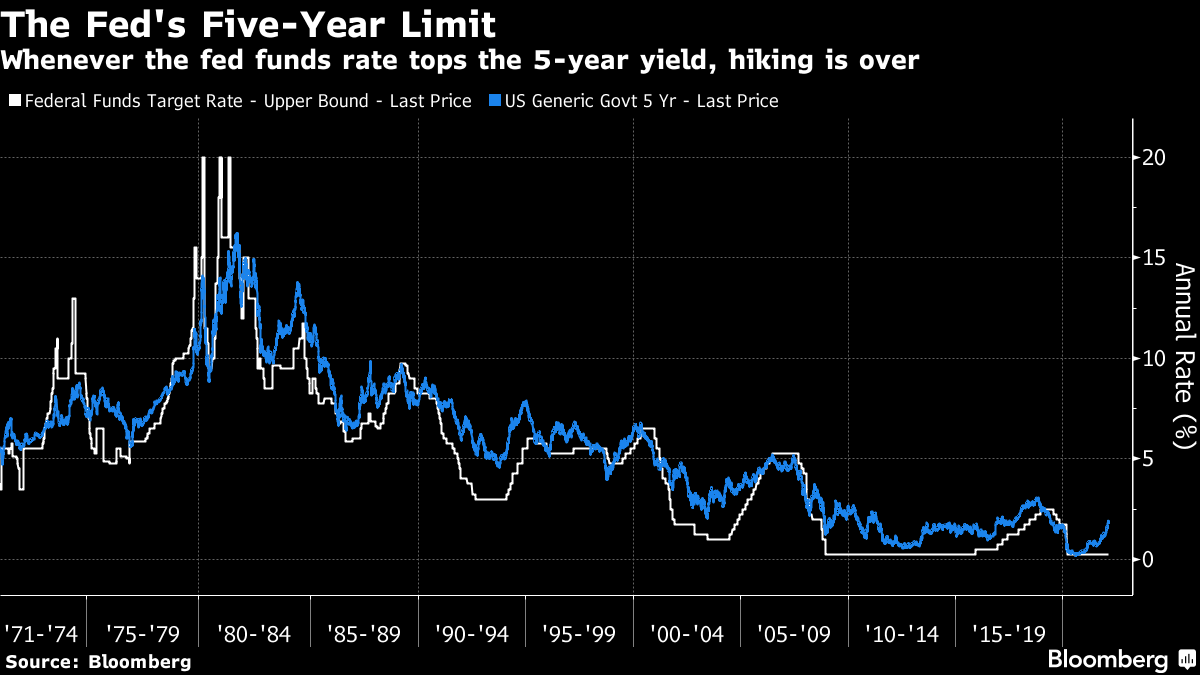
“The path of least resistance is for the Fed to hike rates from 0% to at least 2% relatively quickly,” Peccatiello explains in a recent post.
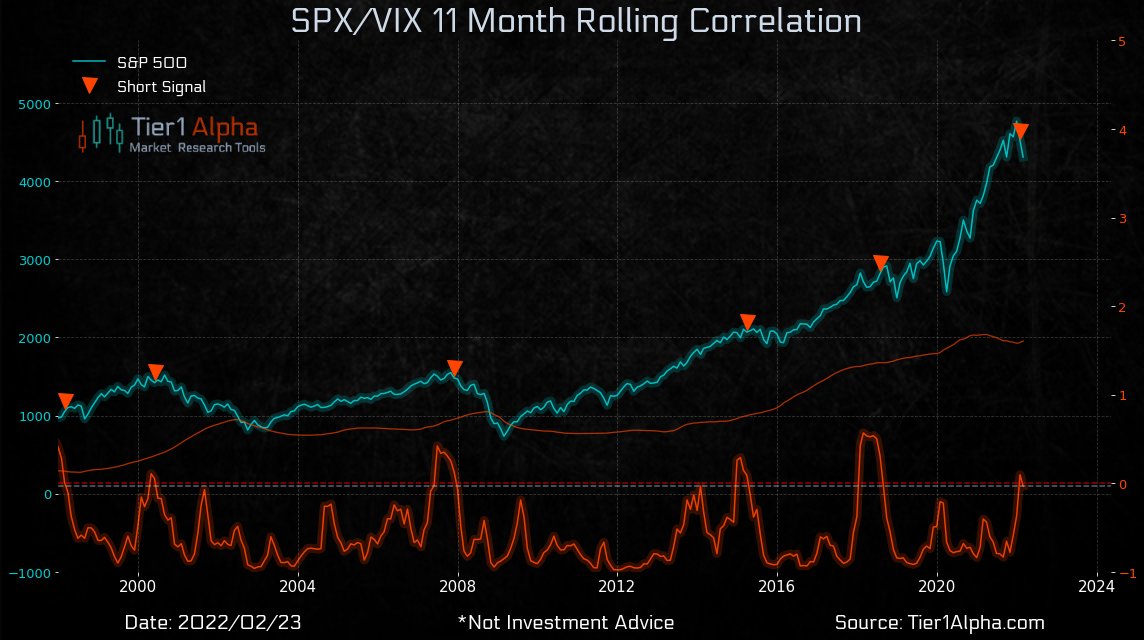
However, the “Last time companies were revising their forward earnings estimates down on a net basis while Central Banks were attempting to tighten monetary policy was mid-2018,” when the markets sold nearly 20%.
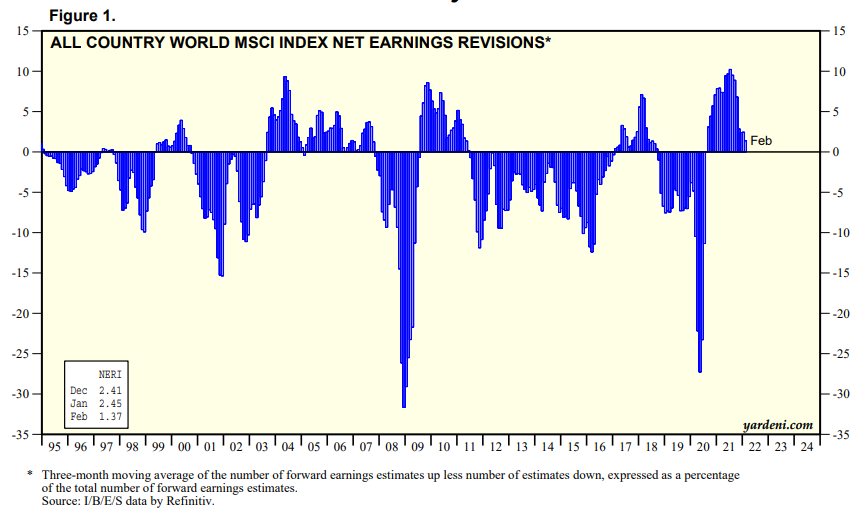
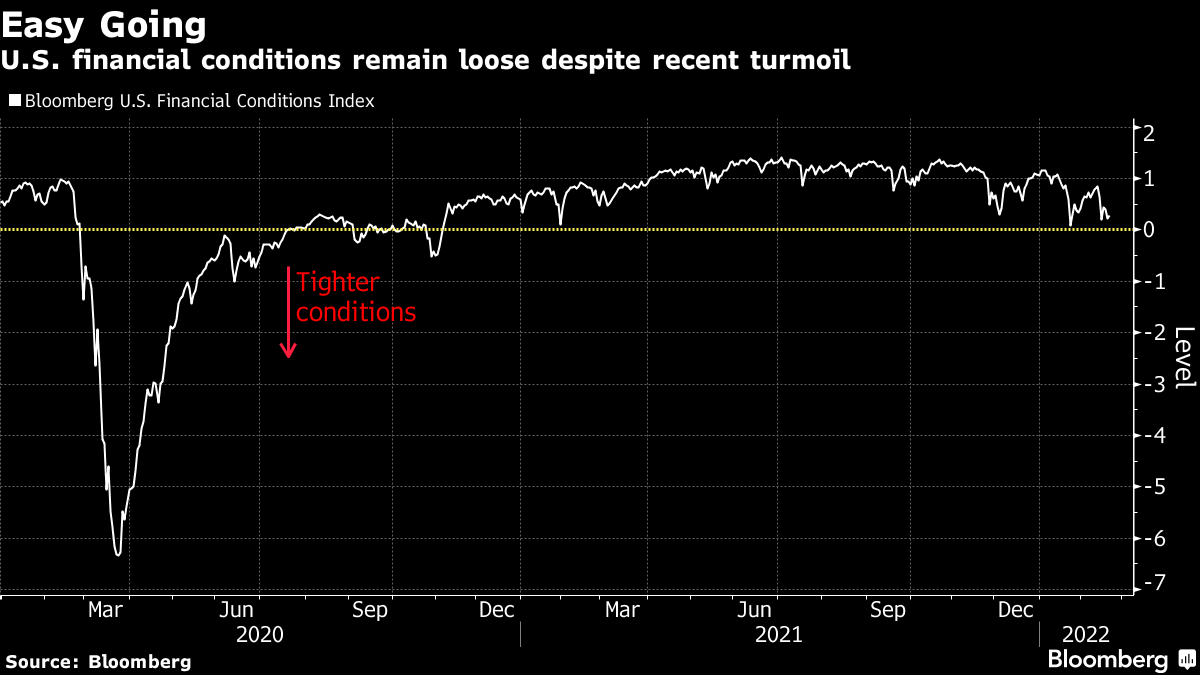
With financial conditions tightening, Peccatiello posits the Fed will be receptive to that.
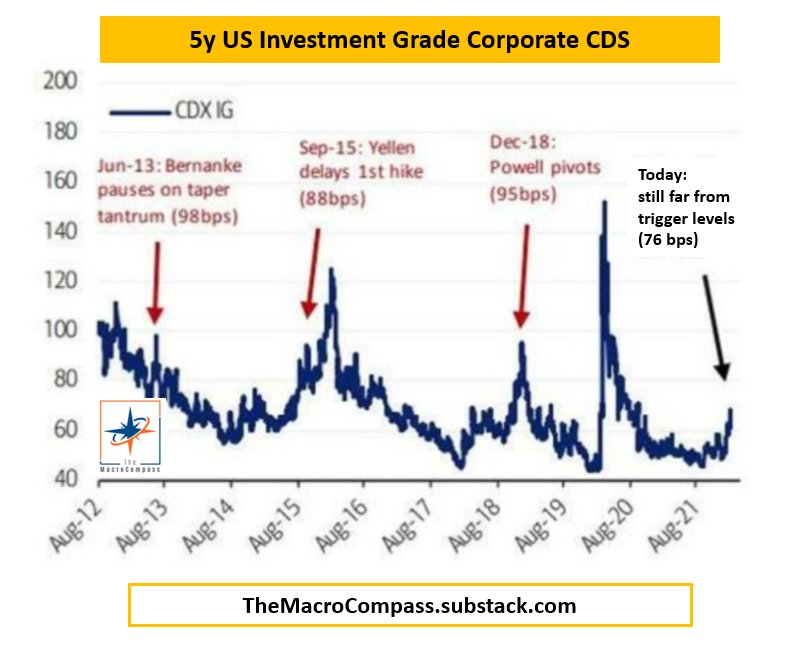
Basically, if selling were to continue, the Fed would reassess tightening. At such level of reassessment is the Fed Put, a dynamic we’ve discussed in the past.
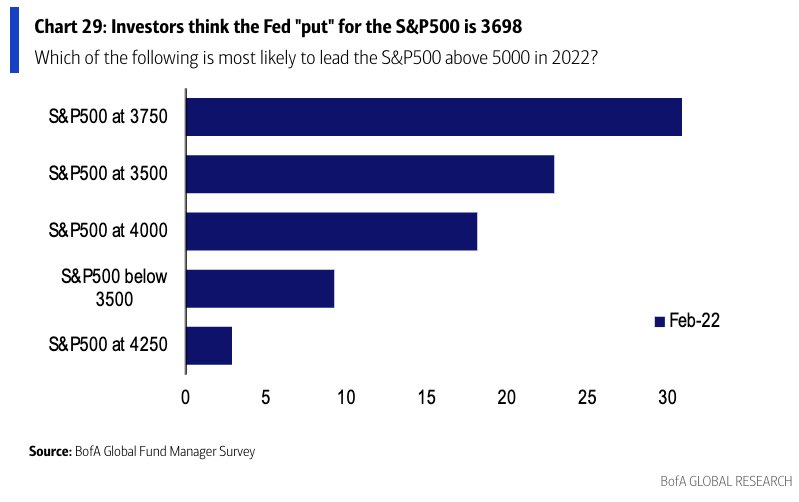
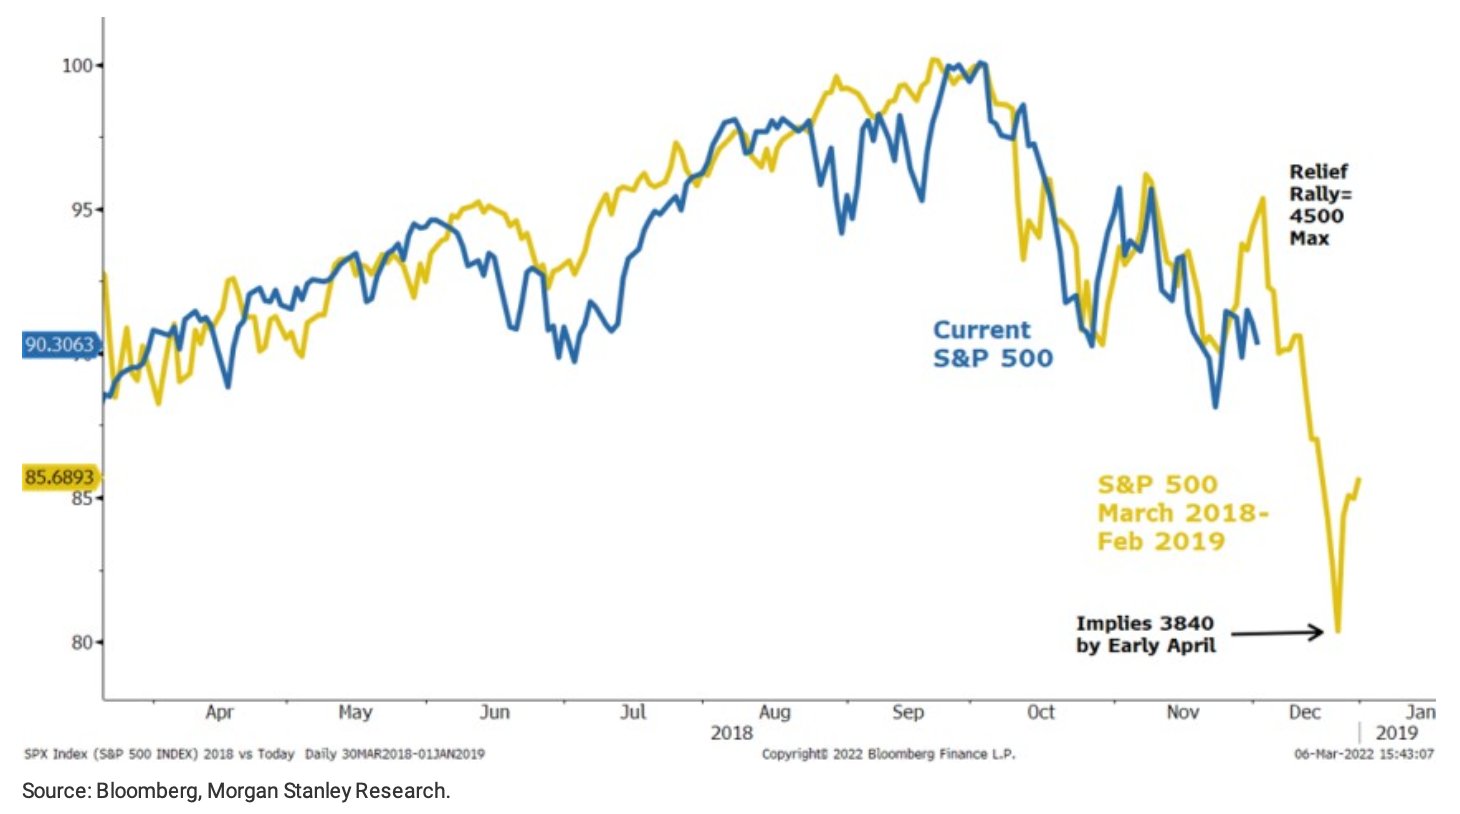
Chamath Palihapitiya recently posted about this, too. He said: “In 2018, the Fed was concerned about inflation. They were wrong and within a quarter or so, the risk shifted to recession. This chart shows how the equity markets reacted… seems eerily similar.”
“Value then faded and Growth ripped.”
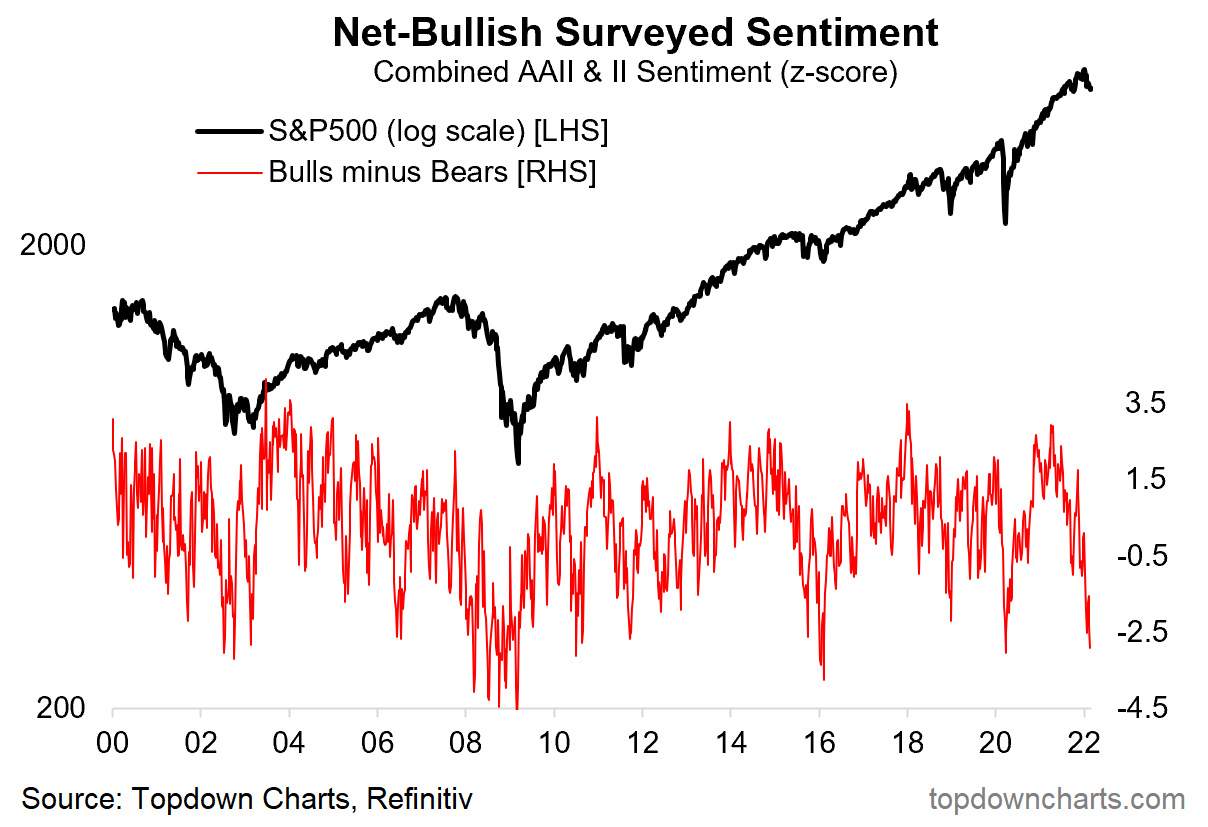
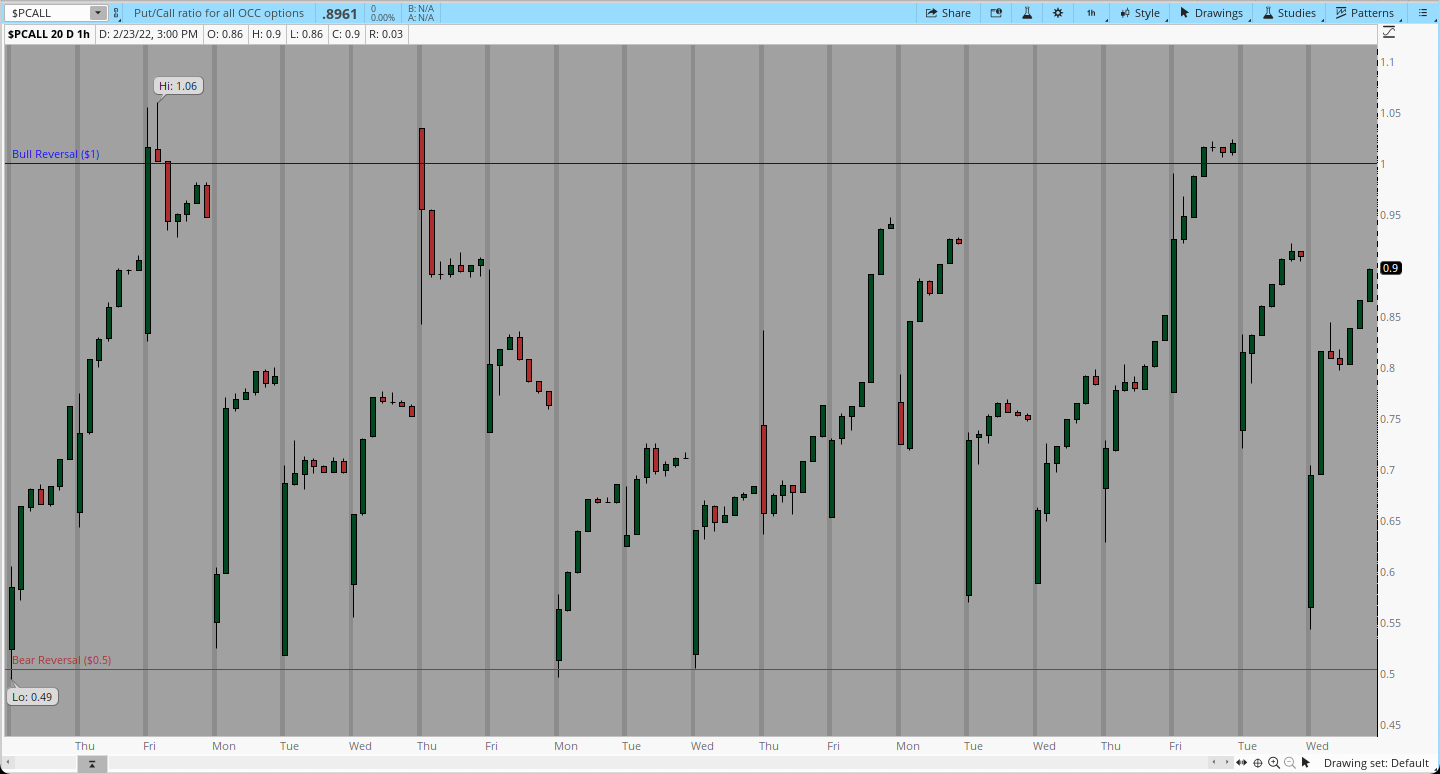
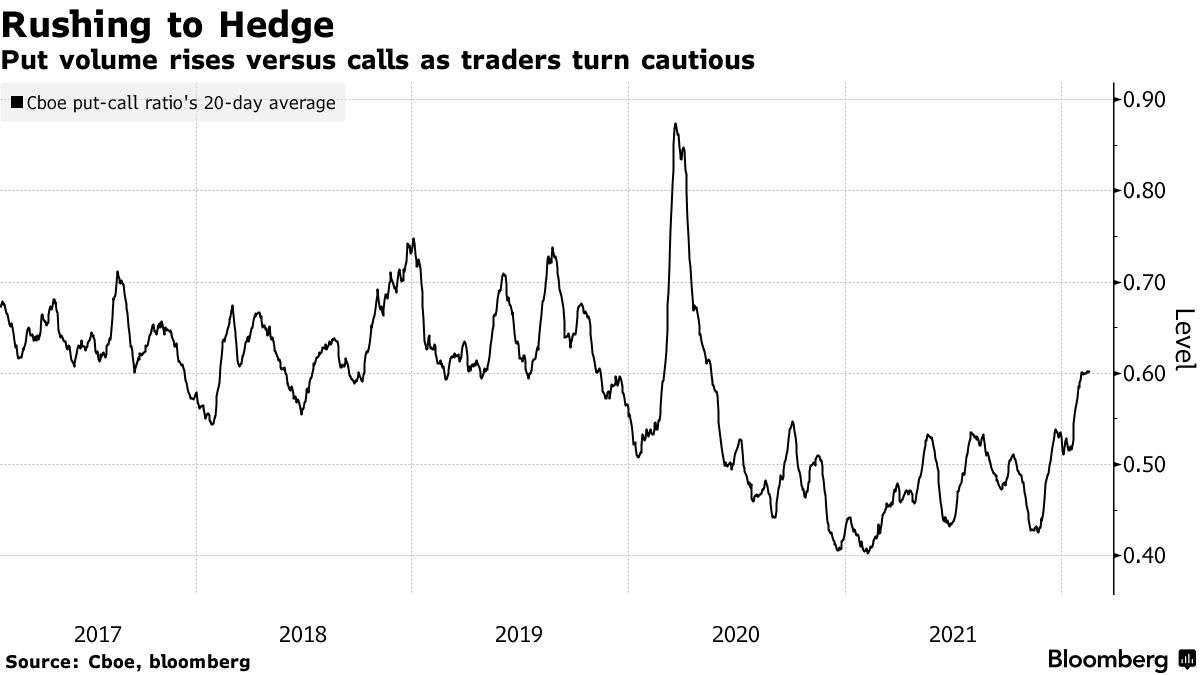
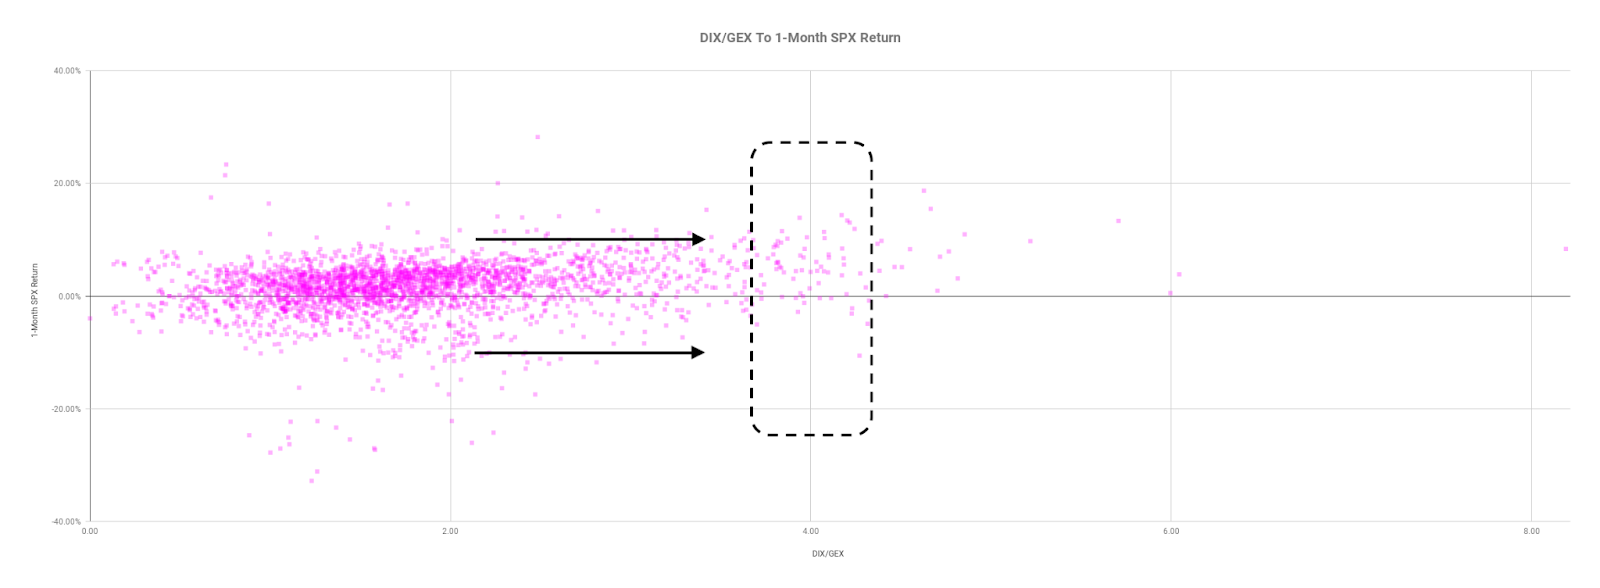
Positioning: Based on a comparison of present options positioning and buying metrics, the returns distribution is skewed positive, albeit less so than before.
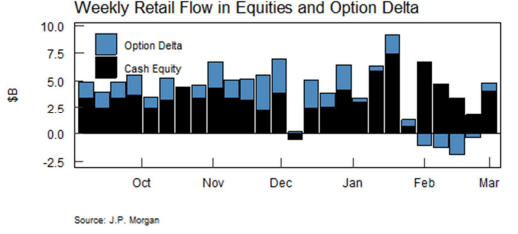
Obviously, the fundamental picture and the market’s responsiveness to news events – given the negative gamma environment – has us discounting these metrics. It’s noteworthy, nonetheless.
For instance, in the face of some positive developments abroad, fundamentally, markets diverged from what participants in the options complex were doing.
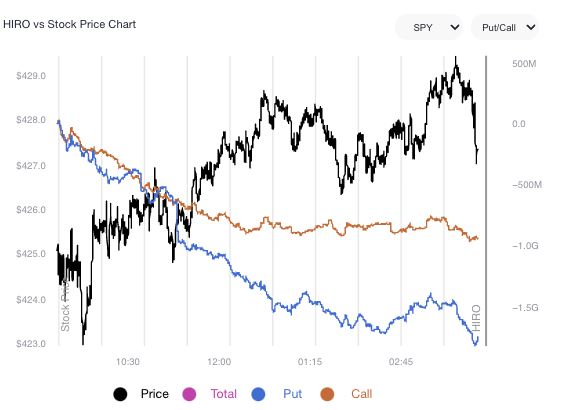
This divergence resolved itself, some, overnight in the broader market (even in the face of a ~7% price rise of Amazon Inc (NASDAQ: AMZN) large index constituent).
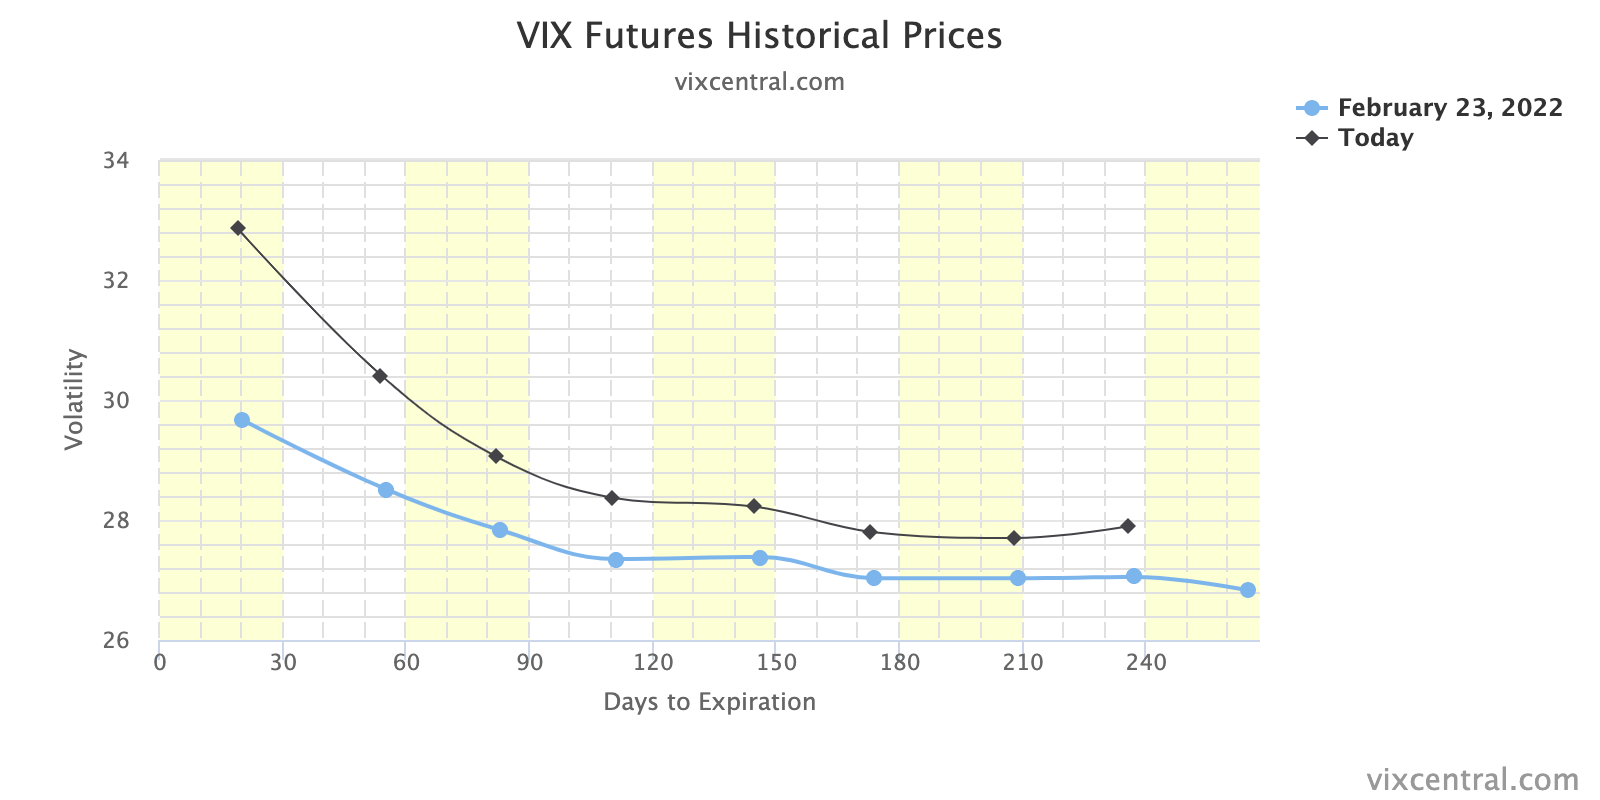
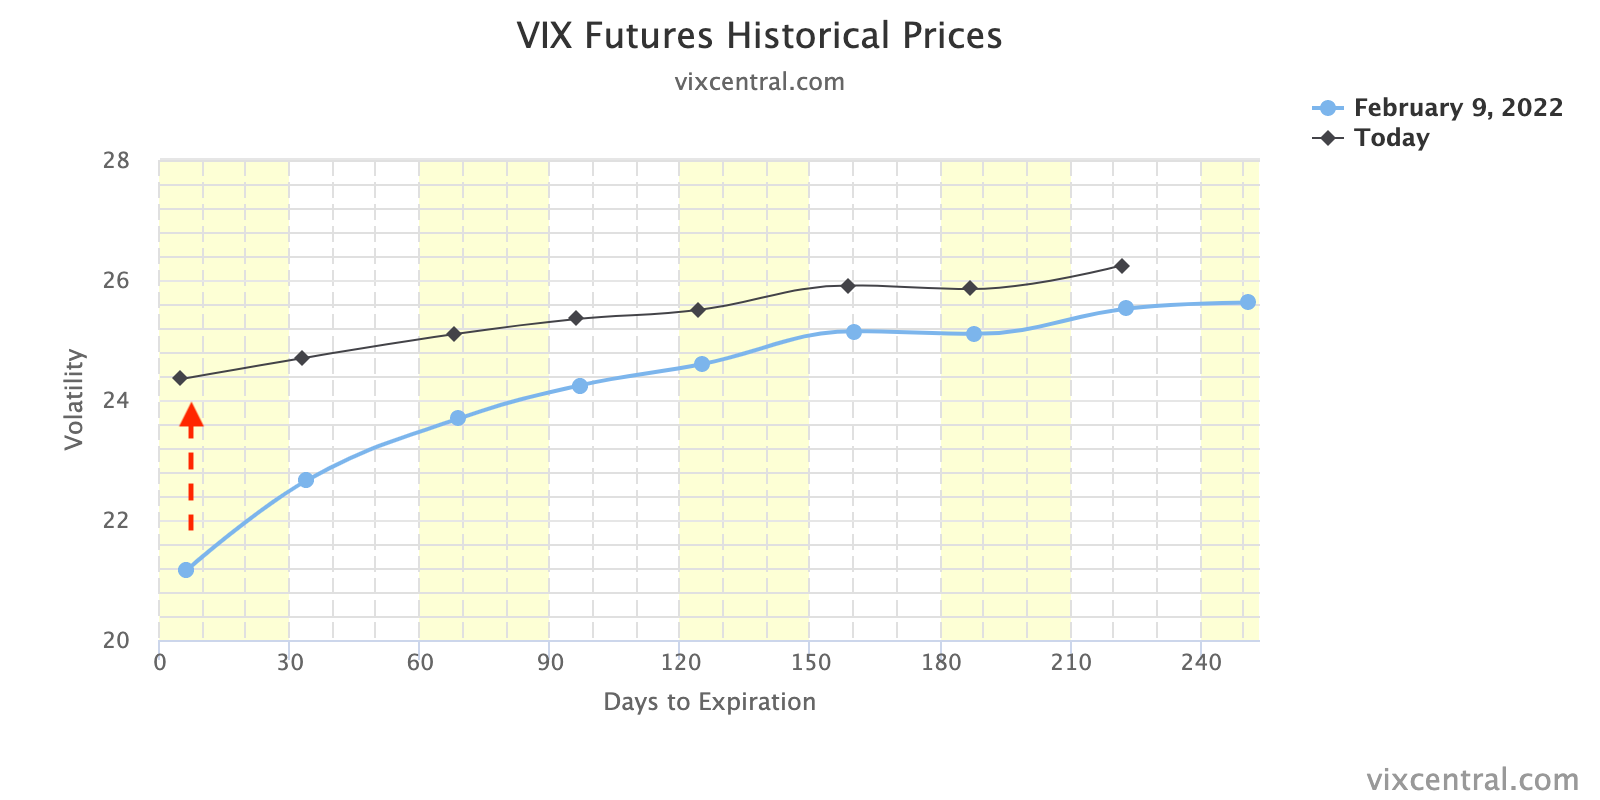
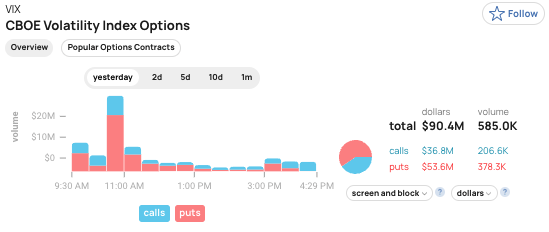
I’d be remiss if I did not point out growing bets on drops in the equity market’s pricing of risk (via the CBOE Volatility Index [INDEX: VIXI]). That would occur if indexes likely rebounded.
Taken together, it’s difficult to get a grasp of where the market wants to head, in the near term.
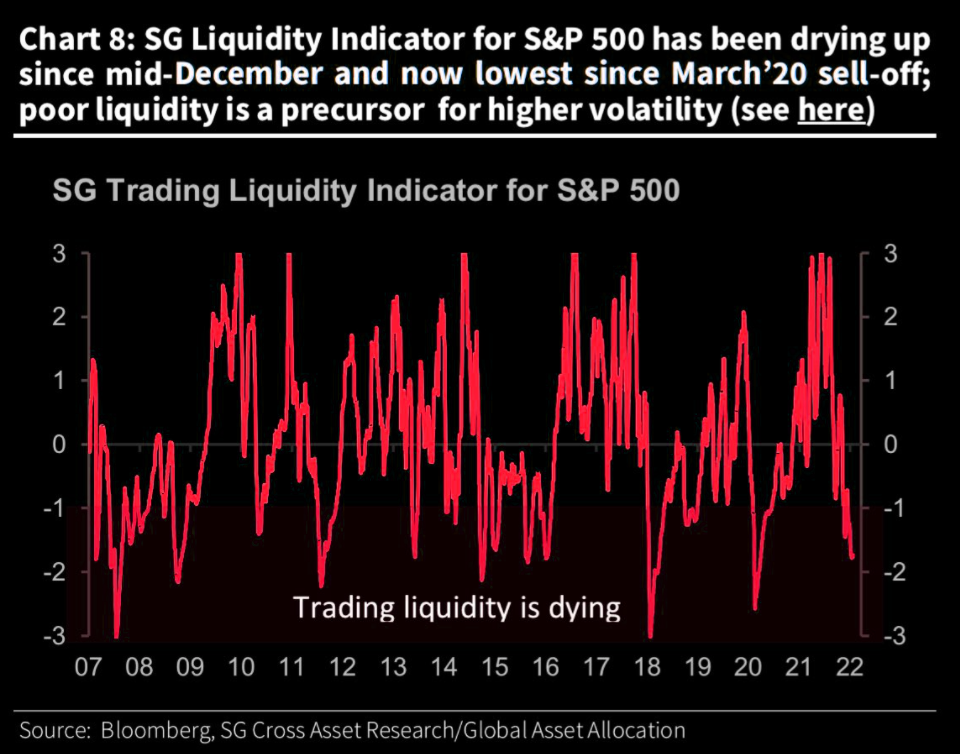
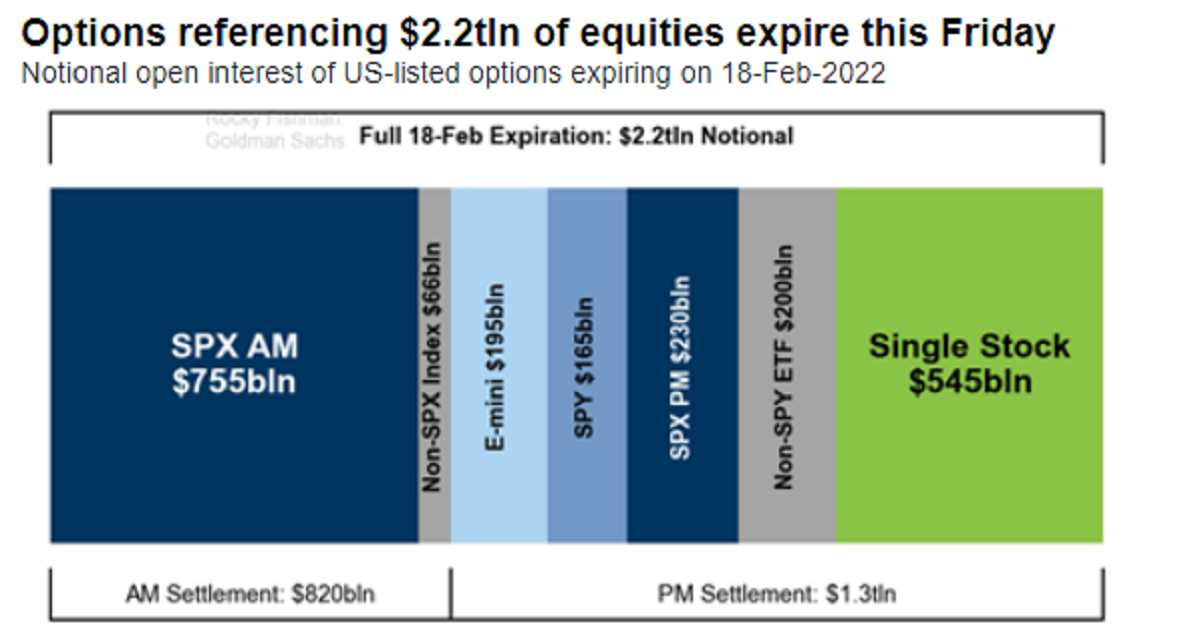
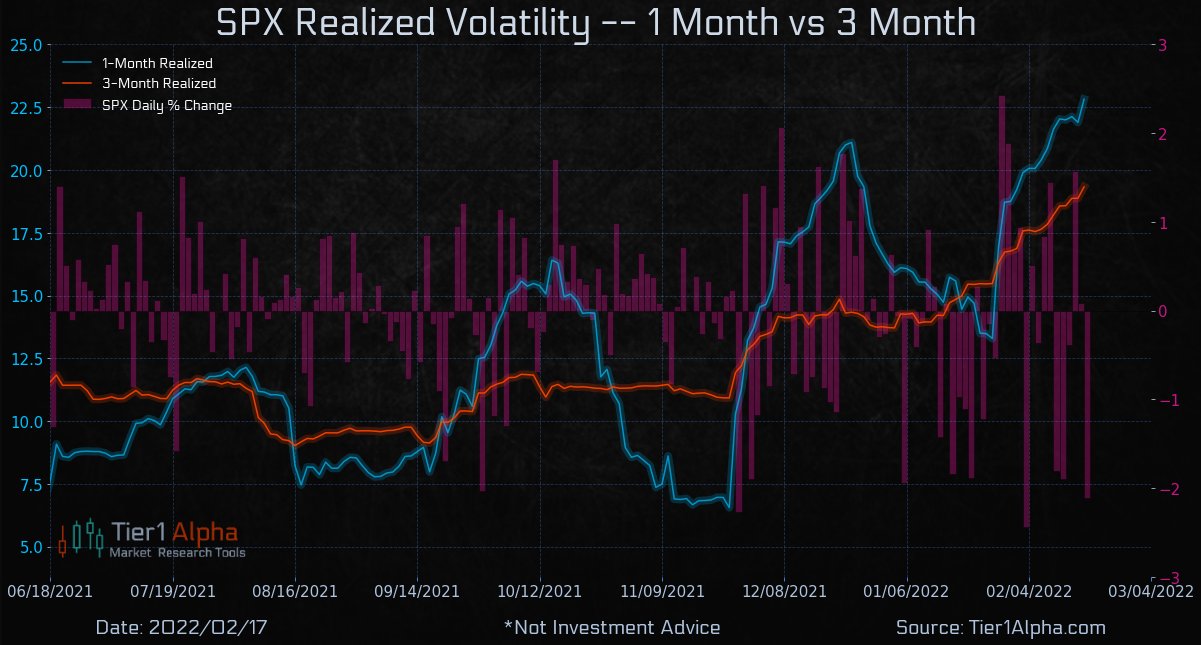
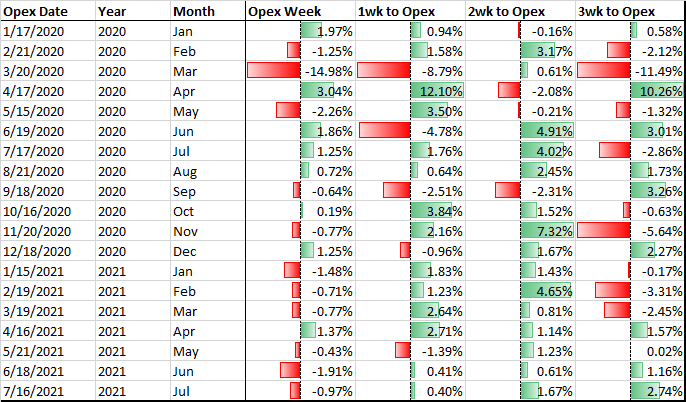
What is for certain: the compression of volatility (via passage of FOMC) or removal of counterparty negative exposure (via OPEX) may serve to alleviate some of this pressure.
Until then, participants can expect the options landscape to add to market volatility.
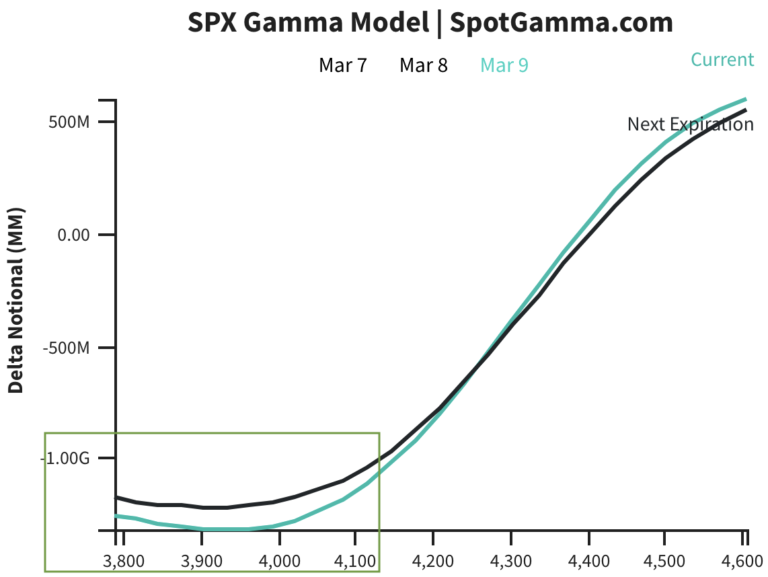
In case of lower prices, according to SpotGamma, the rate at which options counterparties increasingly add pressure on underlying SPX, so to speak, tapers off in the $4,100.00 to $4,000.00 area. Caution.
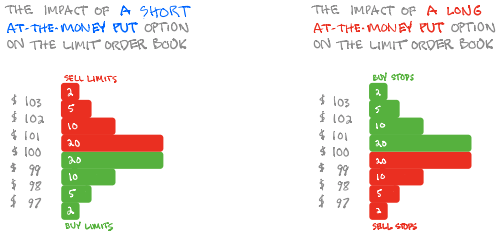
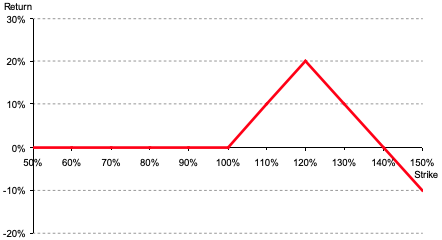
A way to take advantage of this volatility, while lowering the cost of bets, is options spreads. For instance, the Call Ratio (buy 1 call, sell 2 or more further out) can lower the cost of bets on the upside while providing exposure to asymmetric payouts.
Time and volatility are two factors, however, to be mindful of when initiating such spreads. Risk is undefined and if the time to expiry is too long (e.g., in excess of 1-2 weeks), fast moves and increases in volatility may result in large losses.
For that reason, also, one must be extremely careful with Put Ratio spreads. Consider adding protection far away from your short strikes to cap risk and turn the spreads into Butterflies.
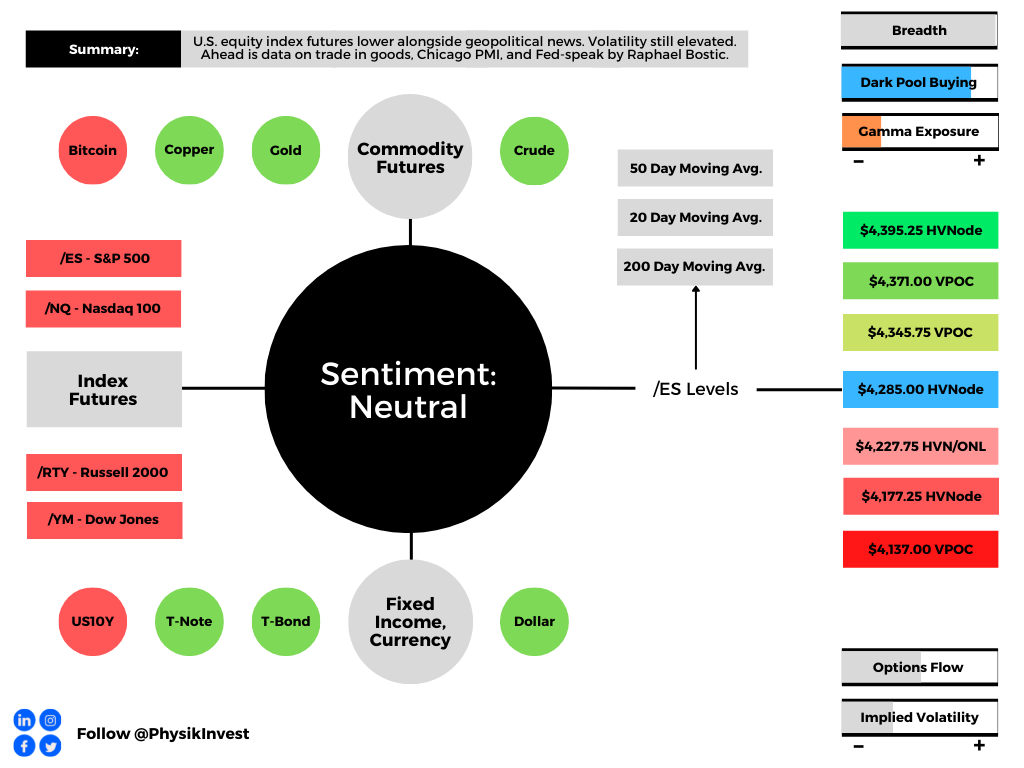
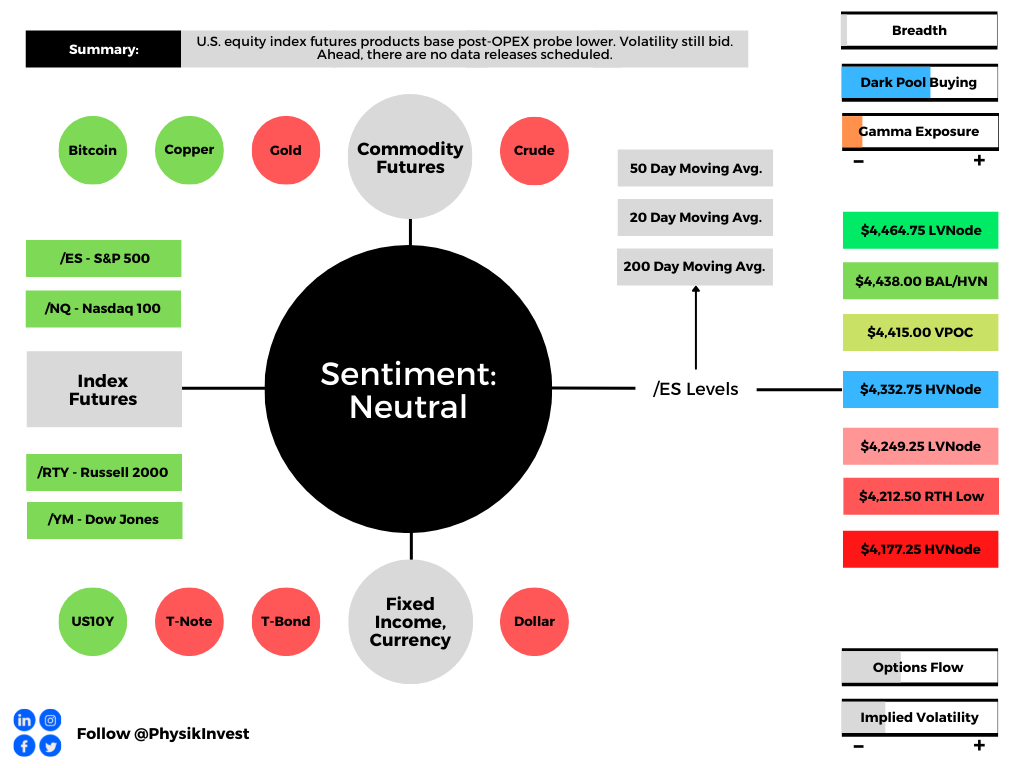
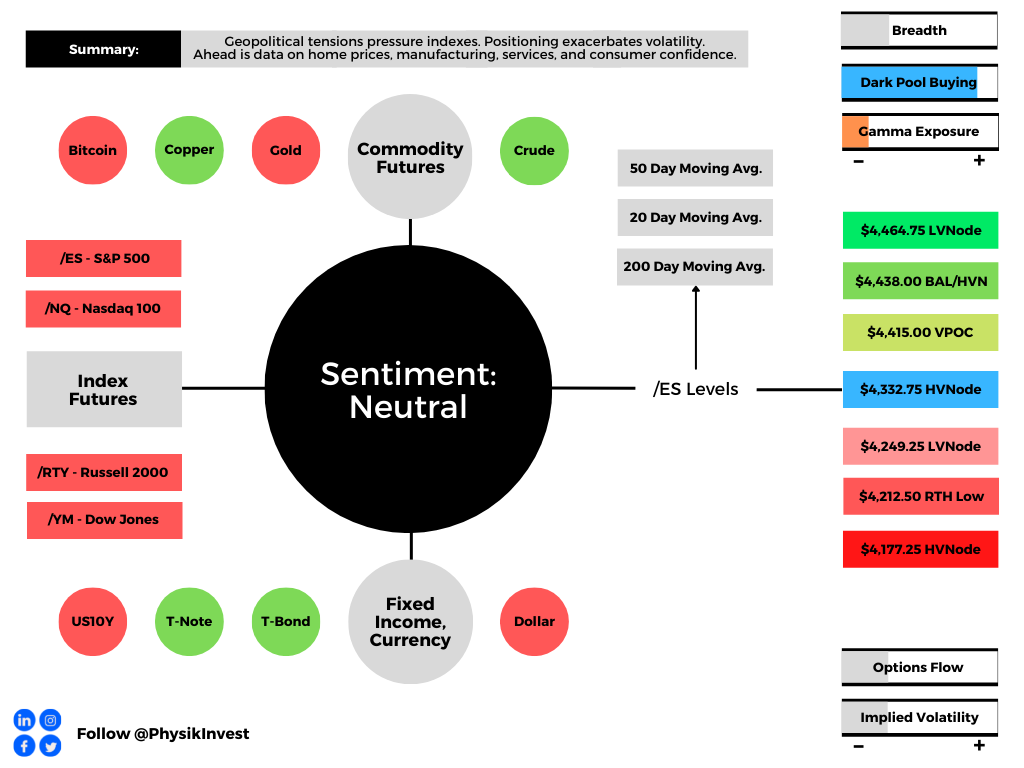
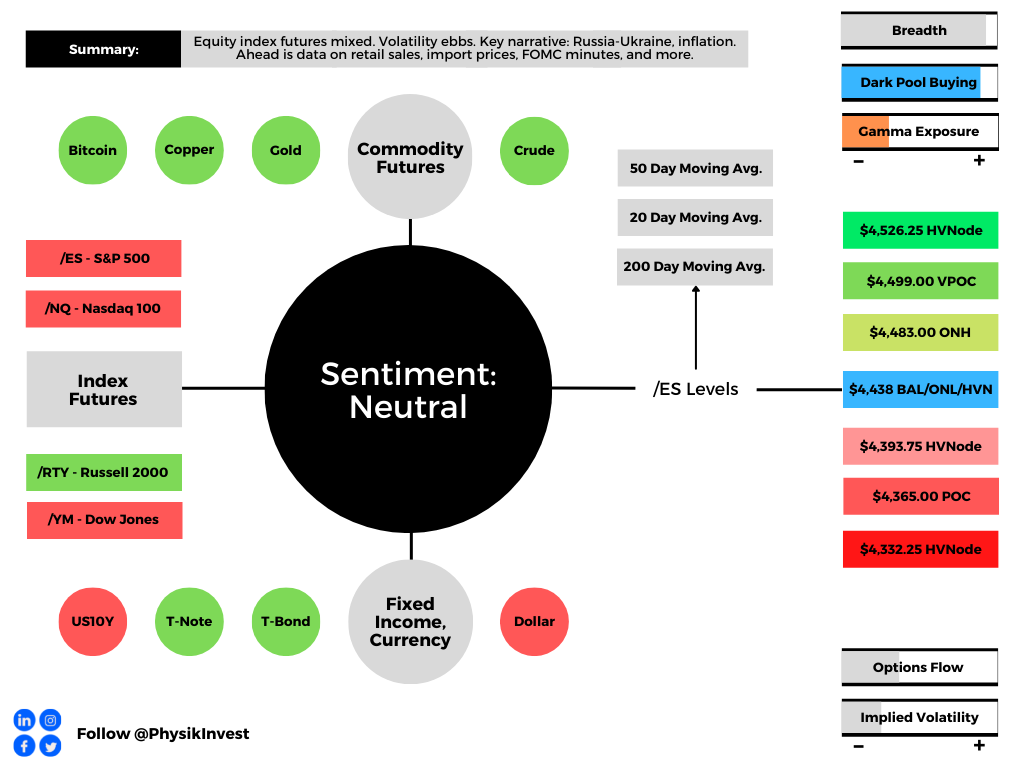
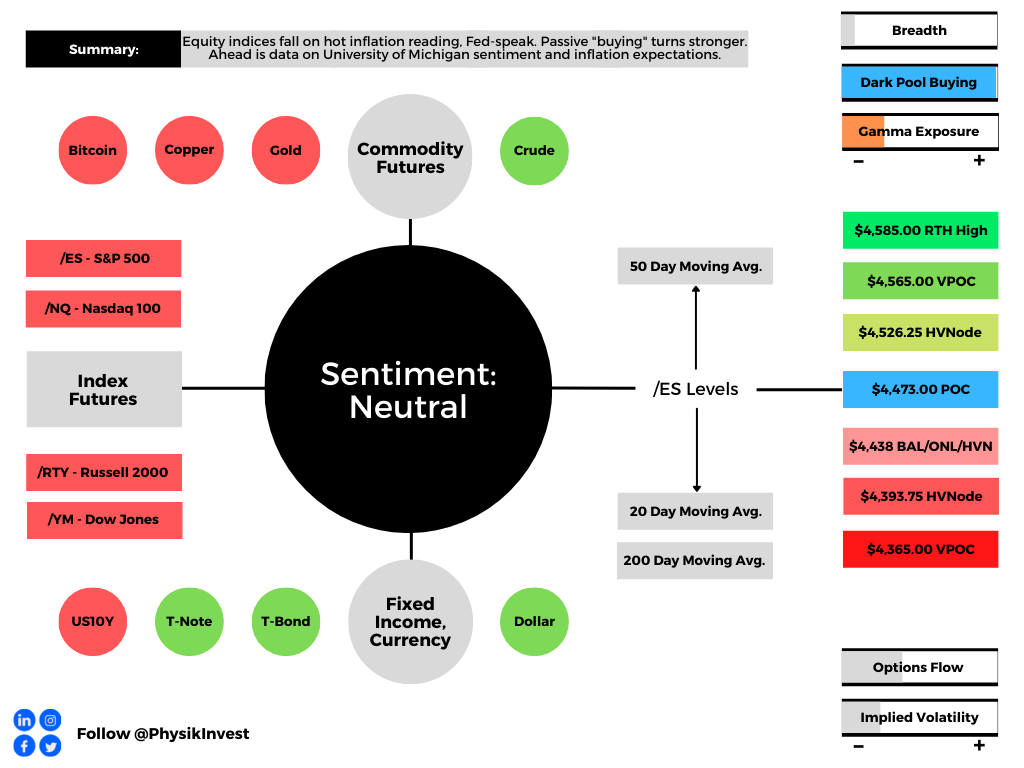
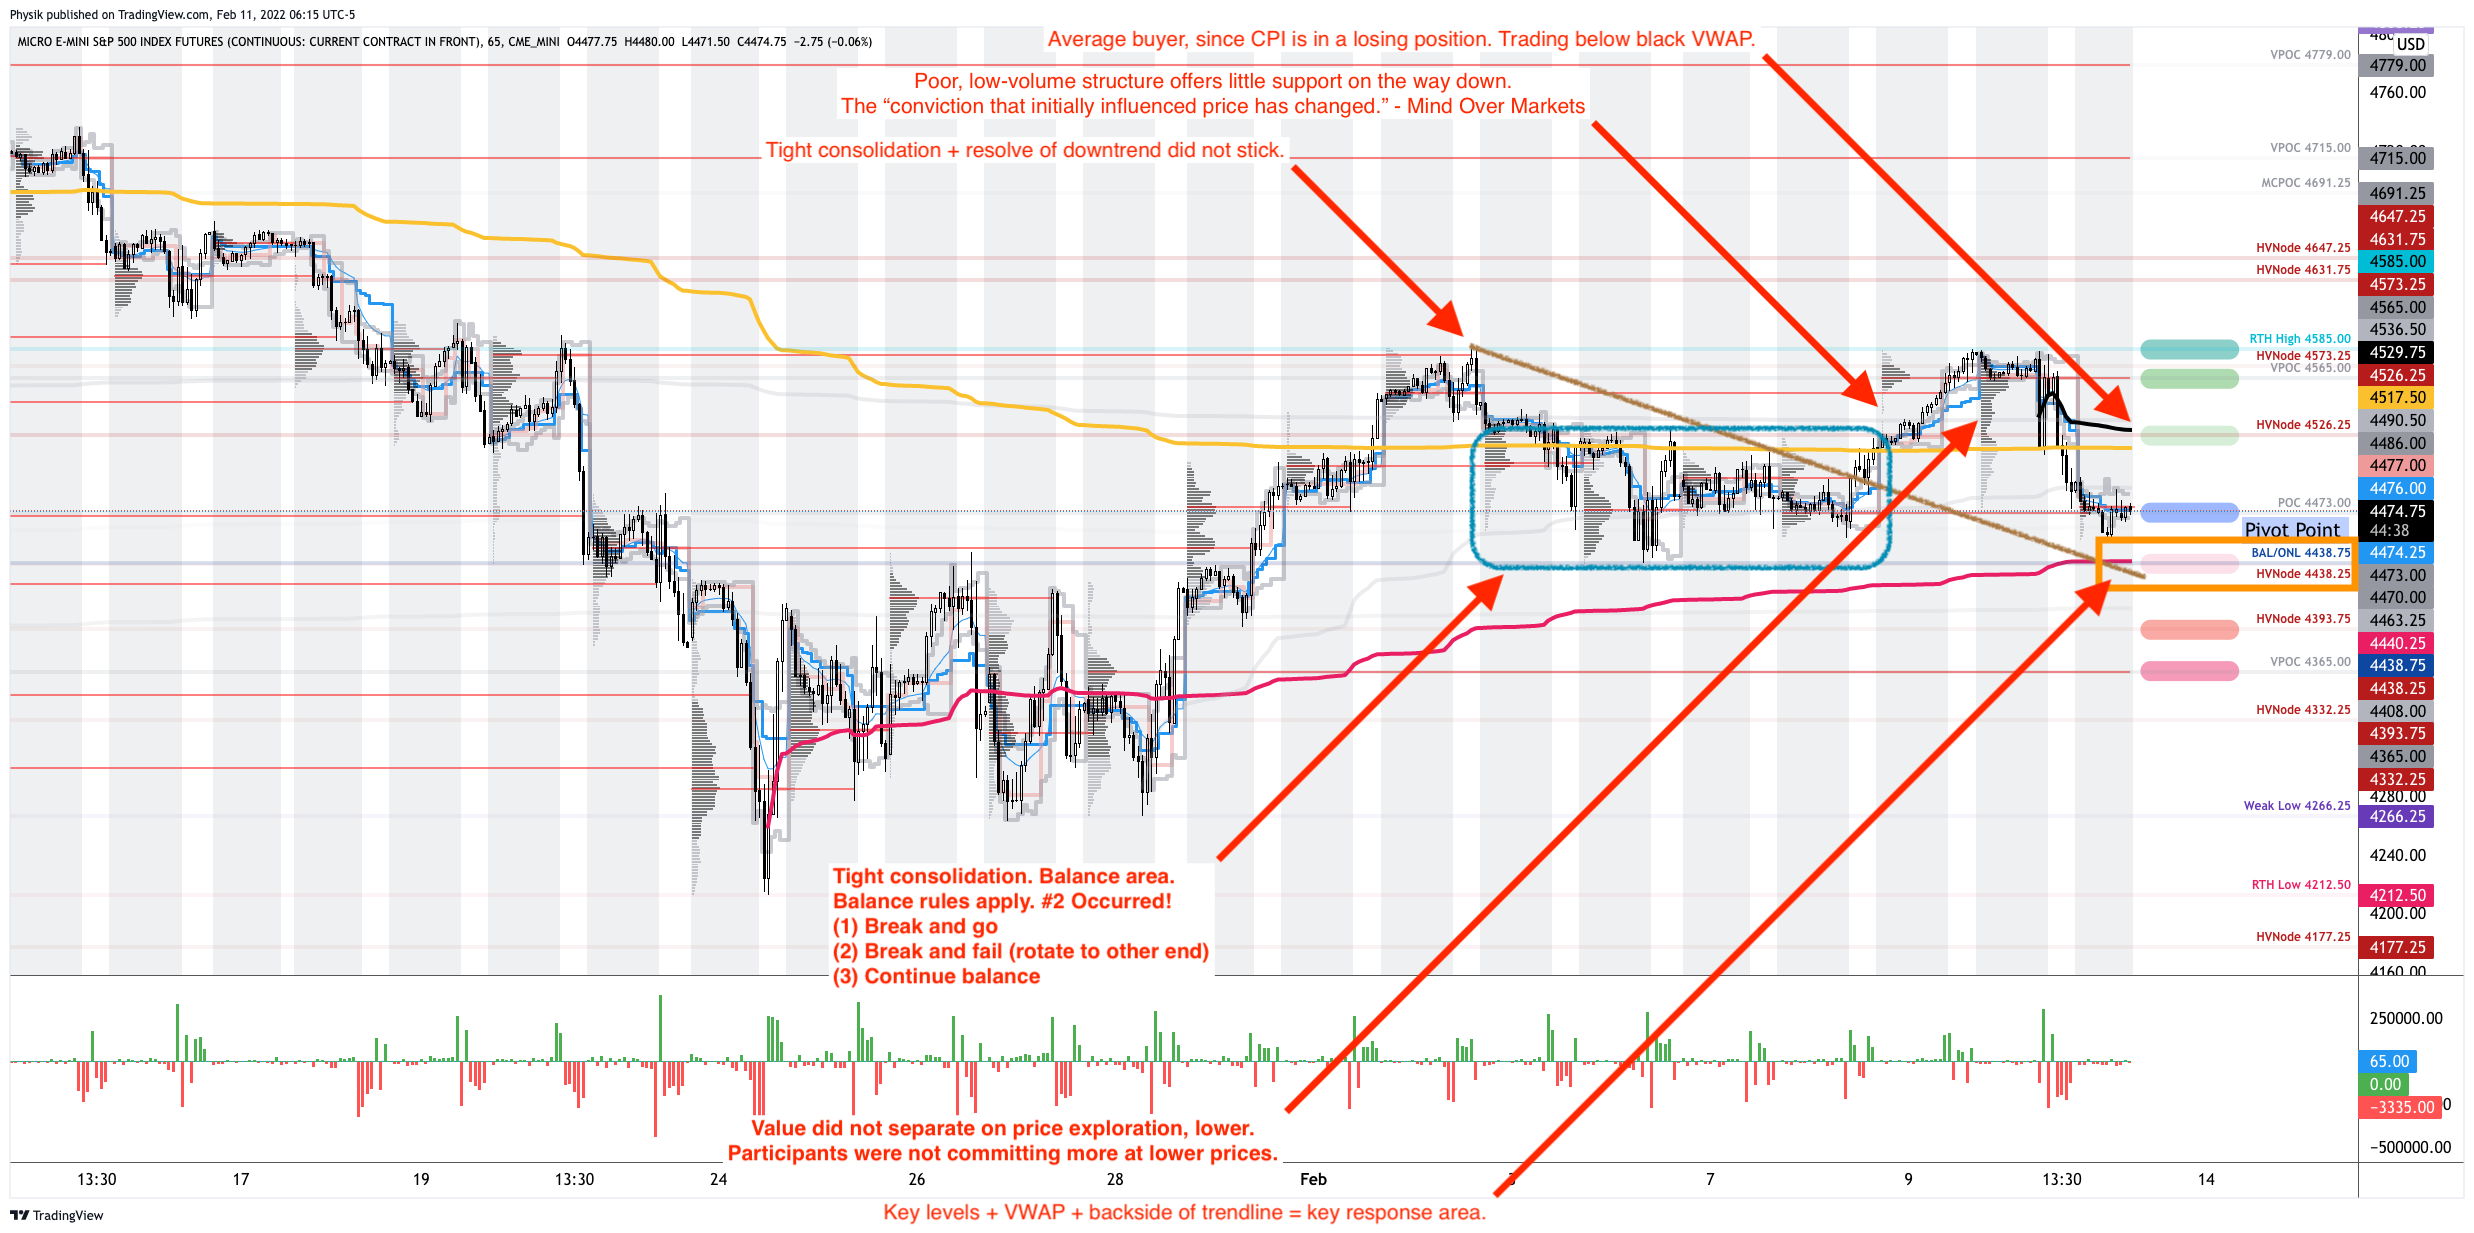
Technical: As of 6:30 AM ET, Thursday’s regular session (9:30 AM – 4:00 PM ET), in the S&P 500, will likely open in the lower part of a negatively skewed overnight inventory, inside of prior-range and -value, suggesting a limited potential for immediate directional opportunity.
Gap Scenarios Potentially In Play: Gaps ought to fill quickly. Should they not, that’s a signal of strength; do not fade. Leaving value behind on a gap-fill or failing to fill a gap (i.e., remaining outside of the prior session’s range) is a go-with indicator.

Auctioning and spending at least 1-hour of trade back in the prior range suggests a lack of conviction; in such a case, do not follow the direction of the most recent initiative activity.
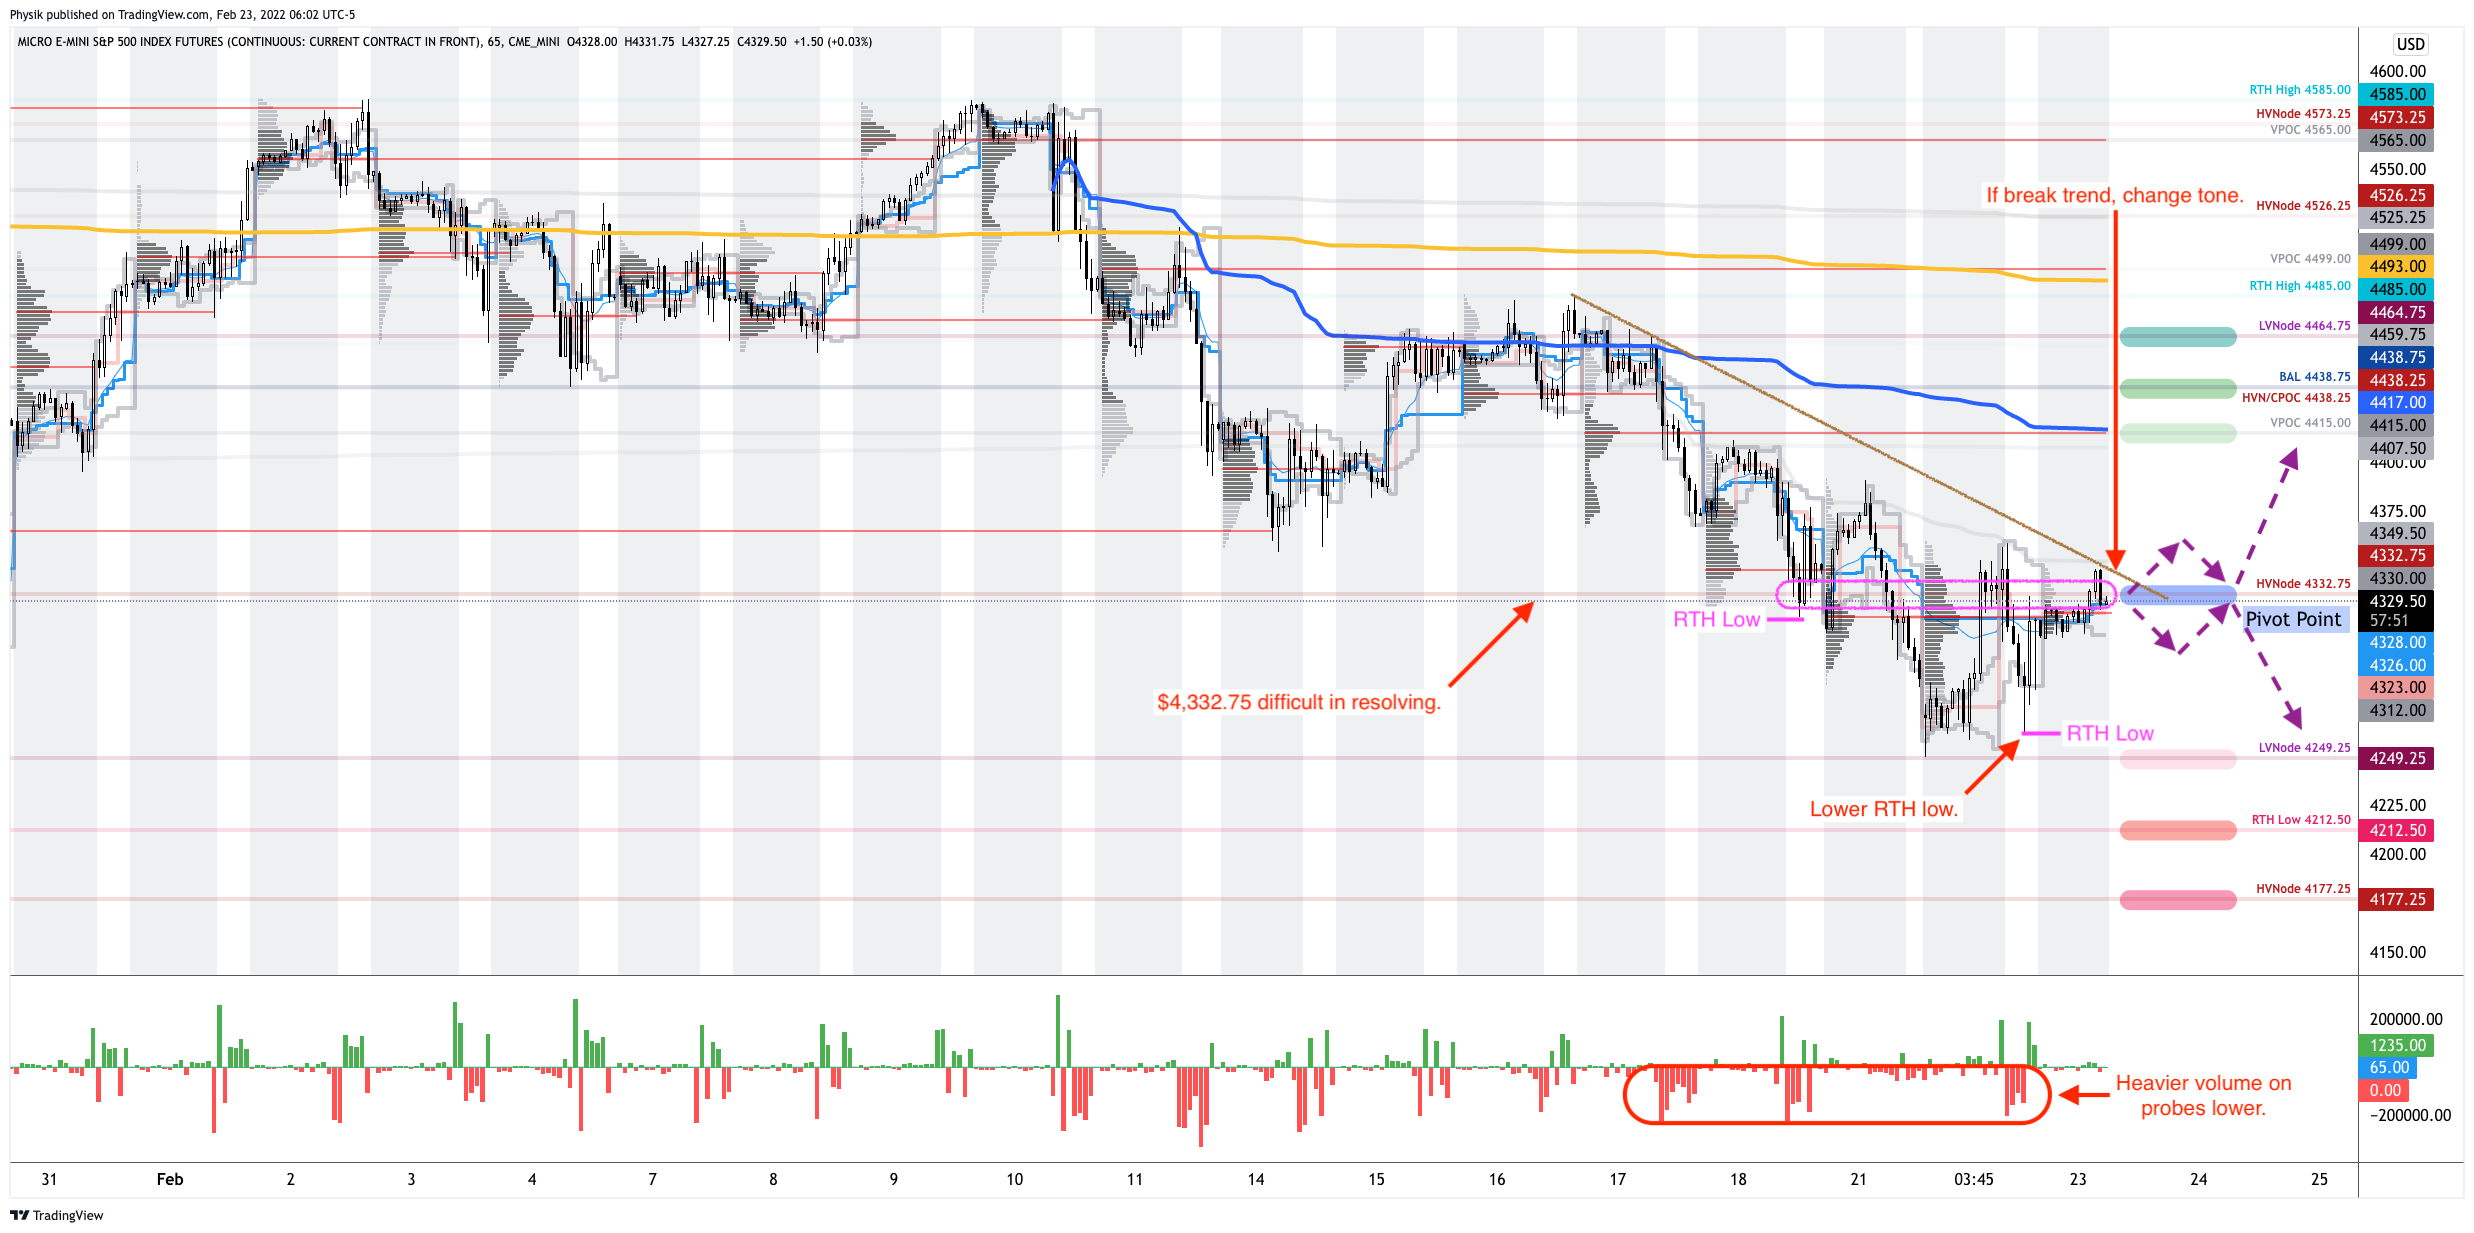
In the best case, the S&P 500 trades higher; activity above the $4,231.00 regular trade low (RTH Low) puts in play the $4,249.25 low volume area (LVNode). Initiative trade beyond the LVNode could reach as high as the $4,285.75 high volume area (HVNode) and $4,319.00 untested point of control (VPOC), or higher.
In the worst case, the S&P 500 trades lower; activity below the $4,231.00 RTH Low puts in play the $4,177.25 HVNode. Initiative trade beyond the HVNode could reach as low as the $4,138.75 and $4,101.25 overnight low (ONL), or lower.
Considerations: Push-and-pull, as well as responsiveness near key-technical areas (that are discernable visually on a chart), suggests technically-driven traders with short time horizons are very active.
Such traders often lack the wherewithal to defend retests and, additionally, the type of trade may be indicative of the other time frame participants waiting for more information to initiate trades.
Click here to load today’s key levels into the web-based TradingView charting platform. Note that all levels are derived using the 65-minute timeframe. New links are produced, daily.

Definitions
Overnight Rally Highs (Lows): Typically, there is a low historical probability associated with overnight rally-highs (lows) ending the upside (downside) discovery process.
Volume Areas: A structurally sound market will build on areas of high volume (HVNodes). Should the market trend for long periods of time, it will lack sound structure, identified as low volume areas (LVNodes). LVNodes denote directional conviction and ought to offer support on any test.
If participants were to auction and find acceptance into areas of prior low volume (LVNodes), then future discovery ought to be volatile and quick as participants look to HVNodes for favorable entry or exit.
POCs: POCs are valuable as they denote areas where two-sided trade was most prevalent in a prior day session. Participants will respond to future tests of value as they offer favorable entry and exit.
About
After years of self-education, strategy development, mentorship, and trial-and-error, Renato Leonard Capelj began trading full-time and founded Physik Invest to detail his methods, research, and performance in the markets.
Capelj is also a Benzinga finance and technology reporter interviewing the likes of Shark Tank’s Kevin O’Leary, JC2 Ventures’ John Chambers, FTX’s Sam Bankman-Fried, and ARK Invest’s Catherine Wood, as well as a SpotGamma contributor developing insights around impactful options market dynamics.
Disclaimer
Physik Invest does not carry the right to provide advice.
In no way should the materials herein be construed as advice. Derivatives carry a substantial risk of loss. All content is for informational purposes only.