Categories
Commentary

Daily Brief For November 29, 2021

What Happened

Overnight, equity index futures auctioned sideways to higher as participants looked to take back nearly all of Friday’s shortened holiday trading range. 

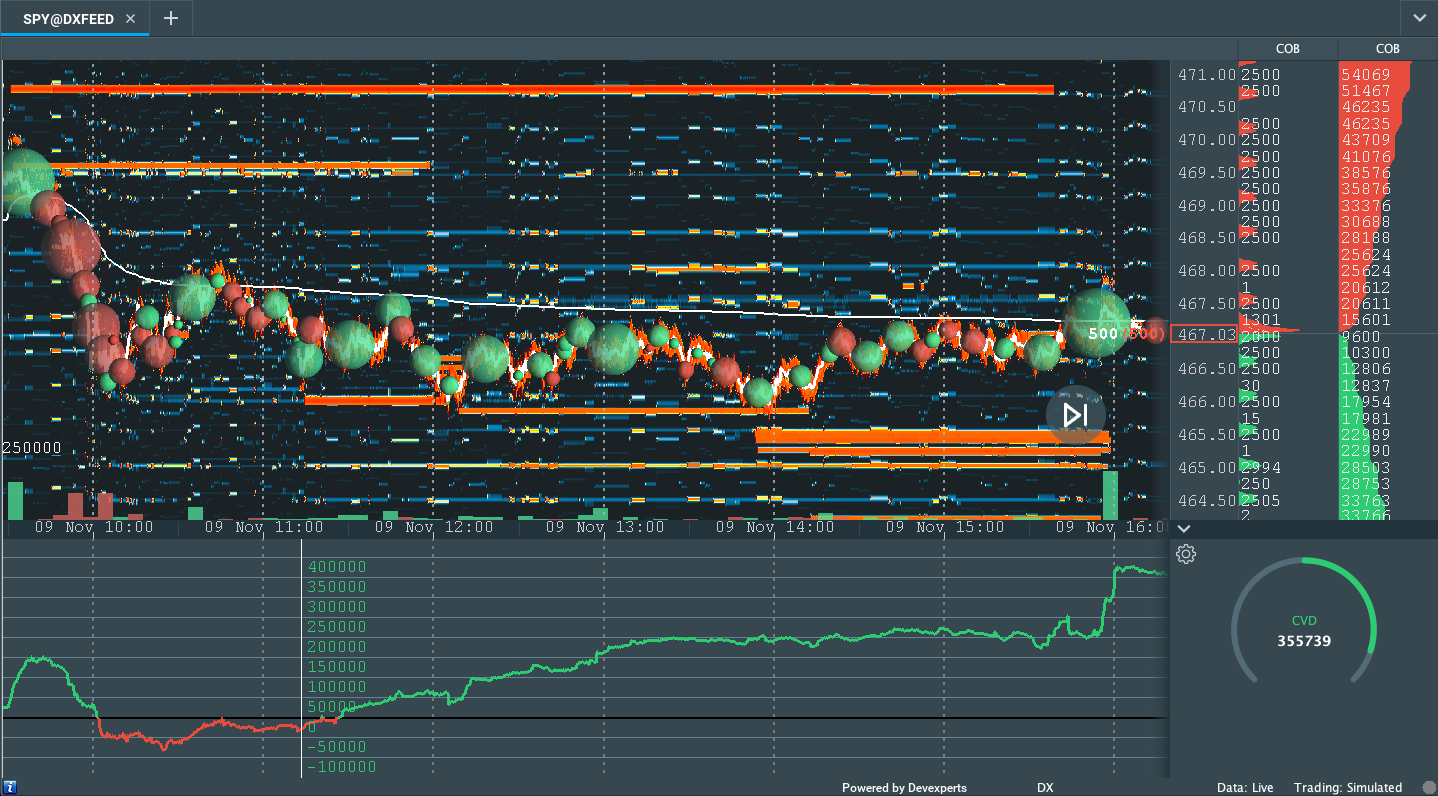
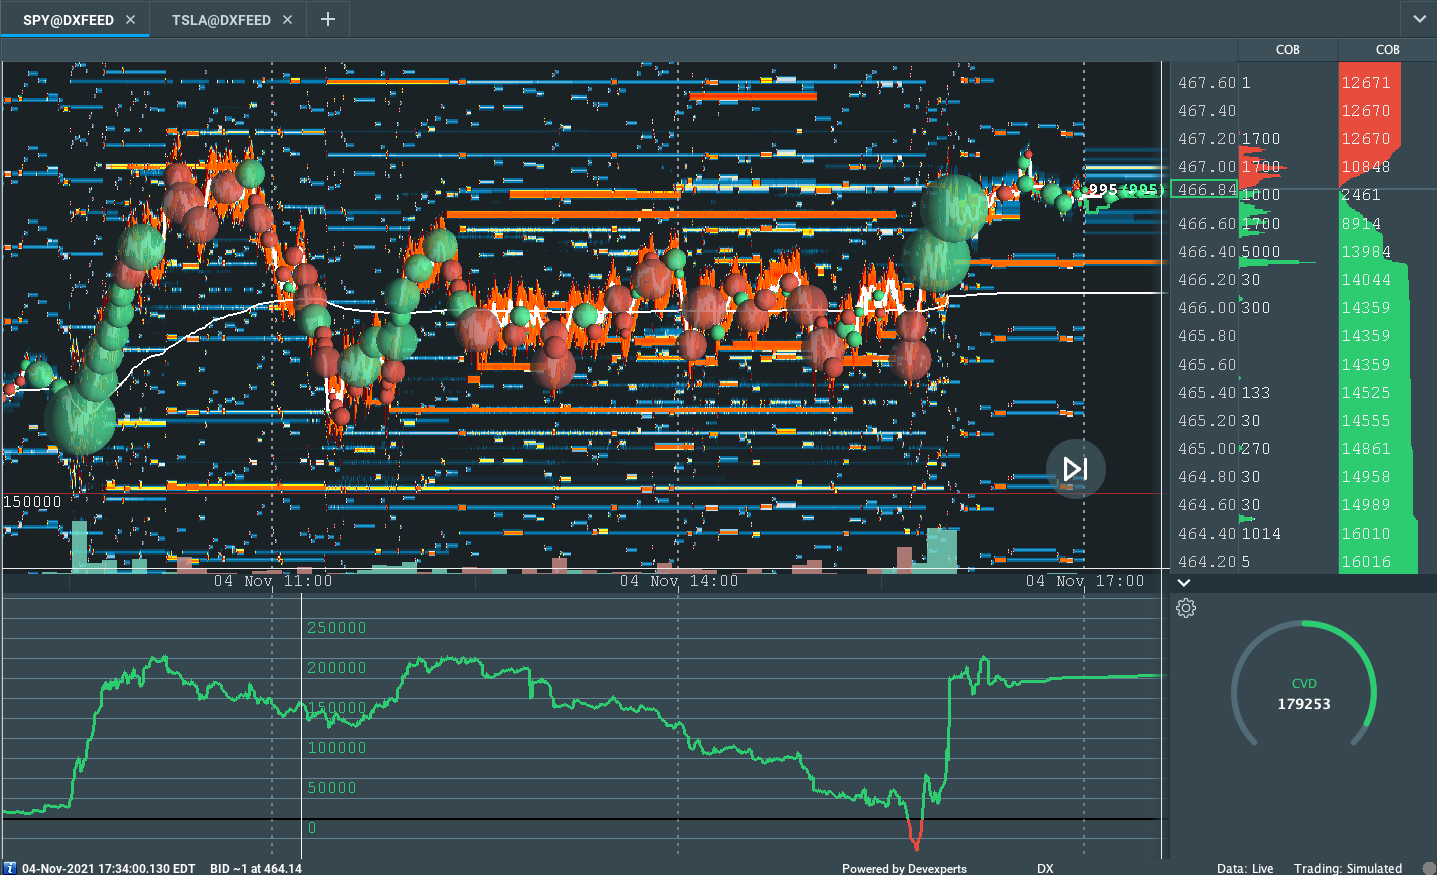
According to some metrics, the SPDR S&P 500 ETF Trust (NYSE: SPY), one of the largest ETFs that track the S&P 500 index, experienced one of its most illiquid days, Friday.

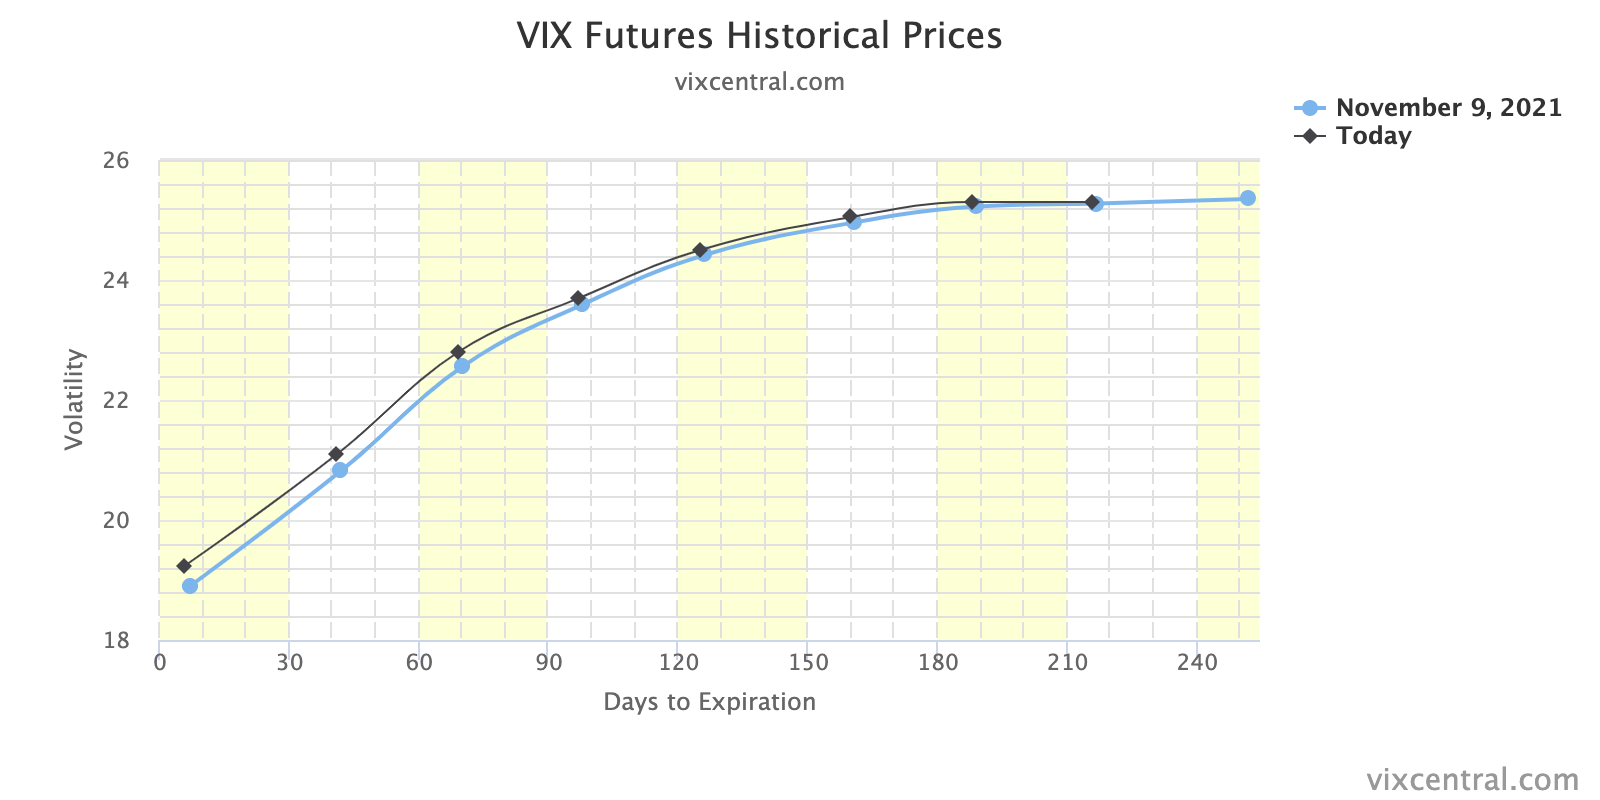
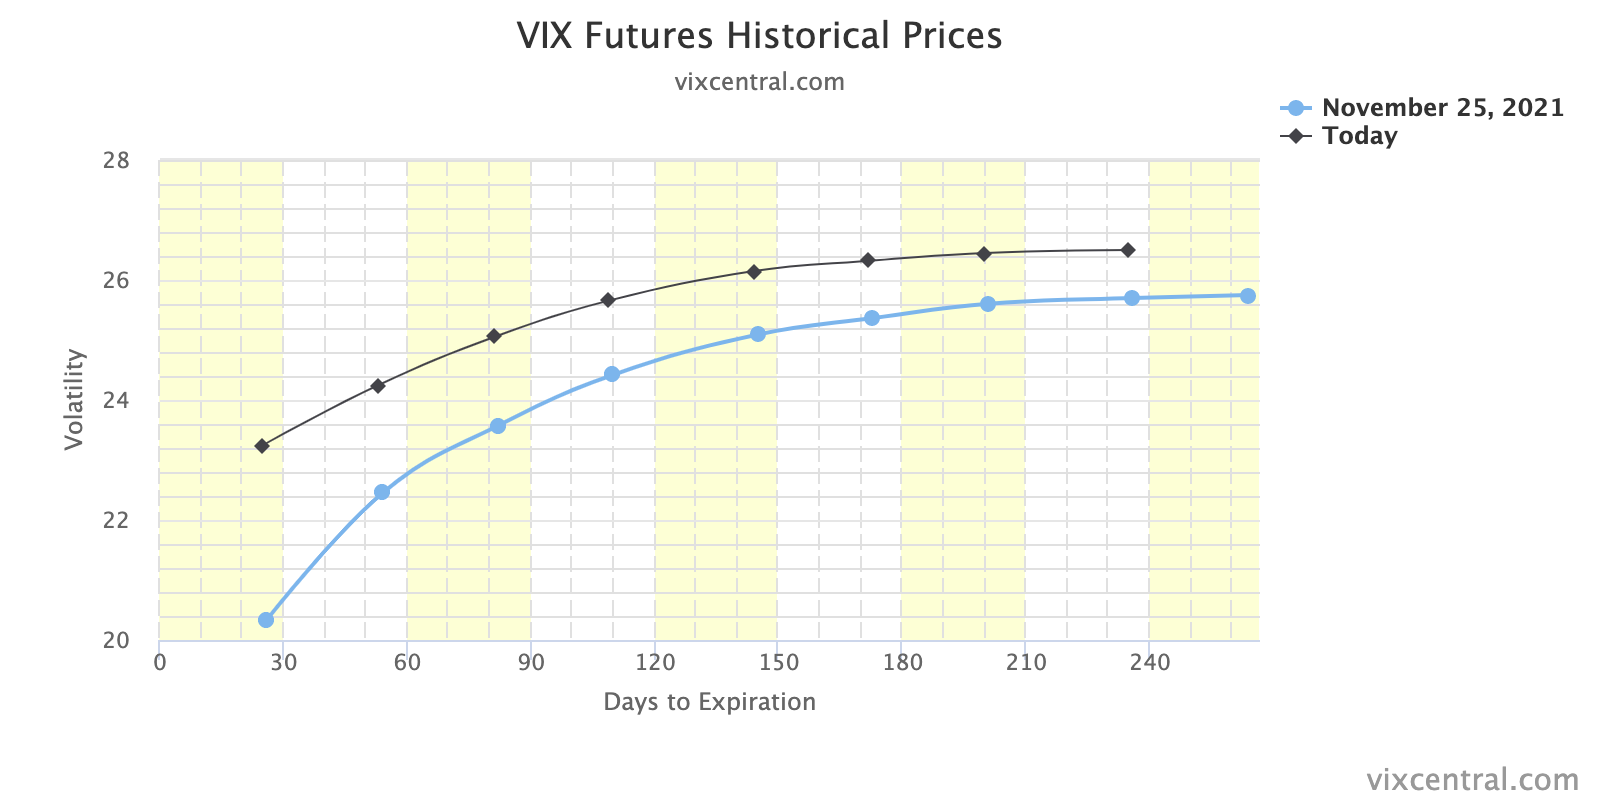
At the same time, the CBOE Volatility Index (INDEX: VIX) closed up nearly 50% while the VIX futures term structure settled in backwardation amidst a re-pricing of tail-risk, so to speak.

Moreover, ahead is data on Pending Home Sales (10:00 AM ET).
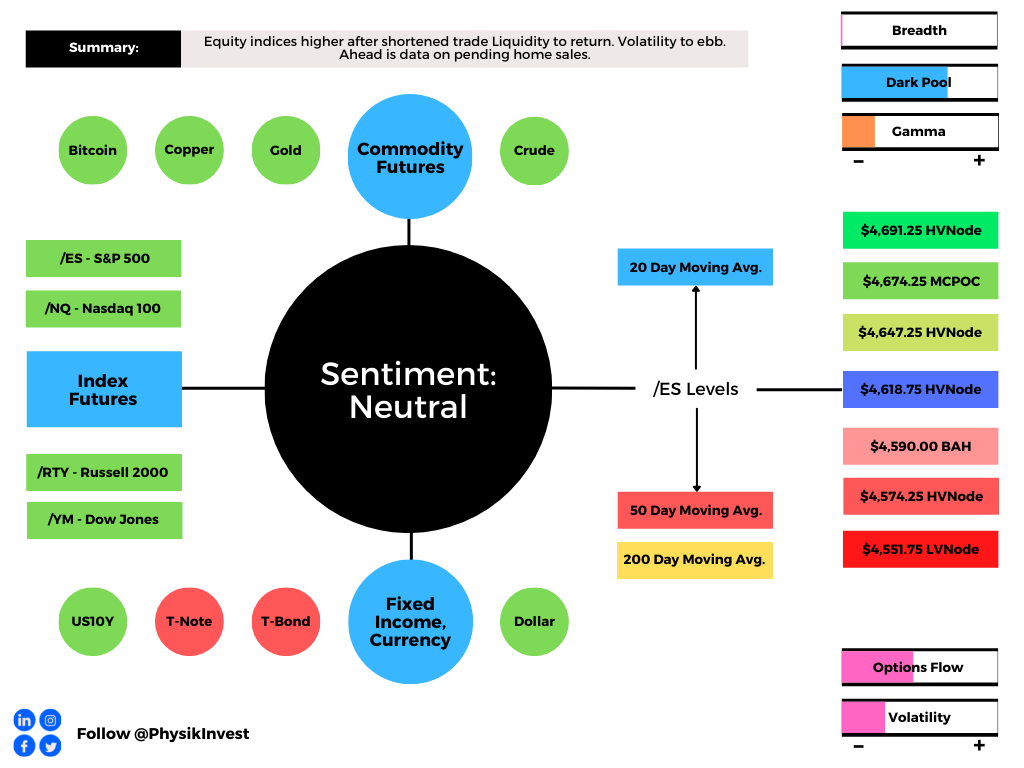
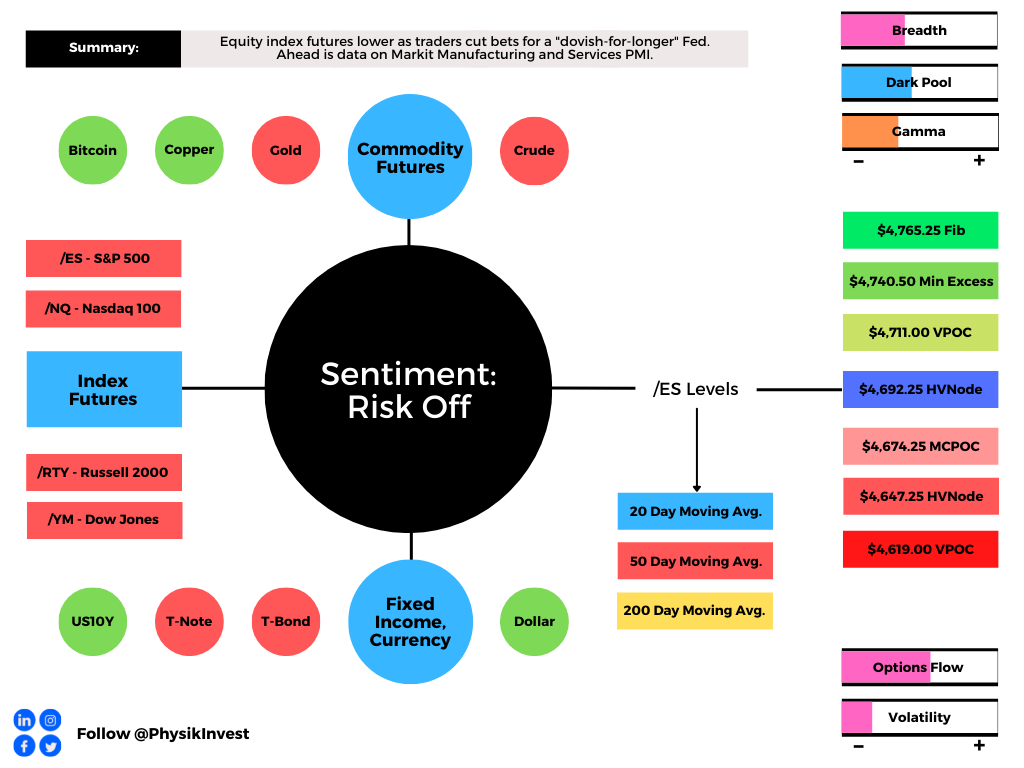
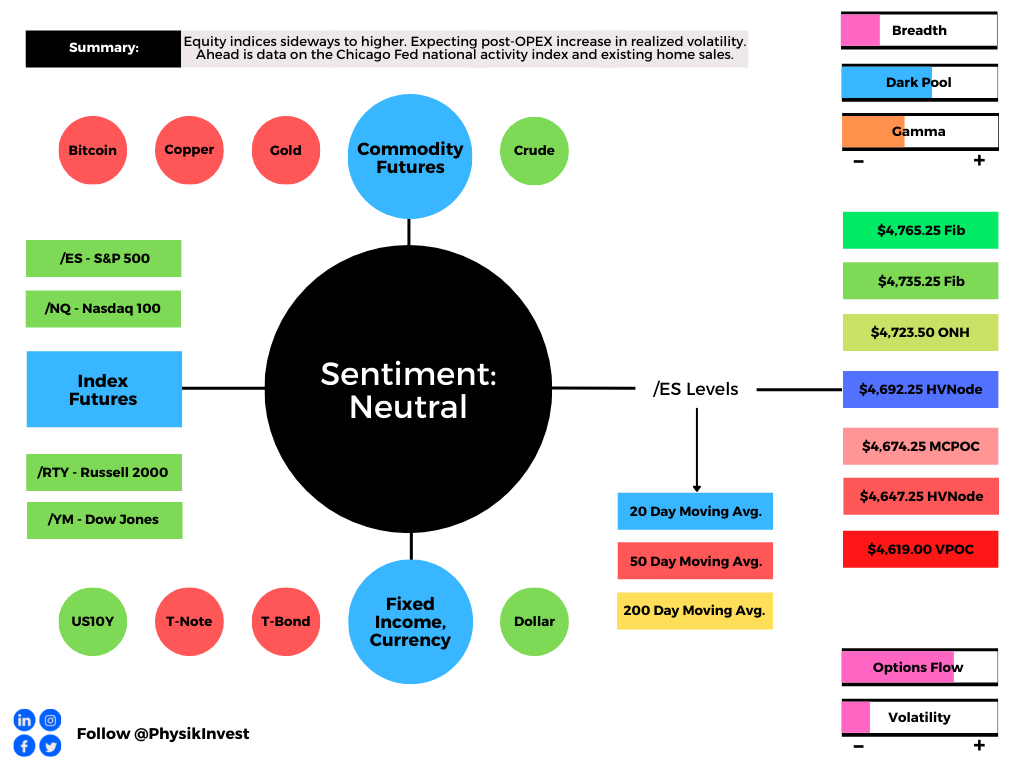
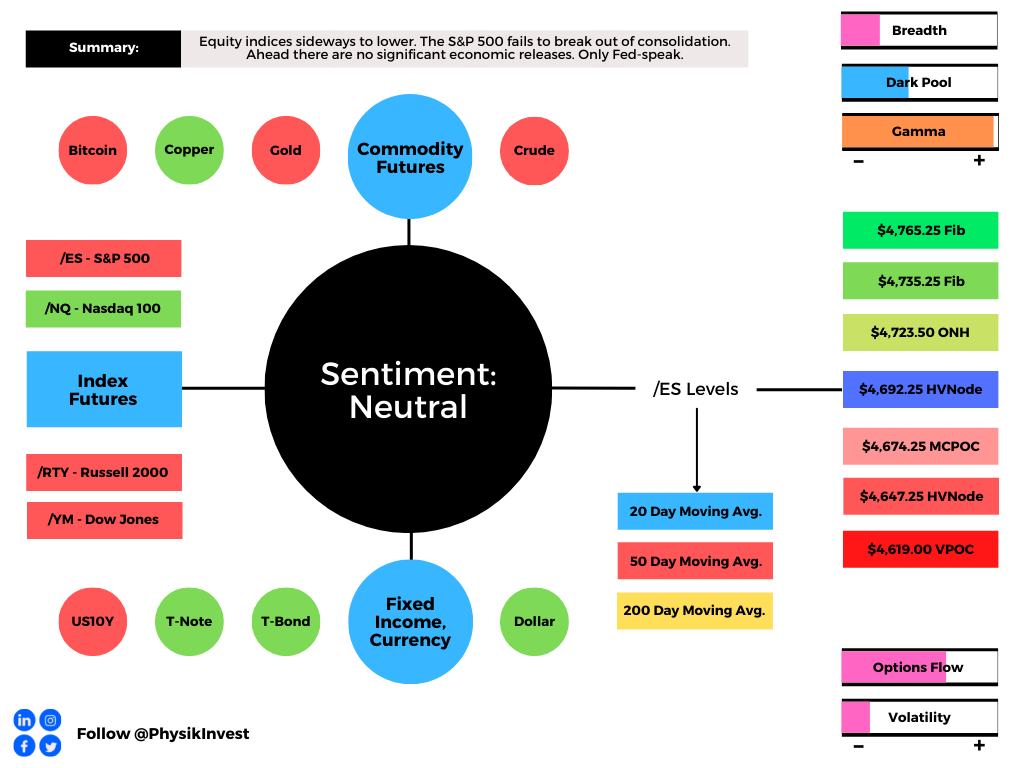
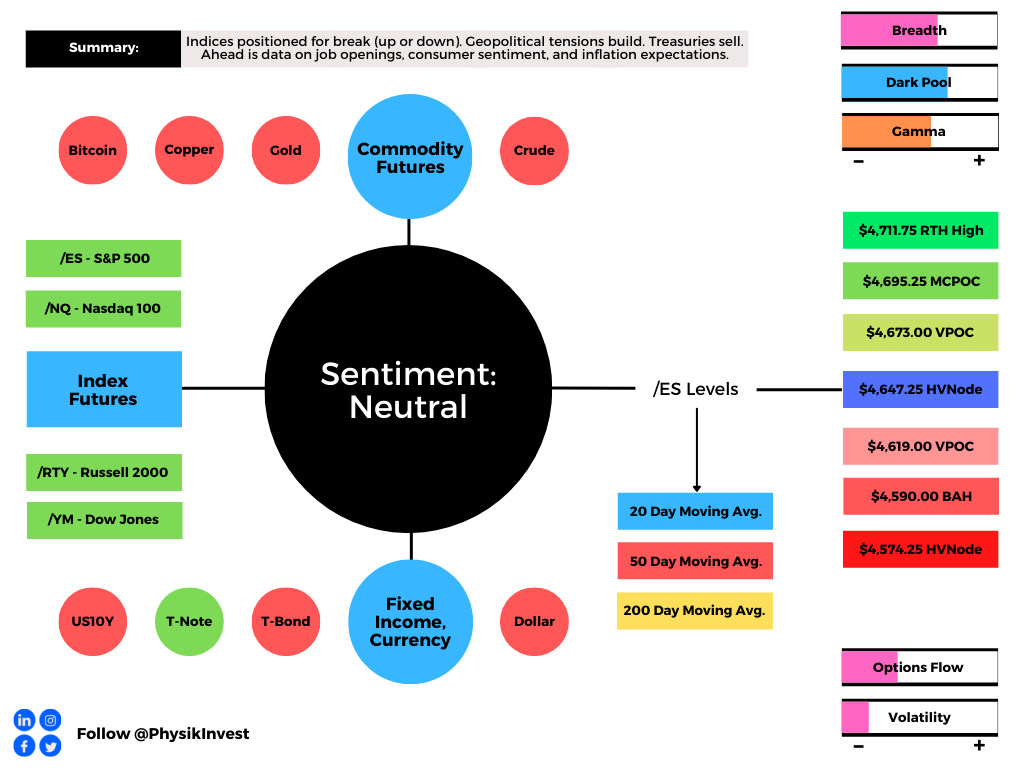
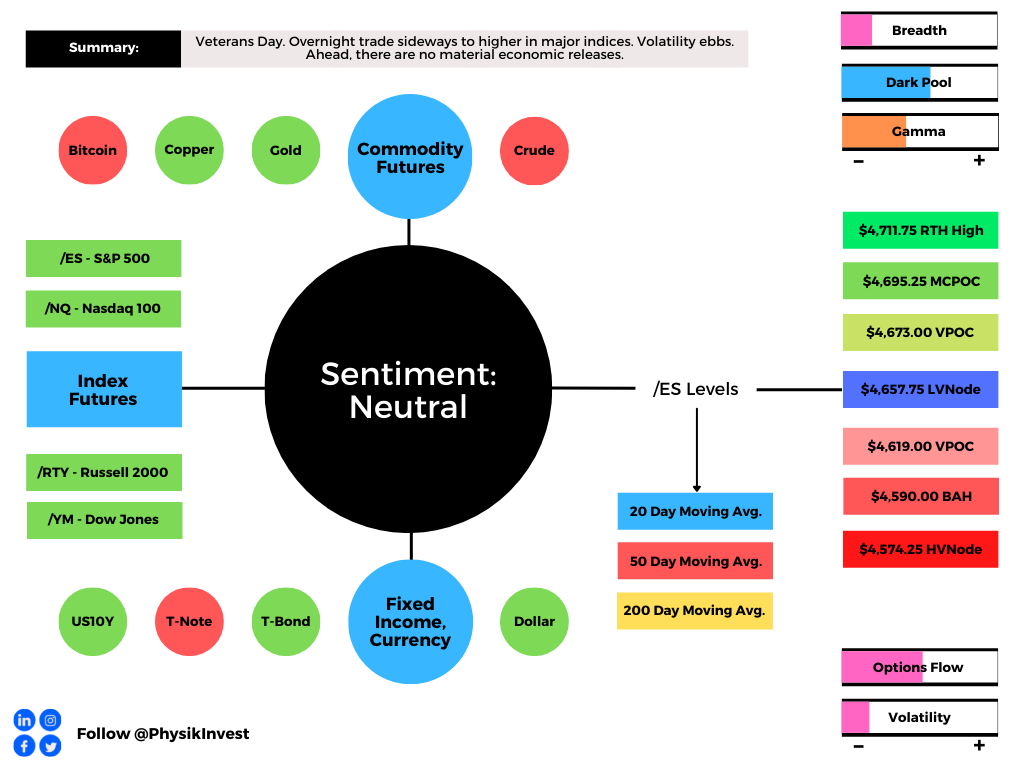
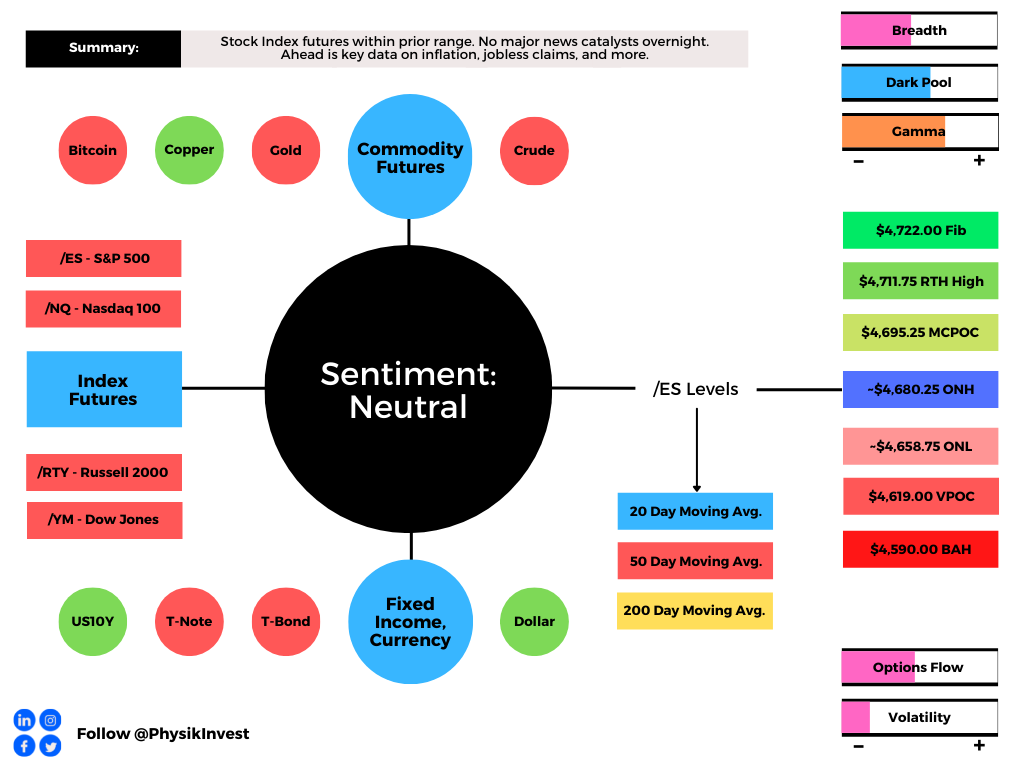
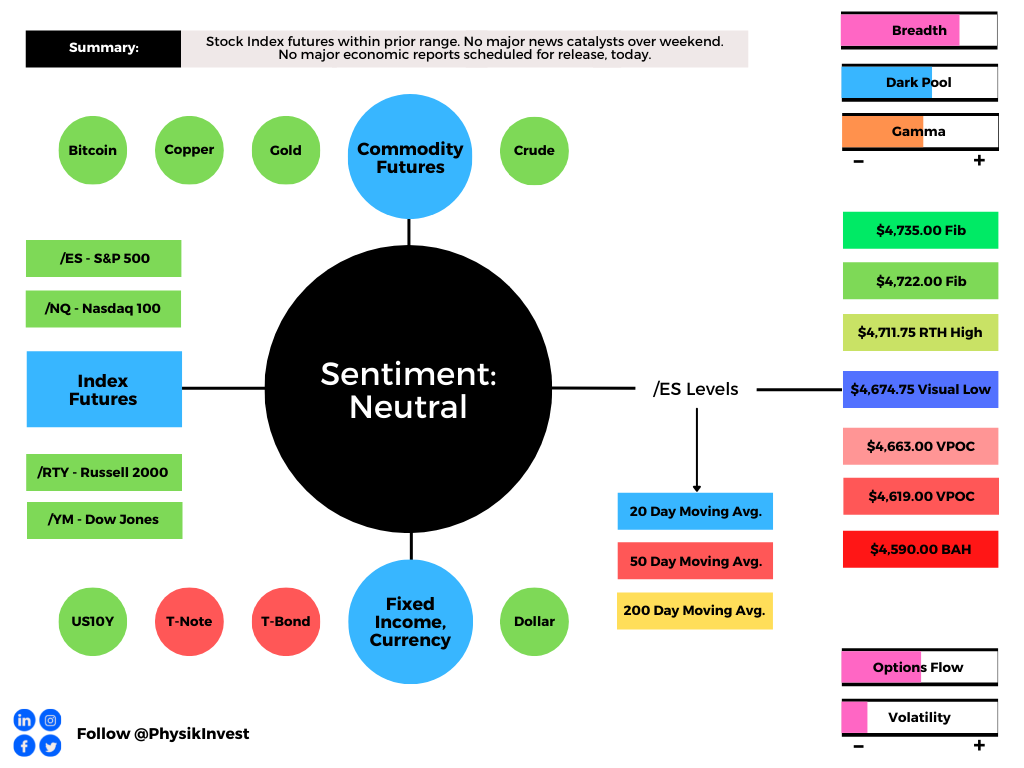
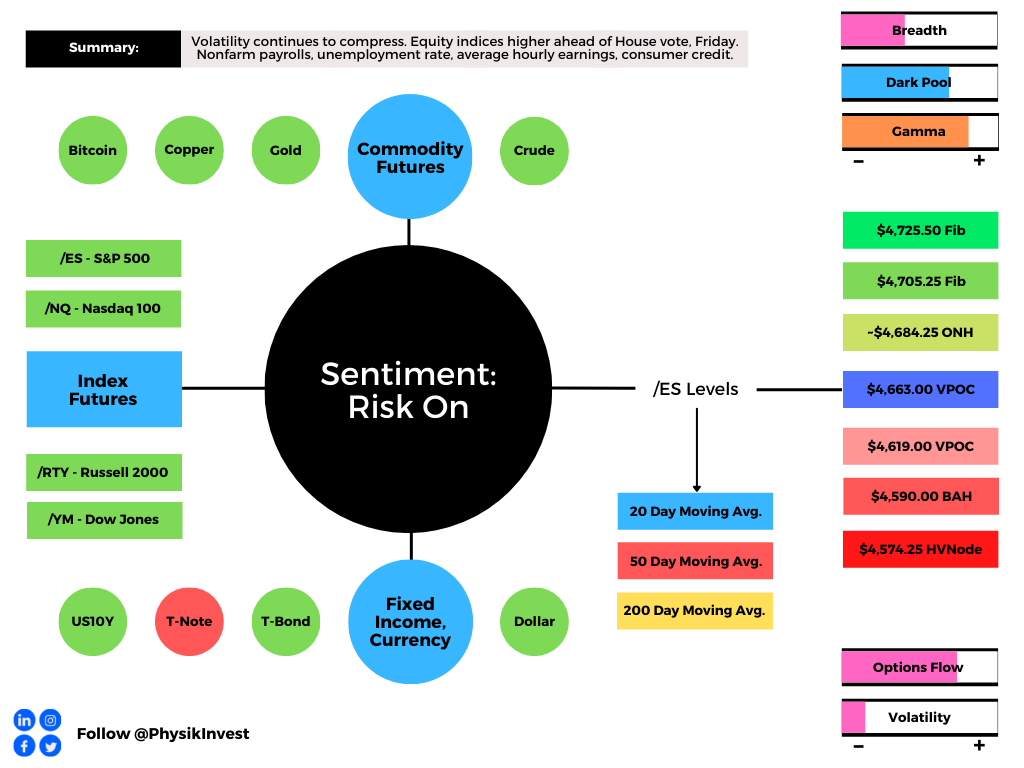
Graphic updated 5:50 AM ET. Sentiment Neutral if expected /ES open is inside of the prior day’s range. /ES levels are derived from the profile graphic at the bottom of the following section. Levels may have changed since initially quoted; click here for the latest levels. SqueezeMetrics Dark Pool Index (DIX) and Gamma (GEX) calculations are based on where the prior day’s reading falls with respect to the MAX and MIN of all occurrences available. A higher DIX is bullish. At the same time, the lower the GEX, the more (expected) volatility. Learn the implications of volatility, direction, and moneyness. SHIFT data used for S&P 500 (INDEX: SPX) options activity. Note that options flow is sorted by the call premium spent; if more positive then more was spent on call options. Breadth reflects a reading of the prior day’s NYSE Advance/Decline indicator. VIX reflects a current reading of the CBOE Volatility Index (INDEX: VIX) from 0-100.

What To Expect

Despite the lackluster intraday breadth and divergent market liquidity metrics, the worst-case outcome occurred, Friday, evidenced by downside expansion of range and separation of value.

Coming into the session, the experiences associated with ‘Volmageddon’ came to mind; the VIX was up nearly 40.00%, a concern given the exuberance of past weeks and options positioning, as well as a decline in correlations, and unsupportive breadth.

Tempering the fall were divergences; the Russell 2000 was down nearly 4.00% before Friday’s U.S. open while the S&P 500 was off about 2.00% or so, buoyed by the Nasdaq 100 which was only down about 1.00% amidst an 8% dip in the ten-year yield.

The divergence persisted with the S&P 500 closing firmly below its 20-day simple moving average, a visual level often acted on by short-term, technically-driven participants who generally are unable to defend retests.
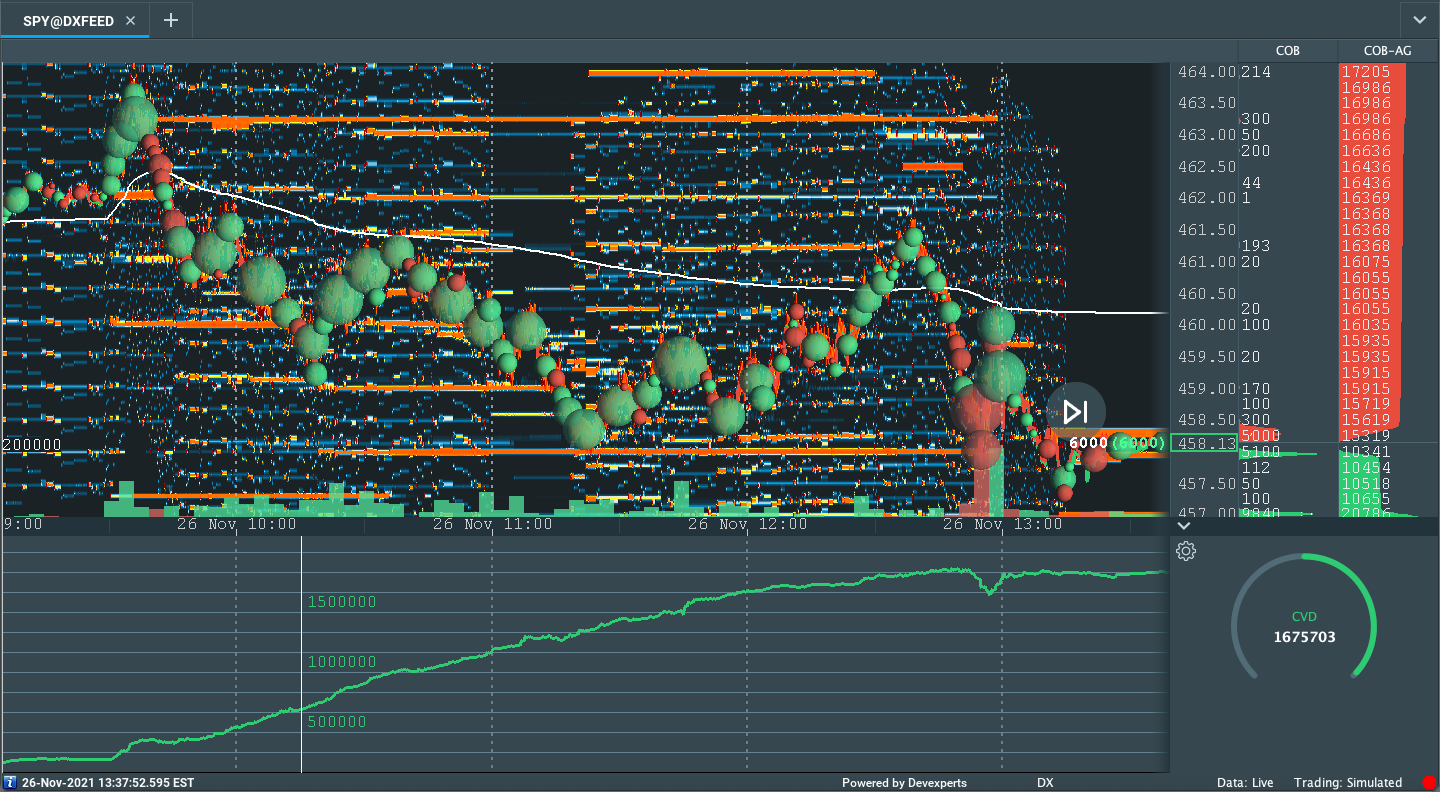
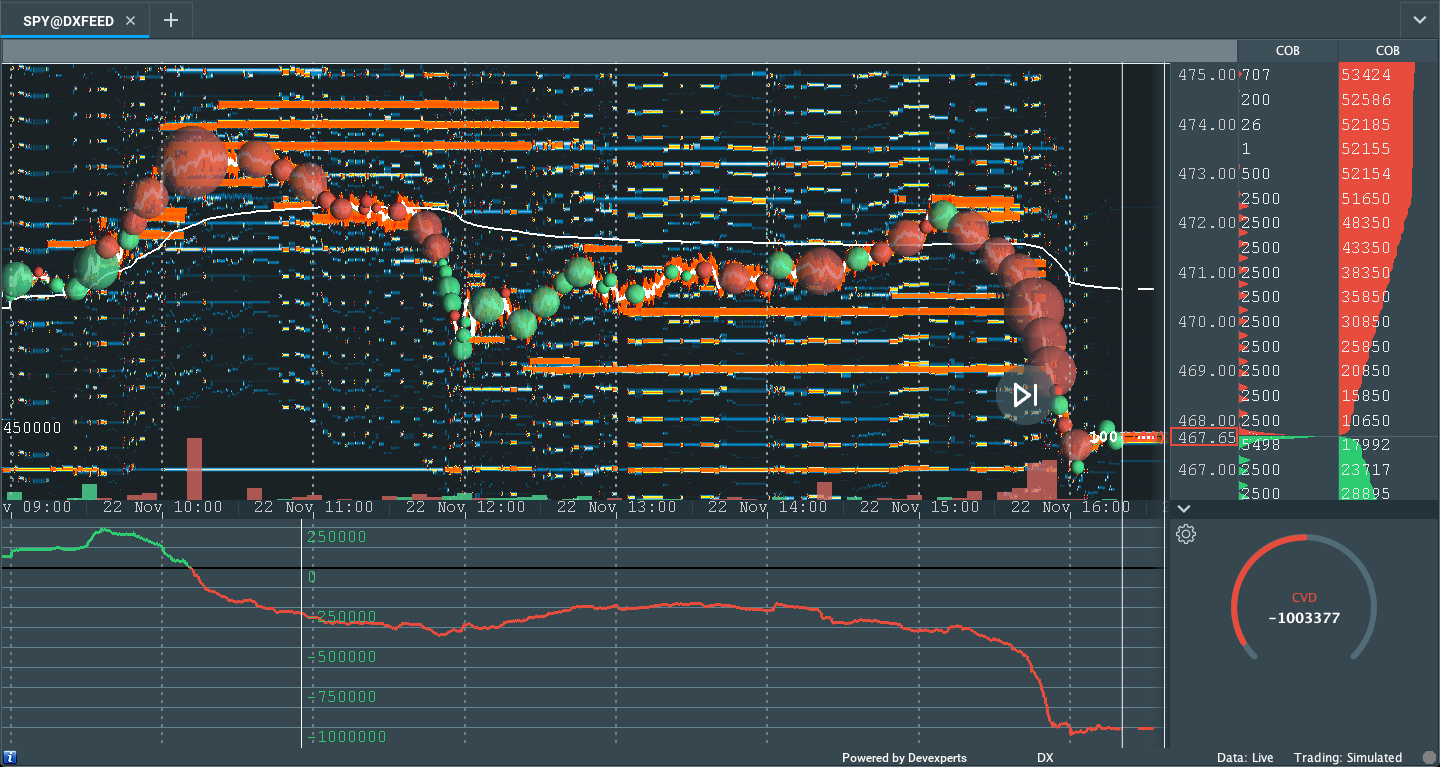
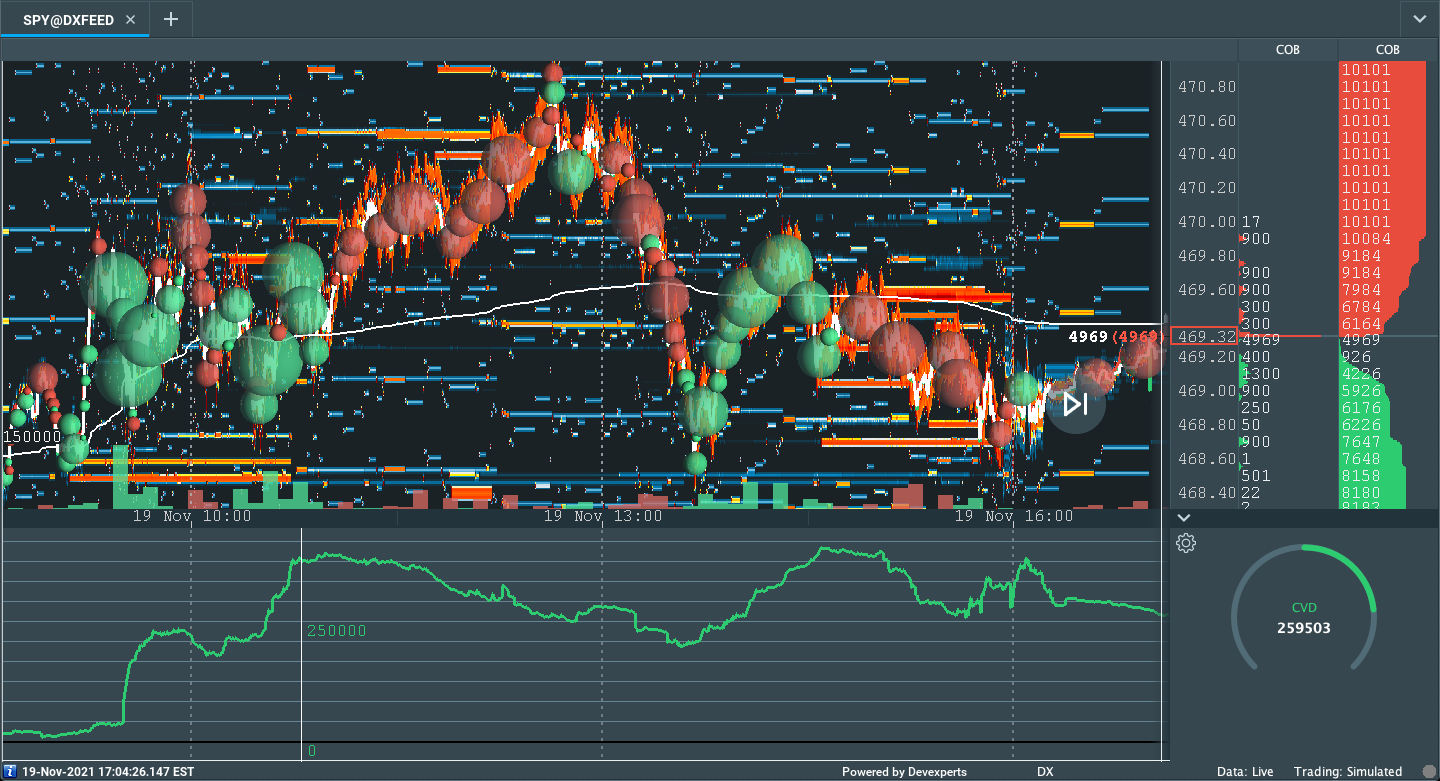
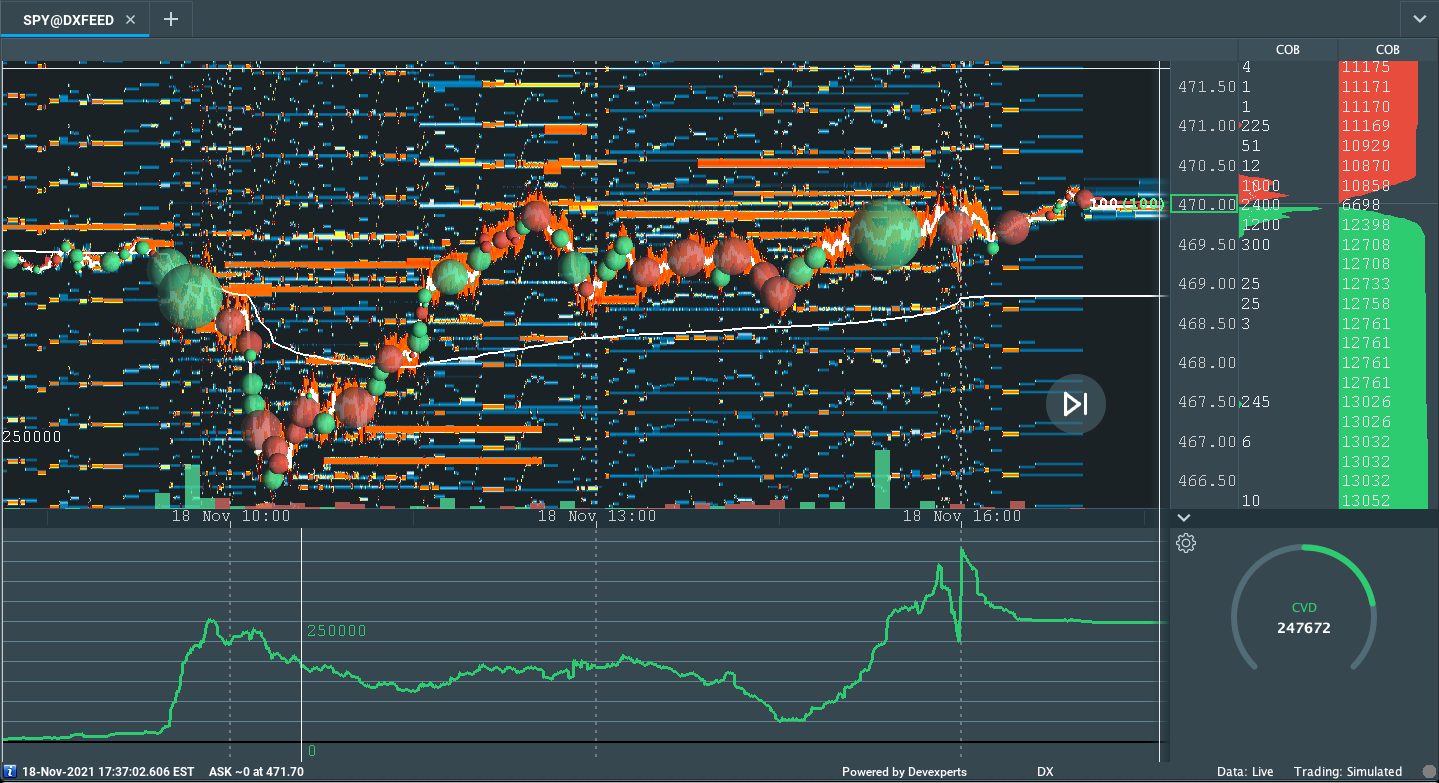
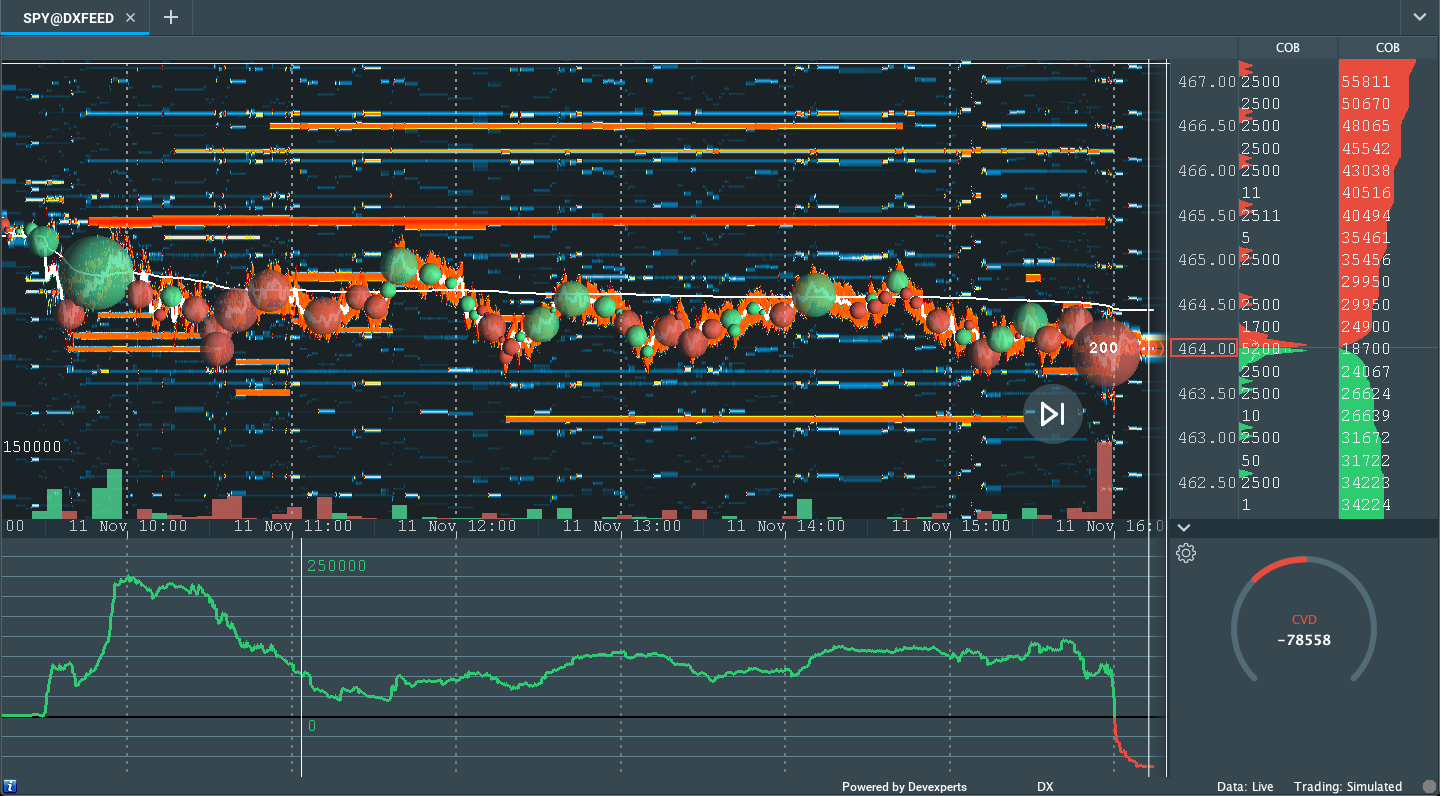
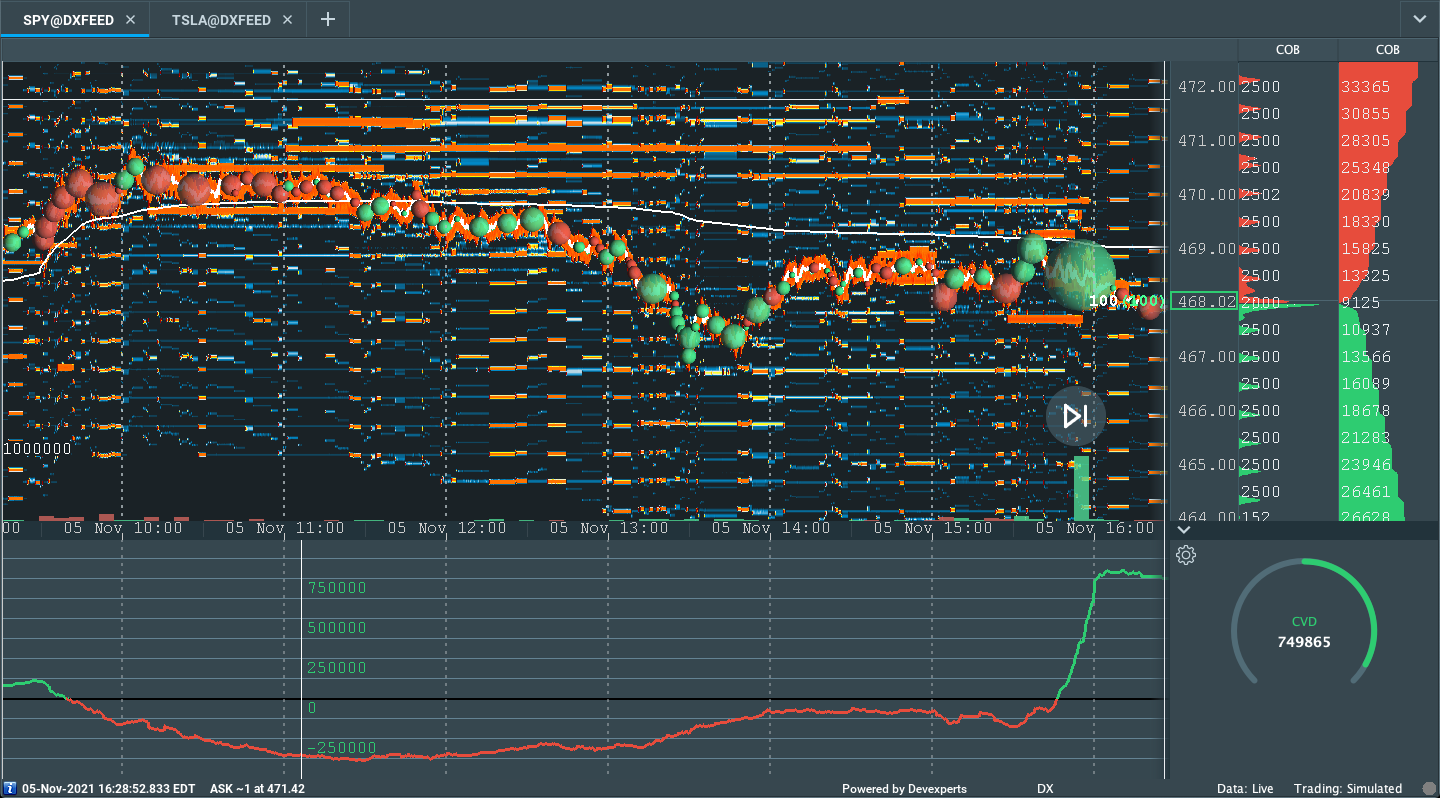
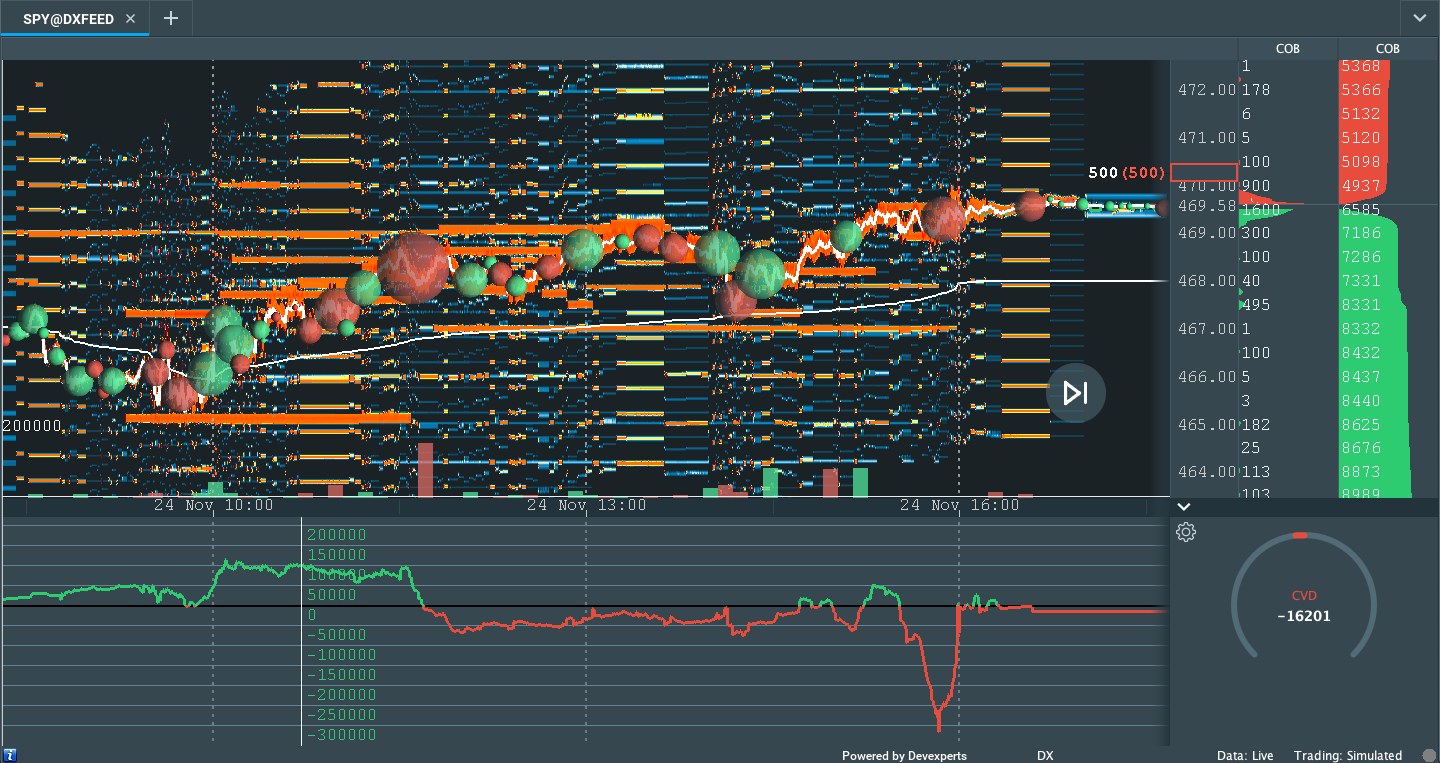
Graphic: Divergent delta (i.e., non-committed selling as measured by volume delta or buying and selling power as calculated by the difference in volume traded at the bid and offer) in SPDR S&P 500 ETF Trust (NYSE: SPY), one of the largest ETFs that track the S&P 500 index.

Context: A resurgence in the COVID-19 coronavirus as an improvement in macroeconomic conditions prompts a hawkish shift from the Federal Reserve (Fed). 

“Many risky asset tailwinds in 2021 are turning into at least mild headwinds in 2022,” Nordea says. “Economic growth should decelerate, liquidity conditions are deteriorating, profit margins should be under pressure from rising costs and question marks regarding the Fed/ECB put will arise due to elevated inflation indicators. To us, this spells higher volatility.”

Moreover, for the past two years, almost, equities rallied amidst an acceleration in growth, which is typically correlated with equity outperformance over bonds.
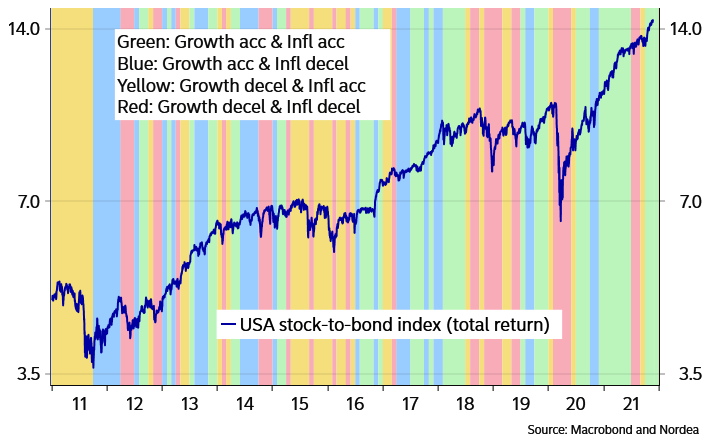
Graphic: Accelerating growth correlates with equity outperformance over bonds.

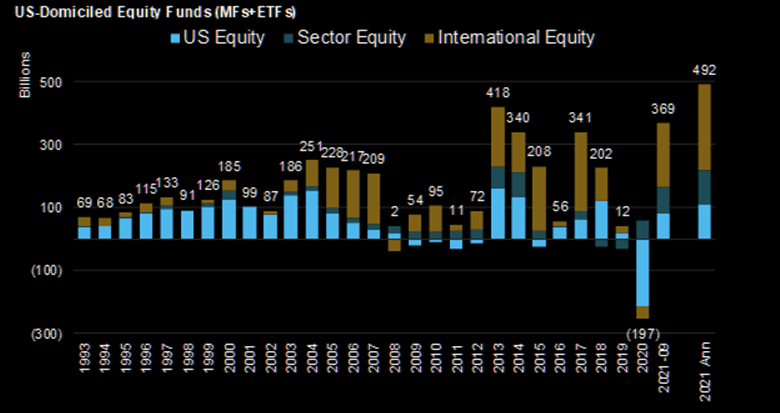
At the same time, there’s been an insatiable appetite for stocks, according to Bloomberg, with investors pouring “almost $900 billion into equity exchange-traded and long-only funds in 2021 — exceeding the combined total from the past 19 years.”

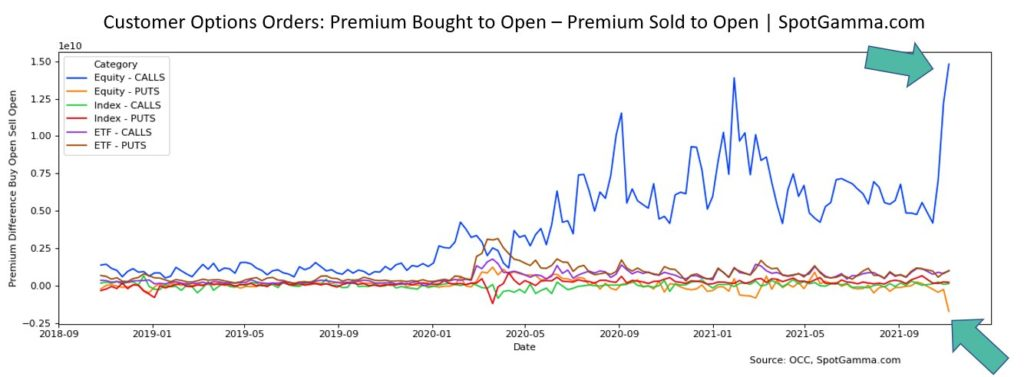
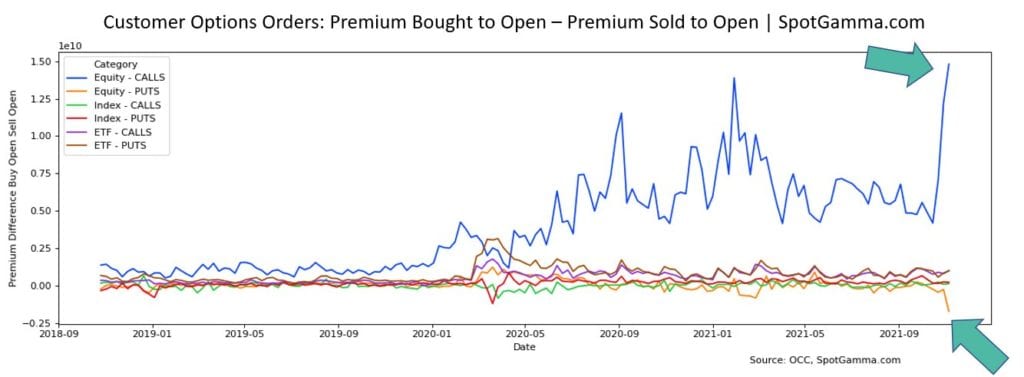
This appetite for risk fed into the activity of some high-flyers like Tesla Inc (NASDAQ: TSLA) with customers, at least in the past weeks, opting to aggressively sell puts and buy calls heading into the November monthly options expiration (OPEX).
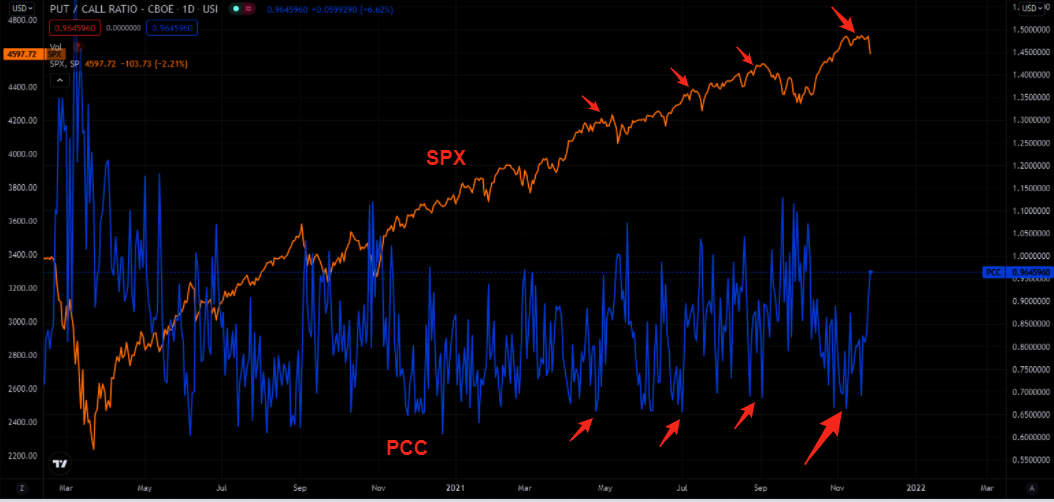
Graphic: Per The Market Ear, participants were hating on downside protection for weeks.

Unfortunately, (1) after OPEX, the absence of sticky and supportive hedging flows freed the broader market for directional resolve, and (2) according to SpotGamma, in light of recent exuberance, “participants [were] underexposed to downside put protection.”
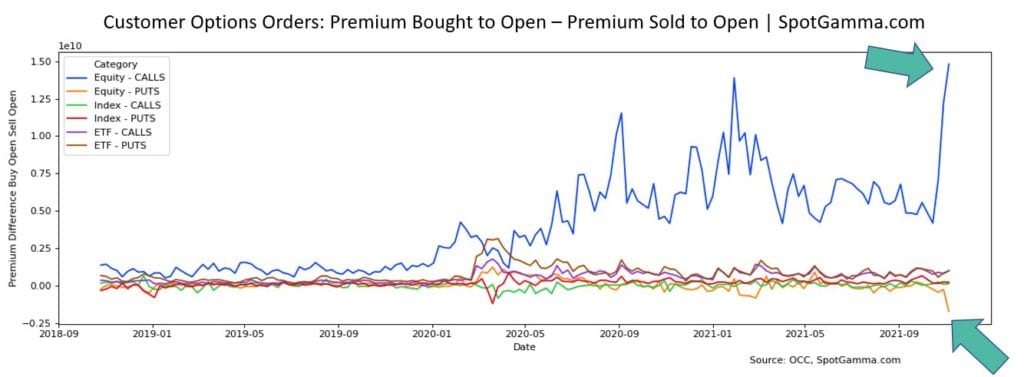
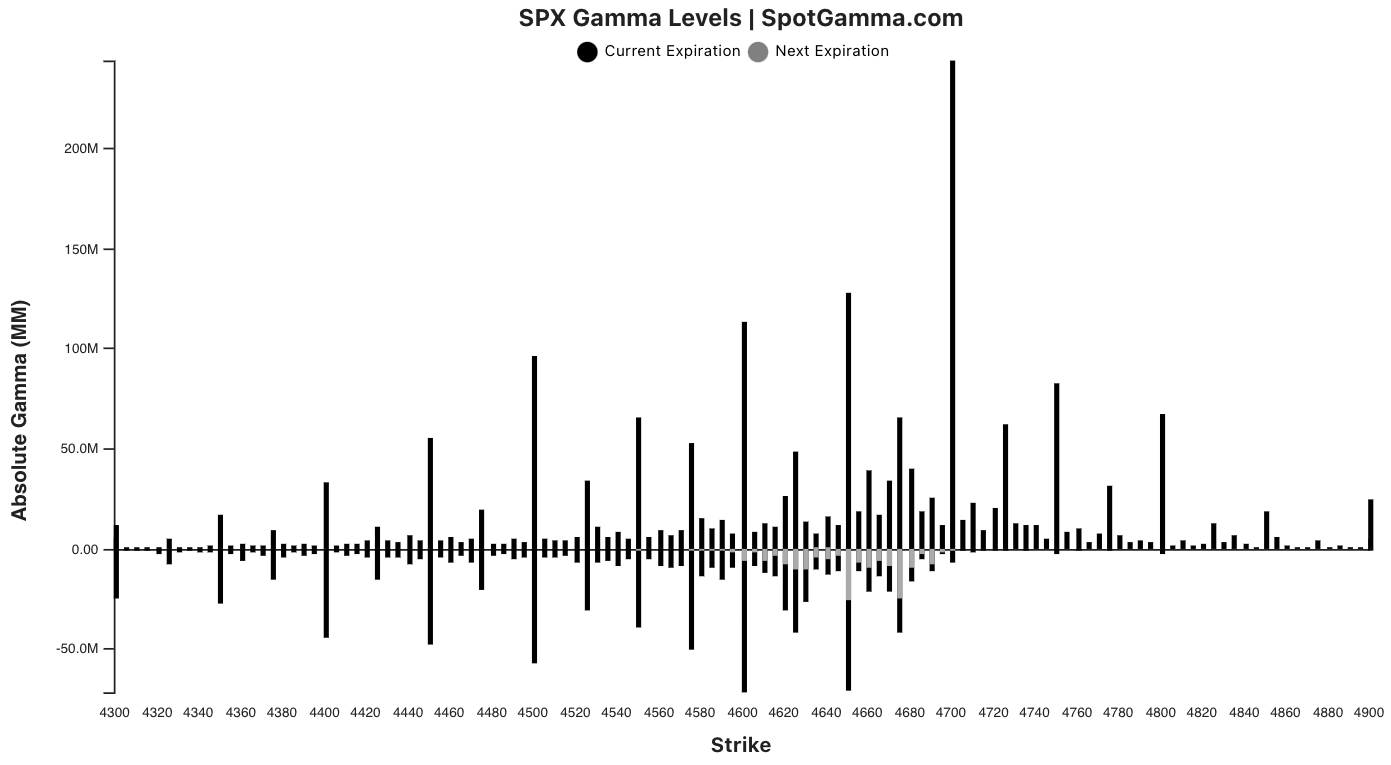
Graphic: Customers took on significant leverage in their purchase and sale of options, via SpotGamma.

What this meant was that after OPEX’s unpinning and increase in correlation, fundamental contexts were to matter more.

Therefore, the Fed’s “increased openness to accelerat[e] the taper pace” and hike rates, alongside fresh travel restrictions on a new COVID-19 variant, as well as holiday illiquidity, resulted in a rough re-pricing of tail risk as participants sought after those highly “convex” options which had counterparties exacerbating underlying price movement.
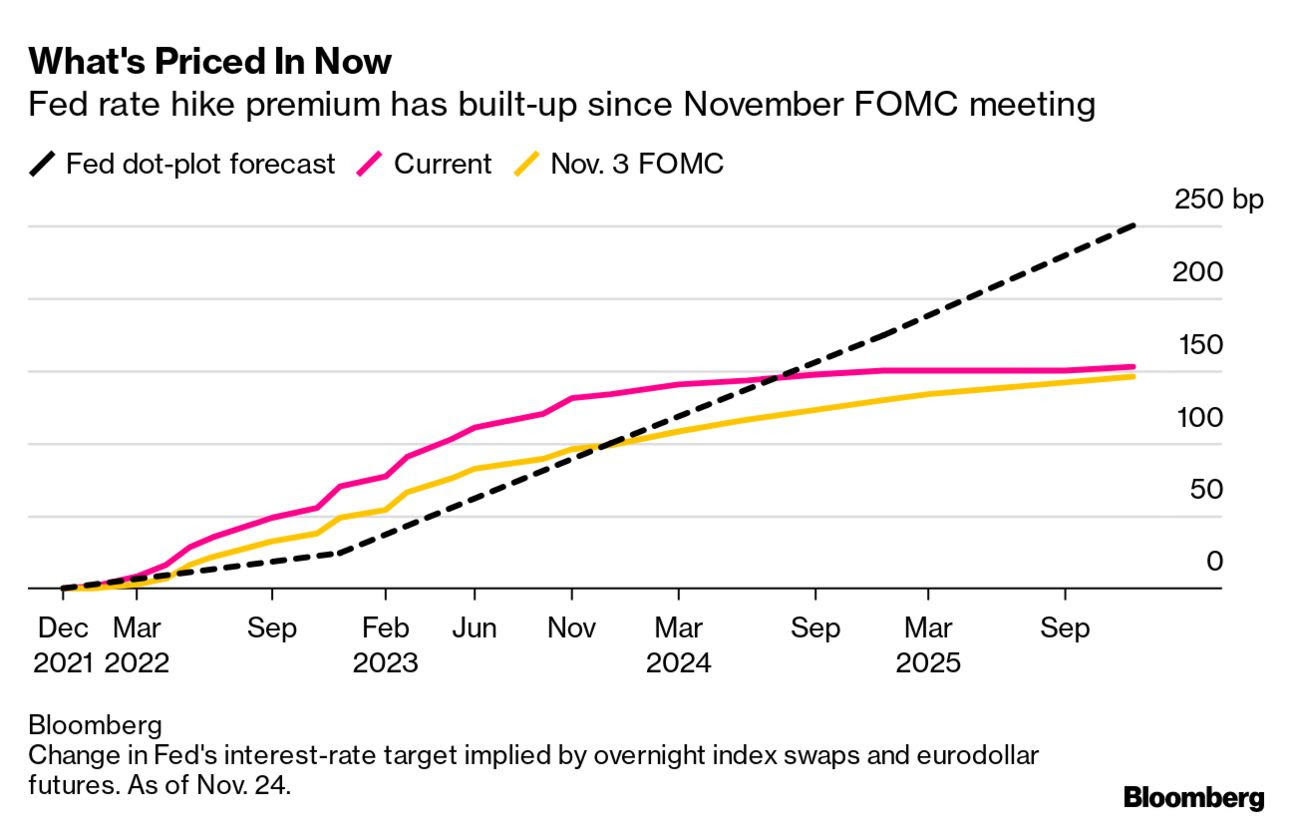
Graphic: According to Bloomberg, markets price “a full quarter-point rate hike into the June Fed meeting with a second by September and a third by December.”

To elaborate, in short, was volatility to pick up, those participants (who were once exuberant) were likely to reach for protection forcing dealers to reflexively hedge in a destabilizing manner. 

Dealers is the term used to describe those participants that take the other side and warehouse customer options risk, at least in the case where orders can’t be matched between customers.

With that, as volatility rose and customers demanded protection, counterparties hedged by selling into weakness. The conditions worsened when much of the activity was concentrated in shorter-dated tenors where the sensitivity of options to direction is higher if we will.
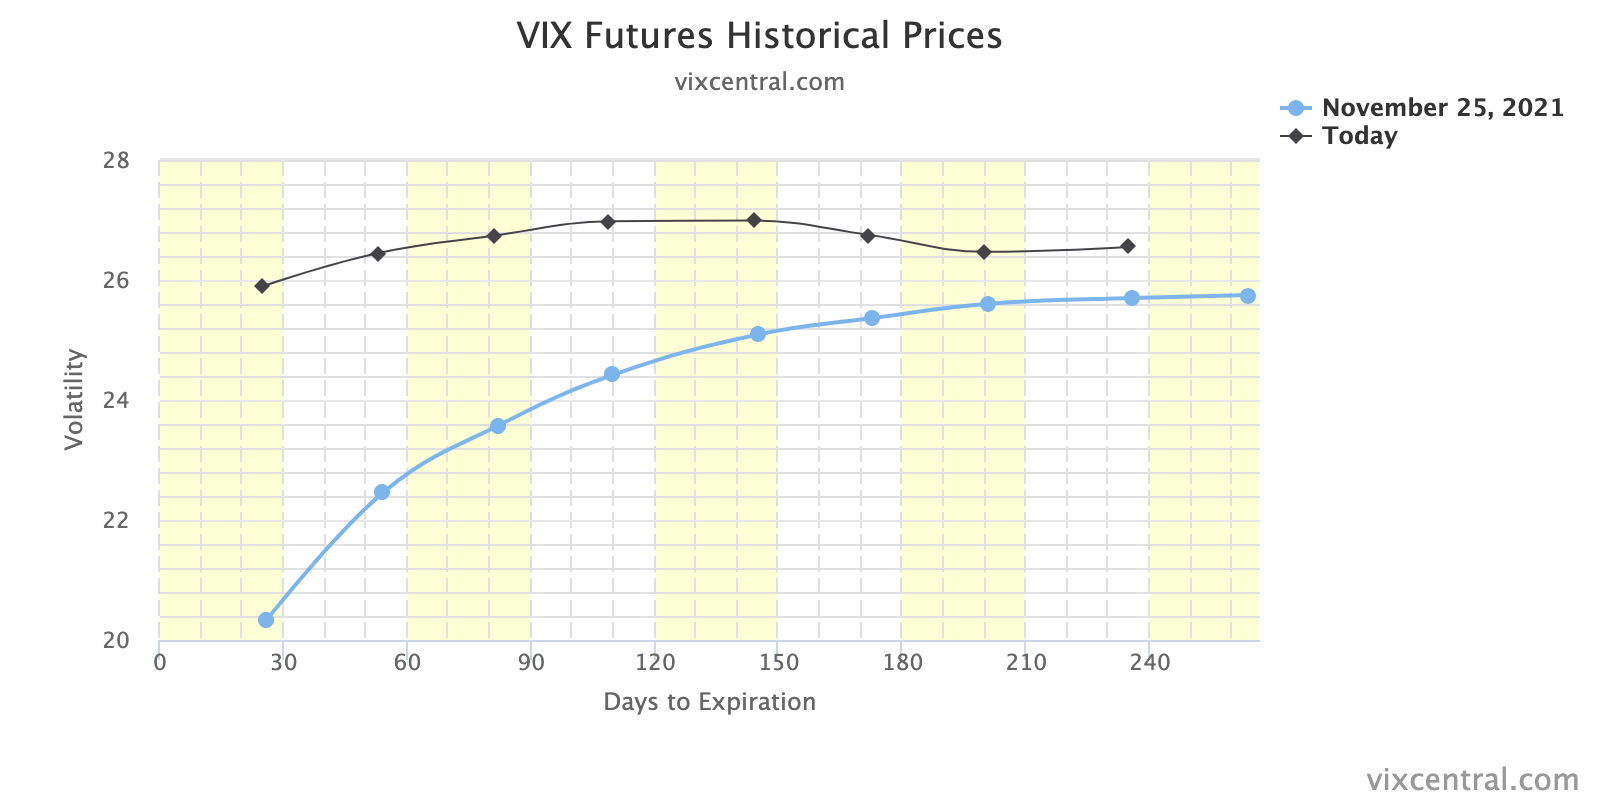
Graphic: VIX term structure. Backwardation signals an entry into an unstable environment.

Once that short-dated protection rolls off the table (and/or is monetized), dealers will reverse and support the market, buying to close their existing stock/futures hedges.

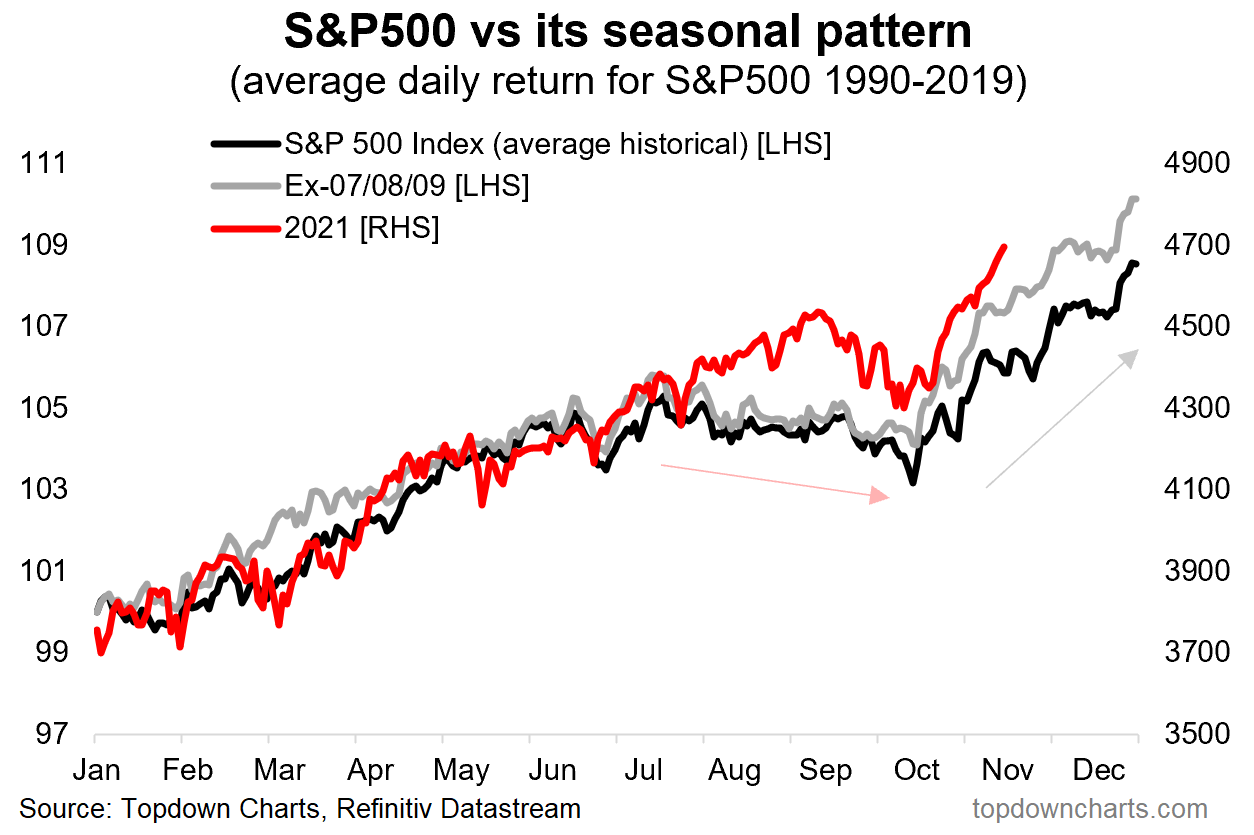
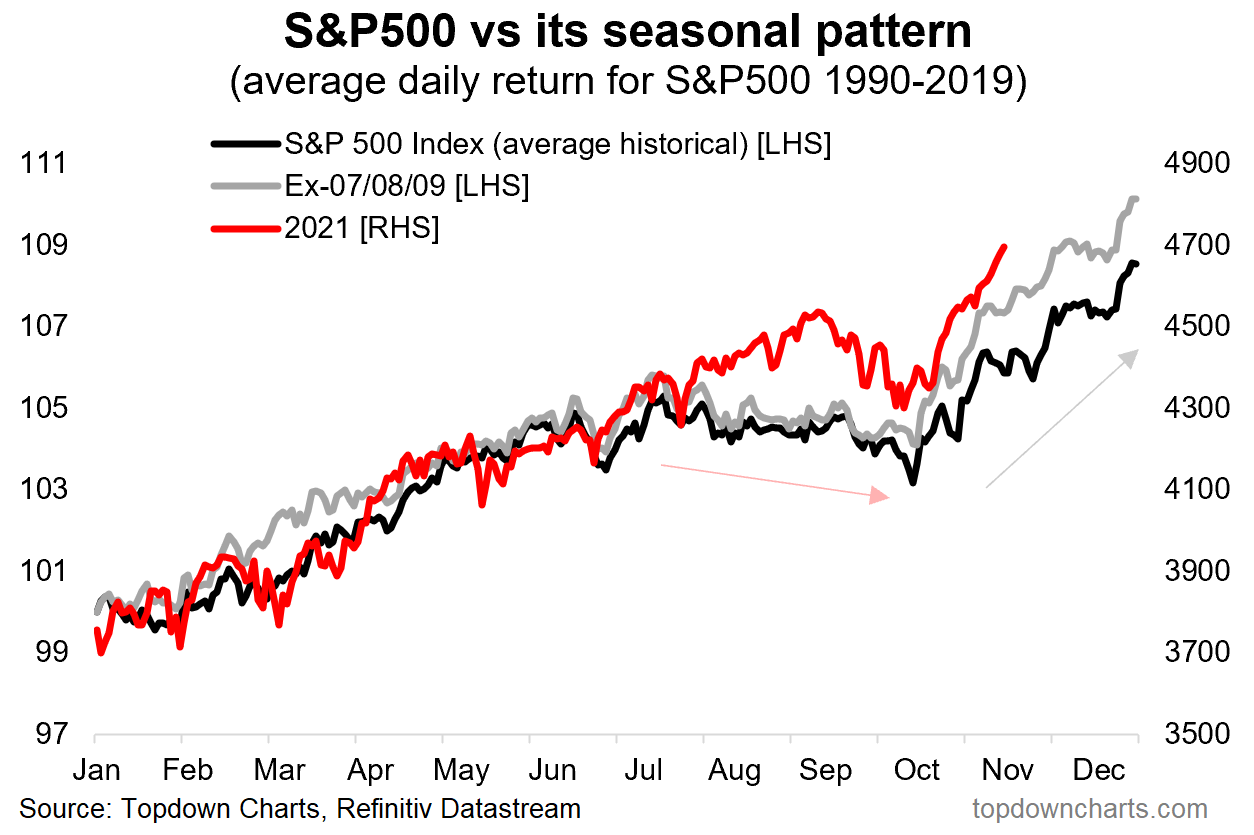
This flow is stabilizing and may play into a seasonally-aligned rally into Christmas as participants see defenses rolled out against the new COVID-19 variant, and the positive effects of pro-cyclical inflation and economic growth, improvements in global trade, and continuity at the Fed, among other dynamics, play out.

We see participants opportunistically buying the dip, already, via metrics like DIX that’s derived from liquidity provision on the market-making side.

Expectations: As of 6:00 AM ET, Monday’s regular session (9:30 AM – 4:00 PM ET), in the S&P 500, will likely open in the middle part of a positively skewed overnight inventory, inside of prior-range and -value, suggesting a limited potential for immediate directional opportunity.

In the best case, the S&P 500 trades sideways or higher; activity above the $4,618.75 high volume area (HVNode) puts in play the $4,647.25 HVNode. Initiative trade beyond the latter HVNode could reach as high as the $4,674.25 micro composite point of control (MCPOC) and $4,691.25 HVNode, or higher.

In the worst case, the S&P 500 trades lower; activity below the $4,618.75 HVNode puts in play the $4,590.00 balance boundary (BAH). Initiative trade beyond the BAH could reach as low as the $4,574.25 HVNode and $4,551.75 LVNode, or lower.

Click here to load today’s updated key levels into the web-based TradingView charting platform. Note that all levels are derived using the 65-minute timeframe. New links are produced, daily.
Graphic: 65-minute profile chart of the Micro E-mini S&P 500 Futures. Learn about the profile.

Charts To Watch

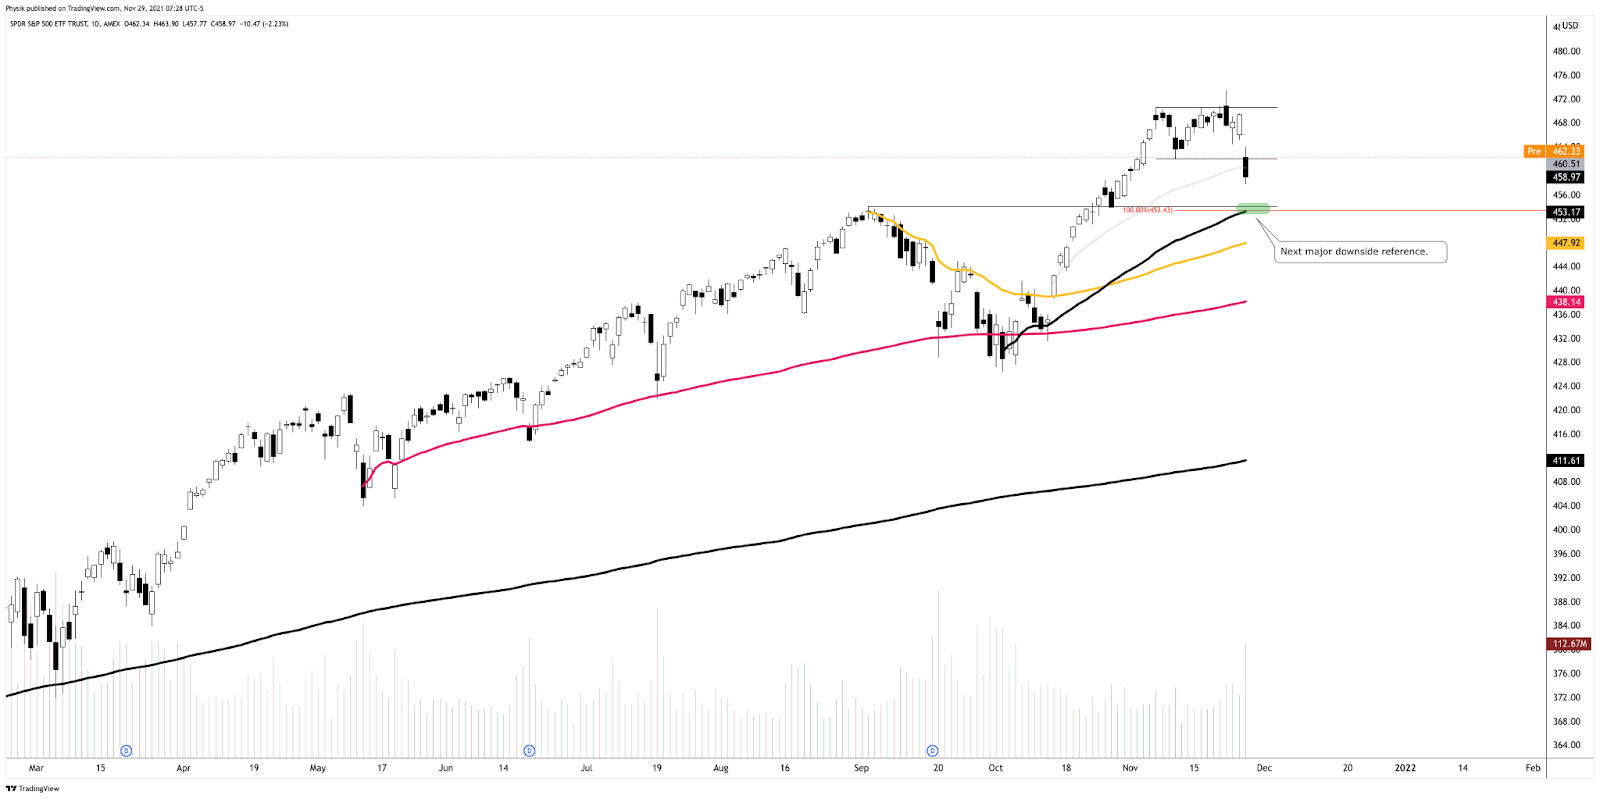
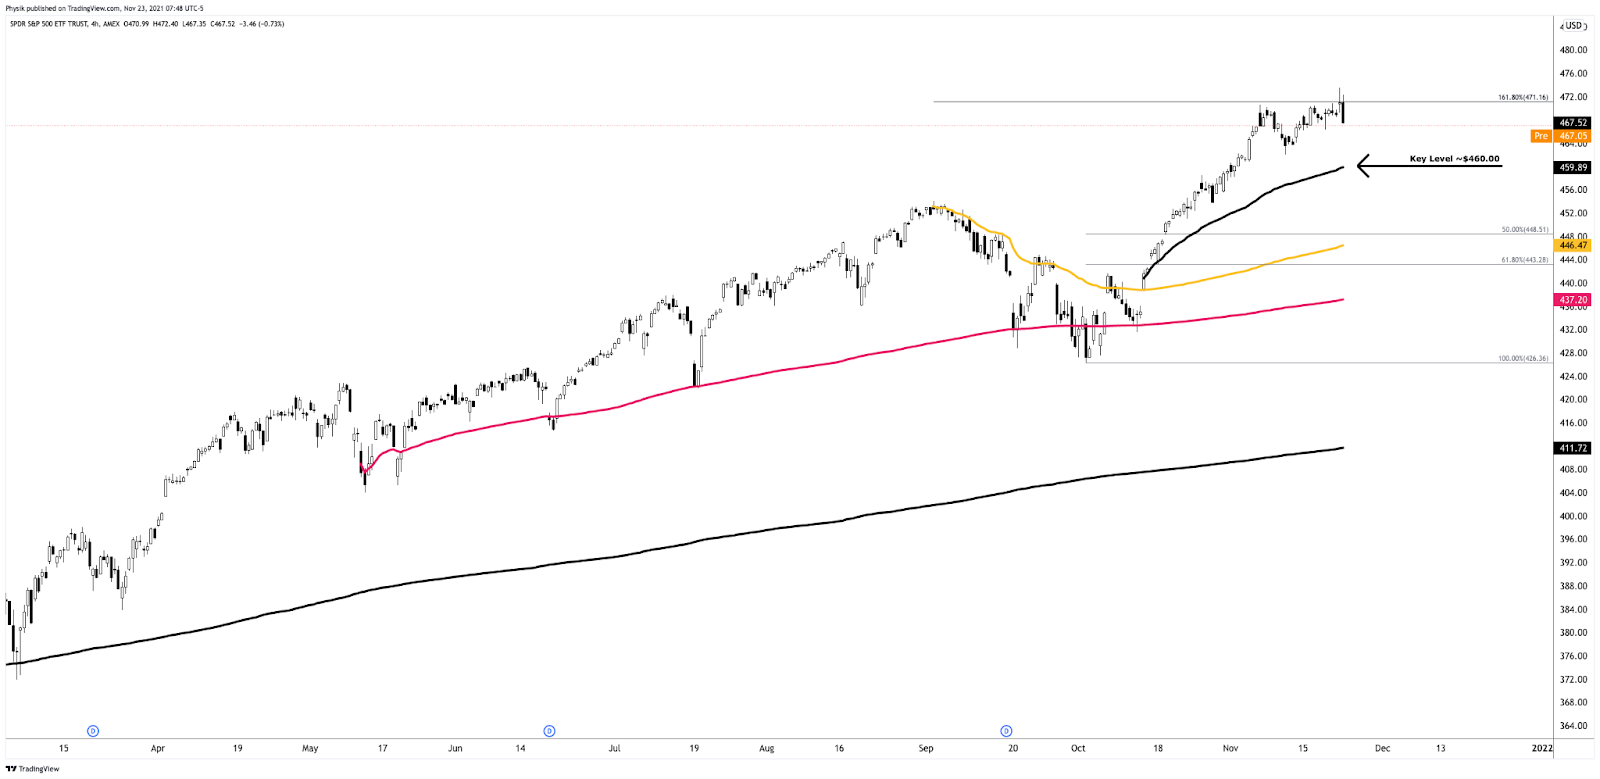
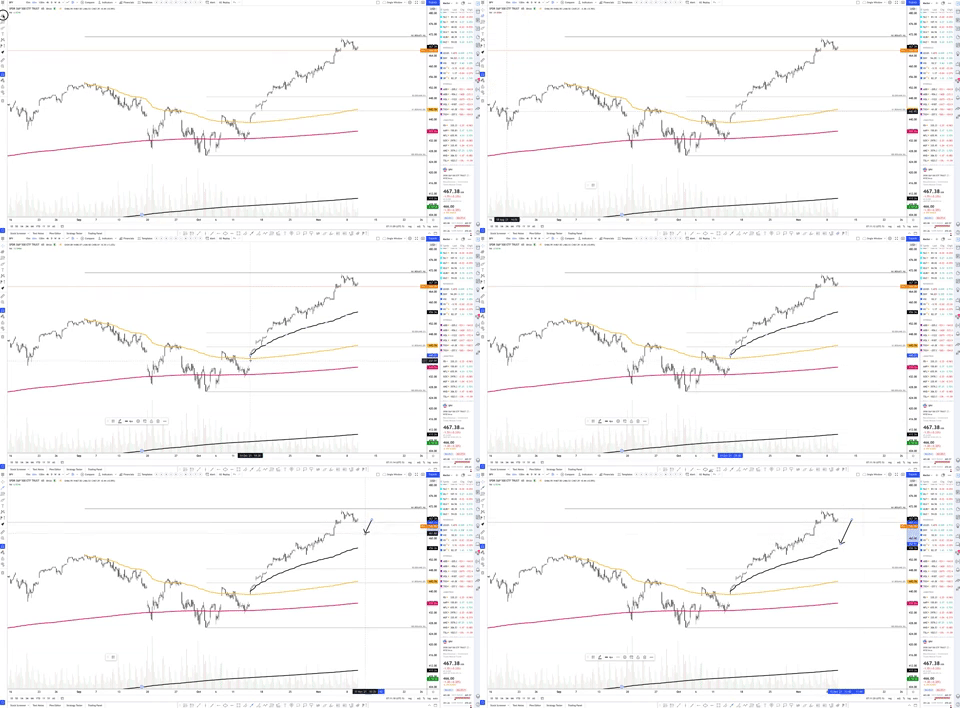
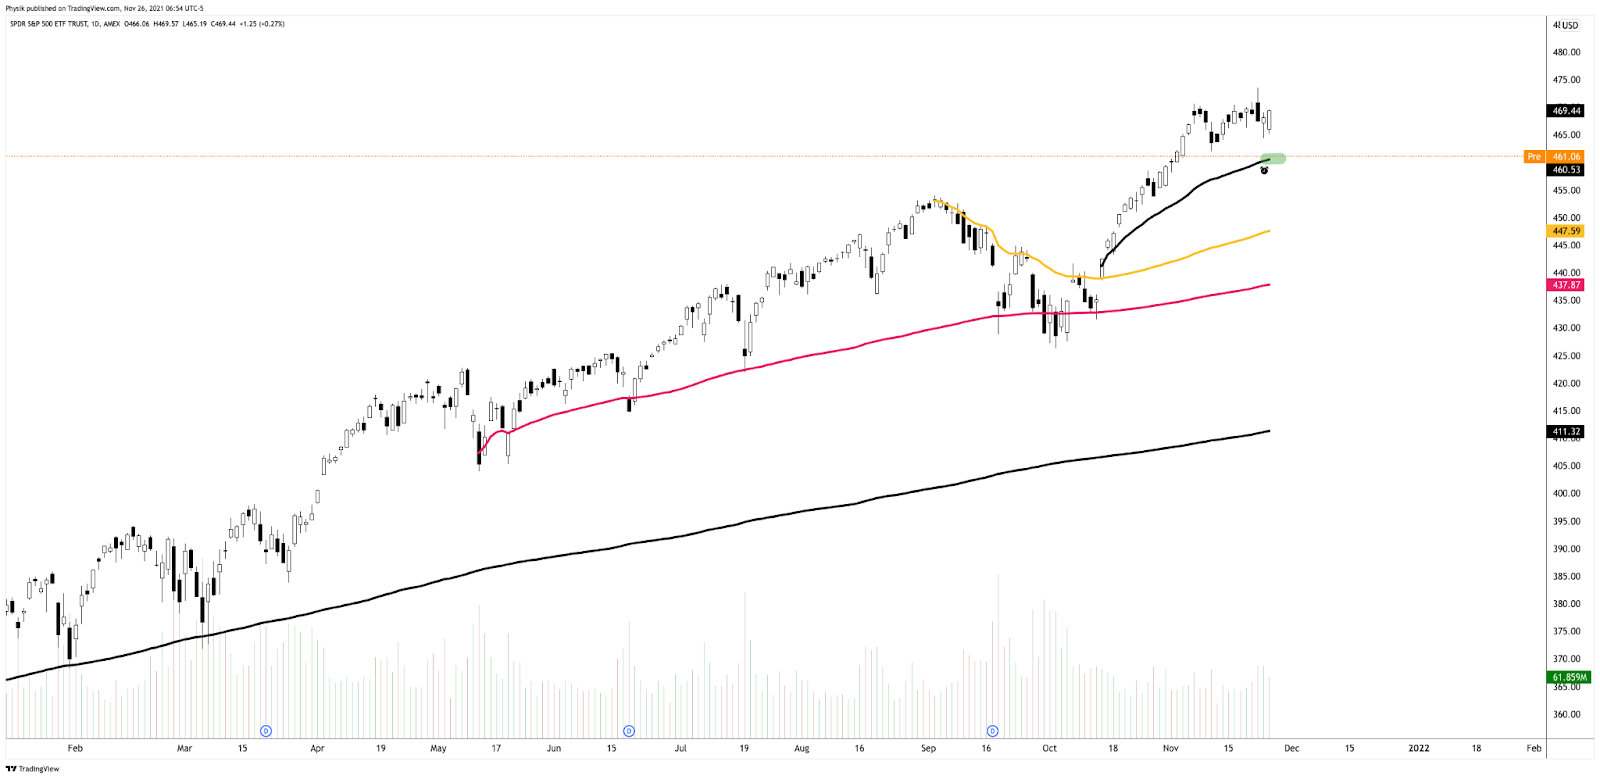
Graphic: (NYSE: SPY). (S~$460 and $453). S is for support.
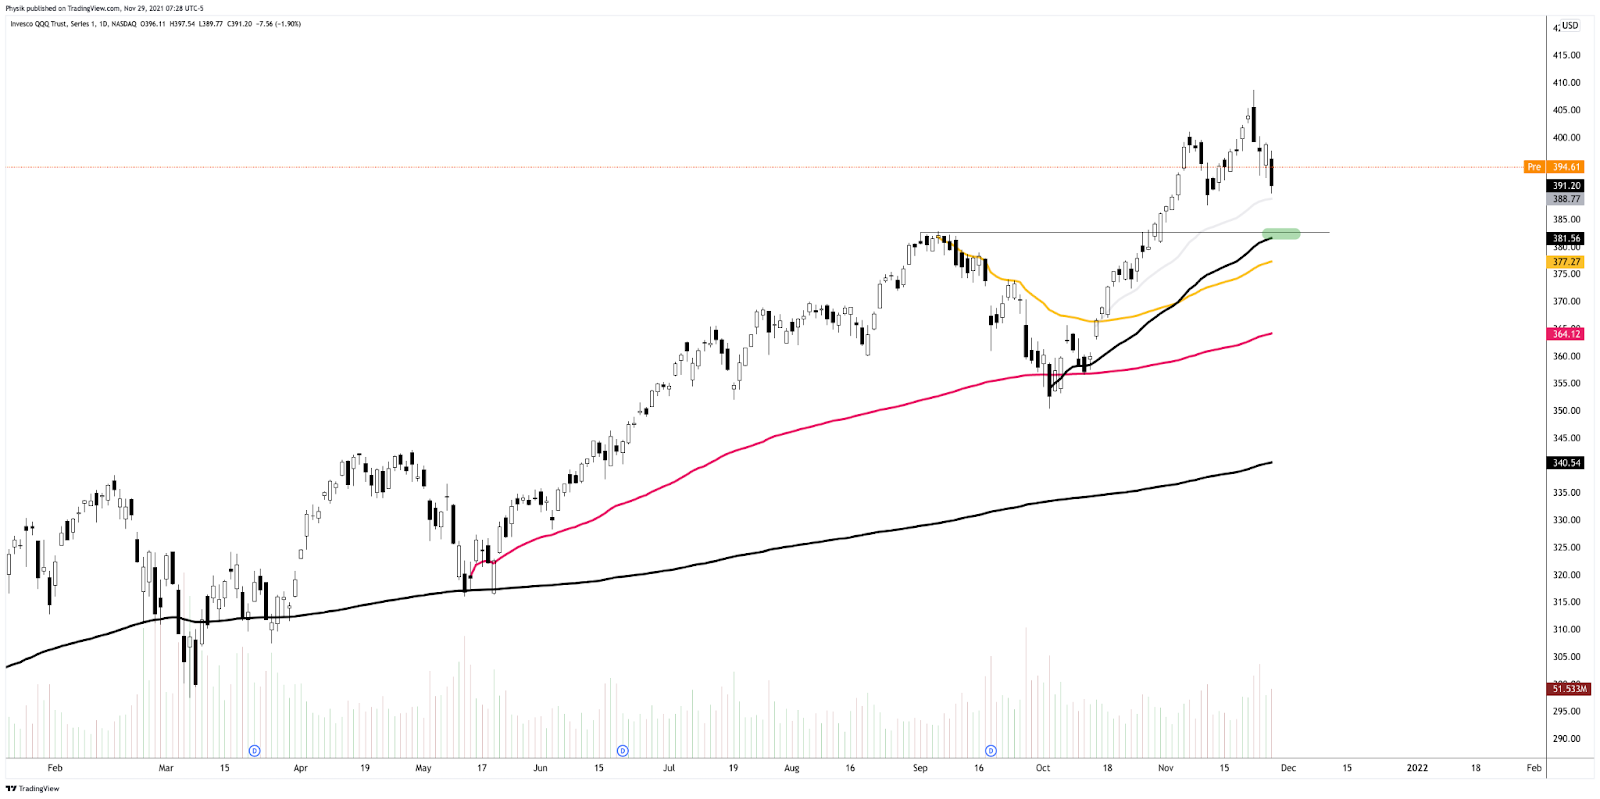
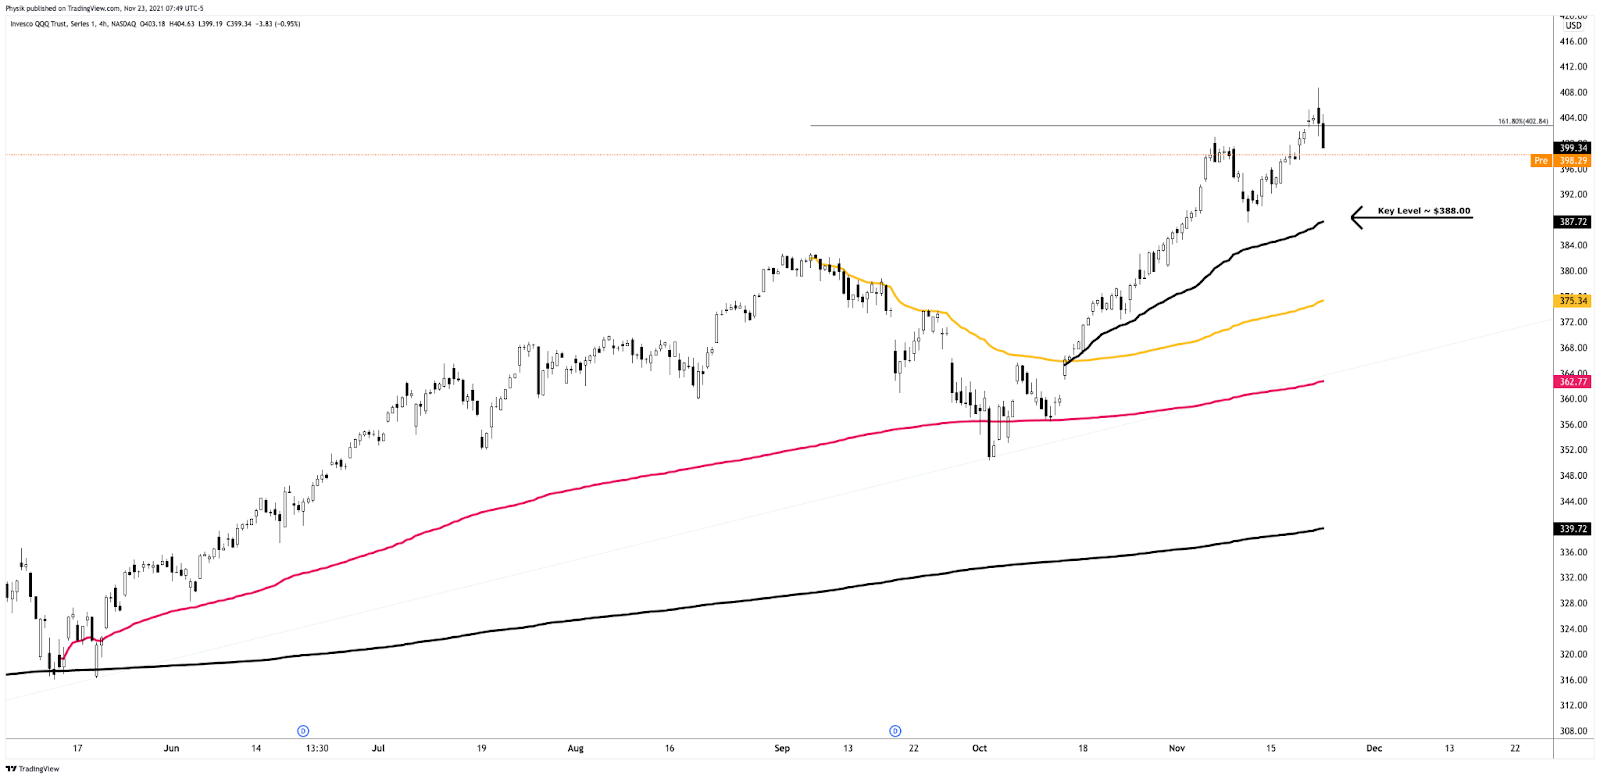
Graphic: (NASDAQ: QQQ). (S~$389 and $381). S is for support.
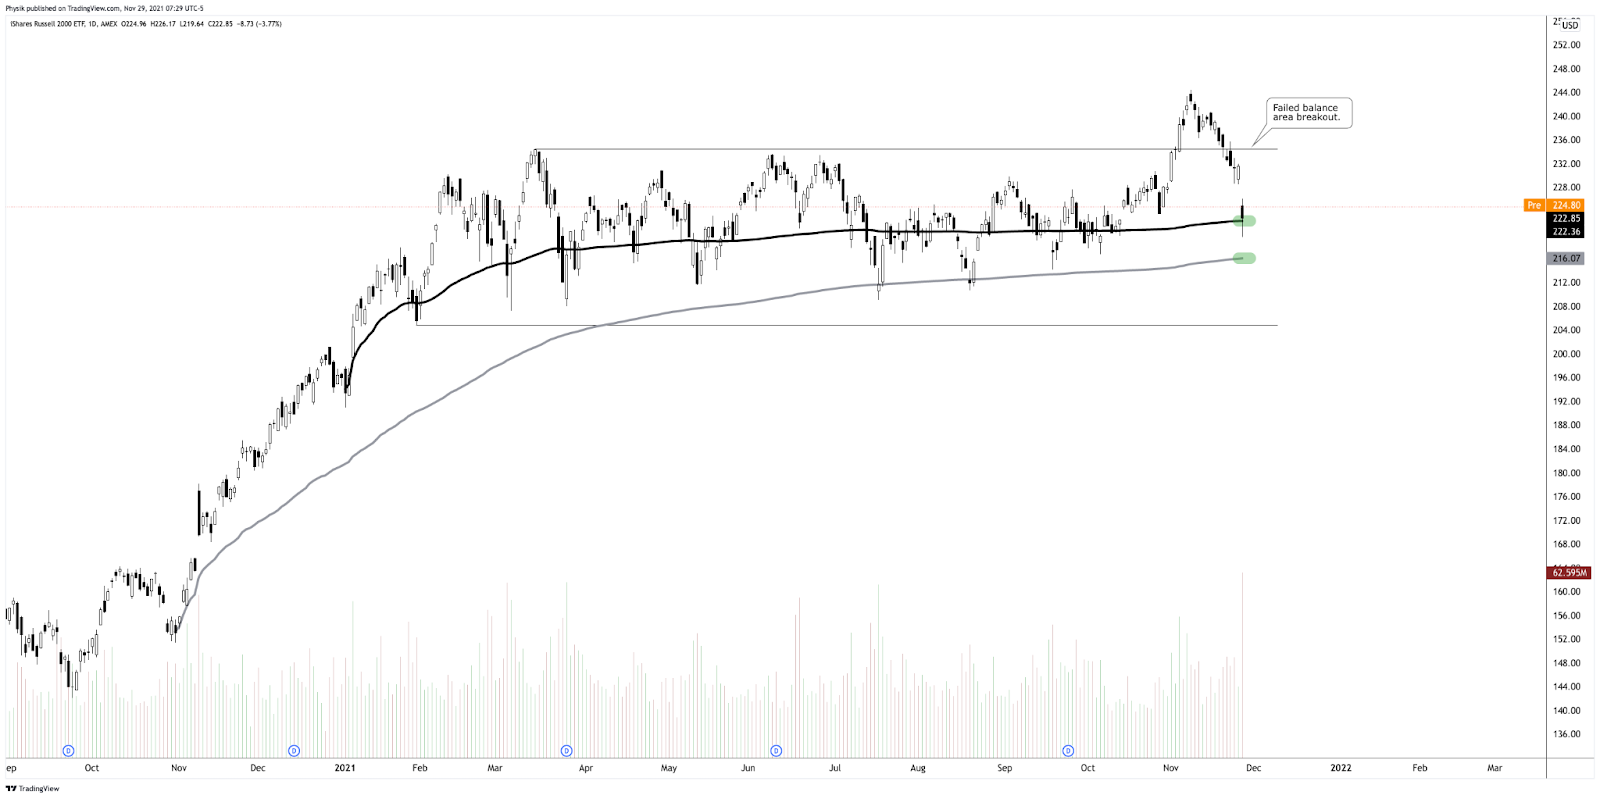
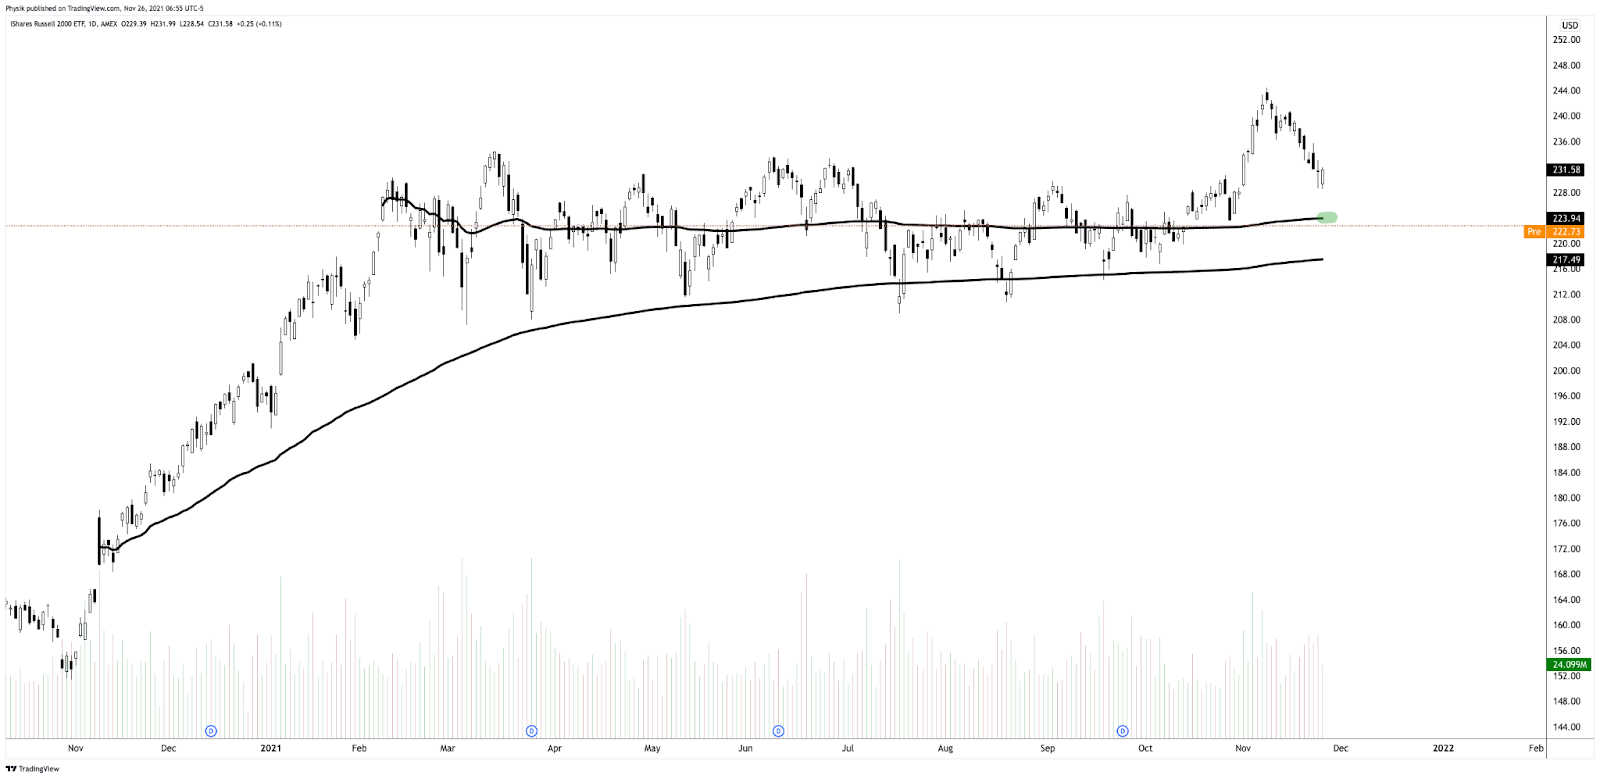
Graphic: (NYSE: IWM). (S~$222 and $216). S is for support.

What People Are Saying

Definitions

Overnight Rally Highs (Lows): Typically, there is a low historical probability associated with overnight rally-highs (lows) ending the upside (downside) discovery process.

Volume Areas: A structurally sound market will build on areas of high volume (HVNodes). Should the market trend for long periods of time, it will lack sound structure, identified as low volume areas (LVNodes). LVNodes denote directional conviction and ought to offer support on any test. 

If participants were to auction and find acceptance into areas of prior low volume (LVNodes), then future discovery ought to be volatile and quick as participants look to HVNodes for favorable entry or exit.

Gamma: Gamma is the sensitivity of an option to changes in the underlying price. Dealers that take the other side of options trades hedge their exposure to risk by buying and selling the underlying. When dealers are short-gamma, they hedge by buying into strength and selling into weakness. When dealers are long-gamma, they hedge by selling into strength and buying into weakness. The former exacerbates volatility. The latter calms volatility.

POCs: POCs are valuable as they denote areas where two-sided trade was most prevalent in a prior day session. Participants will respond to future tests of value as they offer favorable entry and exit.

MCPOCs: POCs are valuable as they denote areas where two-sided trade was most prevalent over numerous day sessions. Participants will respond to future tests of value as they offer favorable entry and exit.

Options Expiration (OPEX): Traditionally, option expiries mark an end to pinning (i.e, the theory that market makers and institutions short options move stocks to the point where the greatest dollar value of contracts will expire) and the reduction dealer gamma exposure.

Rates: Low rates have to potential to increase the present value of future earnings making stocks, especially those that are high growth, more attractive. To note, inflation and rates move inversely to each other. Low rates stimulate demand for loans (i.e., borrowing money is more attractive).

About

After years of self-education, strategy development, and trial-and-error, Renato Leonard Capelj began trading full-time and founded Physik Invest to detail his methods, research, and performance in the markets.

Additionally, Capelj is a Benzinga finance and technology reporter interviewing the likes of Shark Tank’s Kevin O’Leary, JC2 Ventures’ John Chambers, and ARK Invest’s Catherine Wood, as well as a SpotGamma contributor, developing insights around impactful options market dynamics.

Disclaimer

At this time, Physik Invest does not manage outside capital and is not licensed. In no way should the materials herein be construed as advice. Derivatives carry a substantial risk of loss. All content is for informational purposes only.

Categories
Commentary

Daily Brief For Black Friday 2021

What Happened

Ahead of a shortened holiday session, equity index futures auctioned lower alongside the narrative of a resurgence in the COVID-19 coronavirus. 

Most affected appears the Russell 2000 which was down nearly 4.00%, at the time of this writing. The S&P 500 was off about 2.00% or so, buoyed by the innovation- and tech-heavy Nasdaq 100 which was only down about 1.00%. 

This shift in relative strength comes as the ten-year yield sits lower about 8.00%. The CBOE Volatility Index (INDEX: VIX) was up over 40.00% and the implications of this are staggering, given the underhedged market I talked about over the past sessions.

Moreover, there are no scheduled economic releases, today.

Graphic updated 6:00 AM ET. Sentiment Risk-Off if expected /ES open is below the prior day’s range. /ES levels are derived from the profile graphic at the bottom of the following section. Levels may have changed since initially quoted; click here for the latest levels. SqueezeMetrics Dark Pool Index (DIX) and Gamma (GEX) calculations are based on where the prior day’s reading falls with respect to the MAX and MIN of all occurrences available. A higher DIX is bullish. At the same time, the lower the GEX, the more (expected) volatility. Learn the implications of volatility, direction, and moneyness. SHIFT data used for S&P 500 (INDEX: SPX) options activity. Note that options flow is sorted by the call premium spent; if more positive then more was spent on call options. Breadth reflects a reading of the prior day’s NYSE Advance/Decline indicator. VIX reflects a current reading of the CBOE Volatility Index (INDEX: VIX) from 0-100.

What To Expect

On Wednesday’s lackluster breadth and market liquidity metrics, the best case occurred. 

The S&P 500 recovered its $4,697.50 spike base, below which selling activity appeared to be the result of weaker-handed participants liquidating as a result of poor location and news.

Overnight, however, the tone shifted. The S&P 500 initiated back through its $4,647.25 high volume area (HVNode) which had corresponded with the 20-day simple moving average.

The 20-day presented participants with a clear way to measure risk, given the mechanical responses in prior trade. As explained, Wednesday, should participants manage to break past the 20-day, then conditions have changed and follow-through was likely

Reason being? Those visual levels are acted on by short-term, technically-driven participants who generally are unable to defend retests.

Graphic: Divergent delta (i.e., non-committed buying as measured by volume delta or buying and selling power as calculated by the difference in volume traded at the bid and offer) in SPDR S&P 500 ETF Trust (NYSE: SPY), one of the largest ETFs that track the S&P 500 index, via Bookmap. The readings were supportive of responsive trade (i.e., rotational trade that suggests current prices did not offer favorable entry and exit; the market was in balance).

Context: The aforementioned trade is happening in the context of an “insatiable appetite for stocks this year,” as Bloomberg explains

“Investors have poured almost $900 billion into equity exchange-traded and long-only funds in 2021 — exceeding the combined total from the past 19 years.”

This appetite fed into the activity of some high-flyers like Tesla Inc (NASDAQ: TSLA) with customers opting to aggressively sell puts and buy calls heading into the November monthly options expiration (OPEX).

Graphic: Customers took on significant leverage in their purchase and sale of options, via SpotGamma.

Unfortunately, (1) after OPEX, the absence of sticky and supportive hedging flows freed the broader market for directional resolve, and (2) according to SpotGamma, in light of recent exuberance, “participants [were] underexposed to downside put protection.”

The implications of the latter are staggering.

In short, should volatility continue to pick up, those participants (who were once exuberant) are likely to reach for protection forcing dealers to reflexively hedge in a destabilizing manner. 

As volatility rises and customers demand protection, counterparties are to hedge by selling into weakness. The conditions worsen when much of the activity is in shorter-dated tenors where options gamma is more sensitive if we will. This is what we’re seeing.

Graphic: The CBOE Volatility Index (INDEX: VIX) was higher, while demand came in most predominantly across the entire area of the VIX futures term structure. That, alongside the market’s entry into short-gamma, suggests participants’ hedging has destabilizing implications.

Note that I said short-dated

Once that exposure rolls off the table (and/or is monetized), dealers/counterparties will reverse and support the market, buying-to-close their existing stock/futures hedges to negative gamma positions. 

This flow is stabilizing and may play into a seasonally-aligned rally into Christmas.

As stated on November 23, 2021: “This last part is educated conjecture. It’s what I also feel as though would frustrate the most amount of participants. Basically, a quick wash (or sideways to lower), followed by a move higher into year-end. Be nimble and responsive!”

Expectations: As of 6:00 AM ET, Friday’s regular session (9:30 AM – 1:00 PM ET), in the S&P 500, will likely open in the lower part of a negatively skewed overnight inventory, outside of prior-range and -value, suggesting a potential for immediate directional opportunity.

Gap Scenarios Are In Play: Gaps ought to fill quickly. Should they not, that’s a signal of strength; do not fade. Leaving value behind on a gap-fill or failing to fill a gap (i.e., remaining outside of the prior session’s range) is a go-with indicator.

Auctioning and spending at least 1-hour of trade back in the prior range suggests a lack of conviction; in such a case, do not follow the direction of the most recent initiative activity.

In the best case, the S&P 500 trades sideways or higher; activity above the $4,618.75 high volume area (HVNode) puts in play the $4,647.25 HVNode. Initiative trade beyond the latter HVNode could reach as high as the $4,674.25 micro composite point of control (MCPOC) and $4,691.25 HVNode, or higher.

In the worst case, the S&P 500 trades lower; activity below the $4,618.75 HVNode puts in play the $4,596.75 overnight low (ONL) and $4,590.00 balance boundary (BAH). Initiative trade beyond the BAH could reach as low as the $4,574.25 HVNode and $4,551.75 LVNode, or lower.

Click here to load today’s updated key levels into the web-based TradingView charting platform. Note that all levels are derived using the 65-minute timeframe. New links are produced, daily.
Graphic: 65-minute profile chart of the Micro E-mini S&P 500 Futures. Learn about the profile.

Charts To Watch

Graphic: (ETF: IWM). (Key VWAP support at ~$223)
Graphic: (ETF: SPY). (Key VWAP support at ~$460)
Graphic: (ETF: QQQ). (Key VWAP support at ~$388)

What People Are Saying

Definitions

Spikes: Spike’s mark the beginning of a break from value. Spikes higher (lower) are validated by trade at or above (below) the spike base (i.e., the origin of the spike).

Overnight Rally Highs (Lows): Typically, there is a low historical probability associated with overnight rally-highs (lows) ending the upside (downside) discovery process.

Volume Areas: A structurally sound market will build on areas of high volume (HVNodes). Should the market trend for long periods of time, it will lack sound structure, identified as low volume areas (LVNodes). LVNodes denote directional conviction and ought to offer support on any test. 

If participants were to auction and find acceptance into areas of prior low volume (LVNodes), then future discovery ought to be volatile and quick as participants look to HVNodes for favorable entry or exit.

Gamma: Gamma is the sensitivity of an option to changes in the underlying price. Dealers that take the other side of options trades hedge their exposure to risk by buying and selling the underlying. When dealers are short-gamma, they hedge by buying into strength and selling into weakness. When dealers are long-gamma, they hedge by selling into strength and buying into weakness. The former exacerbates volatility. The latter calms volatility.

MCPOCs: POCs are valuable as they denote areas where two-sided trade was most prevalent over numerous day sessions. Participants will respond to future tests of value as they offer favorable entry and exit.

Options Expiration (OPEX): Traditionally, option expiries mark an end to pinning (i.e, the theory that market makers and institutions short options move stocks to the point where the greatest dollar value of contracts will expire) and the reduction dealer gamma exposure.

Volume-Weighted Average Prices (VWAPs): A metric highly regarded by chief investment officers, among other participants, for quality of trade. Additionally, liquidity algorithms are benchmarked and programmed to buy and sell around VWAPs.

About

After years of self-education, strategy development, and trial-and-error, Renato Leonard Capelj began trading full-time and founded Physik Invest to detail his methods, research, and performance in the markets.

Additionally, Capelj is a Benzinga finance and technology reporter interviewing the likes of Shark Tank’s Kevin O’Leary, JC2 Ventures’ John Chambers, and ARK Invest’s Catherine Wood, as well as a SpotGamma contributor, developing insights around impactful options market dynamics.

Disclaimer

At this time, Physik Invest does not manage outside capital and is not licensed. In no way should the materials herein be construed as advice. Derivatives carry a substantial risk of loss. All content is for informational purposes only.
Categories
Commentary

Daily Brief For November 23, 2021

What Happened

Overnight, yesterday’s knee-jerk sellers were emboldened by equity index futures auctioning sideways to lower with other products – from commodities to bonds – following suit. 

The prevailing narrative is that “[I]nvestors are reducing expectations for a deeper dovish stance by the Fed after Powell got a second term.” Meaningless headlines, like this, are precisely why we, as participants, should opt to avoid making short-term decisions based on the news!

Anyways, ahead is data on Markit Manufacturing and Services PMI (9:45 AM ET).

Graphic updated 6:30 AM ET. Sentiment Risk-Off if expected /ES open is below the prior day’s range. /ES levels are derived from the profile graphic at the bottom of the following section. Levels may have changed since initially quoted; click here for the latest levels. SqueezeMetrics Dark Pool Index (DIX) and Gamma (GEX) calculations are based on where the prior day’s reading falls with respect to the MAX and MIN of all occurrences available. A higher DIX is bullish. At the same time, the lower the GEX, the more (expected) volatility. Learn the implications of volatility, direction, and moneyness. SHIFT data used for S&P 500 (INDEX: SPX) options activity. Note that options flow is sorted by the call premium spent; if more positive then more was spent on call options. Breadth reflects a reading of the prior day’s NYSE Advance/Decline indicator. VIX reflects a current reading of the CBOE Volatility Index (INDEX: VIX) from 0-100.

What To Expect

On weak intraday breadth and market liquidity metrics, the worst-case outcome occurred, evidenced by a spike below prices most recently accepted by S&P 500 traders.

Such activity denotes an obvious change in tone, as well as a potential willingness to start a trend in the opposite direction. 

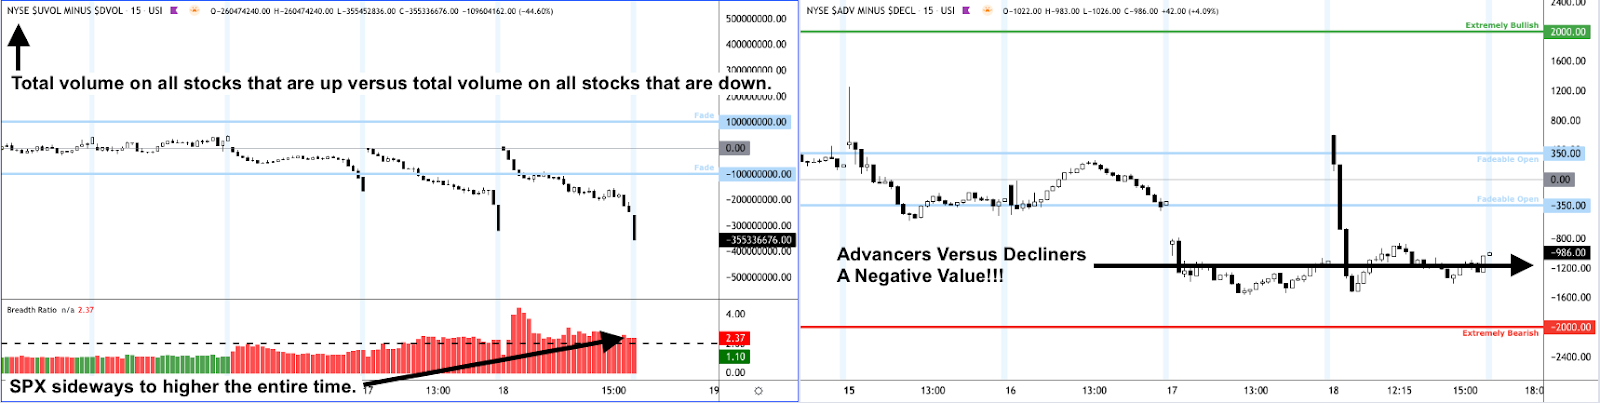
To note, however, yesterday’s price action came alongside a few dynamics: (1) an increase in tempo after a failure to solicit more involvement on an initial attempt higher; (2) a volume delta that was in line with price action; (3) breadth (i.e., volume into stocks that are up versus those that are down) on the Nasdaq was negative, divergent from the positive breadth on the NYSE. 

Adding, the knee-jerk selling and associated price action left behind poor structure (i.e., participants will look to validate [or invalidate] the move, spending time below [or above] the $4,697.50 spike base). Caution warranted on validation of the spike. 

Graphic: Delta (i.e., committed selling as measured by volume delta or buying and selling power as calculated by the difference in volume traded at the bid and offer) in line with the price action of the SPDR S&P 500 ETF Trust (NYSE: SPY), one of the largest ETFs that track the S&P 500 index, via Bookmap. The readings are supportive of initiative trade (i.e., directional trade that suggests current prices offer unfavorable entry and exit; the market is seeking balance).

Context: The aforementioned trade is happening in the context of what was an unstable environment after Friday’s monthly options expiration (OPEX).

To recap, heading into OPEX, activity in options tied to the S&P 500 was concentrated in time and price. 

During this time – which I, alongside data and analytics providers like SpotGamma (go follow), surmise participants were betting the market would not move, selling-to-open call exposure – dealers/counterparties were left warehousing increased exposure to positive options gamma.

In hedging risks, dealers sold to open (bought to open) the underlying as the price rose (fell). 

This responsive buying and selling are what causes the market to balance (i.e., trade sideways) in a tight range. It was expected to end after OPEX, as that options exposure rolled off. 

Monday, finally, there was an increase in range; the S&P 500, in particular, closed over 1.00% lower from its intraday high, weighed down by the Nasdaq 100 heavyweights and high flyers of the past weeks. 

Moreover, I was focused on two dynamics, primarily: (1) after OPEX, the absence of sticky and supportive hedging flows freed the market for directional resolve, and (2) according to SpotGamma, in light of recent exuberance, “participants [were] underexposed to downside put protection.”

The second part is slightly more important with regards to where we are today. 

As the exuberance in individual stocks fed into the stock indices themselves – the place where the world comes to hedge – participants weren’t as quick to add downside protection. No! Instead, they were more so selling to open (buying to open) downside (upside) protection.

Without getting too much into the dynamics of the exuberant positioning, the implications of this, nonetheless, are staggering. 

In short, should volatility continue to pick up, those participants (who were once exuberant) are likely to reach for protection forcing dealers to reflexively hedge in a destabilizing manner. 

As volatility rises and customers demand out-of-the-money put protection, counterparties are to hedge by selling into weakness. The conditions worsen when much of the activity is in shorter-dated tenors where options gamma is more sensitive if we will.

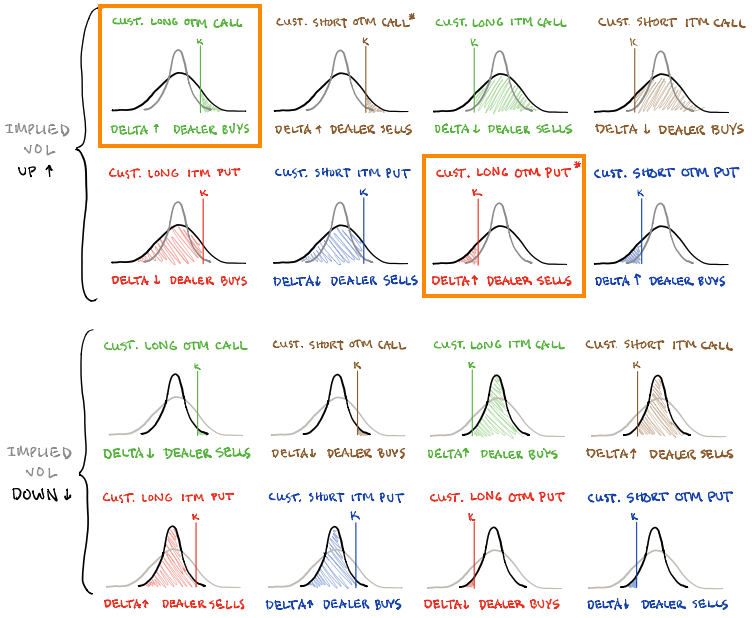
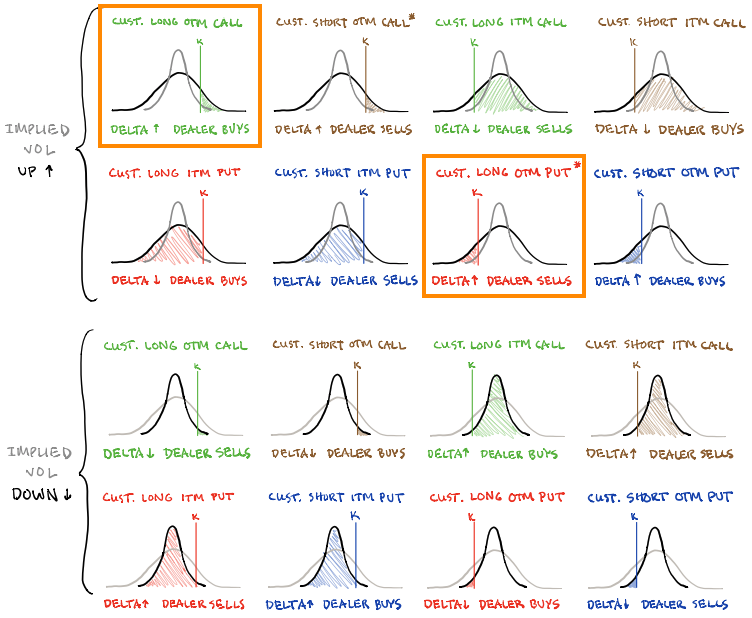
Pictured: SqueezeMetrics highlights implications of volatility, direction, and moneyness. The left orange marker is reflective of a basic reaction to call-buying (as observed during the rise of meme stocks). The right orange marker reflects a reaction to put-buying (as observed during the COVID-19 sell-off).

Now, here is the kicker. 

If indices turn, and participants start reaching for out-of-the-money protection with positive exposure to gamma (i.e., buy put, market down, put rises in value), especially in shorter-dated expiries, then yes, there may be some near-term instability. 

Note that I said shorter-dated

Once that exposure rolls off the table (and/or is monetized), dealers/counterparties will reverse and support the market, buying-to-close existing stock/futures hedges to negative gamma positions. This flow is stabilizing and maybe the start of what is a seasonally-aligned rally into Christmas.

This last part is educated conjecture. It’s what I also feel as though would frustrate the most amount of participants. Basically, a quick wash (or sideways to lower), followed by a move higher into year-end. Be nimble and responsive!

Expectations: As of 6:30 AM ET, Tuesday’s regular session (9:30 AM – 4:00 PM ET), in the S&P 500, will likely open in the middle part of a negatively skewed overnight inventory, outside of prior-range and -value, suggesting a potential for immediate directional opportunity.

Spike Scenario In Play: A spike marks the beginning of a break from value. Spikes higher (lower) are validated by trade at or above (below) the spike base (i.e., the origin of the spike).

The spike may also be looked at as a pivot; in today’s case, the spike base is $4,697.50.

In the best case, the S&P 500 trades sideways or higher; activity above the $4,692.25 micro composite point of control (MCPOC) puts in play the $4,711.00 untested point of control (VPOC). Initiative trade beyond the VPOC could reach as high as the $4,740.50 minimal excess high and $4,765.25 Fibonacci, or higher.

In the worst case, the S&P 500 trades lower; activity below the $4,692.25 MCPOC puts in play the $4,674.25 high volume node. Initiative trade beyond the HVNode could reach as low as the $4,647.25 HVNode and $4,619.00 VPOC, or lower.

Click here to load today’s updated key levels into the web-based TradingView charting platform. Note that all levels are derived using the 65-minute timeframe. New links are produced, daily.
Graphic: 65-minute profile chart of the Micro E-mini S&P 500 Futures. Learn about the profile.

Charts To Watch

Graphic: (NYSE: SPY). (S~$460, R~$471). S is for support. R is for resistance.
Graphic: (NYSE: QQQ). (S~$388, R~$402). S is for support. R is for resistance.

What People Are Saying

Definitions

Volume Areas: A structurally sound market will build on areas of high volume (HVNodes). Should the market trend for long periods of time, it will lack sound structure, identified as low volume areas (LVNodes). LVNodes denote directional conviction and ought to offer support on any test. 

If participants were to auction and find acceptance into areas of prior low volume (LVNodes), then future discovery ought to be volatile and quick as participants look to HVNodes for favorable entry or exit.

DIX: For every buyer is a seller (usually a market maker). Using DIX — which is derived from short sales (i.e., liquidity provision on the market-making side) — we can measure buying pressure.

POCs: POCs are valuable as they denote areas where two-sided trade was most prevalent in a prior day session. Participants will respond to future tests of value as they offer favorable entry and exit.

MCPOCs: POCs are valuable as they denote areas where two-sided trade was most prevalent over numerous day sessions. Participants will respond to future tests of value as they offer favorable entry and exit.

Options Expiration (OPEX): Traditionally, option expiries mark an end to pinning (i.e, the theory that market makers and institutions short options move stocks to the point where the greatest dollar value of contracts will expire) and the reduction dealer gamma exposure.

Excess: A proper end to price discovery; the market travels too far while advertising prices. Responsive, other-timeframe (OTF) participants aggressively enter the market, leaving tails or gaps which denote unfair prices.

About

After years of self-education, strategy development, and trial-and-error, Renato Leonard Capelj began trading full-time and founded Physik Invest to detail his methods, research, and performance in the markets.

Additionally, Capelj is a Benzinga finance and technology reporter interviewing the likes of Shark Tank’s Kevin O’Leary, JC2 Ventures’ John Chambers, and ARK Invest’s Catherine Wood, as well as a SpotGamma contributor, developing insights around impactful options market dynamics.

Disclaimer

At this time, Physik Invest does not manage outside capital and is not licensed. In no way should the materials herein be construed as advice. Derivatives carry a substantial risk of loss. All content is for informational purposes only.
Categories
Commentary

Daily Brief For November 22, 2021

What Happened

Overnight, equity index futures were sideways alongside the narrative that a strengthening dollar and the need to counteract inflation may endanger the rally in risk assets.

Ahead is data on the Chicago Fed National Activity Index (8:30 AM ET) and Existing Home Sales (10:00 AM ET).

Graphic updated 6:20 AM ET. Sentiment Neutral if expected /ES open is inside of the prior day’s range. /ES levels are derived from the profile graphic at the bottom of the following section. Levels may have changed since initially quoted; click here for the latest levels. SqueezeMetrics Dark Pool Index (DIX) and Gamma (GEX) calculations are based on where the prior day’s reading falls with respect to the MAX and MIN of all occurrences available. A higher DIX is bullish. At the same time, the lower the GEX, the more (expected) volatility. Learn the implications of volatility, direction, and moneyness. SHIFT data used for S&P 500 (INDEX: SPX) options activity. Note that options flow is sorted by the call premium spent; if more positive then more was spent on call options. Breadth reflects a reading of the prior day’s NYSE Advance/Decline indicator. VIX reflects a current reading of the CBOE Volatility Index (INDEX: VIX) from 0-100.

What To Expect

To start, on weak intraday breadth and supportive market liquidity metrics, the best case outcome occurred, evidenced by the balance and overlap of value areas in the S&P 500.

Taken together, the activity of the past two weeks or so signals participants’ willingness to position for directional resolve (i.e., trend) in the face of new information, and the like. 

Graphic: Divergent delta (i.e., non-committed selling as measured by volume delta or buying and selling power as calculated by the difference in volume traded at the bid and offer) in SPDR S&P 500 ETF Trust (NYSE: SPY), one of the largest ETFs that track the S&P 500 index, via Bookmap. The readings are supportive of responsive trade (i.e., rotational trade that suggests current prices offer favorable entry and exit; the market is in balance).

Context: The aforementioned trade is happening in the context of concerns over peak liquidity and prevailing monetary frameworks. 

Specifically, as Bloomberg’s John Authers put it, the abundance of global liquidity, that stoked one of the best stock market recoveries in history, is in peril by the strengthening of the dollar and the need to counter inflationary pressures. 

“Obstinately low real yields help to explain why the threat to liquidity has as yet had minimal effect on the stock market. Higher real yields are the shoe that hasn’t dropped this year; investors need a clear plan of evasive action for such an eventuality. For now, liquidity, liquidity, liquidity is still keeping stocks going up, up, up.”

Some of this fear around monetary evolution, so to speak, though, has yet to feed into the pricing of equity market risk. Fear in one market tends to feed into the fear of another.

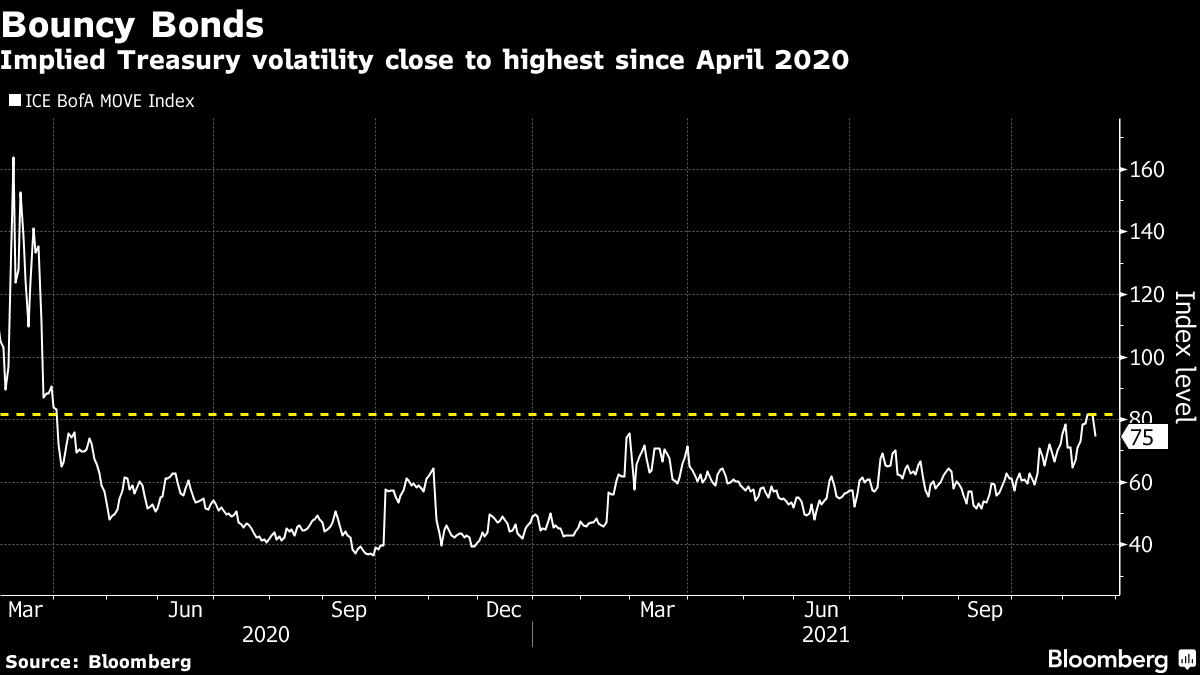
Graphic: “The ICE BofA MOVE Index, which measures implied volatility for Treasuries, is close to the steepest level since April 2020,” via Bloomberg. This measure, on a relative basis, has diverged from the CBOE Volatility Index (VIX), which is a measure of implied volatility for equities, specifically the S&P 500. 

At the same time, we see a divergence in breadth.

Graphic: % of SPX stocks above their 200-Day Moving Average versus SPX, via indexindicators.com.

The takeaway here is that the SPX is sideways to higher while many of its constituents seem to not be participating in the most recent round of markup.

What factors are to blame for this? Two include an all-time high in buybacks, as well as extremes in speculation and upside volatility in heavily-weighted index constituents.

Adding, the S&P 500 closing last week pinned to the level at which dealers (i.e., those participants that take the other side of options trades and warehouse risk) exposure to positive options gamma was highest. 

Note that I talk about the implications options so much due to increased use and impact on underlying price, as a result of associated hedging. 

The aforementioned explains why the S&P can’t move; “If dealer hedging has suppressed index level volatility, but underlying components are still exhibiting idiosyncratic volatility, then the only reconciliation is a decline in correlation,” according to one paper by Newfound Research.

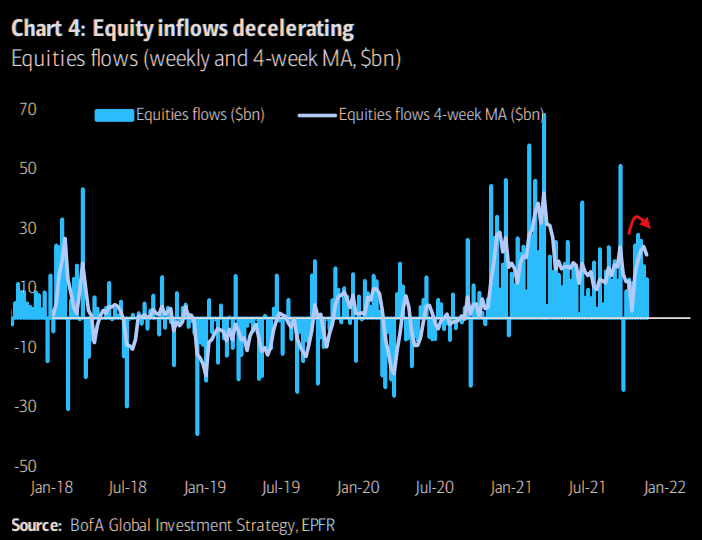
So trash breadth and a deceleration in equity inflows, coupled with exuberance (and upside volatility in heavily weighted index constituents) and clustered options positioning over the past weeks, is part of the reason why indices are sideways. Yes, to some extent.

Graphic: Per The Market Ear, “BofA points out the halt to inflows in market leaders such as tech, energy and financials. Basically, the “pillar of the pillar” of this market is fading. Do we still trust the seasonality pattern?”

The tone is to change, soon.

After OPEX, the absence of supportive vanna and charm flows (defined below), for which we can attribute some of the trends in extended day outperformance, alongside that sticky gamma hedging, so to speak, frees the market for directional resolve

According to SpotGamma, in light of recent exuberance, “participants are underexposed to downside put protection. Should these participants reach for long-gamma put exposures amidst volatility, there is a potential for a destabilizing, reflexive reaction on the part of dealers.”

The reason is, as volatility rises and customers demand out-of-the-money put protection, counterparties are to hedge by selling stock and futures into weakness. 

Cognizant of the risks, though, I end this section with the following. 

“[D]uring the 12-month period starting six months before and ending six months after a tightening cycle begins, the valuation of the S&P 500 has on average remained remarkably steady,” according to a post by The Market Ear.

At the same time, seasonality is great as, according to Callum Thomas, “Historically most of the time if the market closed up 20%+ for the year, the next year was also positive (84% of the time). As of writing, the market is up some 27% YTD (albeit, this year ain’t over yet!).”

Going forward, we shall monitor for the first signs of instability via spikes in the CBOE Volatility-Of-Volatility Index (INDEX: VVIX) and upward shifts in the VIX futures term structure.

Expectations: As of 6:20 AM ET, Monday’s regular session (9:30 AM – 4:00 PM ET), in the S&P 500, will likely open in the upper part of a positively skewed overnight inventory, inside of prior-range, suggesting a limited potential for immediate directional opportunity.

Balance-Break Scenarios: A change in the market (i.e., the transition from two-time frame trade, or balance, to one-time frame trade, or trend) may occur.

We monitor for acceptance (i.e., more than 1-hour of trade) outside of the balance area. Rejection (i.e., return inside of balance) portends a move to the opposite end of the balance.

Given the passage of OPEX, we ought to give more weight to directional resolve (i.e., trend).

In the best case, the S&P 500 trades sideways or higher; activity above the $4,692.25 high volume area (HVNode) puts in play the $4,723.50 overnight high (ONH). Initiative trade beyond the ONH could reach as high as the $4,735.25 and $4,765.25 Fibonacci, or higher.

In the worst case, the S&P 500 trades lower; activity below the $4,692.25 HVNode puts in play the $4,674.25 micro composite point of control (MCPOC). Initiative trade beyond the MCPOC could reach as low as the $4,647.25 HVNode and $4,619.00 VPOC, or lower.

Click here to load today’s updated key levels into the web-based TradingView charting platform. Note that all levels are derived using the 65-minute timeframe. New links are produced, daily.
Graphic: 65-minute profile chart of the Micro E-mini S&P 500 Futures. Learn about the profile

Definitions

Overnight Rally Highs (Lows): Typically, there is a low historical probability associated with overnight rally-highs (lows) ending the upside (downside) discovery process.

Volume Areas: A structurally sound market will build on areas of high volume (HVNodes). Should the market trend for long periods of time, it will lack sound structure, identified as low volume areas (LVNodes). LVNodes denote directional conviction and ought to offer support on any test. 

If participants were to auction and find acceptance into areas of prior low volume (LVNodes), then future discovery ought to be volatile and quick as participants look to HVNodes for favorable entry or exit.

Gamma: Gamma is the sensitivity of an option to changes in the underlying price. Dealers that take the other side of options trades hedge their exposure to risk by buying and selling the underlying. When dealers are short-gamma, they hedge by buying into strength and selling into weakness. When dealers are long-gamma, they hedge by selling into strength and buying into weakness. The former exacerbates volatility. The latter calms volatility.

Vanna: The rate at which the delta of an option changes with respect to volatility.

Charm: The rate at which the delta of an option changes with respect to time.

POCs: POCs are valuable as they denote areas where two-sided trade was most prevalent in a prior day session. Participants will respond to future tests of value as they offer favorable entry and exit.

MCPOCs: POCs are valuable as they denote areas where two-sided trade was most prevalent over numerous day sessions. Participants will respond to future tests of value as they offer favorable entry and exit.

About

After years of self-education, strategy development, and trial-and-error, Renato Leonard Capelj began trading full-time and founded Physik Invest to detail his methods, research, and performance in the markets.

Additionally, Capelj is a Benzinga finance and technology reporter interviewing the likes of Shark Tank’s Kevin O’Leary, JC2 Ventures’ John Chambers, and ARK Invest’s Catherine Wood, as well as a SpotGamma contributor, developing insights around impactful options market dynamics.

Disclaimer

At this time, Physik Invest does not manage outside capital and is not licensed. In no way should the materials herein be construed as advice. Derivatives carry a substantial risk of loss. All content is for informational purposes only.
Categories
Commentary

Daily Brief For November 19, 2021

What Happened

Overnight, equity index futures diverged as the S&P 500 attempted a breakout, failed, and rotated back into range, leaving some signs of excess (i.e., a proper end to auction) on the composite volume profile. Learn about the profile.

This comes ahead of a weighty options expiration that ought to resolve this market of the dynamics that promoted sideways trade over the past couple of weeks. Attention, after today, shifts to weakening breadth, seasonality, emerging fundamental nuances, and the like, as a result.

Ahead is some Fed-speak and no major economic releases. 

Graphic updated 6:15 AM ET. Sentiment Neutral if expected /ES open is inside of the prior day’s range. /ES levels are derived from the profile graphic at the bottom of the following section. Levels may have changed since initially quoted; click here for the latest levels. SqueezeMetrics Dark Pool Index (DIX) and Gamma (GEX) calculations are based on where the prior day’s reading falls with respect to the MAX and MIN of all occurrences available. A higher DIX is bullish. At the same time, the lower the GEX, the more (expected) volatility. Learn the implications of volatility, direction, and moneyness. SHIFT data used for S&P 500 (INDEX: SPX) options activity. Note that options flow is sorted by the call premium spent; if more positive then more was spent on call options. Breadth reflects a reading of the prior day’s NYSE Advance/Decline indicator. VIX reflects a current reading of the CBOE Volatility Index (INDEX: VIX) from 0-100.

What To Expect

Yesterday, on nonparticipatory intraday breadth and market liquidity metrics, the best case outcome occurred; the S&P 500, after liquidating against a divergent volume delta (i.e., a metric that may reveal participants’ commitment to buying and selling as calculated by the difference in volume traded at the bid and offer) was responsively bought at its lows.

The low-of-day coincided with the $4,674.25 micro-composite point of control, the place at which two-sided trade was most prevalent over numerous day sessions, and the volume-weighted average price (i.e., the place at which liquidity algorithms are benchmarked and programmed to buy and sell) anchored from the Federal Open Market Committee (FOMC) event, weeks ago. 

The aforementioned activity left behind a double-distribution profile structure; participants initiated from one area of acceptance to another, closing just beyond what analysis provider SpotGamma sees is the options strike with the highest Absolute Gamma.

As discussed day after day, leading up to today’s monthly options expiration (OPEX), this cluster of options positioning was to restrain (i.e., make it difficult for) directional resolve.

The reason is, as OPEX nears and participants concentrate their activity on shorter-dated expiries (such as the one rolling off today), there’s an increased share who are willing to bet the market won’t move higher. In expressing this bet, participants opt to sell-to-open call exposure, for instance, leaving the counterparty/dealer warehousing exposure to positive options gamma. 

As this trend continues (and time to expiry narrows), dealers’ exposure to positive options gamma rises. In offsetting this risk, they sell to open (buy-to-open) the underlying as price rises (declines). This responsive buying and selling are what causes the market to balance (i.e., trade sideways) in a tight range. It ought to end after OPEX, as that options exposure rolls off

Graphic: Divergent delta (i.e., non-committed buying as measured by volume delta or buying and selling power as calculated by the difference in volume traded at the bid and offer) in SPDR S&P 500 ETF Trust (NYSE: SPY), one of the largest ETFs that track the S&P 500 index, via Bookmap. The readings are supportive of responsive trade (i.e., rotational trade that suggests current prices offer favorable entry and exit; the market is in balance and not ready to break).

Context: The aforementioned trade is happening in the context of dynamics I touched on in weeks prior, as well as yesterday’s commentary

This is, specifically, the bond market’s pricing of risk.

According to Bloomberg, based on an “erratic … handling [of] large transfers of risk,” as evidenced by the Merrill Lynch Option Volatility Estimate (INDEX: MOVE), the bond market’s pricing of risk, so to speak, has diverged from the pricing of equity market risk, via the CBOE Volatility Index (INDEX: VIX).

Graphic: “The ICE BofA MOVE Index, which measures implied volatility for Treasuries, is close to the steepest level since April 2020,” via Bloomberg.

That said, fear in one market tends to feed into the fear of another; regardless of the cause, equity and bond market participants are not on the same page.

What is the fear all about? Well, at its core, the fear coincides with “broad uncertainty about the direction of the economy and monetary policy amid surging prices, labor shortages and yields that are holding well below the rate of inflation,” according to Bloomberg.

As asked, yesterday, in combating high inflation, policymakers ought to raise rates, right? 

That’s precisely what economists at institutions like JPMorgan Chase & Co (NYSE: JPM) believe may happen as soon as next September, earlier than once forecasted.

Rising rates, among other factors, have the potential to decrease the present value of future earnings, thereby making stocks, especially those that are high growth, less attractive to own.

As the market is a forward-looking mechanism, the implications of this seem staggering. 

Prevailing monetary frameworks and max liquidity promoted a large divergence in price from fundamentals. The growth of passive investing – the effect of increased moneyness among nonmonetary assets – and derivatives trading imply a lot of left-tail risks.

As Kai Volatility’s Cem Karsan once told me: “There’s this constant structural positioning that naturally drives markets higher as long as volatility is compressed,” or there is supply.

“At the end of the day, though, the higher you go, the further off the ground you are and the more tail risk.”

Eventually, fear on the part of bond market participants may feed into equity market positioning.

In rounding out this section, I, again, want to mention the pinning in the broad market, as well as the performance of underlying constituents. If you’ve paid much of any attention, there is some bloodshed going on; breadth is divergent and the indices are sideways to higher, basically.

Graphic: Internally, the market is weak. Externally, via price, the market seems strong. 

The concern is that after OPEX, the absence of supportive vanna and charm flows (defined below), for which we can attribute some of the trends in extended day outperformance, alongside that sticky gamma hedging, so to speak, frees the market for directional resolve. 

Whether or not that resolve is up or down, we know that (as SpotGamma talks more about), participants are underexposed to downside protection. Should volatility pick up, these participants are likely to reach for that protection forcing dealers to reflexively hedge in a destabilizing manner. 

As volatility rises and customers demand out-of-the-money put protection, counterparties are to hedge by selling into weakness. The conditions worsen when much of the activity is in shorter-dated tenors where options gamma is more punchy if we will.

Pictured: SqueezeMetrics highlights implications of volatility, direction, and moneyness. The left orange marker is reflective of a basic reaction to call-buying (as observed during the rise of meme stocks). The right orange marker reflects a reaction to put-buying (as observed during the COVID-19 sell-off).

Expectations: As of 6:15 AM ET, Friday’s regular session (9:30 AM – 4:00 PM ET), in the S&P 500, will likely open in the lower part of a balanced overnight inventory, inside of prior-range and -value, suggesting a limited potential for immediate directional opportunity.

Balance-Break Failure: A change in the market (i.e., the transition from two-time frame trade, or balance, to one-time frame trade, or trend) nearly occurred on a higher time frame.

In monitoring for acceptance (i.e., more than 1-hour of trade) outside of the balance area, we saw an overnight rejection (i.e., return inside of balance). This portends a move to the opposite end of the balance. 

Given OPEX, though, we ought to give more weight to continued balance (i.e., sideways trade).

In the best case, the S&P 500 trades sideways or higher; activity above the $4,692.25 high volume area (HVNode) puts in play the $4,723.50 overnight high (ONH). Initiative trade beyond the ONH could reach as high as the $4,735.25 and $4,765.25 Fibonacci, or higher.

In the worst case, the S&P 500 trades lower; activity below the $4,692.25 HVNode puts in play the $4,674.25 micro composite point of control (MCPOC). Initiative trade beyond the MCPOC could reach as low as the $4,647.25 HVNode and $4,619.00 VPOC, or lower.

Click here to load today’s updated key levels into the web-based TradingView charting platform. Note that all levels are derived using the 65-minute timeframe. New links are produced, daily.
Graphic: 65-minute profile chart of the Micro E-mini S&P 500 Futures. Learn about the profile.

Definitions

Overnight Rally Highs (Lows): Typically, there is a low historical probability associated with overnight rally-highs (lows) ending the upside (downside) discovery process.

Volume Areas: A structurally sound market will build on areas of high volume (HVNodes). Should the market trend for long periods of time, it will lack sound structure, identified as low volume areas (LVNodes). LVNodes denote directional conviction and ought to offer support on any test. 

If participants were to auction and find acceptance into areas of prior low volume (LVNodes), then future discovery ought to be volatile and quick as participants look to HVNodes for favorable entry or exit.

Gamma: Gamma is the sensitivity of an option to changes in the underlying price. Dealers that take the other side of options trades hedge their exposure to risk by buying and selling the underlying. When dealers are short-gamma, they hedge by buying into strength and selling into weakness. When dealers are long-gamma, they hedge by selling into strength and buying into weakness. The former exacerbates volatility. The latter calms volatility.

Vanna: The rate at which the delta of an option changes with respect to volatility.

Charm: The rate at which the delta of an option changes with respect to time.

Options: If an option buyer was short (long) stock, he or she would buy a call (put) to hedge upside (downside) exposure. Option buyers can also use options as an efficient way to gain directional exposure.

VPOCs: POCs are valuable as they denote areas where two-sided trade was most prevalent in a prior day session. Participants will respond to future tests of value as they offer favorable entry and exit.

MCPOCs: POCs are valuable as they denote areas where two-sided trade was most prevalent over numerous day sessions. Participants will respond to future tests of value as they offer favorable entry and exit.

Options Expiration (OPEX): Traditionally, option expiries mark an end to pinning (i.e, the theory that market makers and institutions short options move stocks to the point where the greatest dollar value of contracts will expire) and the reduction dealer gamma exposure. 

Excess: A proper end to price discovery; the market travels too far while advertising prices. Responsive, other-timeframe (OTF) participants aggressively enter the market, leaving tails or gaps which denote unfair prices.

About

After years of self-education, strategy development, and trial-and-error, Renato Leonard Capelj began trading full-time and founded Physik Invest to detail his methods, research, and performance in the markets.

Additionally, Capelj is a Benzinga finance and technology reporter interviewing the likes of Shark Tank’s Kevin O’Leary, JC2 Ventures’ John Chambers, and ARK Invest’s Catherine Wood, as well as a SpotGamma contributor, developing insights around impactful options market dynamics.

Disclaimer

At this time, Physik Invest does not manage outside capital and is not licensed. In no way should the materials herein be construed as advice. Derivatives carry a substantial risk of loss. All content is for informational purposes only.

Categories
Commentary

Daily Brief For November 12, 2021

What Happened

Overnight, equity indices were flat-to-up while commodities and bonds were sideways to lower.

The prevailing narratives include the prospects of a Russian invasion of Ukraine, COVID-19 resurgence in the U.S., concerns over the pace of inflation and its impact on the economy, China developer debt payments, and the like. Your typical doom and gloom stuff!

Ahead is data on job openings, University of Michigan consumer sentiment, and five-year inflation expectations (10:00 AM ET).

Graphic updated 5:30 AM ET. Sentiment Neutral if expected /ES open is inside of the prior day’s range. /ES levels are derived from the profile graphic at the bottom of the following section. Levels may have changed since initially quoted; click here for the latest levels. SqueezeMetrics Dark Pool Index (DIX) and Gamma (GEX) calculations are based on where the prior day’s reading falls with respect to the MAX and MIN of all occurrences available. A higher DIX is bullish. At the same time, the lower the GEX, the more (expected) volatility. Learn the implications of volatility, direction, and moneyness. SHIFT data used for S&P 500 (INDEX: SPX) options activity. Note that options flow is sorted by the call premium spent; if more positive then more was spent on call options. Breadth reflects a reading of the prior day’s NYSE Advance/Decline indicator. VIX reflects a current reading of the CBOE Volatility Index (INDEX: VIX) from 0-100.

What To Expect

On lackluster intraday breadth and market liquidity metrics, the best case outcome occurred, evidenced by the balance and overlap of value areas in the S&P 500.

This activity, which suggests participants’ willingness to position for directional resolve, comes alongside the presence of poor structure, a dynamic that adds to technical instability.

Graphic: Divergent delta (i.e., non-committed selling as measured by volume delta or buying and selling power as calculated by the difference in volume traded at the bid and offer) in SPDR S&P 500 ETF Trust (NYSE: SPY), one of the largest ETFs that track the S&P 500 index, via Bookmap. The readings are supportive of responsive trade (i.e., rotational trade that suggests current prices offer favorable entry and exit; the market is in balance).

Context: The aforementioned trade is happening in the context of a lot of big-picture dynamics such as the growth of derivatives exposure and tail risk, the heightened moneyness of nonmonetary assets, trends in seasonality, buybacks, earnings growth, inflation, and more.

Graphic: “Whenever the market has been up 20%+ YTD through to October (like e.g. THIS YEAR), it has *always* had an up month in November (albeit with a n=8). Basically I would say it speaks to the momentum in the market, which despite the September stumble seems pretty much alive and well.” – Callum Thomas

On the topic of inflation, the October consumer price index (CPI) is worrisome, according to some. 

“We think it is time to rethink positioning related to inflation,” Citigroup Inc (NYSE: C) strategists led by Scott Chronert wrote in a note. “A focus on sectors and industry groups negatively correlated to inflation provides a contrarian opportunity.” 

Citi sees value in consumer and health-care stocks, as a result of negative correlations to CPI.

Despite the hot prints, the CPI doesn’t paint the entire picture; it’s too soon to change rate-hike calculations, according to the Federal Reserve’s Mary Daly. 

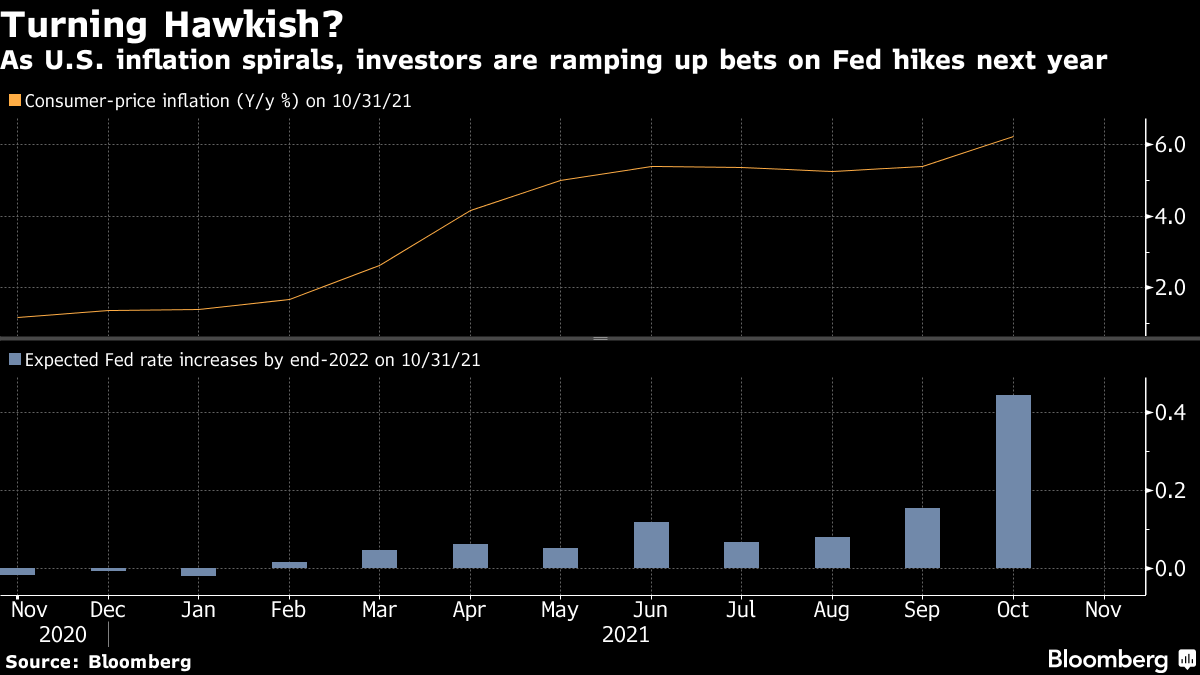
Graphic: U.S. inflation, expected Fed rate increases via Bloomberg

That thinking brings me back to recent comments made by Ark Invest’s Cathie Wood.

Mainly, Wood feels that inflation is on its way out with a decline in the velocity of money and increased moneyness of nonmonetary assets.

A prime example of this is inflation in housing; “Ivy Zelman of Zelman Research came out this week. She made a fantastic call on the housing bubble and bust starting in 05-06, and she was right, just a little early. She is very concerned that the housing prices we’re seeing right now are not sustainable,” because of speculation, as well as iBuying and private equity. 

“This is unsustainable … and I’m wondering if even the housing market inflation is going to give way, here,” Wood added. 

For now, with more of the same – bullishness in the face of moderating monetary policy, strong retail participation, seasonality, and buybacks supporting the valuations we’re at, now – what other narratives are there to add (or roll forward)?

Given my interest in the options market – because option volumes are comparable to stock volumes and related hedging flows, as a result, represent an increased share of volume in underlying stocks – I’m in the camp of “the market is fragile, given current positioning.”

According to SpotGamma, single-stock exuberance of the past weeks fed into the S&P complex, itself, evidenced by a lack of interest in put options at lower strikes; the S&P 500 options strike with the largest negative gamma – delta sensitivity to underlying price – failed to roll higher, while the strike of the option with the largest positive gamma did. 

This came as investors marked the S&P 500 up to the $4,700.00 strike, at which positive gamma – delta sensitivity to underlying price – is highest. 

“As volatility continues to decline, the gamma of those options, which are now at the money, ought to increase, forcing counterparties to supply more liquidity,” SpotGamma explained.

Therefore, coming into this week, $4,700.00 was expected to be a magnet (or resistance) into that aforementioned pre-monthly options expiration (OPEX) weakness.

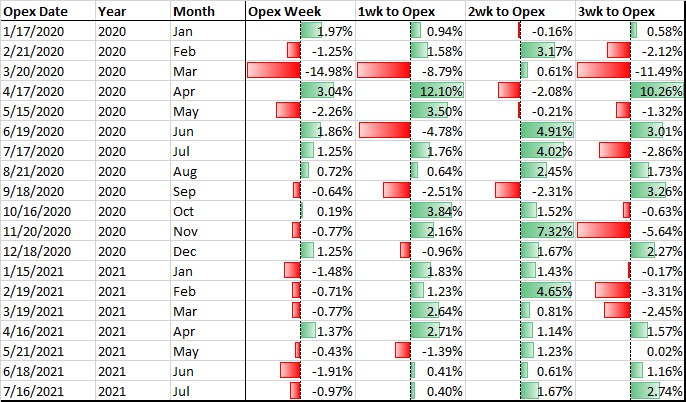
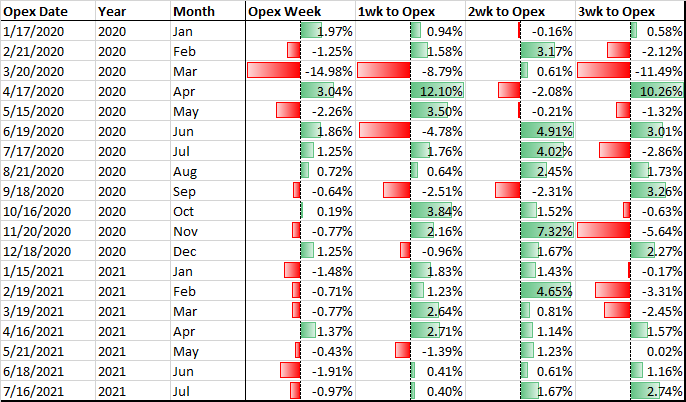
Graphic: @pat_hennessy breaks down returns for the S&P 500, categorized by the week relative to OPEX. 

This was unless (1) volatility declined markedly, “a tailwind for the S&P complex as options slid[ing] down their term structure would cause dealers to continue covering their hedges in an asymmetric manner,” or (2) more capital was committed to options at higher strikes. 

Neither happened.

Instead, the CBOE Volatility Index (INDEX: VIX) was higher, with demand coming in across the front area of the VIX futures term structure. This suggested a demand for hedges and a reduction in the flows (e.g., vanna) that support sideways to higher trade. 

Pictured: SqueezeMetrics highlights implications of volatility, direction, and moneyness. The left orange marker is reflective of a basic reaction to call-buying (as observed during the rise of meme stocks). The right orange marker reflects a reaction to put-buying (as observed during the COVID-19 sell-off).

The implications of customers now covering their levered, long-delta exposure and demanding out-of-the-money hedges may have the effect of forcing counterparties to hedge in a manner that exacerbates underlying price movement to the downside (e.g., Tesla).

With that single-stock exuberance still reflected by positioning in the S&P, itself, as SpotGamma said: “This sets us up for what may be a volatile pre- and post-OPEX week.”
Graphic: S&P 500 (INDEX: SPX) options activity for Thursday, November 11, 2021. SHIFT shows increased volume of put options in strikes prices at and below current prices.

Expectations: As of 5:30 AM ET, Friday’s regular session (9:30 AM – 4:00 PM ET), in the S&P 500, will likely open in the middle part of a positively skewed overnight inventory, inside of prior-range and -value, suggesting a limited potential for immediate directional opportunity.

Balance-Break Scenarios: A change in the market (i.e., transition from two-time frame trade, or balance, to one-time frame trade, or trend) ought to occur on a break of day-session balance.

We monitor for acceptance (i.e., more than 1-hour of trade) outside of the balance area. Rejection (i.e., return inside of balance) portends a move to the opposite end of the balance.

In the best case, the S&P 500 trades sideways or higher; activity above the $4,647.25 high volume area (HVNode) puts in play the $4,673.00 untested point of control (VPOC)

Initiative trade beyond the VPOC could reach as high as the $4,695.25 micro composite point of control (MCPOC) and $4,711.75 regular trade high (RTH High), or higher.

In the worst case, the S&P 500 trades lower; activity below the $4,647.25 HVNode puts in play the $4,619.00 VPOC

Initiative trade beyond the VPOC could reach as low as $4,590.00, a prior balance area high (BAH), and $4,574.25 HVNode, or lower.

To note, a breach of Wednesday’s low likely puts the S&P 500 in a short-gamma environment.

Those participants that take the other side of options trades will hedge their exposure to risk by buying and selling the underlying. 

When dealers are short-gamma, they buy into strength and sell into weakness, exacerbating volatility. 

When dealers are long-gamma, they buy into weakness and sell into strength, calming volatility.

--

Click here to load today’s updated key levels into the web-based TradingView charting platform. Note that all levels are derived using the 65-minute timeframe. New links are produced, daily.
Graphic: 65-minute profile chart of the Micro E-mini S&P 500 Futures. Learn about the profile.

What People Are Saying

Definitions

Cave-Fill Process: Widened the area deemed favorable to transact at by an increased share of participants. This is a good development.

Volume Areas: A structurally sound market will build on areas of high volume (HVNodes). Should the market trend for long periods of time, it will lack sound structure, identified as low volume areas (LVNodes). LVNodes denote directional conviction and ought to offer support on any test. 

If participants were to auction and find acceptance into areas of prior low volume (LVNodes), then future discovery ought to be volatile and quick as participants look to HVNodes for favorable entry or exit.

POCs: POCs are valuable as they denote areas where two-sided trade was most prevalent in a prior day session. Participants will respond to future tests of value as they offer favorable entry and exit.

MCPOCs: POCs are valuable as they denote areas where two-sided trade was most prevalent over numerous day sessions. Participants will respond to future tests of value as they offer favorable entry and exit.

Value-Area Placement: Perception of value unchanged if value overlapping (i.e., inside day). Perception of value has changed if value not overlapping (i.e., outside day). Delay trade in the former case.

About

After years of self-education, strategy development, and trial-and-error, Renato Leonard Capelj began trading full-time and founded Physik Invest to detail his methods, research, and performance in the markets.

Additionally, Capelj is a Benzinga finance and technology reporter interviewing the likes of Shark Tank’s Kevin O’Leary, JC2 Ventures’ John Chambers, and ARK Invest’s Catherine Wood, as well as a SpotGamma contributor, developing insights around impactful options market dynamics.

Disclaimer

At this time, Physik Invest does not manage outside capital and is not licensed. In no way should the materials herein be construed as advice. Derivatives carry a substantial risk of loss. All content is for informational purposes only.
Categories
Commentary

Daily Brief For November 11, 2021

What Happened

Overnight, equity index futures auctioned sideways to higher, recovering much of yesterday’s fast-paced liquidation.

To note, overnight price changes aside, the Nasdaq 100 is trading weak, in comparison to the S&P 500, a dynamic most noticeable in underlying breadth metrics, and the like. 

Ahead, there are no material economic releases.

Graphic updated 6:30 AM ET. Sentiment Neutral if expected /ES open is inside of the prior day’s range. /ES levels are derived from the profile graphic at the bottom of the following section. Levels may have changed since initially quoted; click here for the latest levels. SqueezeMetrics Dark Pool Index (DIX) and Gamma (GEX) calculations are based on where the prior day’s reading falls with respect to the MAX and MIN of all occurrences available. A higher DIX is bullish. At the same time, the lower the GEX, the more (expected) volatility. Learn the implications of volatility, direction, and moneyness. SHIFT data used for S&P 500 (INDEX: SPX) options activity. Note that options flow is sorted by the call premium spent; if more positive then more was spent on call options. Breadth reflects a reading of the prior day’s NYSE Advance/Decline indicator. VIX reflects a current reading of the CBOE Volatility Index (INDEX: VIX) from 0-100.

What To Expect

Coming into Tuesday’s session, participants knew that the S&P 500 had already undergone somewhat of a lackluster liquidation, Tuesday.

Those behind some of the downside velocity we saw were most likely short-term, momentum-driven participants who had poor location (i.e., those that respond to probes at visual references and lack the wherewithal to withstand major changes in tone).

To note, given the context – weak intraday breadth and market liquidity metrics bolstering an expansion of range below the volume-weighted average price (VWAP) anchored from the Federal Open Market Committee (FOMC) announcement, last week – the poor structure intact from the advance in past weeks remains a concern.

Graphic: Supportive delta (i.e., committed selling for most of the day as measured by volume delta or buying and selling power as calculated by the difference in volume traded at the bid and offer) in SPDR S&P 500 ETF Trust (NYSE: SPY), one of the largest ETFs that track the S&P 500 index, via Bookmap.

Context: Yesterday, I talked in-depth on the implications of high leverage and risk by short-term speculators’ record call buying and put selling. 

To recap, so long as implied volatility remained bid (and stock prices continued rising) – the result of inadequate liquidity – counterparties to highly speculative trades exacerbated upside volatility in their efforts to hedge. 

As implied volatility backed off, counterparties supplied an increasing amount of their underlying hedges, calming the pace of upside price discovery.

When the high-flying stocks (like Tesla, which is a large S&P 500 index constituent) finally made the turn, the bulk of customers’ short puts (long calls) quickly rose (declined) in value, trading in-the-money (out-of-the-money). 

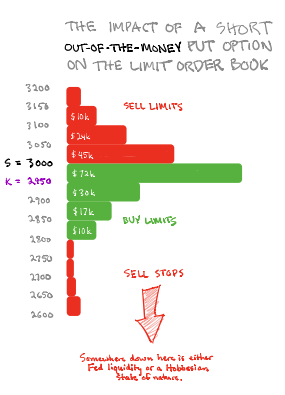
Due in part to short-term speculators lacking the wherewithal to stay in their margin-intensive positions, as the price fell, put buying (covering of shorts, too) took liquidity and destabilized the market.

Graphic: SqueezeMetrics unpacks implications of short put options on the limit order book.

According to SpotGamma, the exuberance of the past weeks fed into the S&P complex, itself, evidenced by a lack of interest in put options at lower strikes. In other words, the S&P 500 options strike with the largest negative gamma – delta sensitivity to underlying price – failed to roll higher, while the strike of the option with the largest positive gamma did. 

With implied volatility declining into the S&P’s price rise, last week (a dynamic that, at least in recent history, leads into increased call selling, more dealer hedging, and liquidity, as well as further realized volatility suppression), associated hedging at those strikes pressured prices.

The upside was resisted and we pinned. 

Coming into this week, however, CBOE Volatility Index (INDEX: VIX) was higher, with demand coming in across the front area of the VIX futures term structure. This suggested a demand for hedges and a reduction in the flows (e.g., vanna) that support sideways to higher trade. 

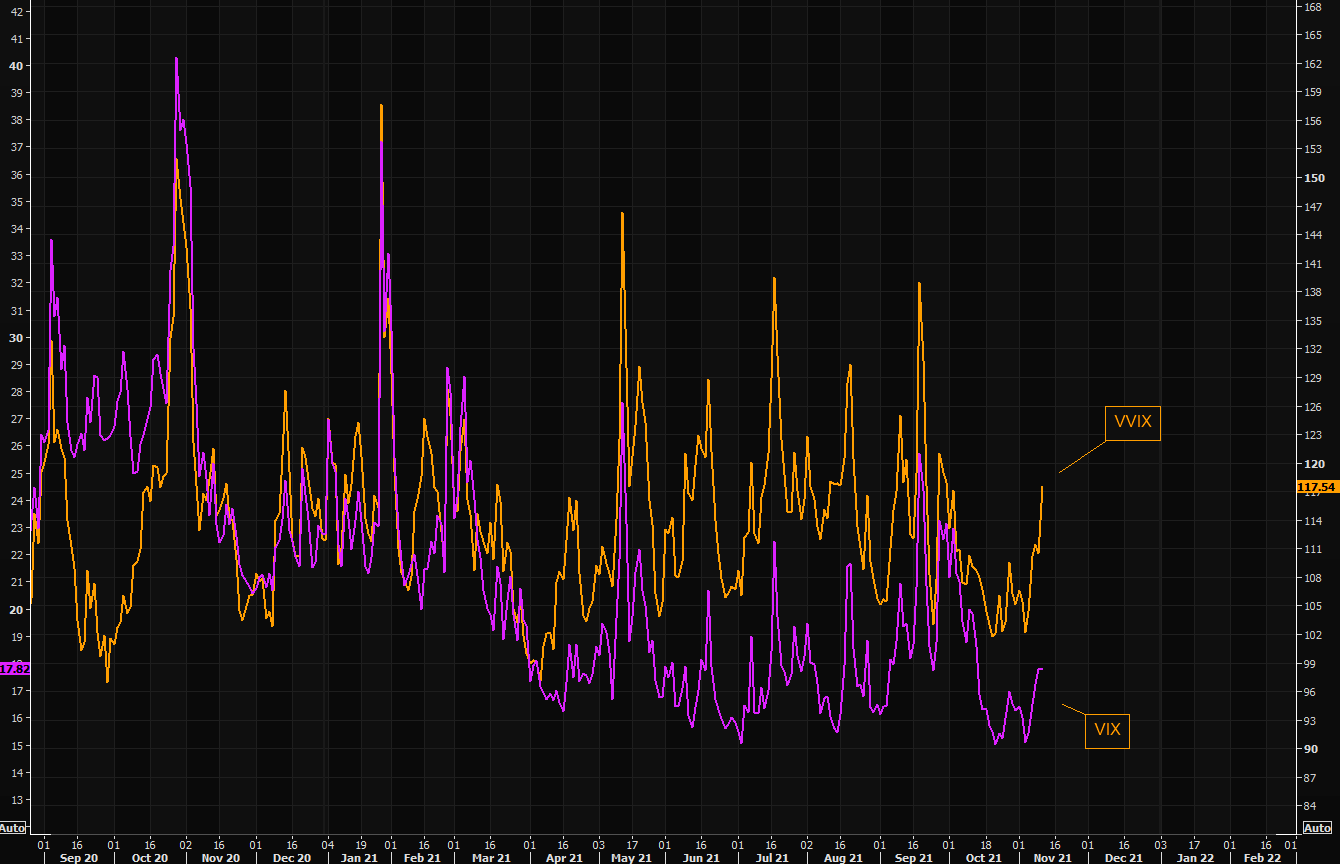
Graphic: Charting the CBOE Volatility-Of-Volatility Index (INDEX: VVIX) and the CBOE Volatility Index (INDEX: VIX). Though both were higher, expectations of the volatility of volatility rose. Participants are reaching for those highly “convex” options which have counterparties reacting in a manner that exacerbates underlying price movement.

The implications of customers now covering their levered, long-delta exposure and demanding out-of-the-money hedges has the effect of forcing counterparties to hedge in a manner that exacerbates underlying price movement to the downside. 

This was the concern. This is what we’re starting to see.

Typically, the period leading up to the monthly options expiration (OPEX) is weak (at least in recent times) and so this trend of lower price and higher intraday volatility may persist up until that event clears counterparties’ gamma exposure and frees the market to move, more.

That’s when fundamental context likely plays a more important role. 

According to a Barclays (NYSE: BCS) note featured by The Market Ear, earnings are a tailwind.

“Amid a potentially higher macro volatility regime, we expect earnings to remain a tailwind for equities in ’22. Given our economists’ forecast of above-trend GDP growth of 4.5%, our base case gives 14% EPS growth for Europe, vs. the IBES estimate of 7%. Sticky supply bottlenecks are a threat, but margins typically expanded when global growth was above 3%, while ULCs should remain low. With comps less easy now, sector contributions to EPS growth should be more balanced between Cyclicals and Defensives, but still higher for the former.”

At the same time, in the face of inflation rising at the fastest rate since 1990, we have strong retail participation, seasonality, and buybacks to support the valuations we’re at, now.

Graphic: Inflow mania continues, via The Market Ear.

Expectations: As of 6:30 AM ET, Wednesday’s regular session (9:30 AM – 4:00 PM ET), in the S&P 500, will likely open in the upper part of a positively skewed overnight inventory, inside of prior-range and -value, suggesting a limited potential for immediate directional opportunity.

In the best case, the S&P 500 trades sideways or higher; activity above the $4,657.75 low volume area (LVNode) puts in play the $4,673.00 untested point of control (VPOC). Initiative trade beyond the VPOC could reach as high as the $4,695.25 micro composite point of control (MCPOC) and $4,711.75 regular trade high (RTH High), or higher.

In the worst case, the S&P 500 trades lower; activity below the $4,657.75 LVNode puts in play the $4,619.00 VPOC. Initiative trade beyond the VPOC could reach as low as $4,590.00, a prior balance area high (BAH), and $4,574.25 high volume area (HVNode), or lower.

To note, a breach of the prior day’s low likely puts the S&P 500 in a short-gamma environment. When dealers are short-gamma, they buy into strength and sell into weakness, exacerbating volatility. When dealers are long-gamma, they buy into weakness and sell into strength, calming volatility.

Click here to load today’s updated key levels into the web-based TradingView charting platform. Note that all levels are derived using the 65-minute timeframe. New links are produced, daily.
Graphic: 65-minute profile chart of the Micro E-mini S&P 500 Futures. Note the low-volume structure beneath current prices. There is the potential for a cave-fill to widen the area deemed favorable to transact at by an increased share of participants. Learn about the profile.

What People Are Saying

Definitions

Volume Areas: A structurally sound market will build on areas of high volume (HVNodes). Should the market trend for long periods of time, it will lack sound structure, identified as low volume areas (LVNodes). LVNodes denote directional conviction and ought to offer support on any test. 

If participants were to auction and find acceptance into areas of prior low volume (LVNodes), then future discovery ought to be volatile and quick as participants look to HVNodes for favorable entry or exit.

POCs: POCs are valuable as they denote areas where two-sided trade was most prevalent in a prior day session. Participants will respond to future tests of value as they offer favorable entry and exit.

MCPOCs: POCs are valuable as they denote areas where two-sided trade was most prevalent over numerous day sessions. Participants will respond to future tests of value as they offer favorable entry and exit.

Volume-Weighted Average Prices (VWAPs): A metric highly regarded by chief investment officers, among other participants, for quality of trade. Additionally, liquidity algorithms are benchmarked and programmed to buy and sell around VWAPs.

About

After years of self-education, strategy development, and trial-and-error, Renato Leonard Capelj began trading full-time and founded Physik Invest to detail his methods, research, and performance in the markets.

Additionally, Capelj is a Benzinga finance and technology reporter interviewing the likes of Shark Tank’s Kevin O’Leary, JC2 Ventures’ John Chambers, and ARK Invest’s Catherine Wood, as well as a SpotGamma contributor, developing insights around impactful options market dynamics.

Disclaimer

At this time, Physik Invest does not manage outside capital and is not licensed. In no way should the materials herein be construed as advice. Derivatives carry a substantial risk of loss. All content is for informational purposes only.
Categories
Commentary

Daily Brief For November 10, 2021

What Happened

Equity index futures sideways, overnight, on powerful derivative market forces, alongside participants’ aims to base ahead of added clarity on the economic outlook.

Ahead is data on inflation and jobless claims (8:30 AM ET), wholesale inventories (10:00 AM ET), and the monthly budget statement (2:00 PM ET).

Graphic updated 5:30 AM ET. Sentiment Neutral if expected /ES open is inside of the prior day’s range. /ES levels are derived from the profile graphic at the bottom of the following section. Levels may have changed since initially quoted; click here for the latest levels. SqueezeMetrics Dark Pool Index (DIX) and Gamma (GEX) calculations are based on where the prior day’s reading falls with respect to the MAX and MIN of all occurrences available. A higher DIX is bullish. At the same time, the lower the GEX, the more (expected) volatility. Learn the implications of volatility, direction, and moneyness. SHIFT data used for S&P 500 (INDEX: SPX) options activity. Note that options flow is sorted by the call premium spent; if more positive then more was spent on call options. Breadth reflects a reading of the prior day’s NYSE Advance/Decline indicator. VIX reflects a current reading of the CBOE Volatility Index (INDEX: VIX) from 0-100.

What To Expect

As evidenced by a b-shaped liquidation break profile distribution (i.e., morning drop on fast tempo, followed by sideways trade) there was likely selling by short-term momentum-driven participants who had poor location.

We are confident this may be the case given where the price is, relative to the volume-weighted average price (VWAP) anchored from the Federal Open Market Committee (FOMC) announcement, last week; the average buyer, since then, is losing.

To note, given the context – lackluster breadth and market liquidity metrics – the failure to expand the range, markedly, suggests there was no new money selling.

This activity, which marks a potential willingness to clear stubborn inventory and break balance, is occurring in the face of poor structure down below, a dynamic that adds to technical instability.

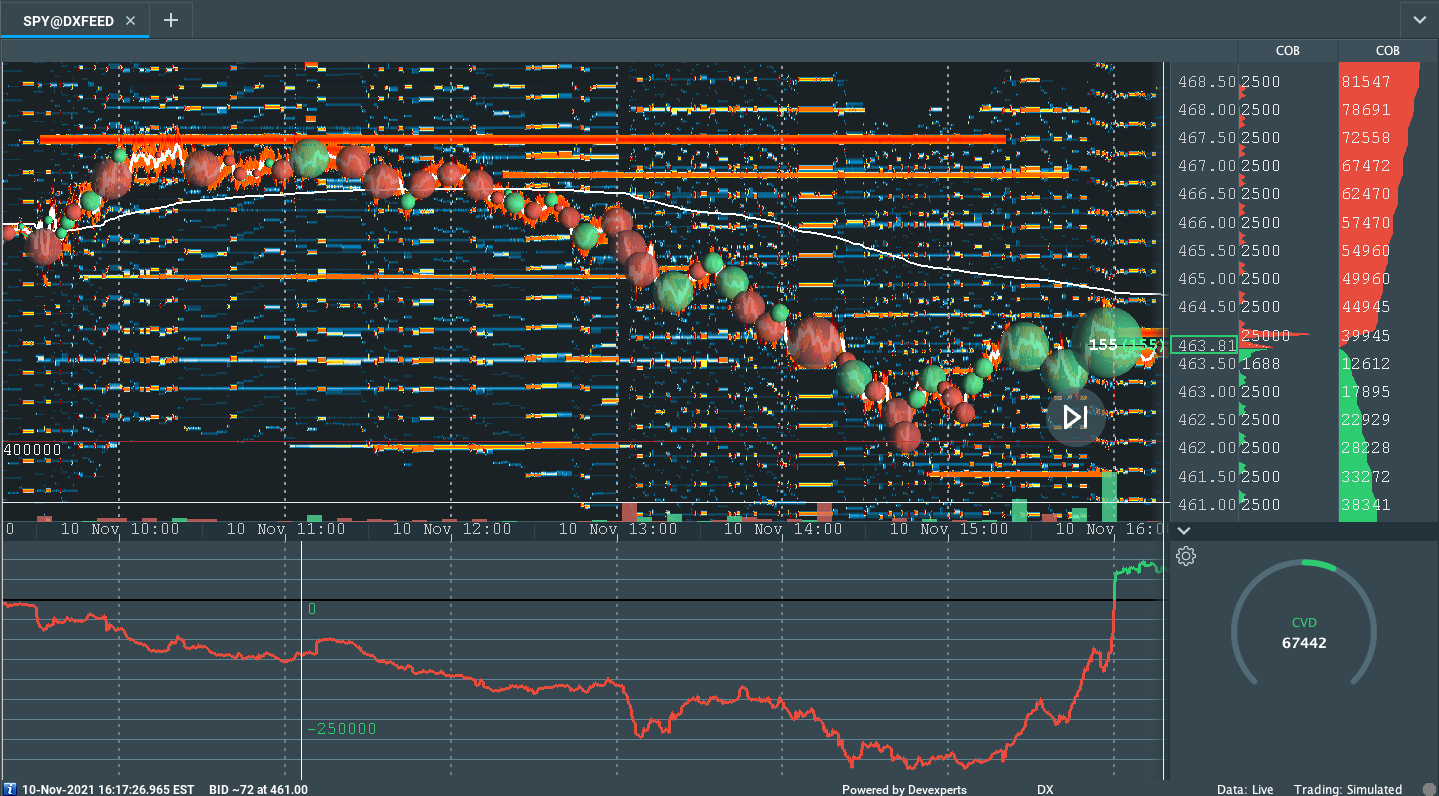
Graphic: Divergent delta (i.e., non-committed selling as measured by volume delta or buying and selling power as calculated by the difference in volume traded at the bid and offer) in SPDR S&P 500 ETF Trust (NYSE: SPY), one of the largest ETFs that track the S&P 500 index, via Bookmap. The readings are supportive of responsive trade (i.e., rotational trade that suggests current prices offer favorable entry and exit; the market is in balance).

Context: Yesterday, I made an emphasis on some of the “high leverage and risk” short-term speculators’ record call buying and put selling posed on the equity market, at large.

That’s odd. Why? 

Well, into the near-vertical price rise of highly volatile stocks like Tesla Inc (NASDAQ: TSLA), customers (you and I) signed up, through the agency of counterparties, to add liquidity to the market, via options activity.

Graphic: Customers took on significant leverage in their purchase and sale of options, via SpotGamma.

So long as implied volatility remained bid (and stock prices go to the moon) – the effect of inadequate liquidity – counterparties were to exacerbate upside volatility in hedging their exposure to customer positioning. In other words, dealer short-gamma.

Note those participants that take the other side of options trades will hedge their exposure to risk by buying and selling the underlying. 

When dealers are short-gamma (e.g., Tesla), they buy into strength and sell into weakness, exacerbating volatility

When dealers are long-gamma (e.g., S&P 500), counterparties buy into weakness and sell into strength, calming volatility.

Enter shock – Elon Musk selling Tesla stock – alongside a decline in implied volatility, amidst a build of gamma at higher stock prices (which has the effect of dampening realized volatility), we saw the unthinkable happen; high-flying stocks (more so Tesla, which is a large S&P 500 index constituent) turned away from the moon and headed back to earth.

The implications of this were staggering; the bulk of customers’ short puts (long calls) quickly rose (declined) in value and traded in-the-money (out-of-the-money). 

As SpotGamma noted, yesterday, “[t]here was a serious dearth of liquidity to start today’s session,” and volatility rose, as a result, in compensating for that fact.

Now, if customer short put, counterparty long put. 

To hedge, counterparty ought to buy, right? Nope

As SqueezeMetrics explains, “Sold puts are, quite literally, a bunch of huge buy limit orders below the market, and then a bunch of liquidity-taking stop-losses further down.”

Graphic: SqueezeMetrics unpacks implications of short put options on the limit order book.

This is, to put it simply, due in part to short-term speculators lacking the wherewithal to stay in these margin-intensive positions; as price falls, put buying (covering of shorts, too) takes liquidity and destabilizes the market.

We’re starting to see this activity, in individual stocks, affect the S&P 500 complex, too

The CBOE Volatility Index (INDEX: VIX) was higher, with demand coming in across the front area of the VIX futures term structure, mostly; both suggest a demand for hedges and a reduction in the flows (e.g., vanna) that support sideways to higher trade. 

Graphic: Demand for options hedges comes in at the front end of the term structure.

That has already been reflected by the trend of outperformance in the extended day. 

In other words, the front-running of increasingly impactful (and supportive) vanna and charm flows (both of which are tied to the hedging of options exposure), as a result of increased options activity (which, at least at this juncture, exposes customers to high leverage and risk), seems to be changing, slowly. 

We’re (likely) opening sideways to lower today. That’s a change, for once!

With expectations that there may be a front-running of the monthly (OPEX) options expiration (into which the forces that promote pining usually turn stronger with counterparties supplying more liquidity as their long gamma rises), a time when dealer gamma exposure is to decline, allowing for increased realized volatility (as a result of less liquidity), the added demand for hedges (as evidenced by the bid in volatility and VIX term structure shift), is of concern. 

Participants have been uber bullish, up until early this week. Should sentiment turn, and (1) those participants cover their levered, long delta exposure alongside (2) new money hedging, tempo ought to quicken; an abrupt liquidation could be in the cards.

Graphic: @pat_hennessy breaks down returns for the S&P 500, categorized by the week relative to OPEX. 

In light of seasonality, buybacks, and earnings surprises, the potential for a rally into the end of the year remains strong. As a result, we start to look for big picture references where we may see responsive buying. See the graphic below!

Expectations: As of 5:30 AM ET, Wednesday’s regular session (9:30 AM – 4:00 PM ET), in the S&P 500, will likely open in the middle part of a balanced overnight inventory, inside of prior-range and -value, suggesting a limited potential for immediate directional opportunity.

Balance Scenarios: Modus operandi is responsive trade (i.e., fade the edges), rather than initiative trade (i.e., play the break).

In the best case, the S&P 500 trades sideways or higher; activity above the $4,680.25 overnight high (ONH) puts in play the $4,695.25 micro composite point of control (MCPOC). Initiative trade beyond the MCPOC could reach as high as the $4,711.75 regular trade high and $4,722.00 Fibonacci, or higher.

In the worst case, the S&P 500 trades lower; activity below the $4,680.25 ONH puts in play the $4,658.75 overnight low (ONL). Initiative trade beyond the ONL could reach as low as the $4,619.00 untested point of control (VPOC) and $4,590.00 balance area boundary, or lower.

Click here to load today’s updated key levels into the web-based TradingView charting platform. Note that all levels are derived using the 65-minute timeframe. New links are produced, daily.
Graphic: 65-minute profile chart of the Micro E-mini S&P 500 Futures. Note the low-volume structure beneath current prices. There is the potential for a cave-fill to widen the area deemed favorable to transact at by an increased share of participants. Learn about the profile.

Definitions

Overnight Rally Highs (Lows): Typically, there is a low historical probability associated with overnight rally-highs (lows) ending the upside (downside) discovery process.

Volume Areas: A structurally sound market will build on areas of high volume (HVNodes). Should the market trend for long periods of time, it will lack sound structure, identified as low volume areas (LVNodes). LVNodes denote directional conviction and ought to offer support on any test. 

If participants were to auction and find acceptance into areas of prior low volume (LVNodes), then future discovery ought to be volatile and quick as participants look to HVNodes for favorable entry or exit.

Vanna: The rate at which the delta of an option changes with respect to volatility.

Charm: The rate at which the delta of an option changes with respect to time.

POCs: POCs are valuable as they denote areas where two-sided trade was most prevalent in a prior day session. Participants will respond to future tests of value as they offer favorable entry and exit.

MCPOCs: POCs are valuable as they denote areas where two-sided trade was most prevalent over numerous day sessions. Participants will respond to future tests of value as they offer favorable entry and exit.

About

After years of self-education, strategy development, and trial-and-error, Renato Leonard Capelj began trading full-time and founded Physik Invest to detail his methods, research, and performance in the markets.

Additionally, Capelj is a Benzinga finance and technology reporter interviewing the likes of Shark Tank’s Kevin O’Leary, JC2 Ventures’ John Chambers, and ARK Invest’s Catherine Wood, as well as a SpotGamma contributor, developing insights around impactful options market dynamics.

Disclaimer

At this time, Physik Invest does not manage outside capital and is not licensed. In no way should the materials herein be construed as advice. Derivatives carry a substantial risk of loss. All content is for informational purposes only.
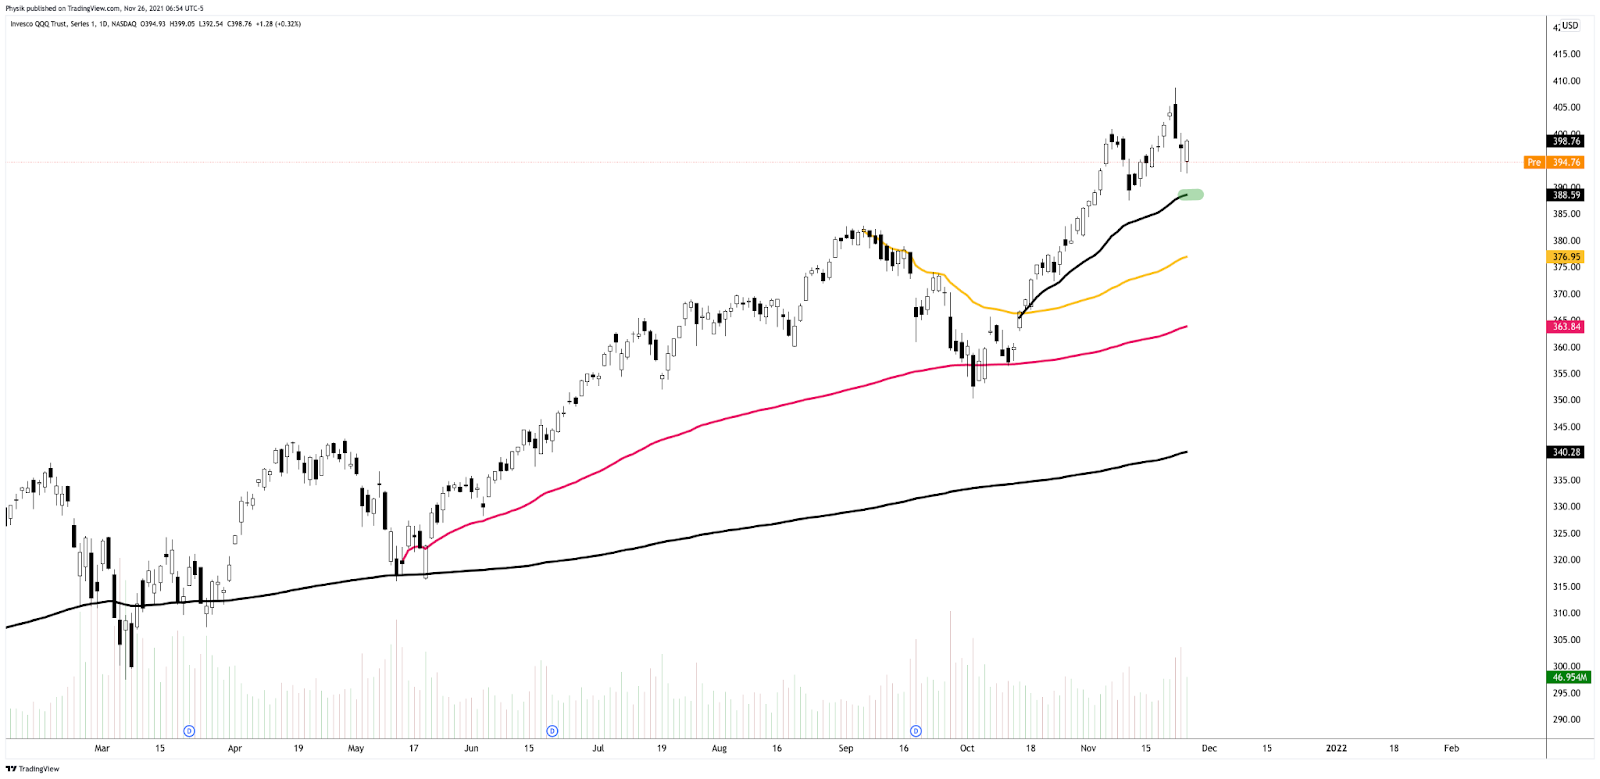
Categories
Commentary

All You Need To Know For November 8, 2021

What Happened

Overnight, equity index futures auctioned sideways to higher alongside an absence in impactful fundamental developments and news catalysts.

Ahead, today, there are no major data releases scheduled.

In the following section, I unpack, in-depth, the fundamental and technical context shadowing recent trade. If you like what is said, consider sharing!
Graphic updated 6:30 AM ET. Sentiment Neutral if expected /ES open is inside of the prior day’s range. /ES levels are derived from the profile graphic at the bottom of the following section. Levels may have changed since initially quoted; click here for the latest levels. SqueezeMetrics Dark Pool Index (DIX) and Gamma (GEX) calculations are based on where the prior day’s reading falls with respect to the MAX and MIN of all occurrences available. A higher DIX is bullish. At the same time, the lower the GEX, the more (expected) volatility. Learn the implications of volatility, direction, and moneyness. SHIFT data used for S&P 500 (INDEX: SPX) options activity. Note that options flow is sorted by the call premium spent; if more positive then more was spent on call options. Breadth reflects a reading of the prior day’s NYSE Advance/Decline indicator. VIX reflects a current reading of the CBOE Volatility Index (INDEX: VIX) from 0-100.

What To Expect

On supportive intraday breadth and lackluster market liquidity metrics, the best case outcome occurred, evidenced by a gap and hold of newly discovered S&P 500 prices.

This activity, which marks a potential willingness to continue the trend, coincides with poor structure, a dynamic that adds to technical instability.

Graphic: Divergent delta (i.e., buying and selling power as calculated by the difference in volume traded at the bid and offer) in SPDR S&P 500 ETF Trust (NYSE: SPY). The readings are supportive of responsive trade (i.e., rotational trade that suggests current prices offer favorable entry and exit; the market is in balance).

Context: The aforementioned trade is happening in the context of interesting developments with respect to fiscal and monetary policy, as well as supply and demand imbalances.

To start, in regards to fiscal policy, ARK Invest’s Cathie Wood thinks that there will be no capital gains tax rate increases and an installment of a minimum corporate tax (about 15%). 

“I think that is one reason the market’s been rallying,” she said in an episode of In The Know

In sticking with Wood’s theses, why would the market be rallying if all that we (i.e., the market participants) see, in the news, is heavily focused around fears of inflation, so to speak? It wouldn’t; Wood feels that inflation is on its way out.

Major reasons? 

(1) Productivity increases will offset dented margins and therefore not lead to impactful price increases; (2) turmoil, with respect to China’s housing and financial sector, ought to depress commodity pricing further as “when China has caught a cold, commodity prices get pneumonia”; (3) at-home inventory build-ups may takeaway from consumption during the holidays (for which businesses are scrambling to increase inventories), and this ultimately should be reflected in commodity prices, given excess inventory; (4) disruptive innovation and declining cost curves.

“The markets are conflicting,” she explains. “You’ve got energy and financials at the top for the year, 54% and 35%, respectively. Those two sectors are associated with very strong boom time economies with a yield curve steepening, meaning long rates are rising faster than short rates.”

“That would be consistent with inflation, but the other two top-performing sectors are real estate and consumer discretionary, and those do not benefit from inflation. They benefit from inflation coming down and lower interest rates.”

The bond market, on the other hand, is in the lower inflation camp. At the same time, the dollar is going up alongside assets like bitcoin, often construed as an inflation hedge.

“Could this mean that the velocity of money is going down,” she asks. “Velocity of money has been coming down because people have been saving and putting money into assets.”

This dynamic is supported by disappointing GDP figures with growth coming mostly from inventories; “Real final sales were slightly negative. Could it be … that [millennials] would prefer not to spend on goods and services, but to invest?”

It seems that participants are increasingly extending moneyness to nonmonetary assets – given monetary policies and an environment of debt and leverage that ultimately cuts into asset price volatility – adding to the prevailing risks of carry when volatility does rise and the demand for money pushes deflation.

A great explainer on the growth of global carry is the book titled The Rise of Carry: The Dangerous Consequences of Volatility Suppression and the New Financial Order of Decaying Growth and Recurring Crisis.

“Ivy Zelman of Zelman Research came out this week. She made a fantastic call on the housing bubble and bust starting in 05-06, and she was right, just a little early. She is very concerned that the housing prices we’re seeing right now are not sustainable,” because of speculation, as well as iBuying and private equity participation. 

For instance, just last week, Zillow Group Inc (NASDAQ: Z), a major iBuyer, sought to raise liquidity, dumping properties en masse.

“This is unsustainable … and I’m wondering if even the housing market inflation is going to give way, here,” Wood added. 

That leads to the question: what effects will a taper and the eventual reduction in the Federal Reserve’s balance sheet – a removal of liquidity – have?

Thus far, given monetary frameworks and max liquidity, markets rallies have been enforced by some of the processes embedded within the volatility market

To quote Cem Karsan of Kai Volatility: “There’s this constant structural positioning that naturally drives markets higher as long as volatility is compressed, or there’s a supply of volatility.”

“As volatility is compressed, … the hedging vanna and charm flows, and whatnot will push the markets higher,” Karsan added in reference to options sliding down their term structure (vanna) and skew decaying (charm). Both dynamics have counterparties covering their hedges to the most dominant customer positioning in the market (i.e., short call, long put). 

With option volumes now comparable to stock volumes, related hedging flows can represent an increased share of volume in underlying stocks; “It’s not a coincidence that the mid-February to mid-March 2020 downturn literally started the day after February expiration and ended the day of March quarterly expiration. These derivatives are incredibly embedded in how the tail reacts and there’s not enough liquidity, given the leverage, if the Fed were to taper.”

Learn more about the implications of convexity, edge, and risk management, as well as Liquidity Cascades: The Coordinated Risk of Uncoordinated Market Participants.

Aside from a lot of these big picture dynamics – growing derivatives markets and tail risk, the heightened moneyness of nonmonetary assets, trends in seasonality, earnings surprises, and more – we have some more impactful near-term happenings to be aware of.

Graphic: “Whenever the market has been up 20%+ YTD through to October (like e.g. THIS YEAR), it has *always* had an up month in November (albeit with a n=8). Basically I would say it speaks to the momentum in the market, which despite the September stumble seems pretty much alive and well.” – Callum Thomas

The first is fragile positioning. The second is the monthly options expiration (OPEX). 

According to SqueezeMetrics analyses, “middling dark pool sentiment and middling gamma exposure [portends] … 1-month negative returns.”

Alongside that, according to data compiled and analyzed by Pat Hennessy, “2 weeks prior to OPEX (e.g., 7/30/21 to 8/6/21 in this late-cycle) [have] been extremely bullish,” while “OPEX week returns peaked in 2016 and have trended lower since.”

Graphic: @pat_hennessy breaks down returns for the S&P 500, categorized by the week relative to OPEX. 

This comes as investors marked the S&P 500 up to the $4,700.00 strike, at which positive gamma – delta sensitivity to underlying price – is highest. 

In referencing a note I wrote for SpotGamma, “as volatility continues to decline, the gamma of those options, which are now at the money, ought to increase, forcing counterparties to supply more liquidity.”

Ultimately, $4,700.00 ought to be a magnet (or resistance) into that aforementioned pre-OPEX weakness.

This is unless (1) volatility declines markedly, “a tailwind for the S&P complex as options slid[ing] down their term structure would cause dealers to continue covering their hedges in an asymmetric manner,” or (2) more capital is committed to options at higher strikes. 

Graphic: SpotGamma shows large positive gamma at the $4,700.00 strike. “Large options strikes are considered to be support or resistance zones. The change in gamma at various levels over time can shed light on how traders are viewing the market (i.e., adding calls is bullish, puts bearish).”

Expectations: As of 6:30 AM ET, Monday’s regular session (9:30 AM – 4:00 PM ET), in the S&P 500, will likely open in the upper part of a positively skewed overnight inventory, inside of prior-range and -value, suggesting a limited potential for immediate directional opportunity.

Market Is In Balance: Current prices offer favorable entry and exit. Modus operandi is responsive trade (i.e., fade the edges), rather than initiative trade (i.e., play the break).

In the best case, the S&P 500 trades sideways or higher; activity above the $4,674.75 visual low (likely paid attention to by short-term, technically driven market participants who seldom defend retests) puts in play the $4,711.75 regular trade high (RTH High). Initiative trade beyond the RTH High could reach as high as the $4,722.00 and $4,735.00 Fibonacci, or higher.

In the worst case, the S&P 500 trades lower; activity below the $4,674.75 visual low puts in play the $4,663.00 untested point of control (VPOC). Initiative trade beyond the VPOC could reach as low as the $4,619.00 VPOC and $4,590.00 balance area boundary (BAH), or lower.

As an aside, the $4,674.75 visual low corresponds with the volume-weighted average price (VWAP) anchored at last week’s Federal Open Market Committee (FOMC) meeting. 

This is a metric highly regarded by chief investment officers, among other participants, for quality of trade. Additionally, liquidity algorithms are benchmarked and programmed to buy and sell around VWAPs.

Click here to load today’s updated key levels into the web-based TradingView charting platform. Note that all levels are derived using the 65-minute timeframe. New links are produced, daily.
Graphic: 65-minute profile chart of the Micro E-mini S&P 500 Futures. Learn about the profile.

Definitions

Gamma: Gamma is the sensitivity of an option to changes in the underlying price. Dealers that take the other side of options trades hedge their exposure to risk by buying and selling the underlying. When dealers are short-gamma, they hedge by buying into strength and selling into weakness. When dealers are long-gamma, they hedge by selling into strength and buying into weakness. The former exacerbates volatility. The latter calms volatility.

Vanna: The rate at which the delta of an option changes with respect to volatility.

Charm: The rate at which the delta of an option changes with respect to time.

POCs: POCs are valuable as they denote areas where two-sided trade was most prevalent in a prior day session. Participants will respond to future tests of value as they offer favorable entry and exit.

Options Expiration (OPEX): Traditionally, option expiries mark an end to pinning (i.e, the theory that market makers and institutions short options move stocks to the point where the greatest dollar value of contracts will expire) and the reduction dealer gamma exposure. In recent history, this reset in dealer positioning has been front-run; prior, there was an increase in volatility after the removal of large options positions and associated hedging.

About

After years of self-education, strategy development, and trial-and-error, Renato Leonard Capelj began trading full-time and founded Physik Invest to detail his methods, research, and performance in the markets.

Additionally, Capelj is a Benzinga finance and technology reporter interviewing the likes of Shark Tank’s Kevin O’Leary, JC2 Ventures’ John Chambers, and ARK Invest’s Catherine Wood, as well as a SpotGamma contributor, developing insights around impactful options market dynamics.

Disclaimer

At this time, Physik Invest does not manage outside capital and is not licensed. In no way should the materials herein be construed as advice. Derivatives carry a substantial risk of loss. All content is for informational purposes only.

Categories
Commentary

Daily Brief For November 5, 2021

Abstract

Equity index futures higher. Commodities were higher. Bonds mixed. Volatility compressed.

Ahead is a heavier day of economic releases, in the face of fundamental narratives and positioning metrics that may support intraday price stability.

What Happened

Overnight, equity index futures were marked up ahead of the House’s plan to vote on President Joe Biden’s economic package and infrastructure, as well as October jobs data.

Also, in the news, there were narratives surrounding China’s dollar surplus, a pandemic resurgence in Europe, Pfizer Inc’s (NYSE: PFE) development of a pill for COVID-19.

Ahead is data on payrolls, unemployment, and average hourly earnings (8:30 AM ET), as well as consumer credit (3:00 PM ET). I apologize as this is what I listed yesterday, mistakenly.
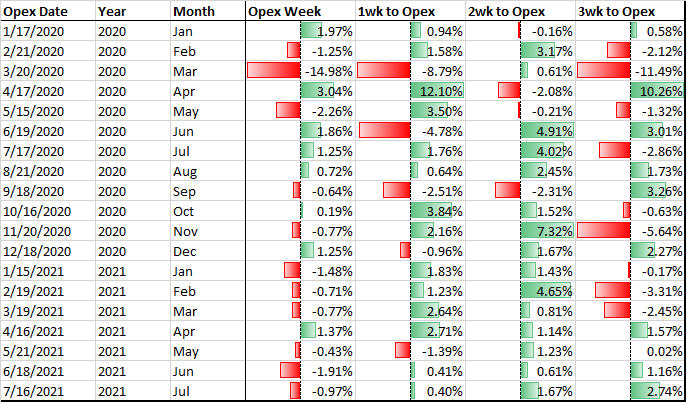
Graphic updated 6:30 AM ET. Sentiment Risk-On if expected /ES open is above the prior day’s range. /ES levels are derived from the profile graphic at the bottom of the following section. Levels may have changed since initially quoted; click here for the latest levels. SqueezeMetrics Dark Pool Index (DIX) and Gamma (GEX) calculations are based on where the prior day’s reading falls with respect to the MAX and MIN of all occurrences available. A higher DIX is bullish. At the same time, the lower the GEX, the more (expected) volatility. Learn the implications of volatility, direction, and moneyness. SHIFT data used for S&P 500 (INDEX: SPX) options activity. Note that options flow is sorted by the call premium spent; if more positive then more was spent on call options. Breadth reflects a reading of the prior day’s NYSE Advance/Decline indicator. VIX reflects a current reading of the CBOE Volatility Index (INDEX: VIX) from 0-100.

What To Expect

On weak intraday breadth and lackluster market liquidity metrics, the best case outcome occurred, evidenced by balanced trade at newly discovered S&P 500 prices.

As also evidenced by the separation of value, overnight, the gap out of yesterday’s range marks a potential willingness to continue the uptrend.

To note, poor structure left behind prior initiative trade adds to technical instability, a dynamic mentioned in prior commentaries. Participants will likely look to check old value (i.e., revisit, repair, and strengthen) pockets of low-volume, feverishly, on any breakdown of trend.

Graphic: Flat delta (i.e., non-committed buying/selling as measured by volume delta or buying and selling power as calculated by the difference in volume traded at the bid and offer) in SPDR S&P 500 ETF Trust (NYSE: SPY), via Bookmap. The readings are supportive of responsive trade (i.e., rotational trade that suggests current prices offered favorable entry and exit).

Context: The aforementioned trade is happening in the context of a slowdown in economic growth, increased clarity on the Federal Reserve’s (Fed) intent to moderate stimulus, as well as the prospects of renewed fiscal support.

The implications of these narratives on price are contradictory.

To elaborate, supply chain disruptions slowed the pace of economic growth, while participants saw both the Fed’s decision to taper and keep rates unchanged, as well as the potential passage of President Biden’s economic plan, today, as near-term positives.

In terms of positioning, the CBOE Volatility Index (INDEX: VIX) was lower, while supply came in across the VIX futures term structure. That, alongside the long-gamma environment and increased demand for options above current prices (i.e., bets on the upside), points to increased odds of near-term equity market stability.

To quote options analysis and data provider SpotGamma, “​​the term structure of IV (this is how high the IV is for longer-dated options) remains elevated. That suggests near term options could have more ‘bleed’ which could keep the SPX market price tailwind intact.”

Expectations: As of 6:30 AM ET, Friday’s regular session (9:30 AM – 4:00 PM ET), in the S&P 500, will likely open in the upper part of a positively skewed overnight inventory, outside of prior-range and -value, suggesting a potential for immediate directional opportunity.

Gap Scenarios: Gaps ought to fill quickly. Should they not, that’s a signal of strength; do not fade. Leaving value behind on a gap-fill or failing to fill a gap (i.e., remaining outside of the prior session’s range) is a go-with indicator.

Auctioning and spending at least 1-hour of trade back in the prior range suggests a lack of conviction; in such a case, do not follow the direction of the most recent initiative activity.
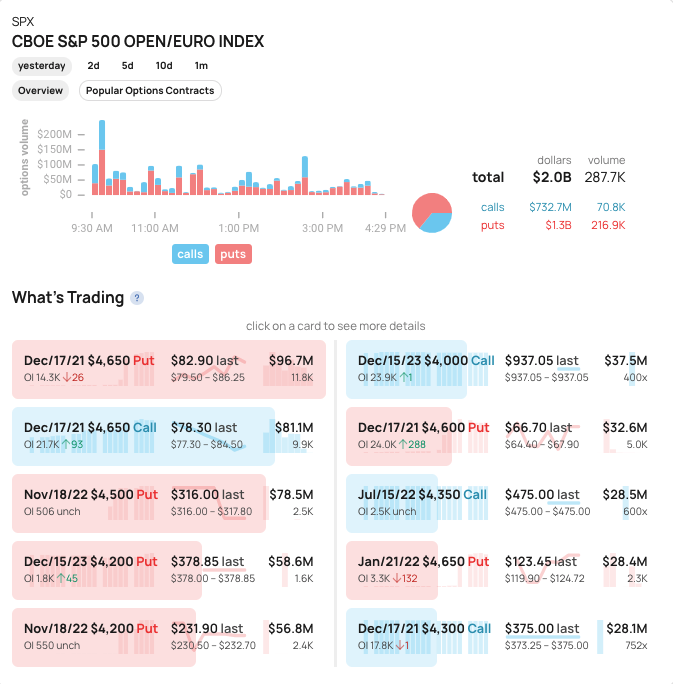
In the best case, the S&P 500 trades sideways or higher; activity above the $4,663.00 untested point of control (VPOC) puts in play the $4,684.25 overnight high (ONH). Initiative trade beyond the ONH could reach as high as the $4,705.25 and $4,725.50 Fibonacci, or higher.

In the worst case, the S&P 500 trades lower; activity below the $4,663.00 VPOC puts in play the $4,619.00 VPOC. Initiative trade beyond the VPOC could reach as low as the $4,590.00 balance boundary and $4,574.25 high volume area (HVNode), or lower.

Click here to load today’s updated key levels into the web-based TradingView charting platform. Note that all levels are derived using the 65-minute timeframe. New links are produced, daily.
Graphic: 65-minute profile chart of the Micro E-mini S&P 500 Futures. Learn about the profile.

Charts To Watch

Graphic: (NASDAQ: AMZN). (S~3403, R~3580). S is for support. R is for resistance. I am seeking to initiate short-duration call structures against the 3580 gap fill and prior all-time high. Will initiate for credit or finance with put structures.
Graphic: (NASDAQ: FB). (S~326.45, R~336.90). S is for support. R is for resistance. If the stock was to maintain prices above 336.90, there is a potential change in tone. In such a case, I’m targeting Fibonacci retracements with call structures financed with credits on the put side.
Graphic: (NASDAQ: GOOGL). (S~2900, R~3113). S is for support. R is for resistance. I’m targeting prices between 3000 and 3100 with call structures for low cost or credit.
Graphic: (NYSE: SHOP). (S~1482, R~1650). S is for support. R is for resistance. Potential break of trend, move to an all-time high.
Graphic: (NYSE: IWM). (S~234.53, R~241.96, 251.41). S is for support. R is for resistance. Russell 2000 breaks out of balance. In my opinion, upon acceptance, there are potential opportunities for long trades.

Other charts I’m watching include BABA (S~155.29), ZM (S~245.92), ARKK (S~120.15), PINS (S~42.06), Z (S~58.15), BBY (S~123.65), GOOS (S~40.91), CTSH (R~82.00), LYFT (S~44.41), TMUS (S~118.00), WDC (51.47). S is for support. R is for resistance. 

What People Are Saying

Definitions

Cave-Fill Process: Widened the area deemed favorable to transact at by an increased share of participants. This is a good development.

Overnight Rally Highs (Lows): Typically, there is a low historical probability associated with overnight rally-highs (lows) ending the upside (downside) discovery process.

Volume Areas: A structurally sound market will build on areas of high volume (HVNodes). Should the market trend for long periods of time, it will lack sound structure, identified as low volume areas (LVNodes). LVNodes denote directional conviction and ought to offer support on any test. 

If participants were to auction and find acceptance into areas of prior low volume (LVNodes), then future discovery ought to be volatile and quick as participants look to HVNodes for favorable entry or exit.

Gamma: Gamma is the sensitivity of an option to changes in the underlying price. Dealers that take the other side of options trades hedge their exposure to risk by buying and selling the underlying. When dealers are short-gamma, they hedge by buying into strength and selling into weakness. When dealers are long-gamma, they hedge by selling into strength and buying into weakness. The former exacerbates volatility. The latter calms volatility.

POCs: POCs are valuable as they denote areas where two-sided trade was most prevalent in a prior day session. Participants will respond to future tests of value as they offer favorable entry and exit.

Balance (Two-Timeframe Or Bracket): Rotational trade that denotes current prices offer favorable entry and exit. Balance-areas make it easy to spot a change in the market (i.e., the transition from two-time frame trade, or balance, to one-time frame trade, or trend). 

Modus operandi is responsive trade (i.e., fade the edges), rather than initiative trade (i.e., play the break).

Value-Area Placement: Perception of value unchanged if value overlapping (i.e., inside day). Perception of value has changed if value not overlapping (i.e., outside day). Delay trade in the former case.

About

After years of self-education, strategy development, and trial-and-error, Renato Leonard Capelj began trading full-time and founded Physik Invest to detail his methods, research, and performance in the markets.

Additionally, Capelj is a Benzinga finance and technology reporter interviewing the likes of Shark Tank’s Kevin O’Leary, JC2 Ventures’ John Chambers, and ARK Invest’s Catherine Wood, as well as a SpotGamma contributor, developing insights around impactful options market dynamics.

Disclaimer

At this time, Physik Invest does not manage outside capital and is not licensed. In no way should the materials herein be construed as advice. Derivatives carry a substantial risk of loss. All content is for informational purposes only.