The daily brief is a free glimpse into the prevailing fundamental and technical drivers of U.S. equity market products. Join the 750+ that read this report daily, below!
Fundamental
Shortened fundamentals section, today.
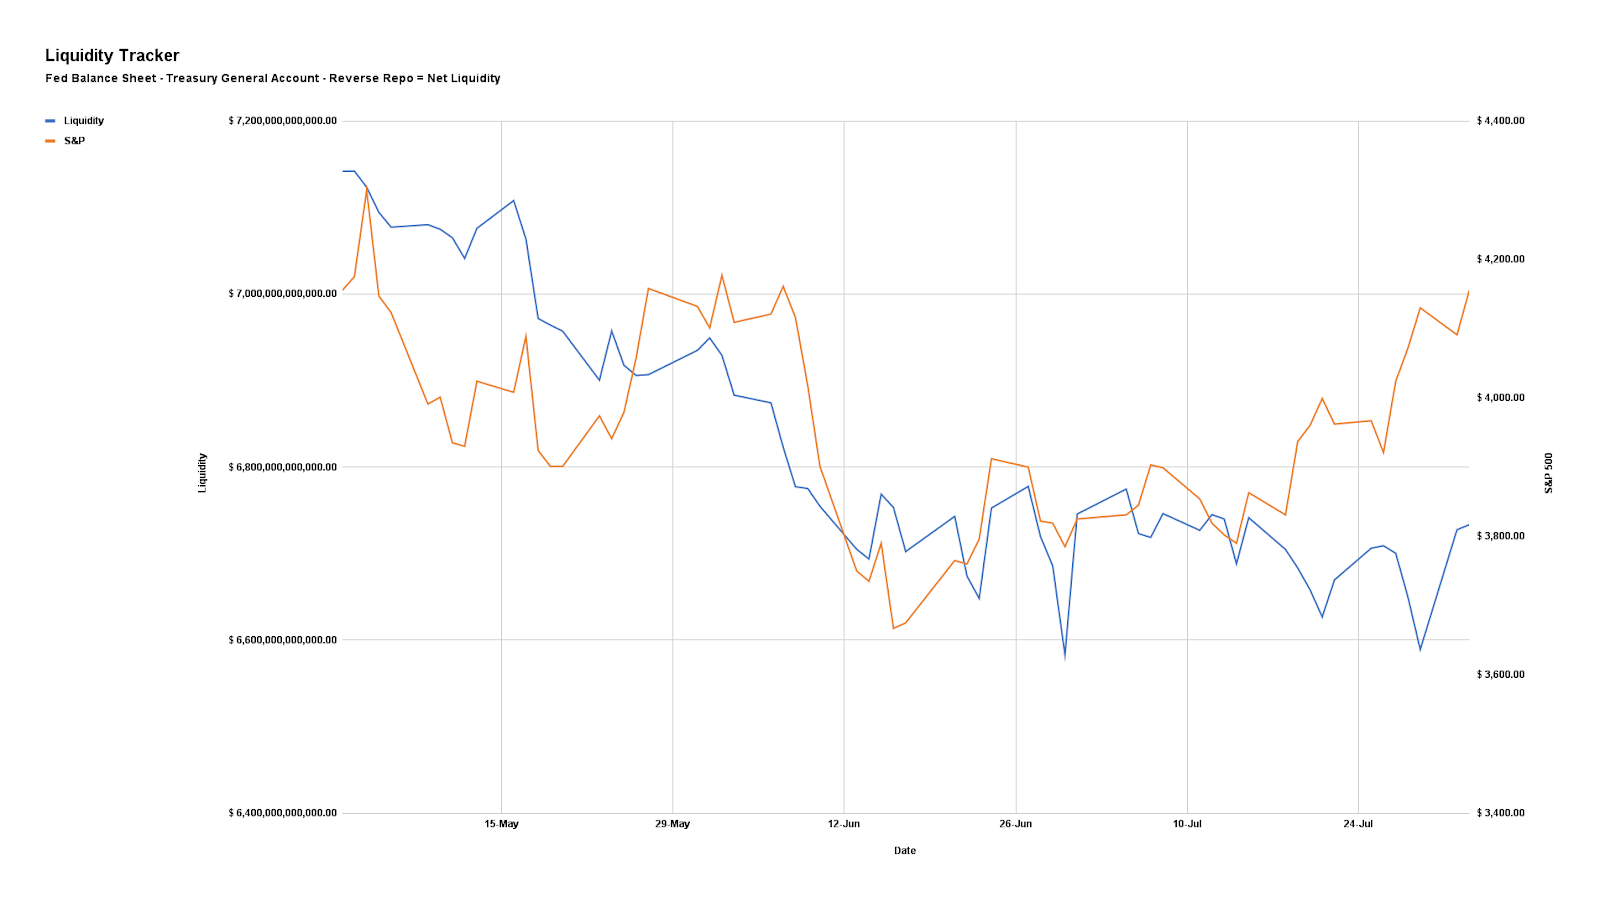
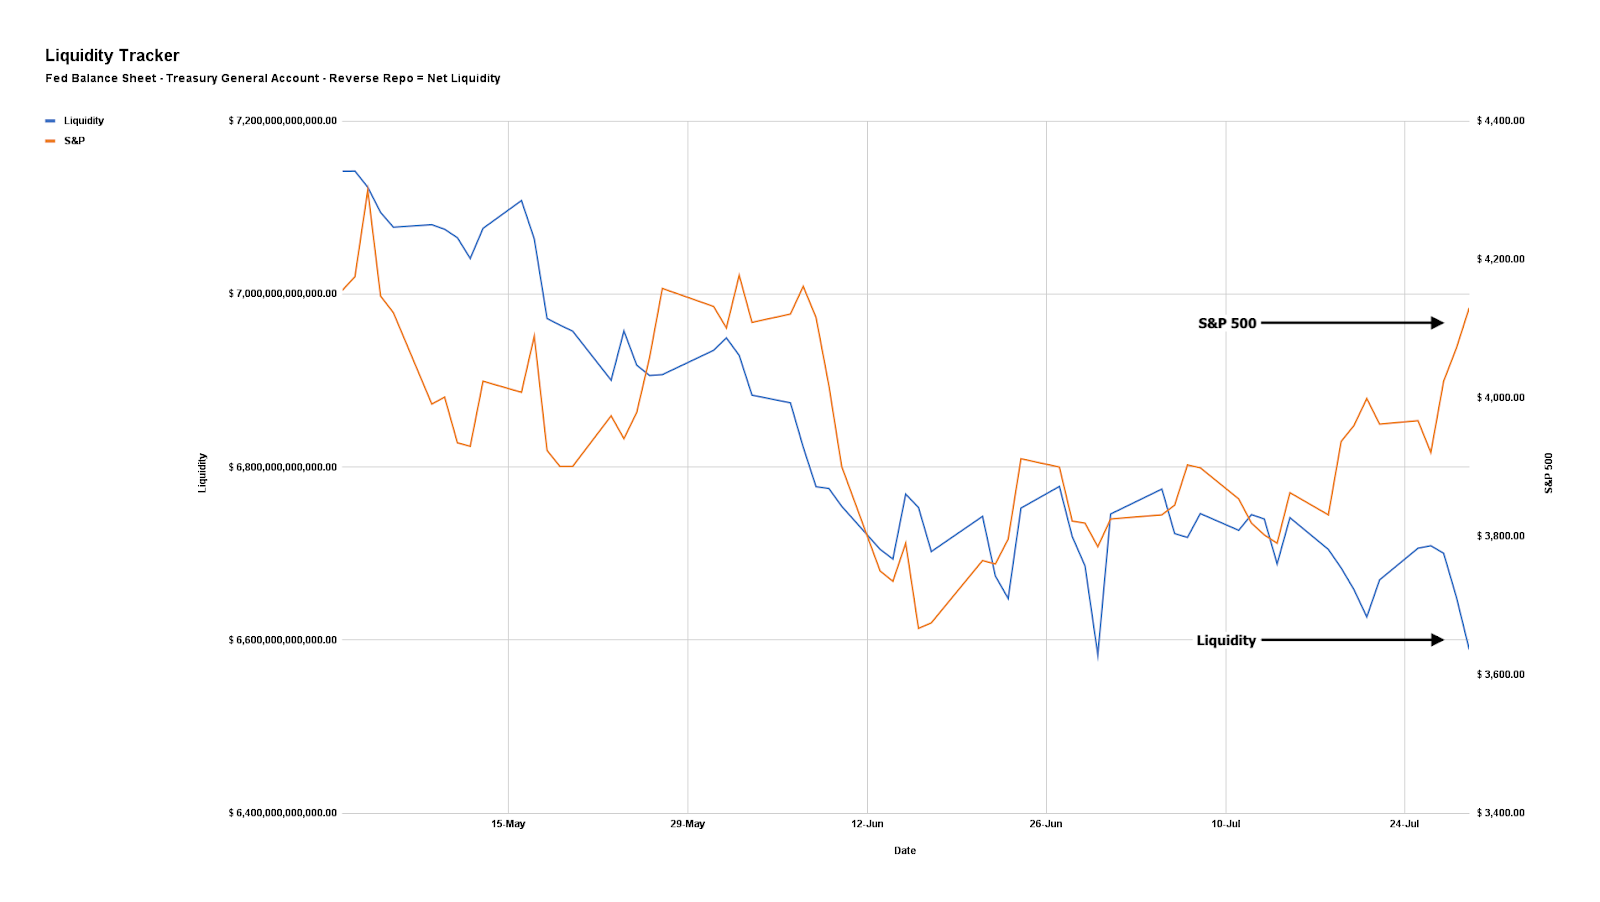
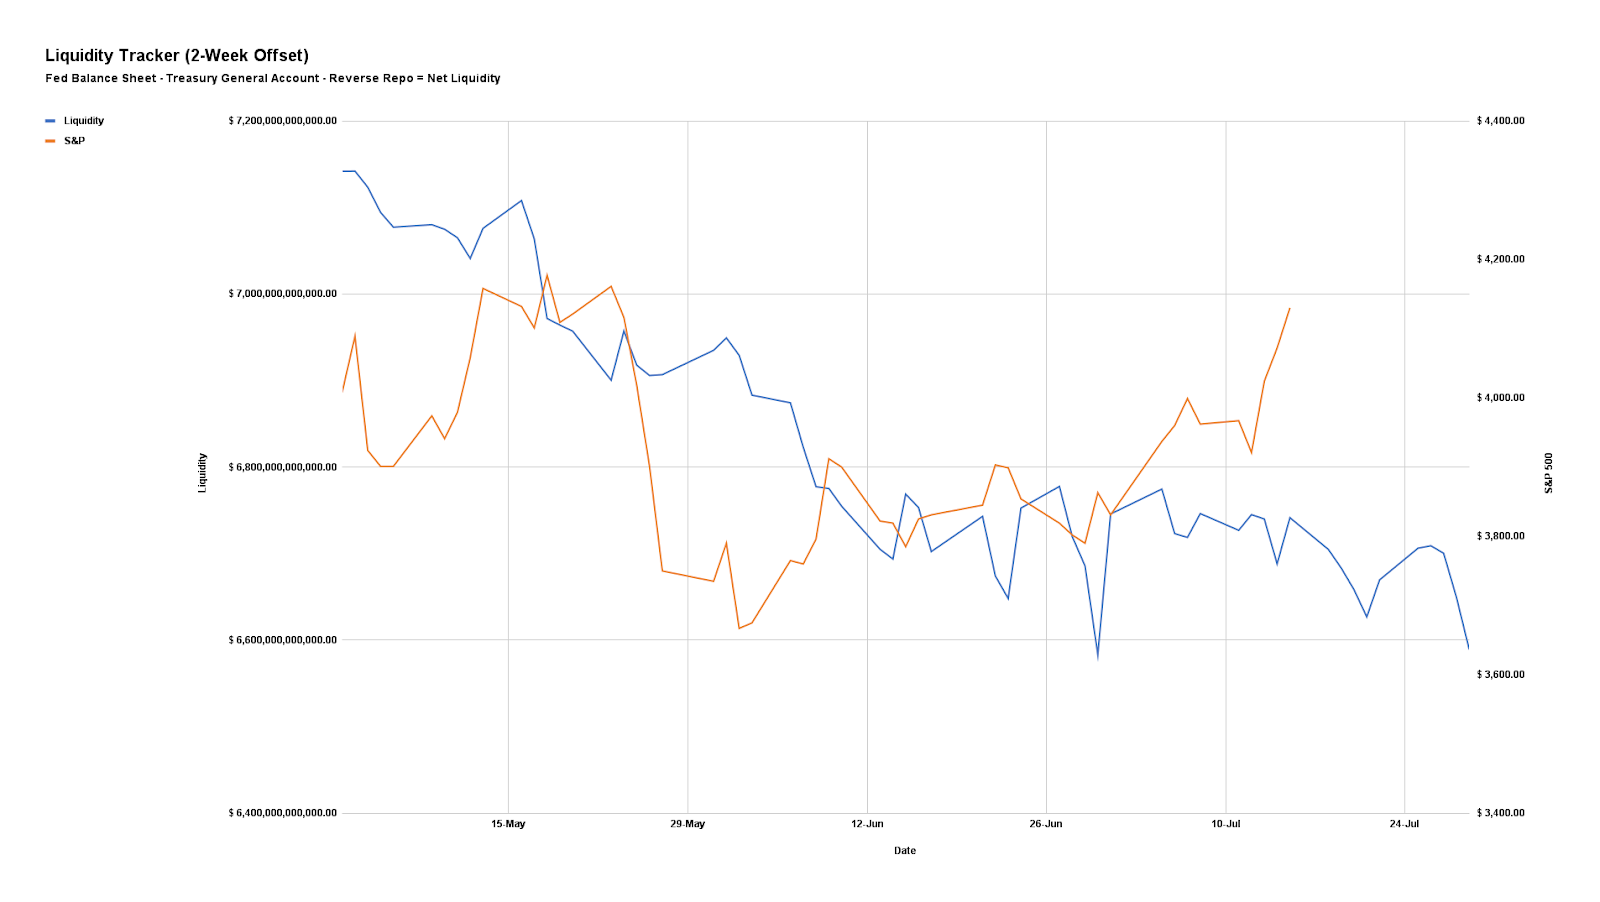
It’s the case that from mid-2020 to late-2021, as well explained by Damped Spring’s Andy Constan, the decline in risk premiums boosted assets, across the board.
Then, when “the drumbeats of quantitative tightening (QT) sounded on December 29,” the expansion in risk premiums bolstered a rotation out of risk.
Per Constan, conditions are unchanged.
The “knee jerk re-leveraging flow [] will not survive the high coupon issuance/QT doubling of the September and Q4. Fade the [fear of missing out] until Turkey day when Santa comes to town.”
Positioning
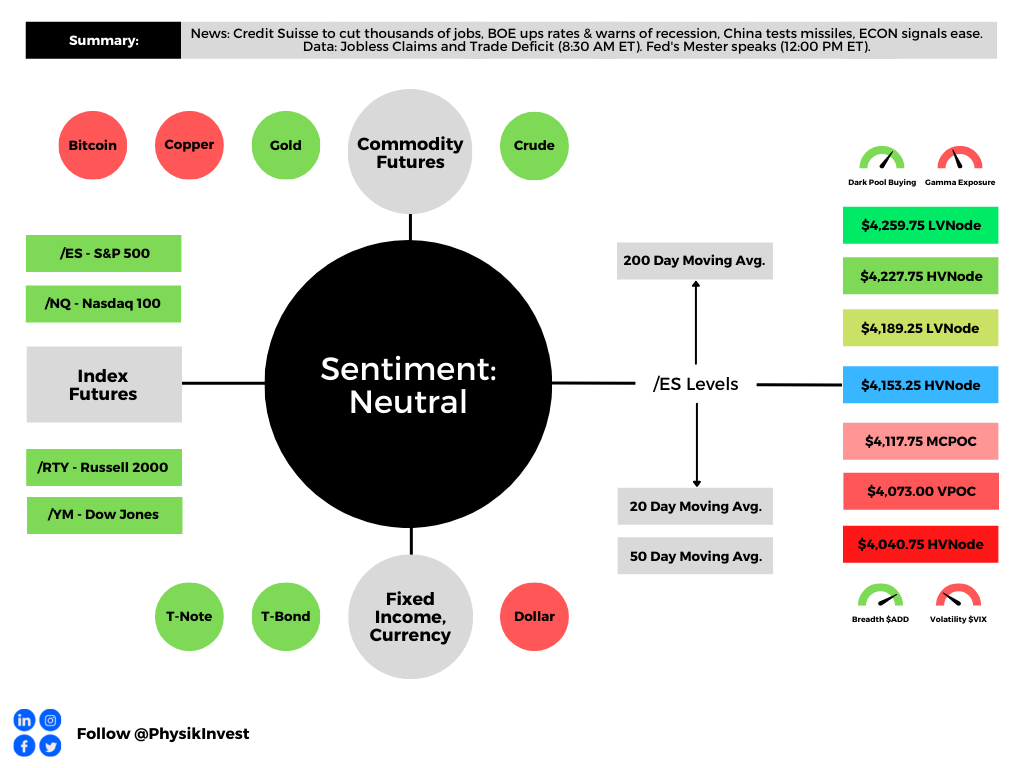
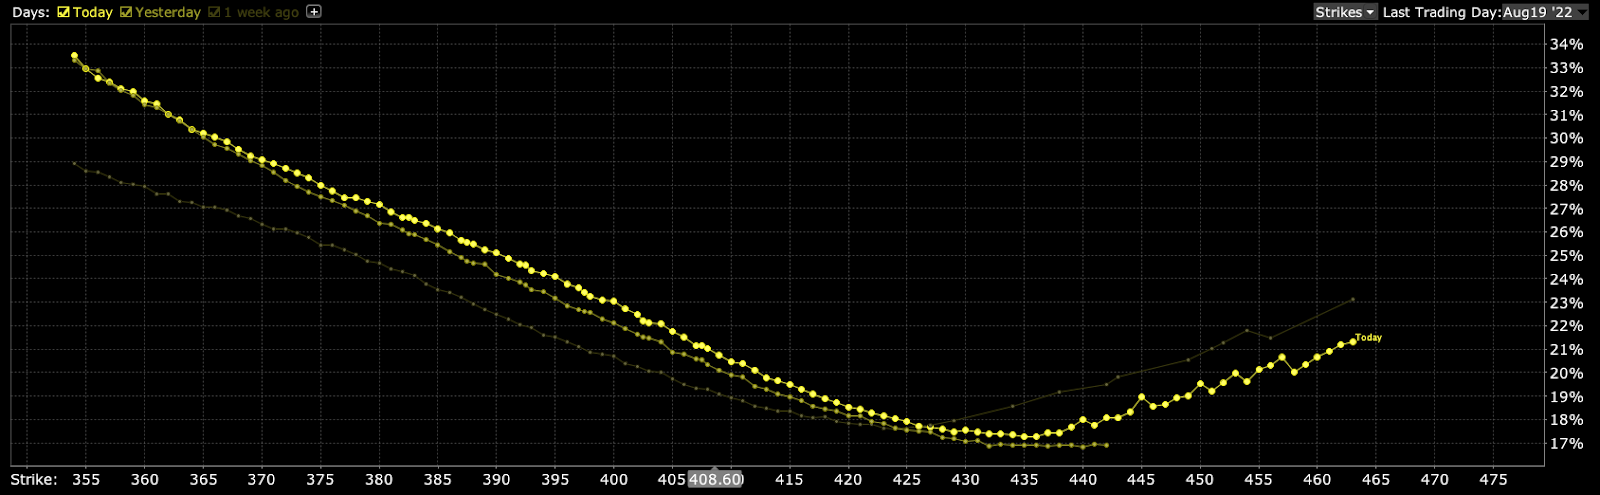
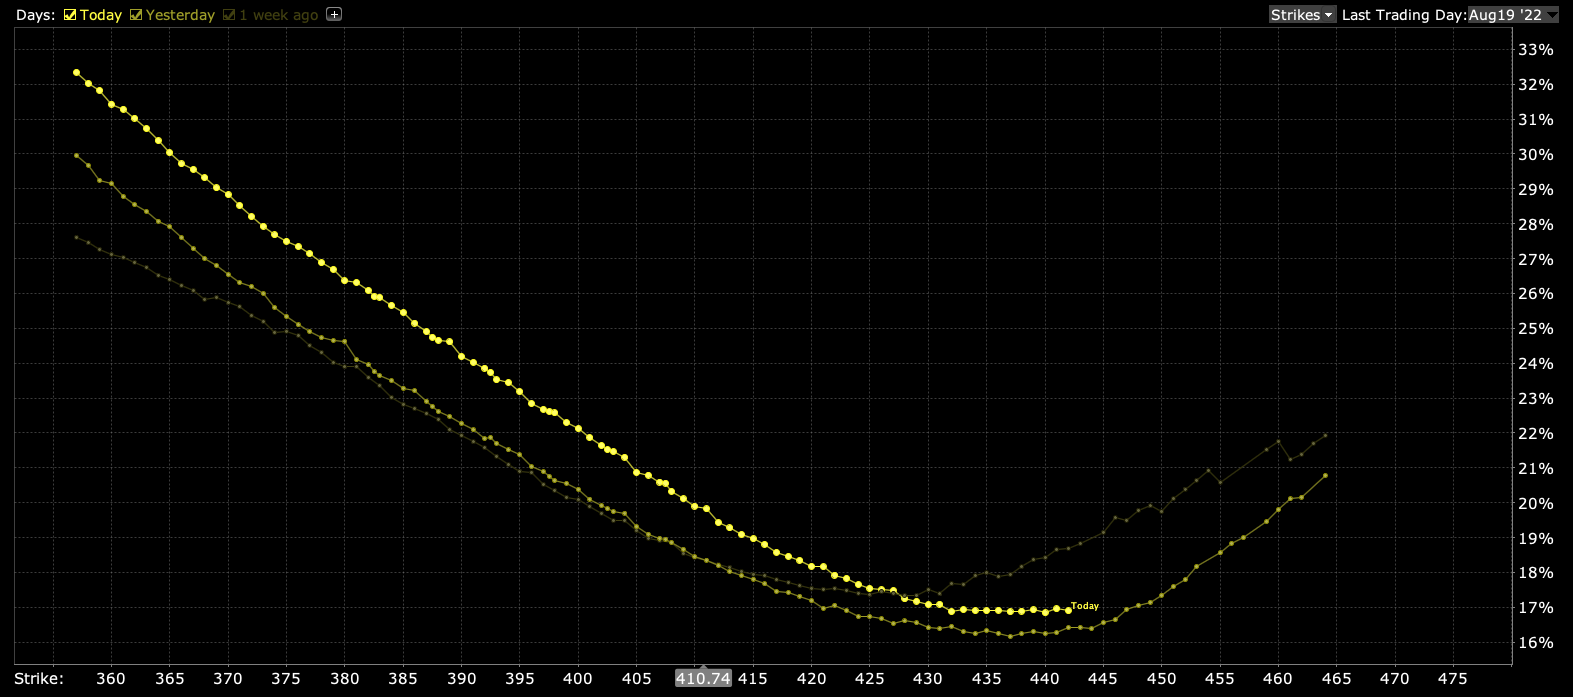
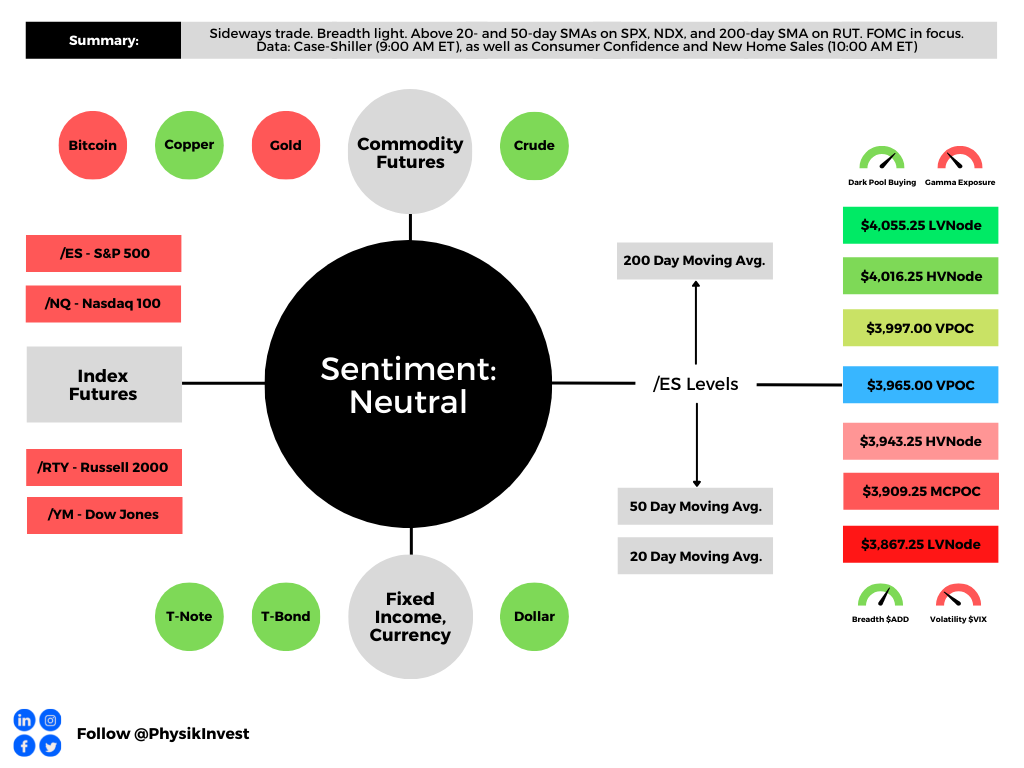
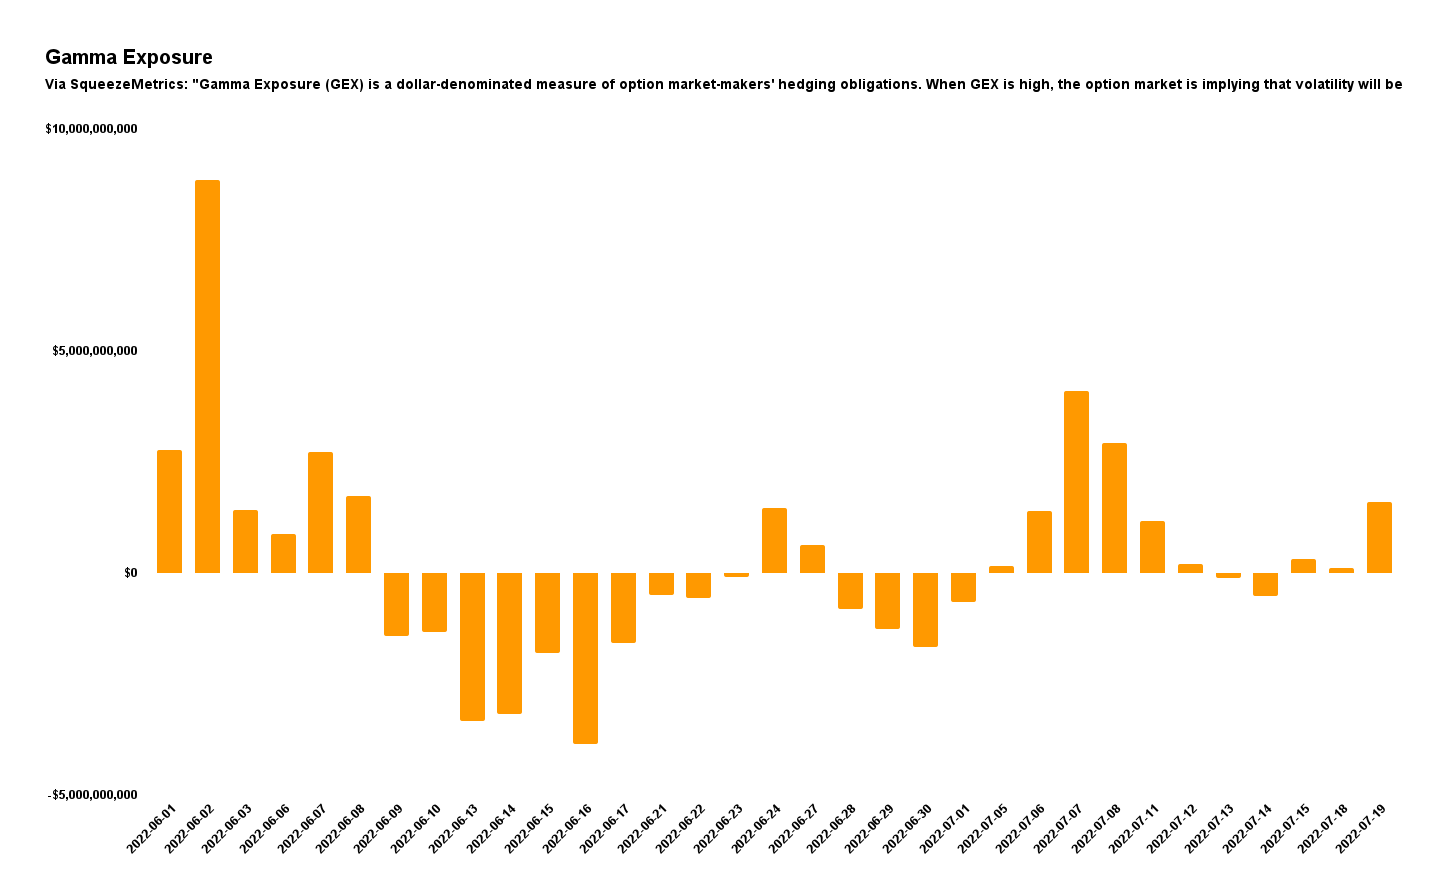
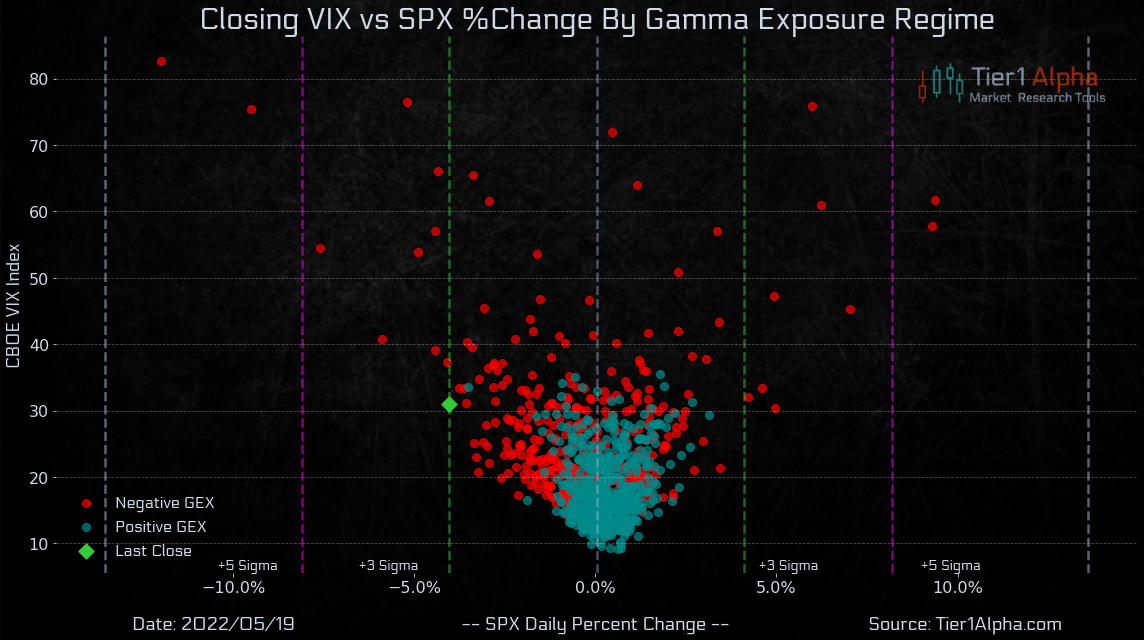
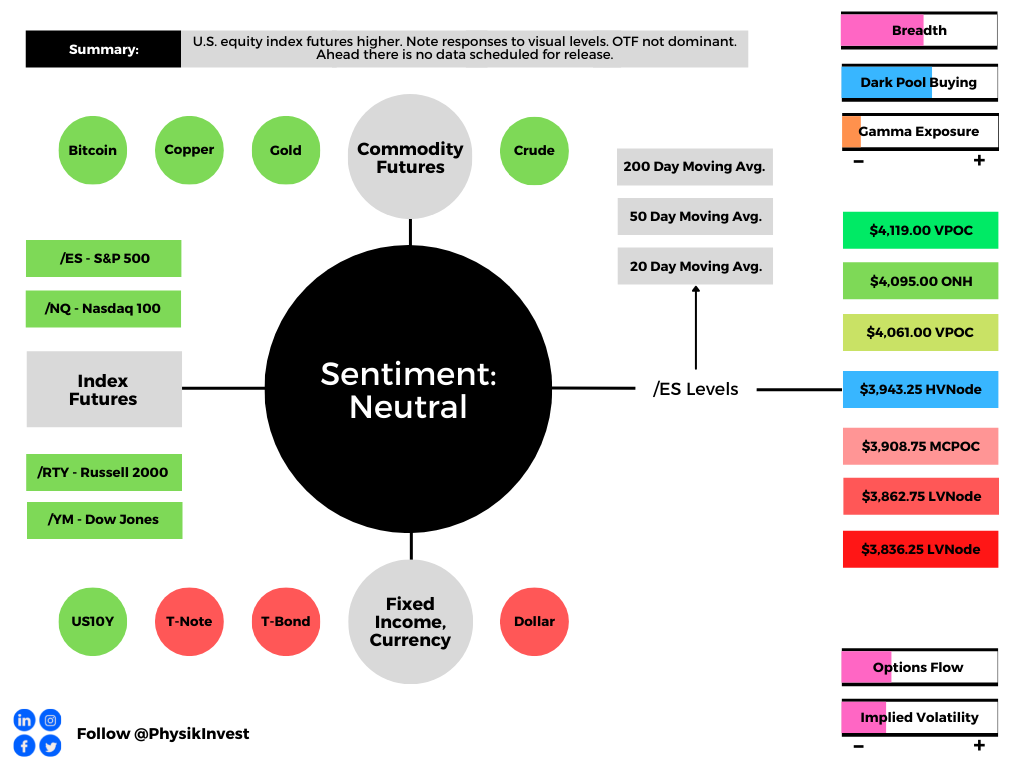
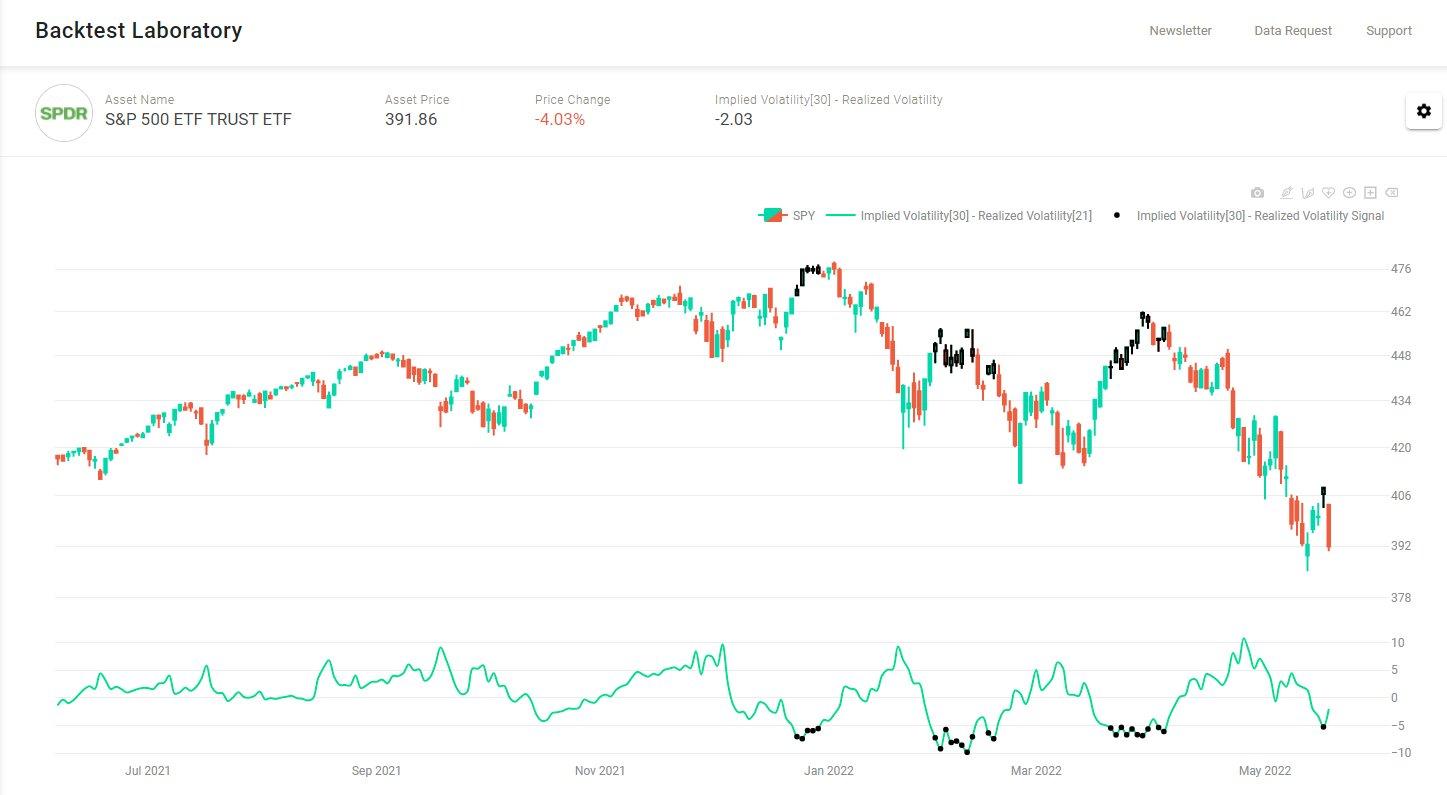
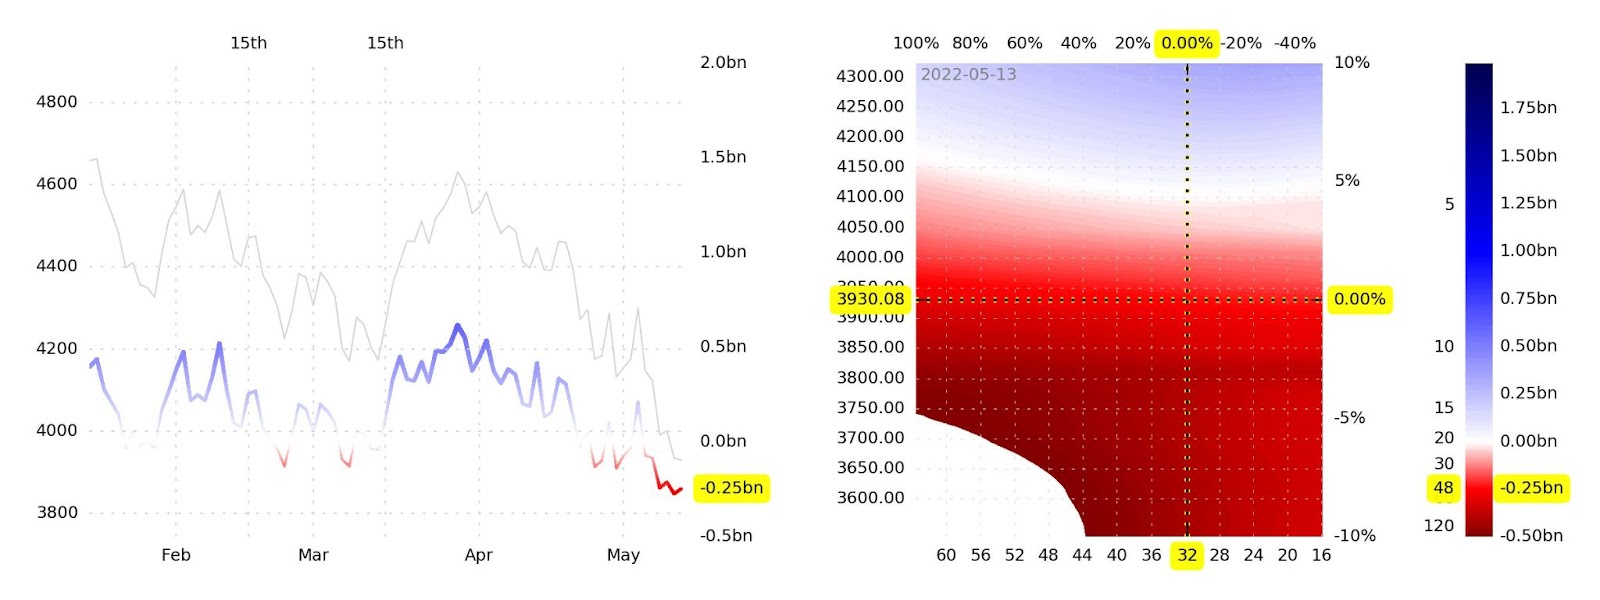
As of 7:00 AM ET, Thursday’s expected volatility, via the Cboe Volatility Index (INDEX: VIX), sits at ~1.14%. Net gamma exposures are increasing which may promote tighter ranges.
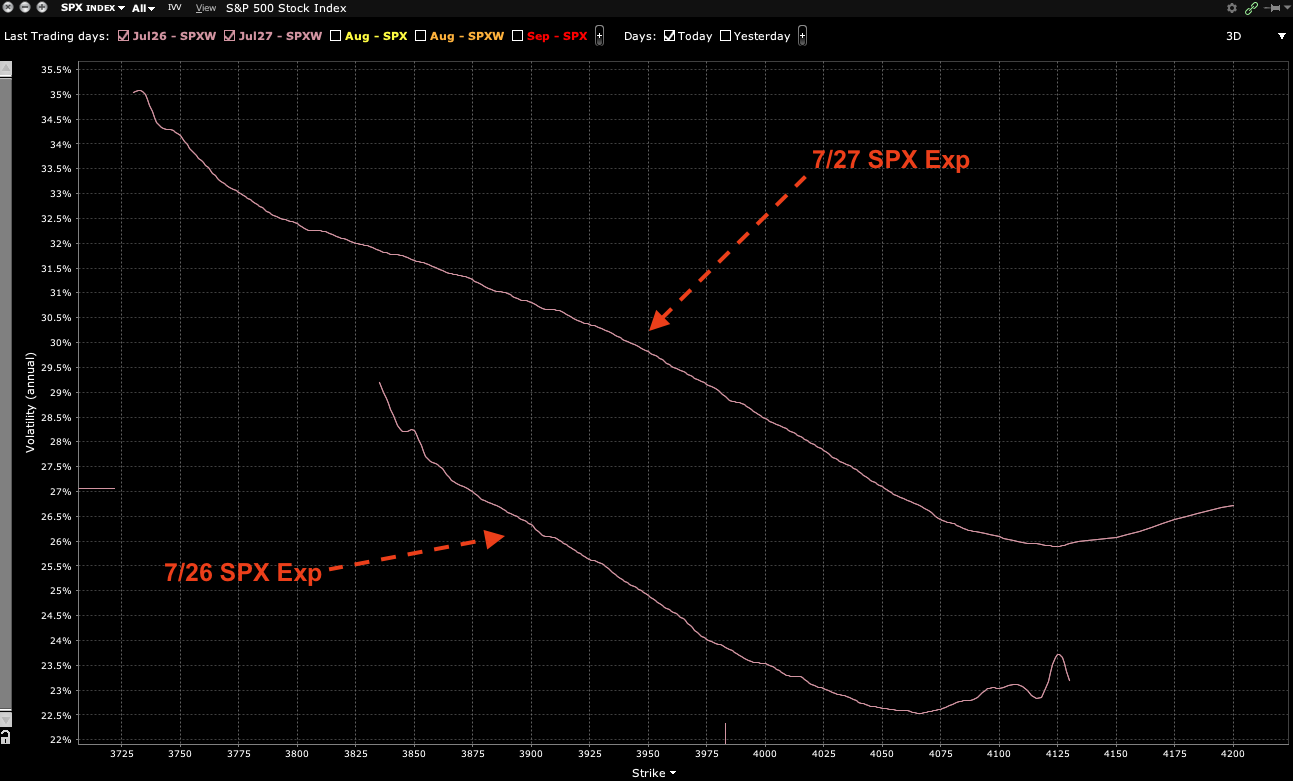
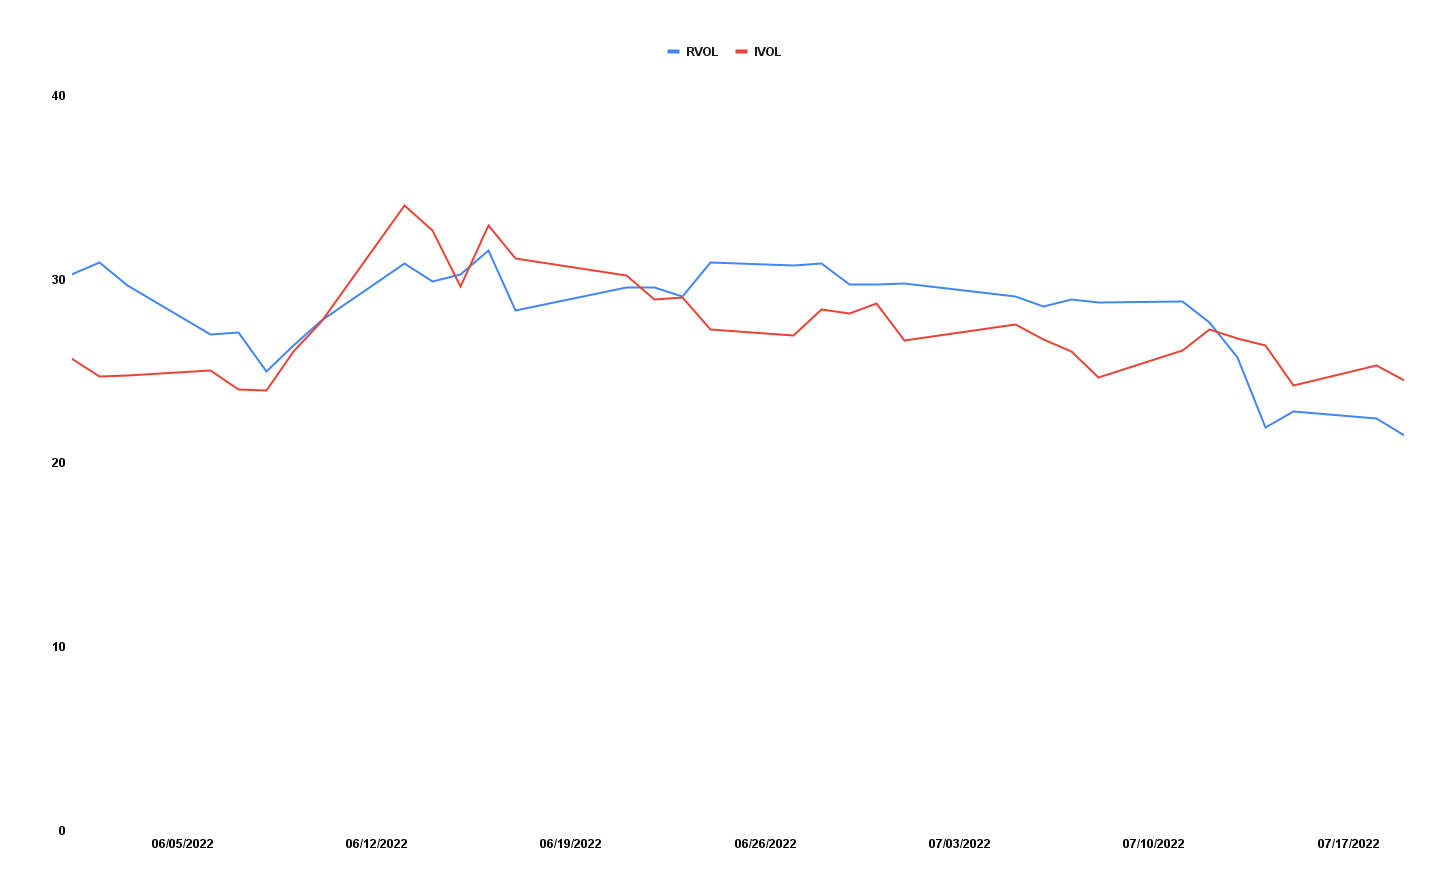
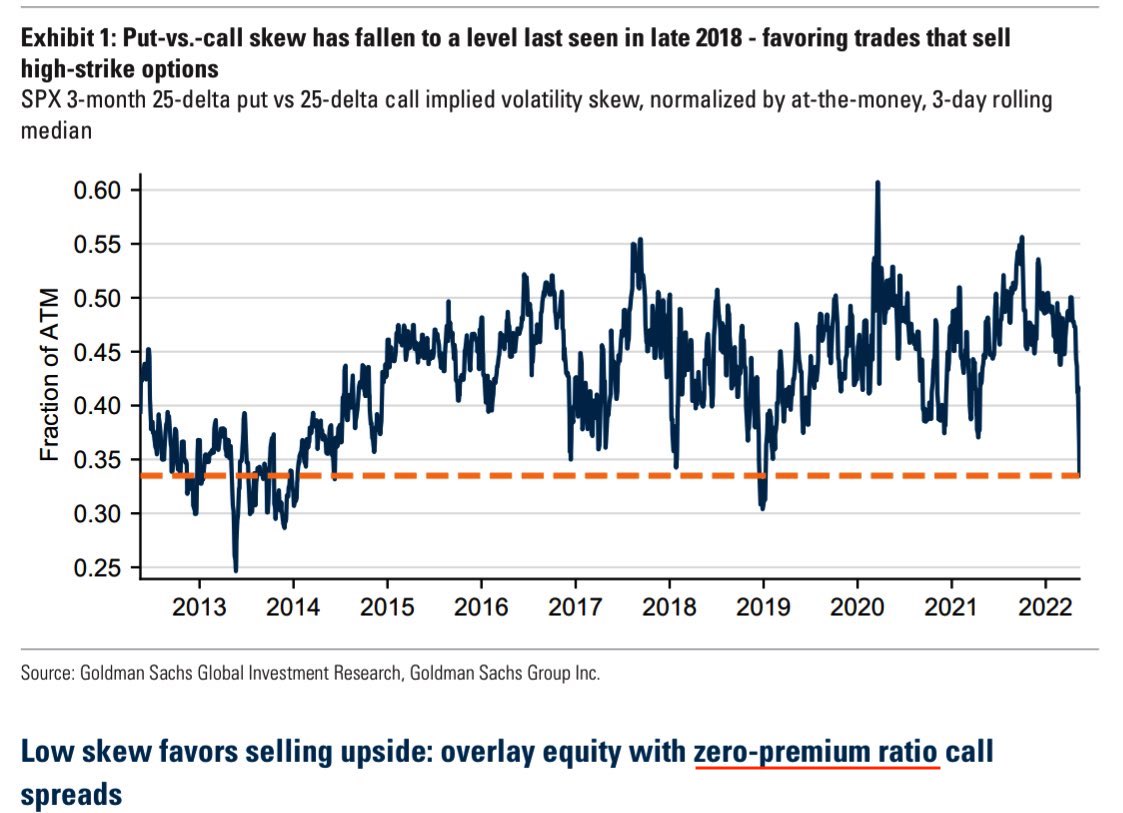
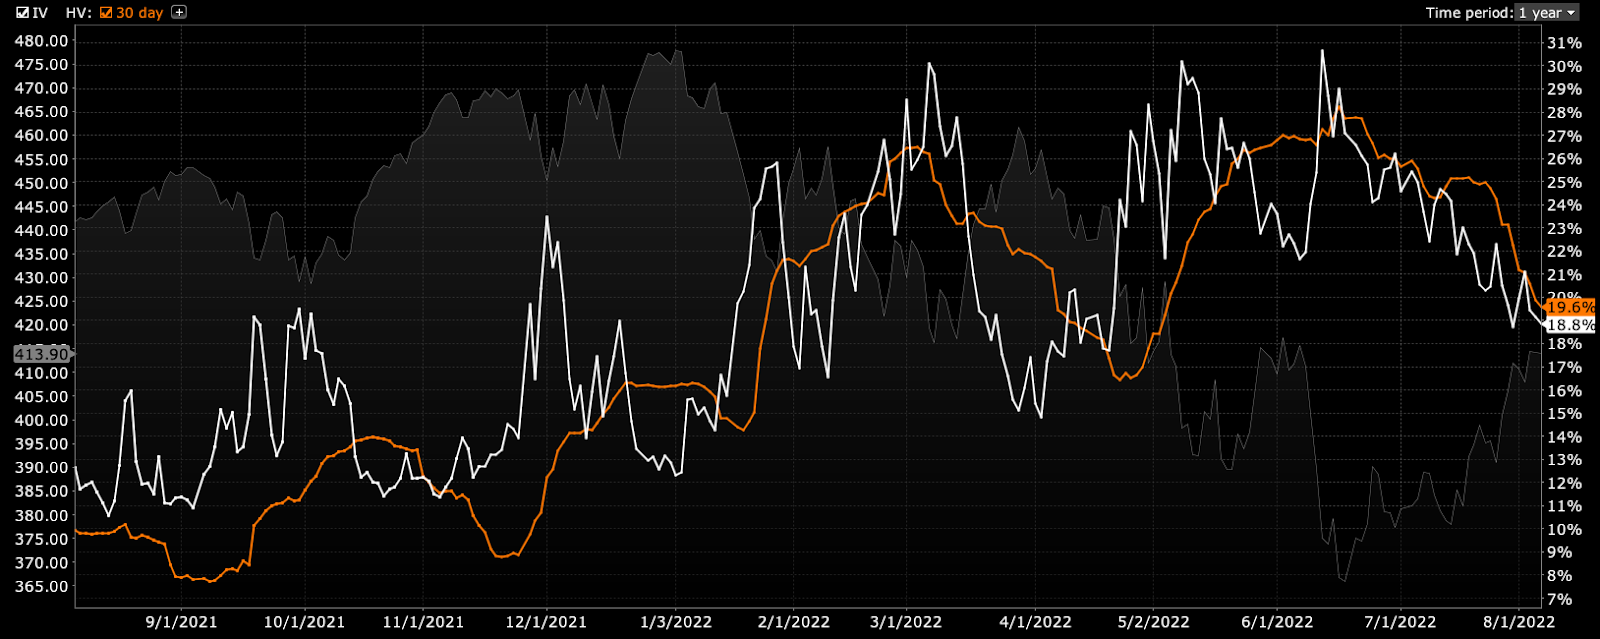
Further, given where realized (RVOL) and implied (IVOL) volatility are, as well as skew, it is beneficial to be a buyer of options structures (e.g., put back spread and/or call ratio spread).
Here is some context.
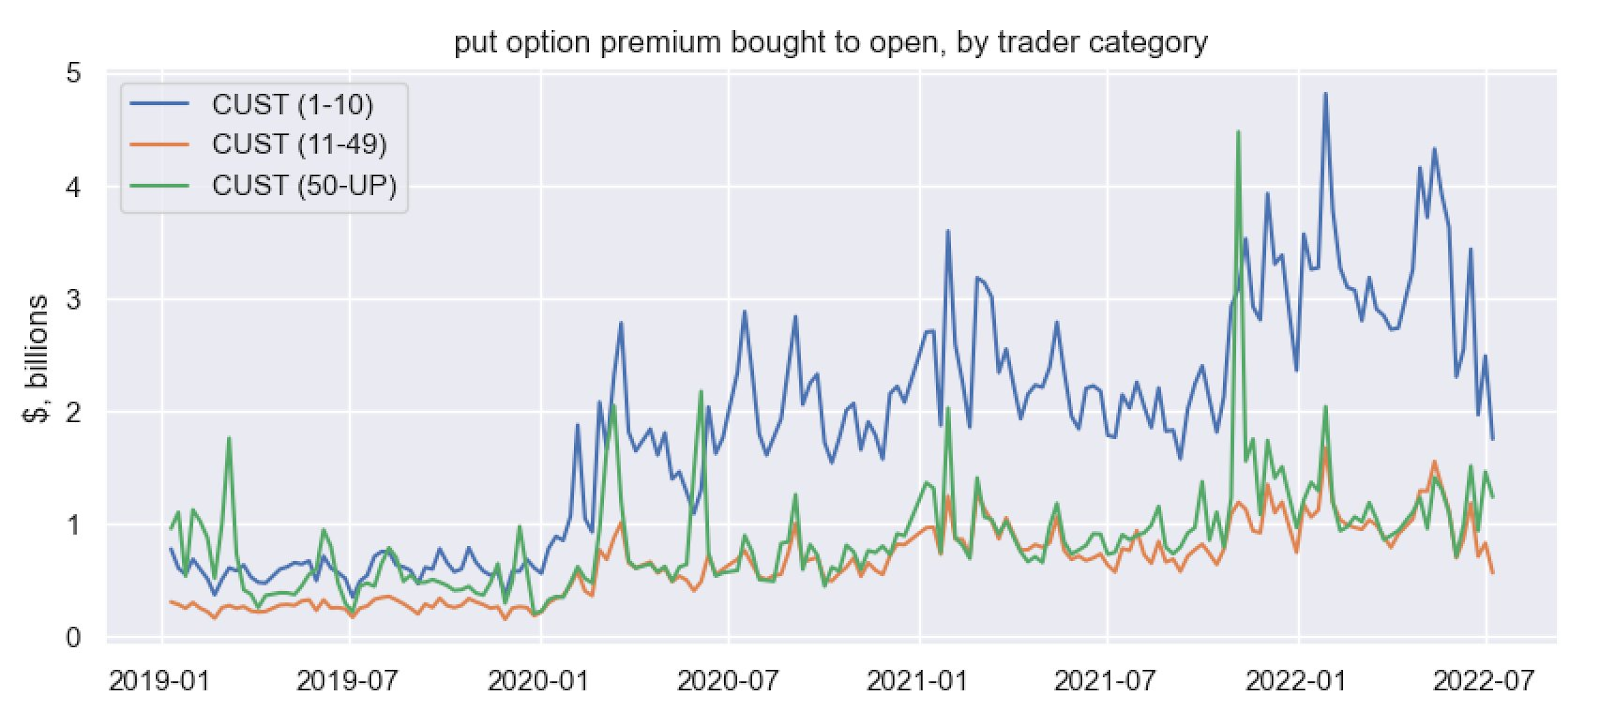
Per past letters, such as the Daily Brief for August 2, the monetization and counterparty hedging of existing customer volatility (i.e., options) hedges, as well as the sale of short-dated volatility, particularly in some single stocks where there was “rich” volatility into the fall, lent to lackluster performance in IVOL and index mean reversion.
These forces have only grown and are, presently, adding to the stickiness of the move higher.
Why?
Well – though naive – if we take participants as trading similar to the way they do historically (i.e., buying stocks and hedging by selling calls and buying puts), the counterparty is left with a bullish trade (i.e., short put, long call).
Depending on (A) where the market is in relation to this exposure, as well as (B) where this exposure is more concentrated, the call or put side may solicit increased hedging activities.
Today, with markets trading higher and participants becoming increasingly active on the call side, the counterparties have a trade that is (becoming increasingly) bullish; positive delta (i.e., exposure to direction) and gamma (i.e., rate of change of exposure to direction) are growing.
Further, knowing that participants are concentrating their bets on options close to current market prices, which are very short-dated (and with little time to expiration), the counterparty’s exposure is way more sensitive to changes in direction because options can go from having a lot of value to very little in a small window (of time and movement).
In other words, it is a fact that an option that is at the money can go from having a near 50% chance of expiring in the money to 0%. However, if the time to expiry is shorter, then the speed at which these options may go from a near 50% chance of expiring in the money to 0% rises.
That’s probably one of the simplest ways one could explain put it.
Therefore (with activity becoming more concentrated at options strikes near current price, all the while IVOL continues to fall), into weakness, counterparties lean toward buying (selling) dips (rips).
Adding:
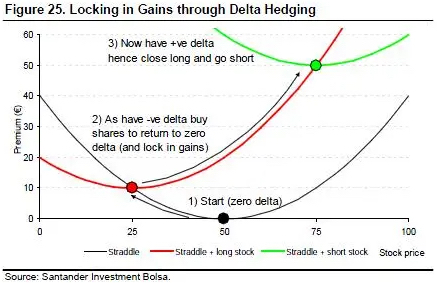
If you (like a counterparty) own a call option and want no exposure to the positive payoff when the market moves higher, you sell the underlying asset (e.g., stock, future).
If the market is sideways and slightly lower, while volatility is generally trending lower, as it is recently, and your option declines in value, then you must rebalance your hedge. So, you would buy (cover) some of your existing short stock and futures position to rebalance your deltas.
That’s supportive.
Read: SqueezeMetrics’ “The Implied Order Book” for more regarding the impact of options trade on underlying liquidity.
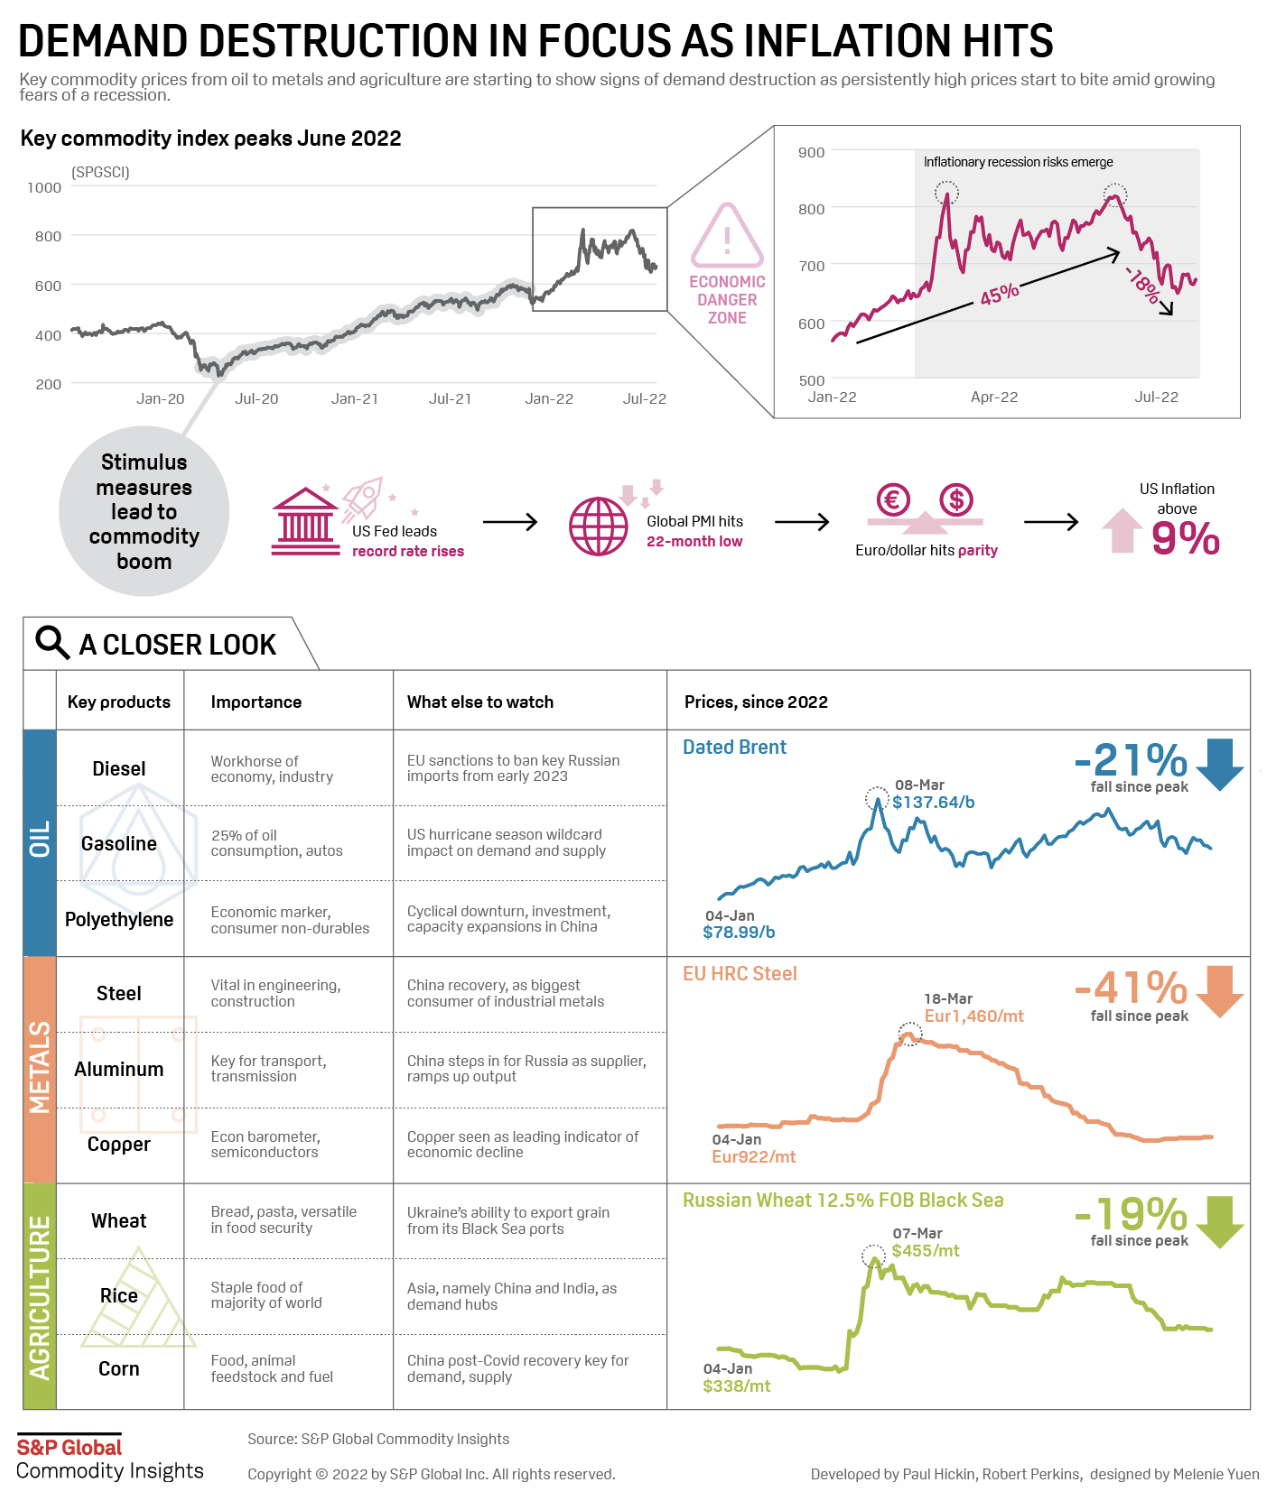
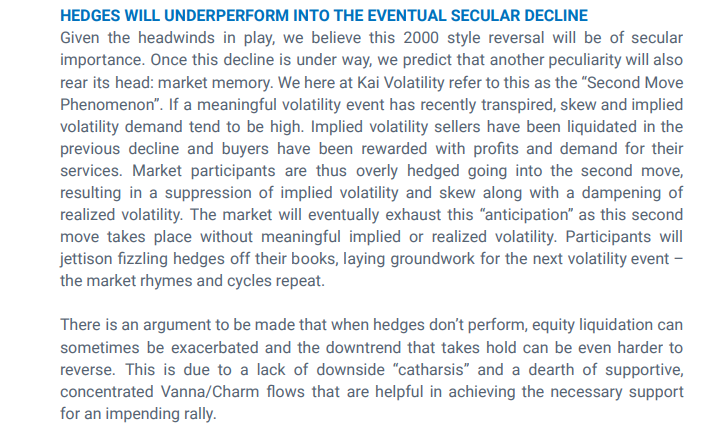
Moreover, the trends above may be coming to an end as entities are squeezed out of trades that aren’t working (i.e., participants continue to rotate out of poor-performing volatility and commodities).
Accordingly, Kai Volatility’s Cem Karsan explains that markets can, now, as that suppressive options activity fades, potentially, “really begin to respond to the core macro factors.”
Here’s why.
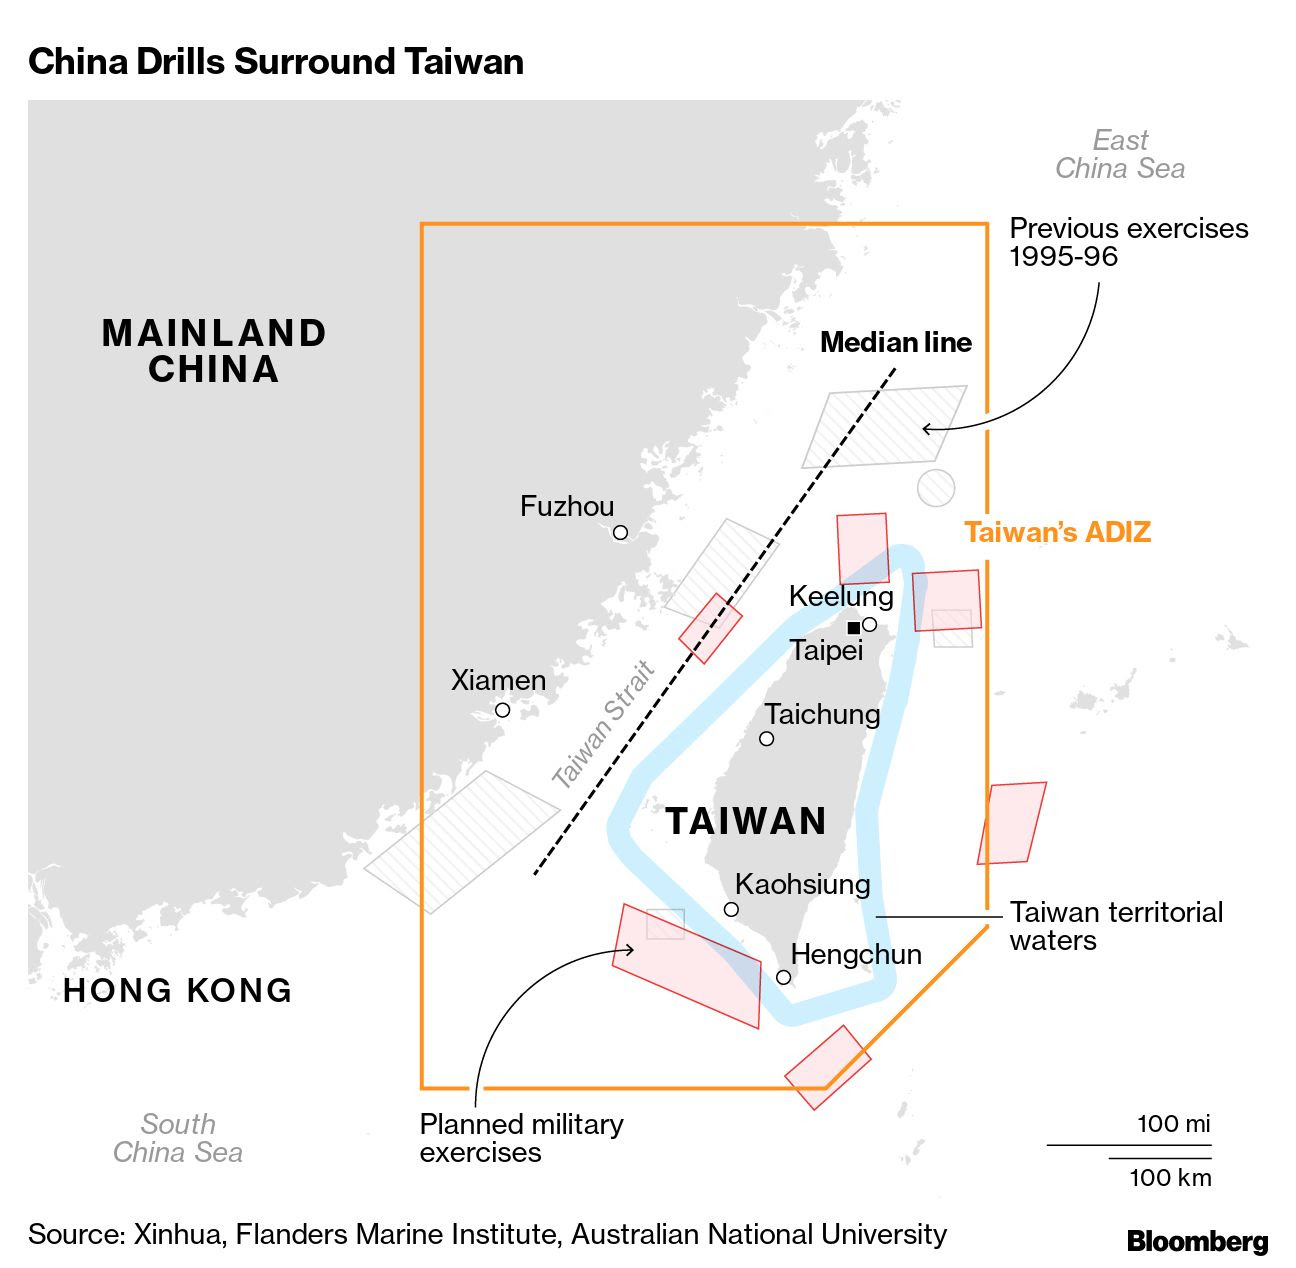
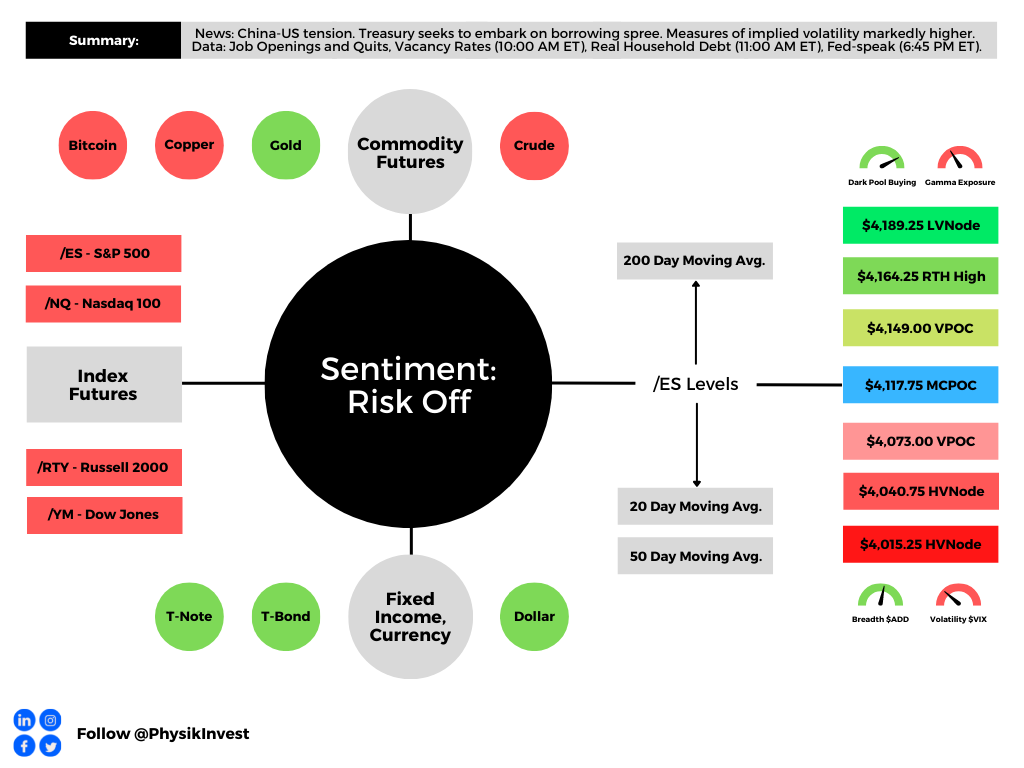
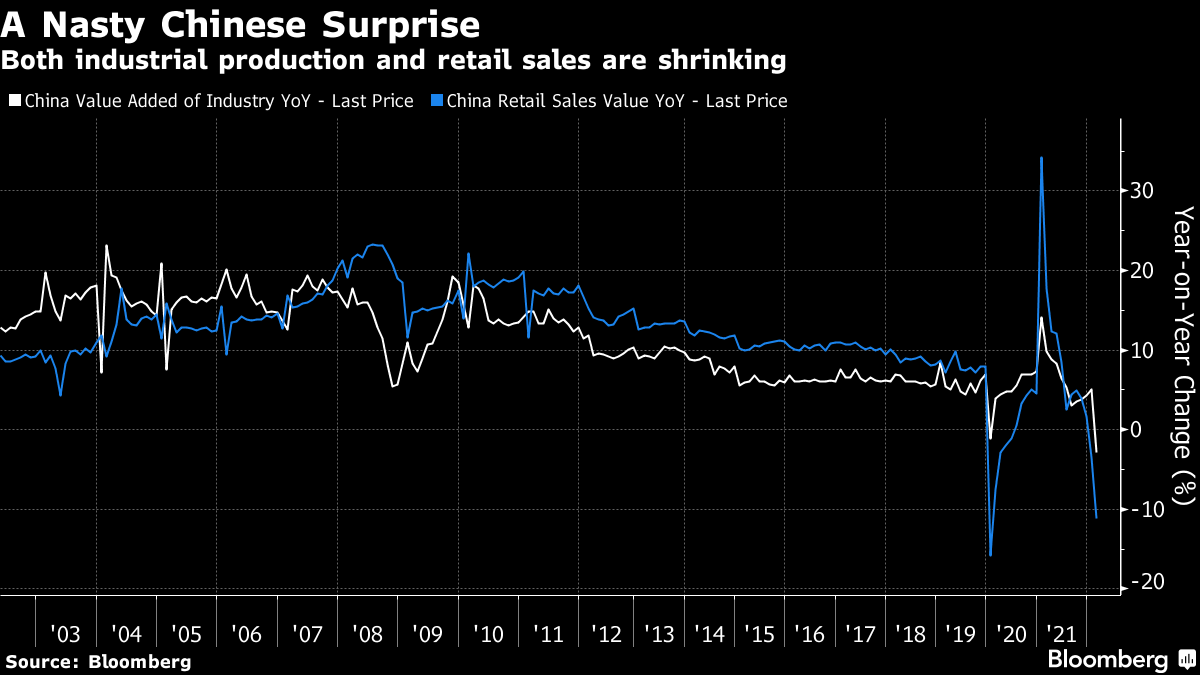
Should markets experience a shock (e.g., China and U.S. tensions escalate), the new demand for hedges may result in an “untethering” in IVOL, which was “one of the most supportive things into the decline,” Karsan explained.
That means that now is the best time to rotate into call options that are outperforming “their delta to the upside.”

You may ask: what’s bolstering some of the market’s strength, in the shorter term?
In spite of negative macro narratives, as IVOL continues to decline and options, in general, are less sought after per their poor performance, what’s providing an added boost is the “cohort of quantitative-based investment strategies [buying] equities when volatility is lower,” according to statements by the Wall Street Journal.
“This year, these so-called systematic strategies have exited the market to historically low levels, meaning they have plenty of buying power.”
Much more next week! Talk soon.
Technical
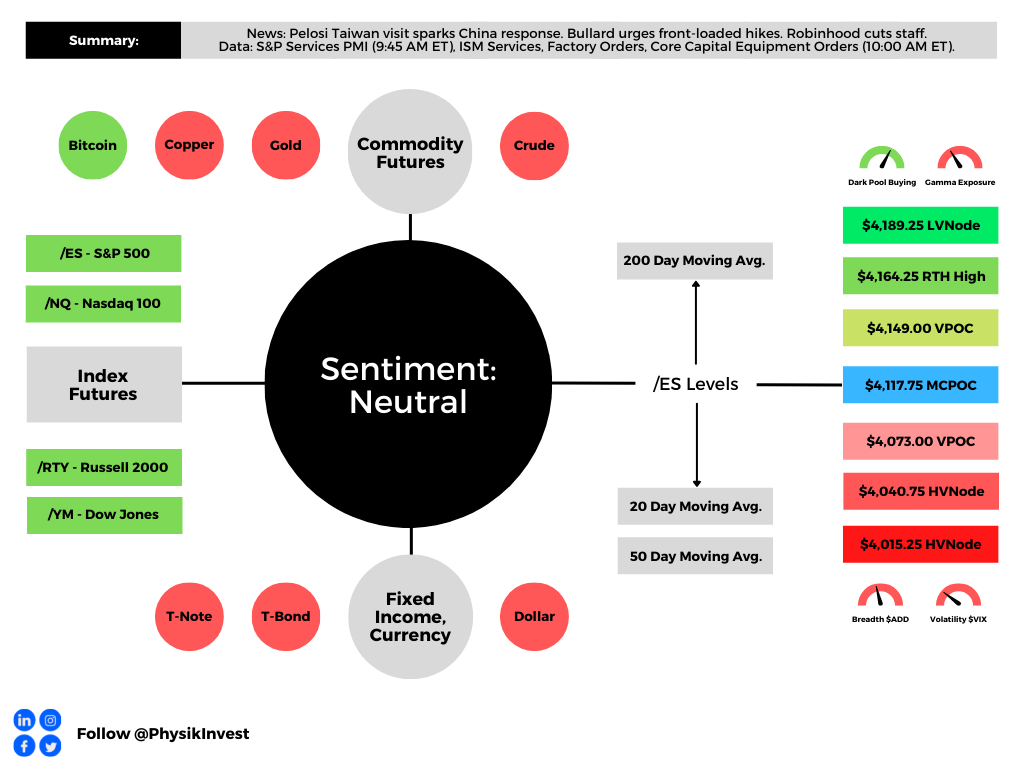
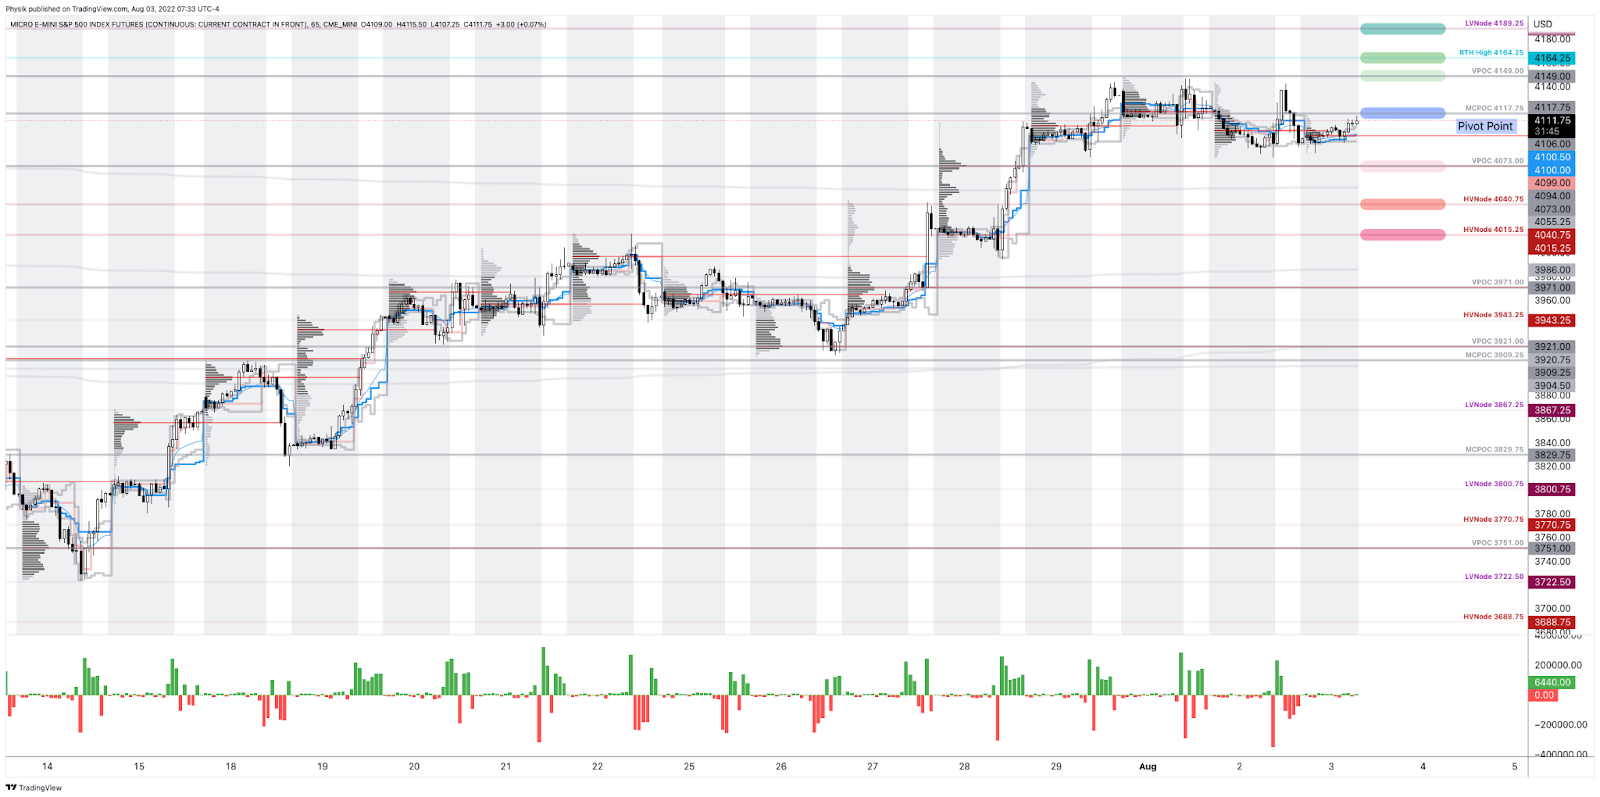
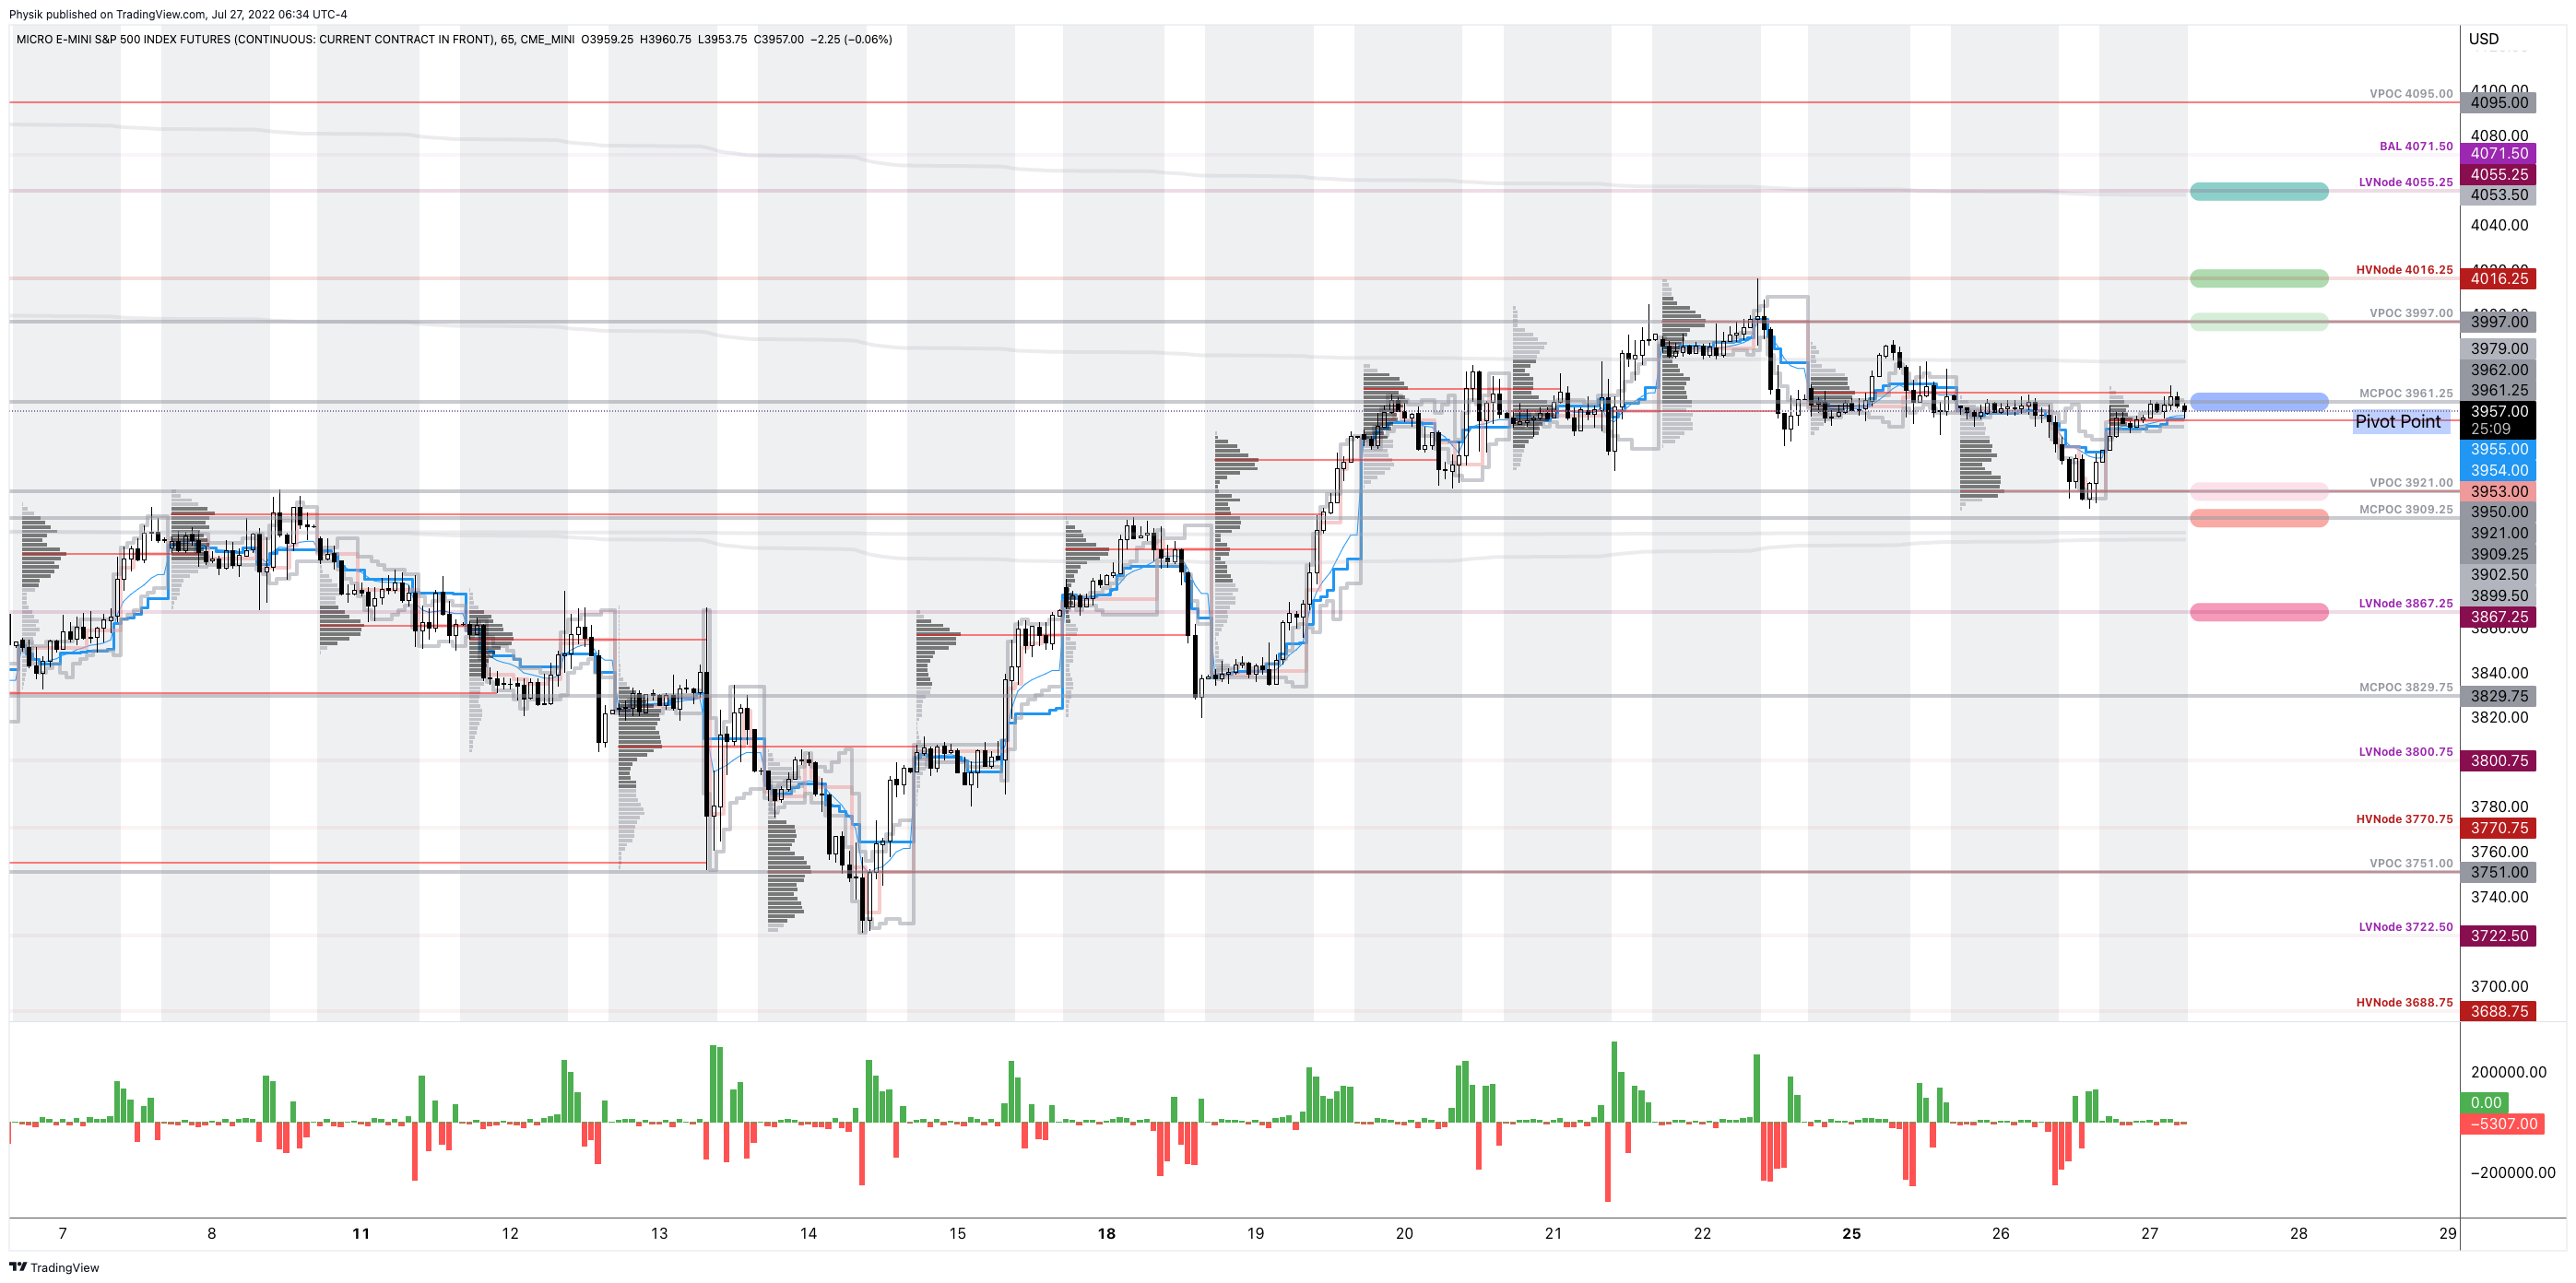
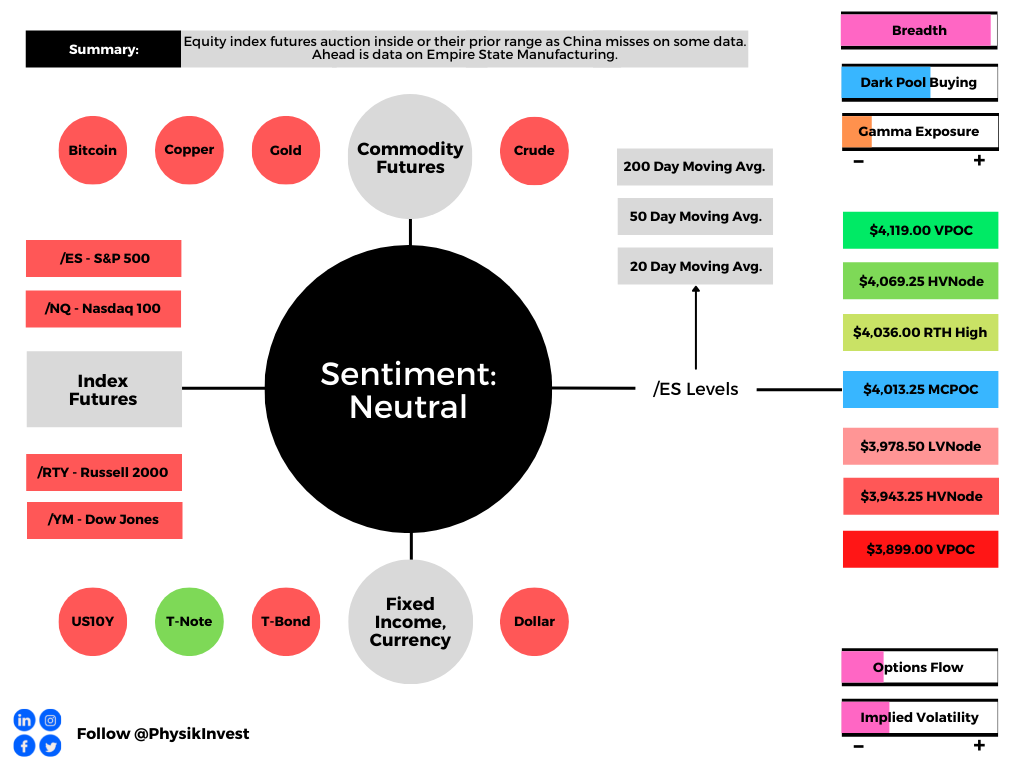
As of 7:00 AM ET, Thursday’s regular session (9:30 AM – 4:00 PM ET), in the S&P 500, is likely to open in the middle part of a balanced overnight inventory, just inside of prior-range and -value, suggesting a limited potential for immediate directional opportunity.
In the best case, the S&P 500 trades higher.
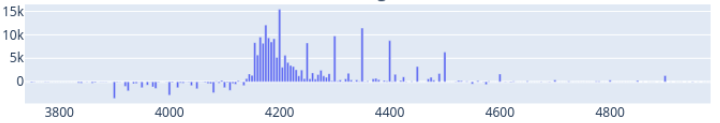
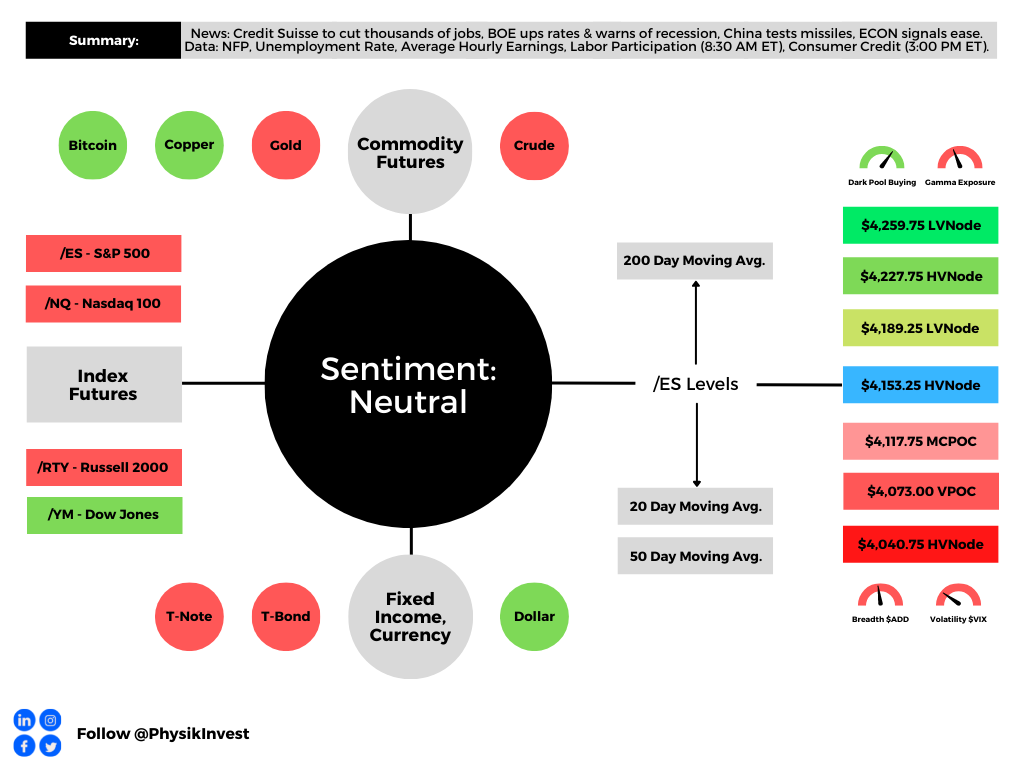
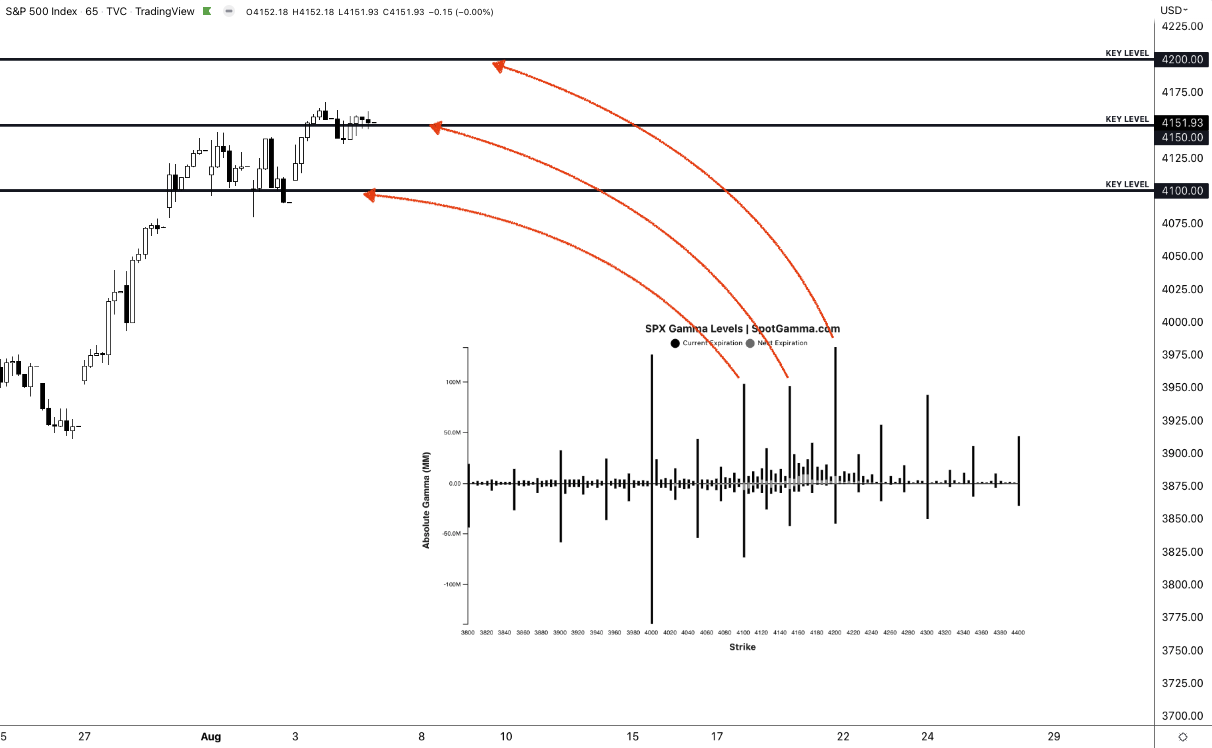
Any activity above the $4,153.25 HVNode puts into play the $4,189.25 LVNode. Initiative trade beyond the LVNode could reach as high as the $4,227.75 HVNode and $4,259.75 LVNode, or higher.
In the worst case, the S&P 500 trades lower.
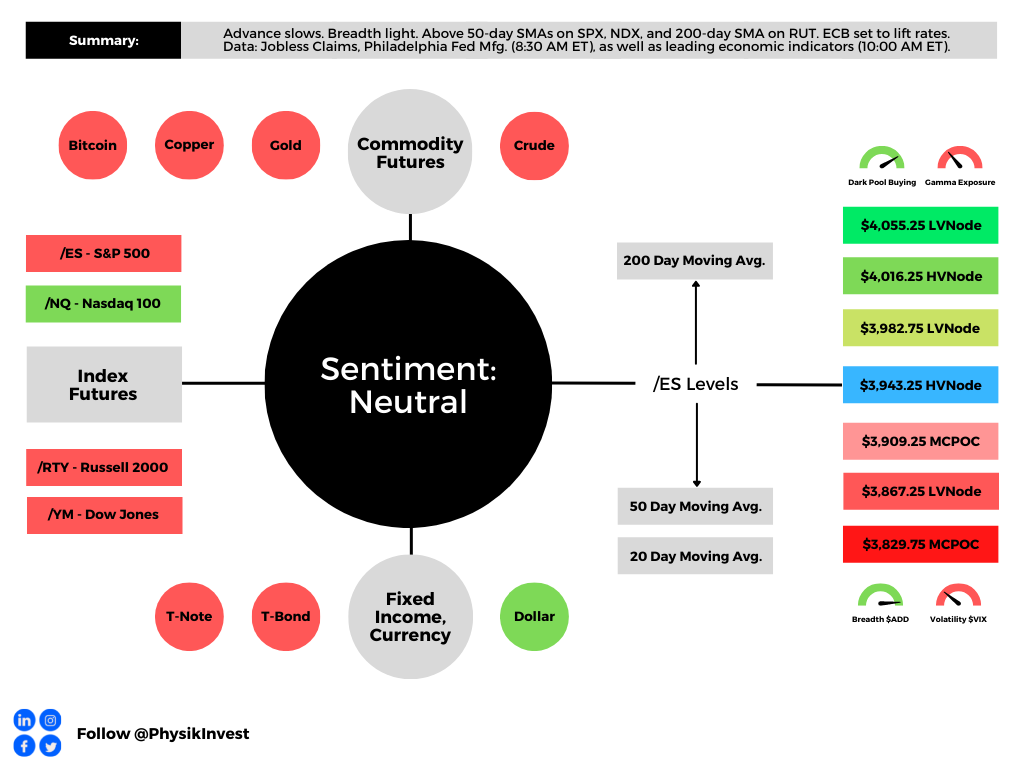
Any activity below the $4,153.25 HVNode puts into play the $4,117.75 MCPOC. Initiative trade beyond the MCPOC could reach as low as the $4,073.00 VPOC and $4,040.75 HVNode, or lower.
Click here to load today’s key levels into the web-based TradingView charting platform. Note that all levels are derived using the 65-minute timeframe. New links are produced, daily.

Considerations: Responsiveness near key-technical areas (that are discernable visually on a chart), suggests technically-driven traders with short time horizons are very active.
Such traders often lack the wherewithal to defend retests and, additionally, the type of trade may be indicative of the other time frame participants waiting for more information to initiate trades.
Definitions
Volume Areas: A structurally sound market will build on areas of high volume (HVNodes). Should the market trend for long periods of time, it will lack sound structure, identified as low volume areas (LVNodes). LVNodes denote directional conviction and ought to offer support on any test.
If participants were to auction and find acceptance into areas of prior low volume (LVNodes), then future discovery ought to be volatile and quick as participants look to HVNodes for favorable entry or exit.
POCs: POCs are valuable as they denote areas where two-sided trade was most prevalent in a prior day session. Participants will respond to future tests of value as they offer favorable entry and exit.
MCPOCs: POCs are valuable as they denote areas where two-sided trade was most prevalent over numerous day sessions. Participants will respond to future tests of value as they offer favorable entry and exit.
Volume-Weighted Average Prices (VWAPs): A metric highly regarded by chief investment officers, among other participants, for quality of trade. Additionally, liquidity algorithms are benchmarked and programmed to buy and sell around VWAPs.
About
After years of self-education, strategy development, mentorship, and trial-and-error, Renato Leonard Capelj began trading full-time and founded Physik Invest to detail his methods, research, and performance in the markets.
Capelj also develops insights around impactful options market dynamics at SpotGamma and is a Benzinga reporter.
Some of his works include conversations with ARK Invest’s Catherine Wood, investors Kevin O’Leary and John Chambers, FTX’s Sam Bankman-Fried, ex-Bridgewater Associate Andy Constan, Kai Volatility’s Cem Karsan, The Ambrus Group’s Kris Sidial, among many others.
Disclaimer
In no way should the materials herein be construed as advice. Derivatives carry a substantial risk of loss. All content is for informational purposes only.