Physik Invest’s Daily Brief is read free by thousands of subscribers. Join this community to learn about the fundamental and technical drivers of markets.
Fundamental
A tight monetary environment resulted in a hesitation to take risks. With inflation high, in the face of exogenous events (e.g., geopolitics disrupting deflationary influences) and beyond, assets were sold.
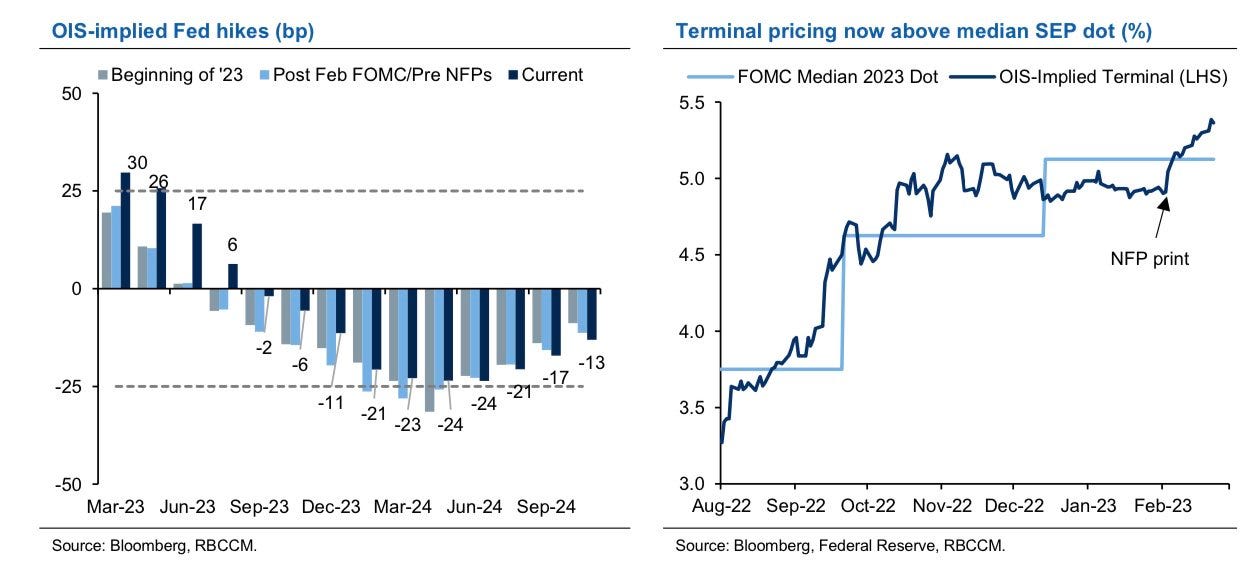
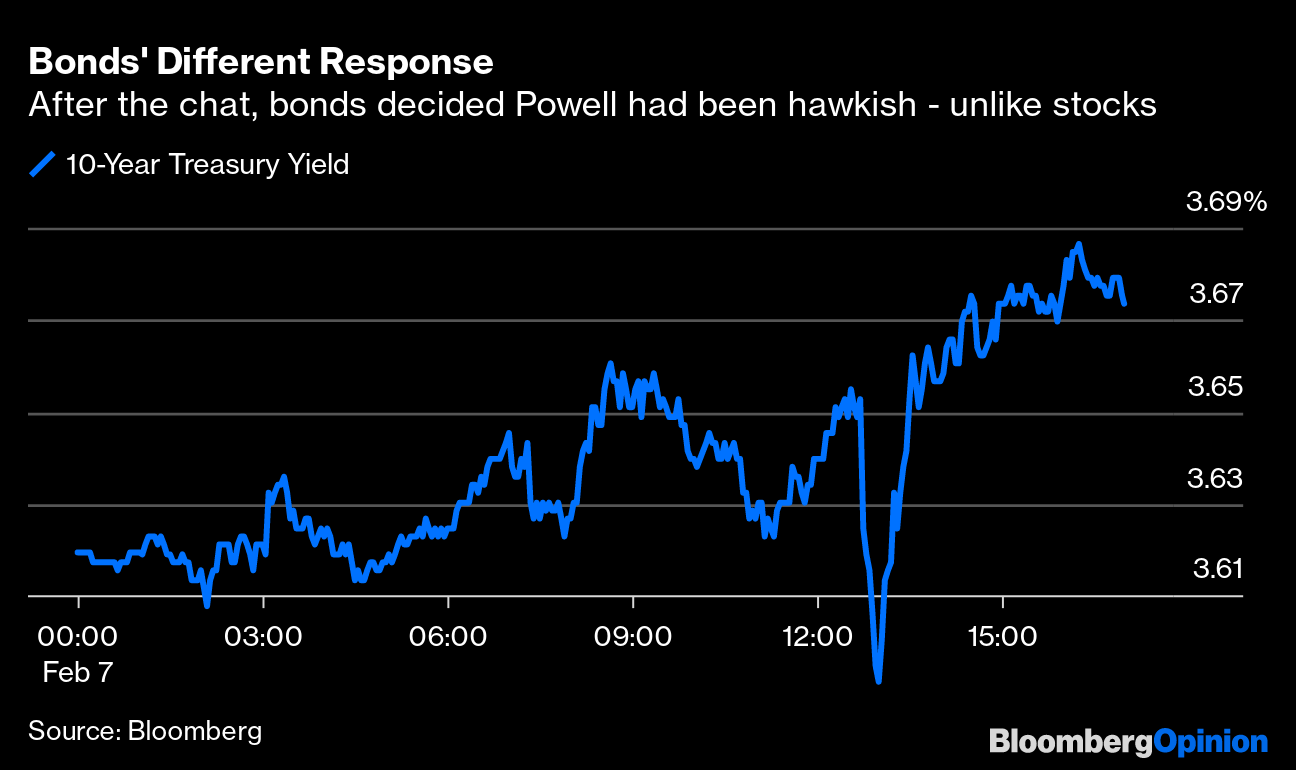
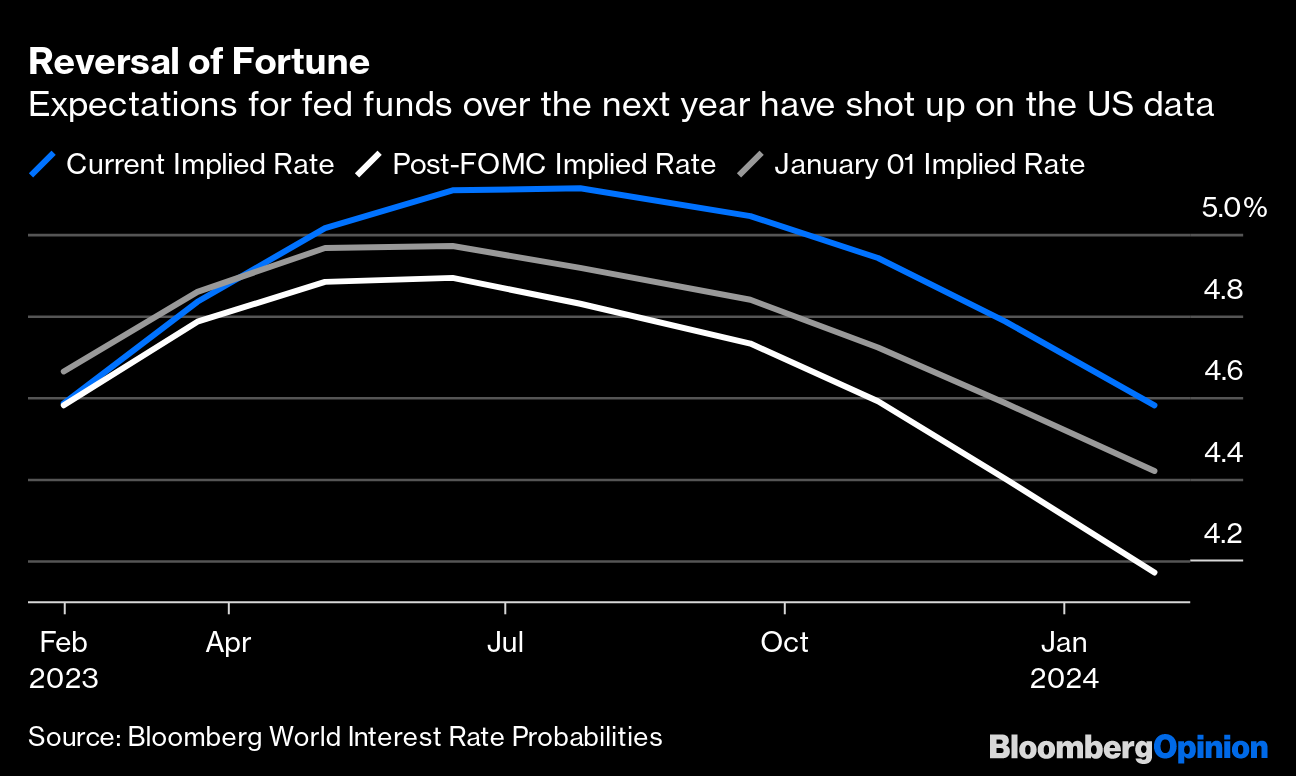
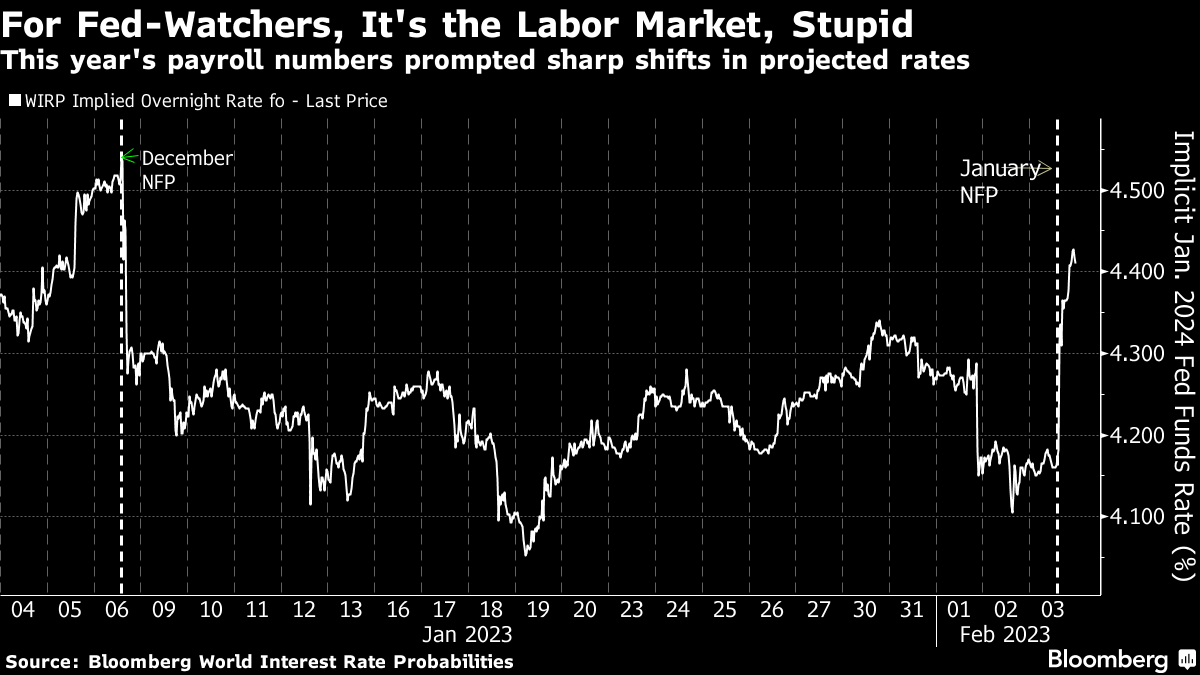
With inflation still hot and the economy on solid footing (i.e., “stronger growth for longer” per Unlimited’s Bruce McNevin), traders price even “tighter monetary policy and a harder eventual landing to ease inflation pressure.” This is not good for assets.
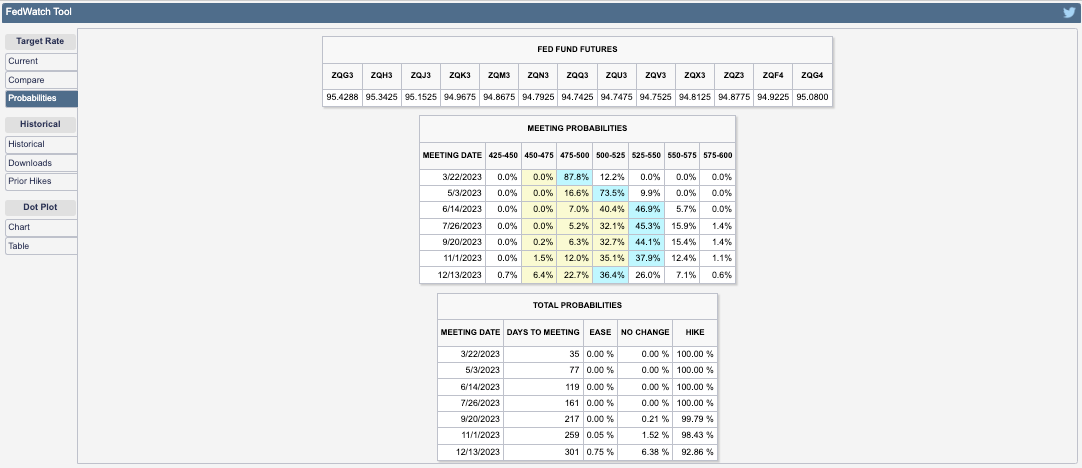
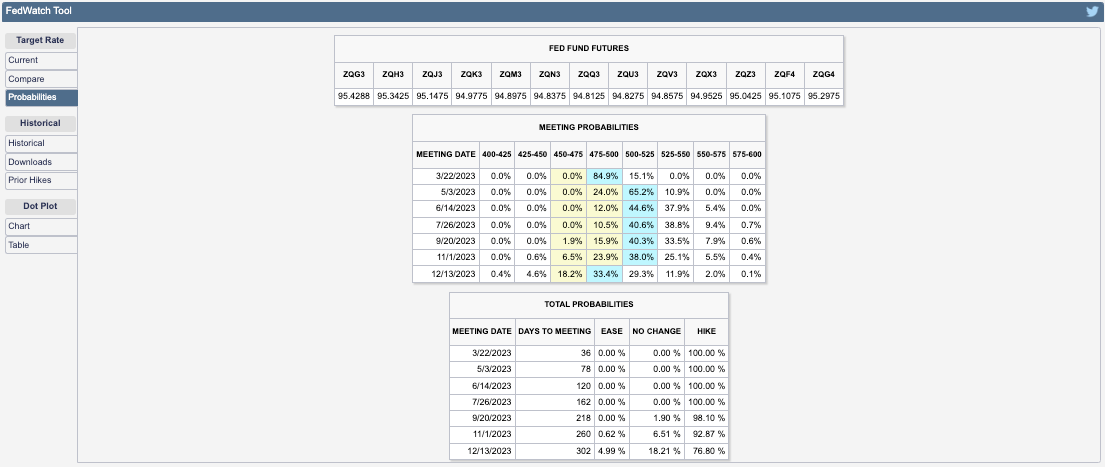
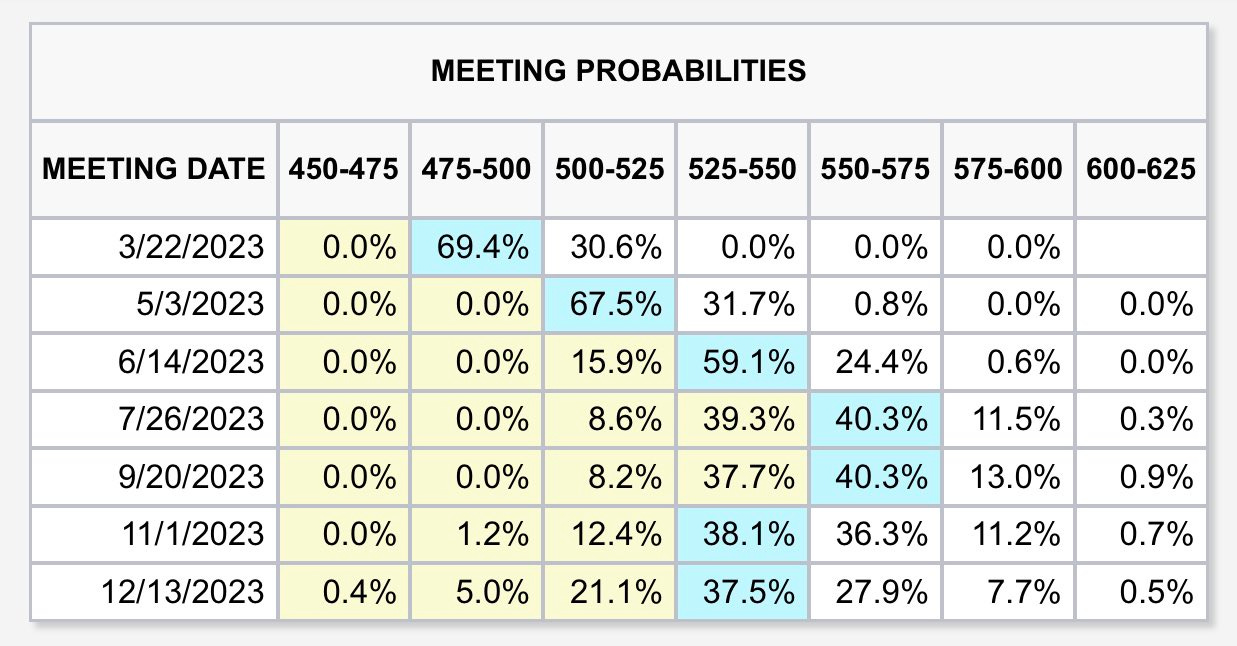
In fact, for a moment yesterday, traders put the terminal rate at 5.50-5.75%, up from 5.25-5.50% prior to the market opening.
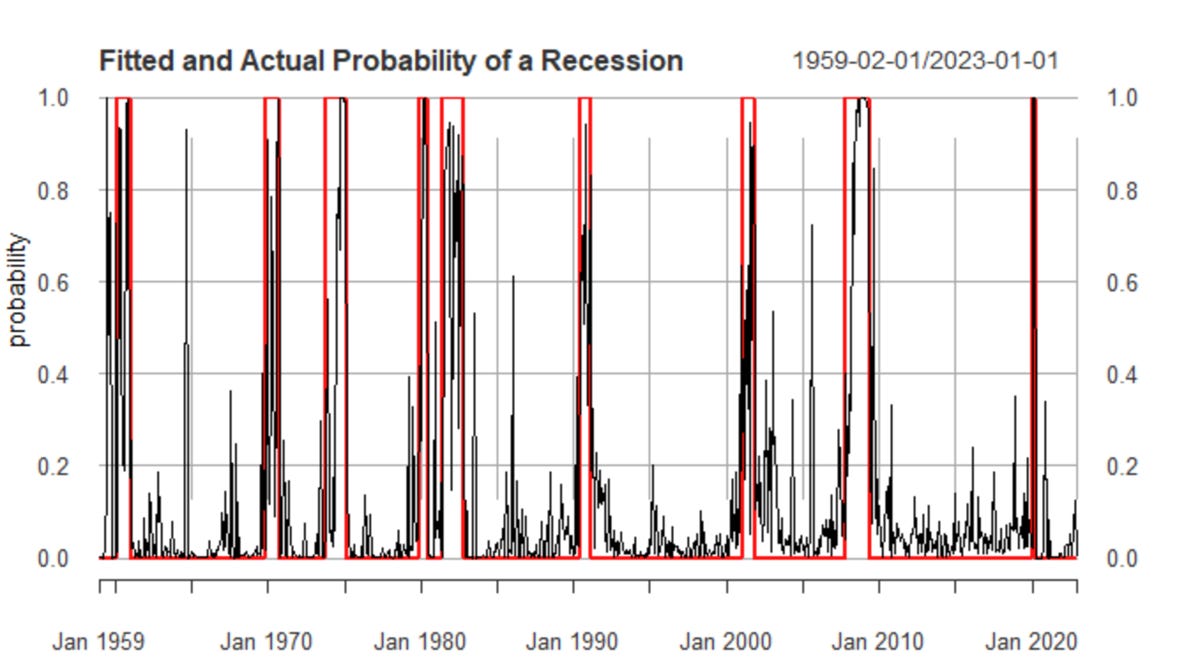
For the Federal Reserve (Fed) to hit its inflation target, likely in the range of 2-4% per Oaktree Capital Management’s Howard Marks said the real Fed Funds rate has to be positive. This effort puts the economy at risk of recession, said the Federal Reserve’s Neel Kashkari.
“Typically when the Fed raises rates to cool down inflation, it leads to a recession,” Kashkari explained, adding that “getting inflation down is job number one.”
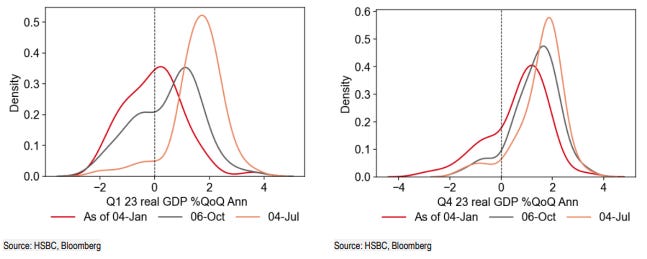
Per Unlimited’s McNevin, the probability the economy is in a recession is lower than it was at the end of last year. For probabilities to change, there would have to be a large increase in unemployment. For instance, if the unemployment rate rises by about 1%, recession odds go up by 29%. If non-farm payroll employment falls by about 2% or 3 million jobs, recession odds jump by 74%.
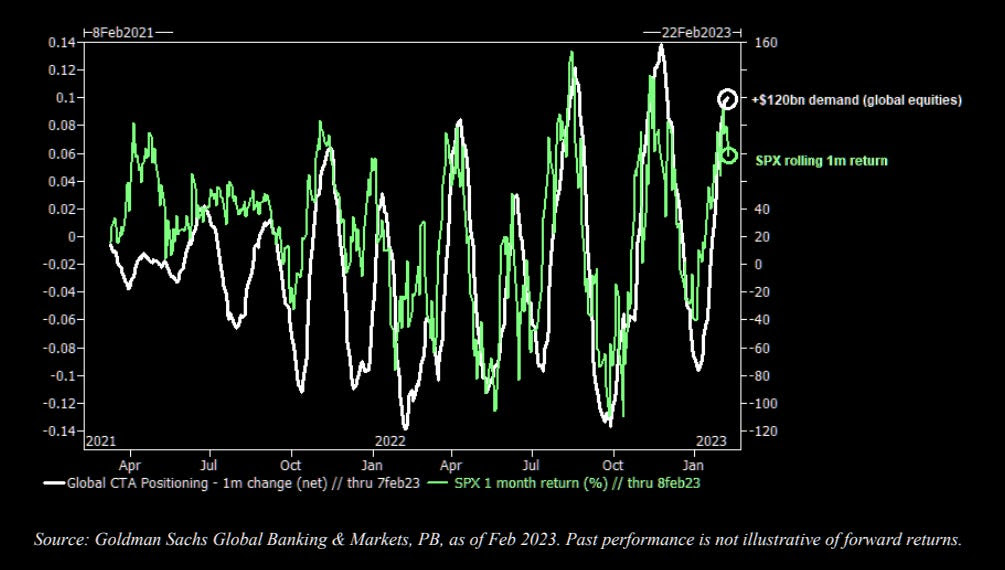
Positioning
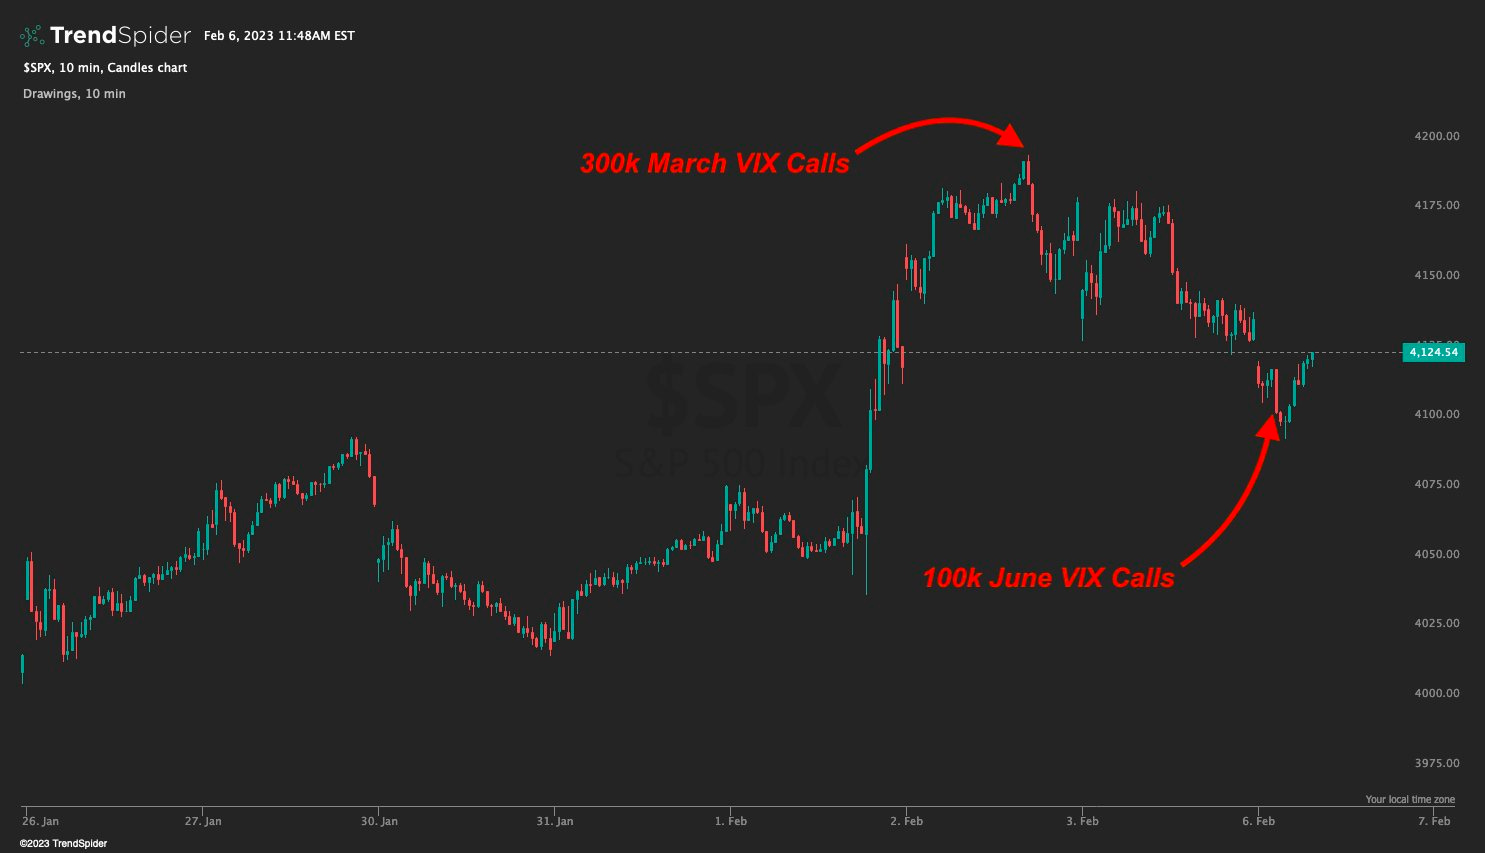
Per last month’s remarks by Kai Volatility’s Cem Karsan, quoted in Physik Invest’s Daily Brief for February 17, 2023, if the market was to not breakdown sharply after February monthly options expiration (OpEx), as we see today, then options decay could build a platform for a FOMO-driven call buying rally that ends in a blow-off.
Consequently, trades this letter put forth last month (e.g., call verticals sold to finance put verticals expiring months from now) would suffer greatly.
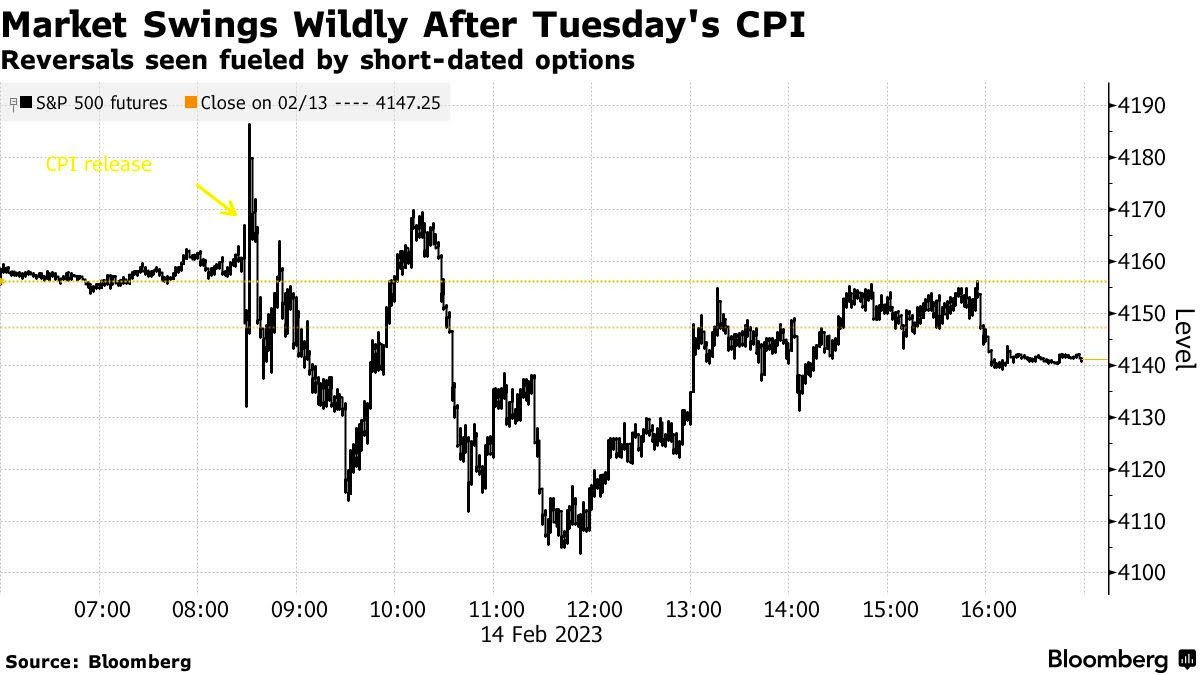
“We’ve had an intraday range of 33.5 [points] thus far. That’s not vol[atility] expansion, which is what I’d want to see if I was short,” volatility trader Darrin John put well. “If the market doesn’t do what you think it should, in a reasonable amount of time, then it’s best to [exit].”
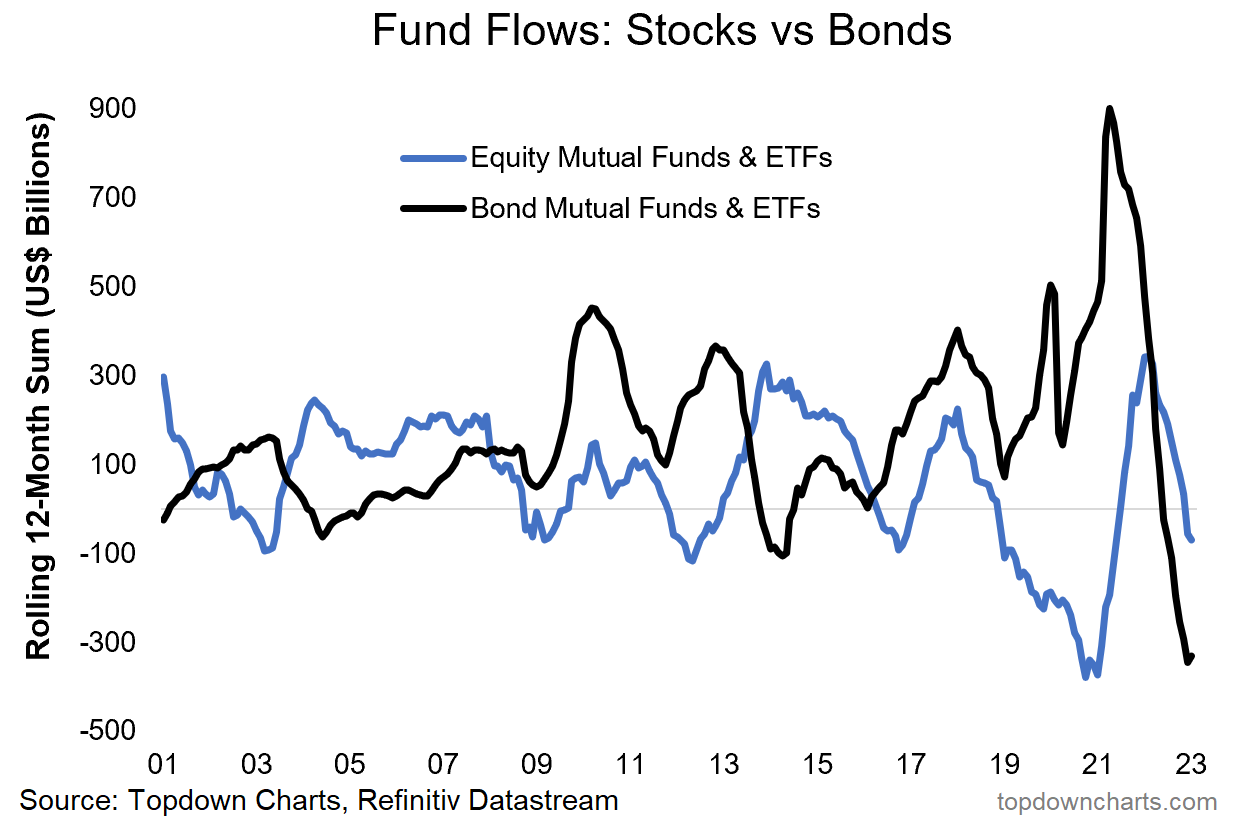
At the same time, with portfolio constructions like 60/40 not as attractive in this macroeconomic environment (i.e., asset headwind from monetary tightening, as well as slowing growth and inflation headwind to bonds and commodities), traders can look to Physik Invest’s Daily Brief for February 28, 2023, for ideas on how to navigate. In that letter, we talked about how traders can participate in the upside by about the same amount they would with a traditional construction (e.g., 60/40) while eliminating their downside risk exposure.
For instance, one can buy enough bonds/box spreads so that, at their maturity, the principal is returned. The cash remaining can be invested in leverage potential.
Ending with a supporting quote from Oaktree’s Howard Marks: “Investors can now potentially get solid returns from credit instruments, meaning they no longer have to rely as heavily on riskier investments to achieve their overall return targets.”
Technical
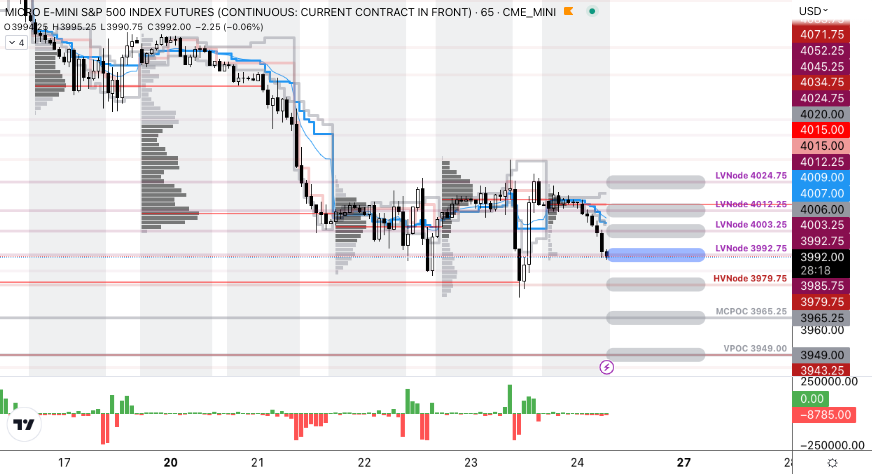
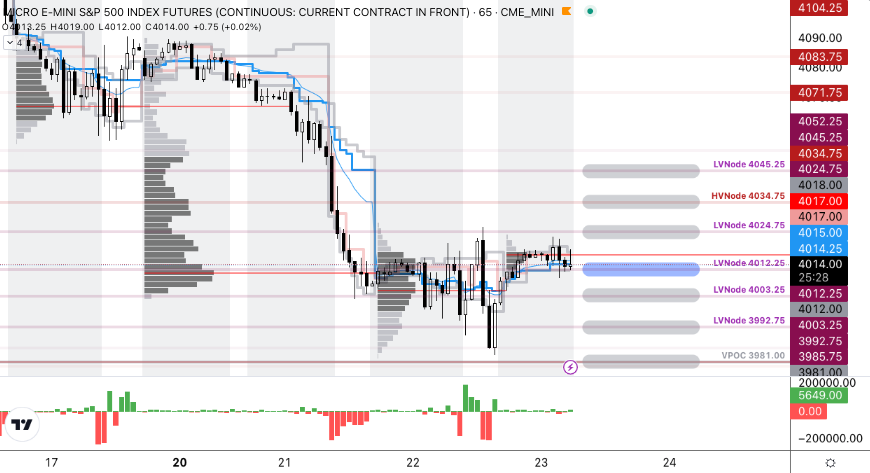
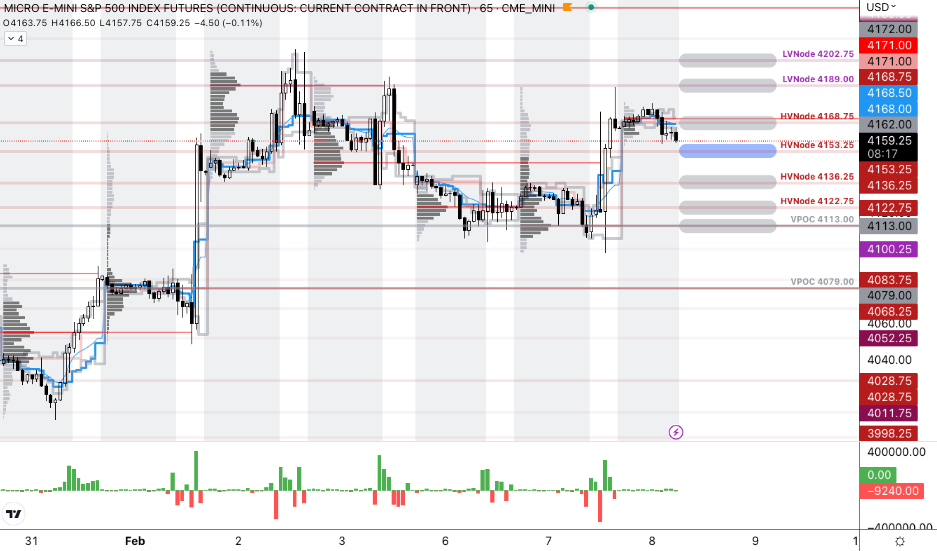
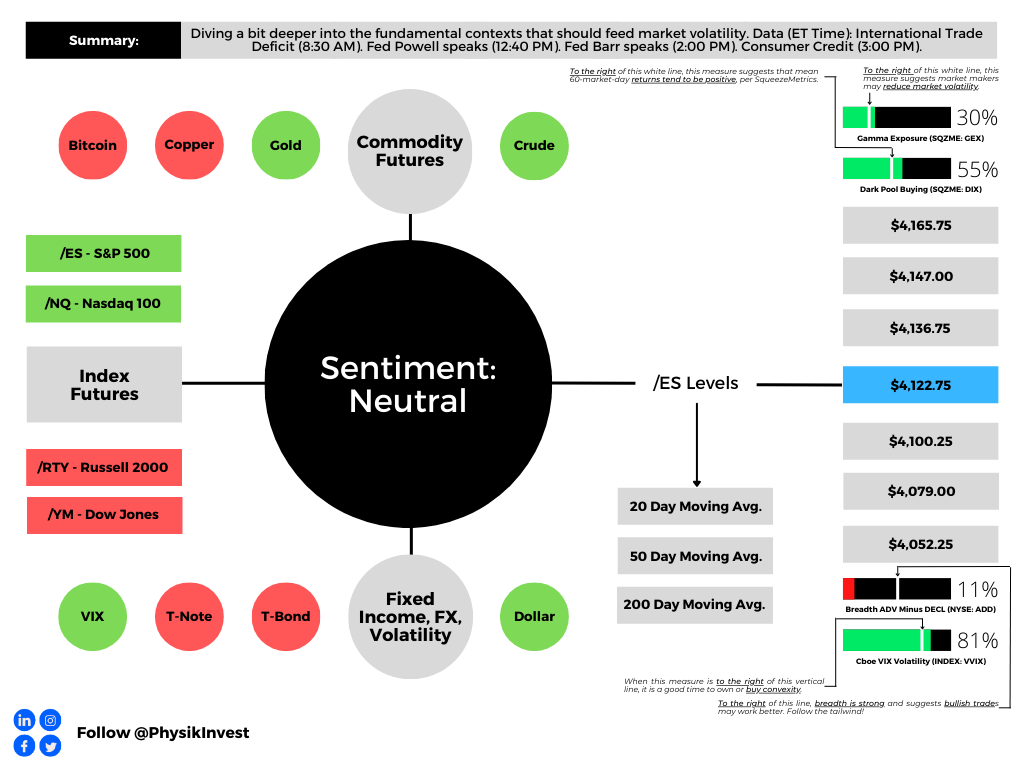
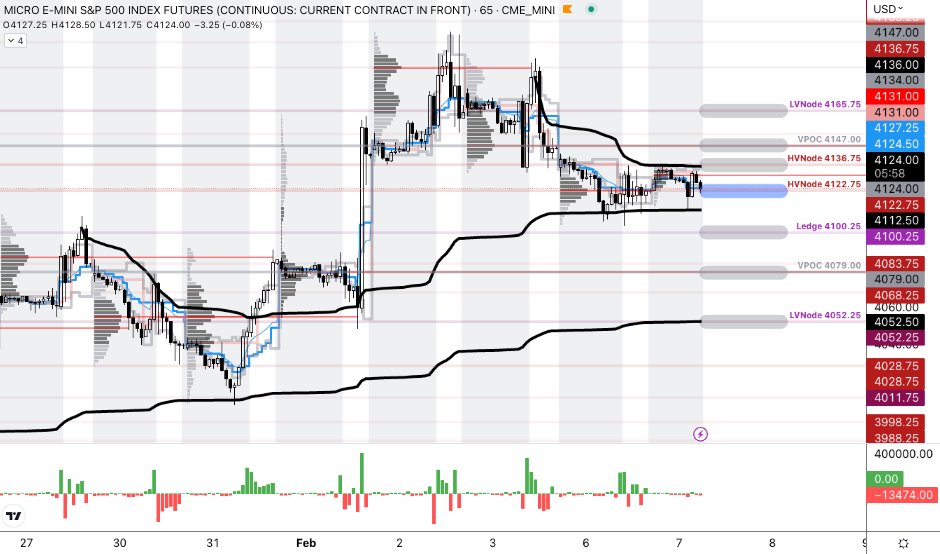
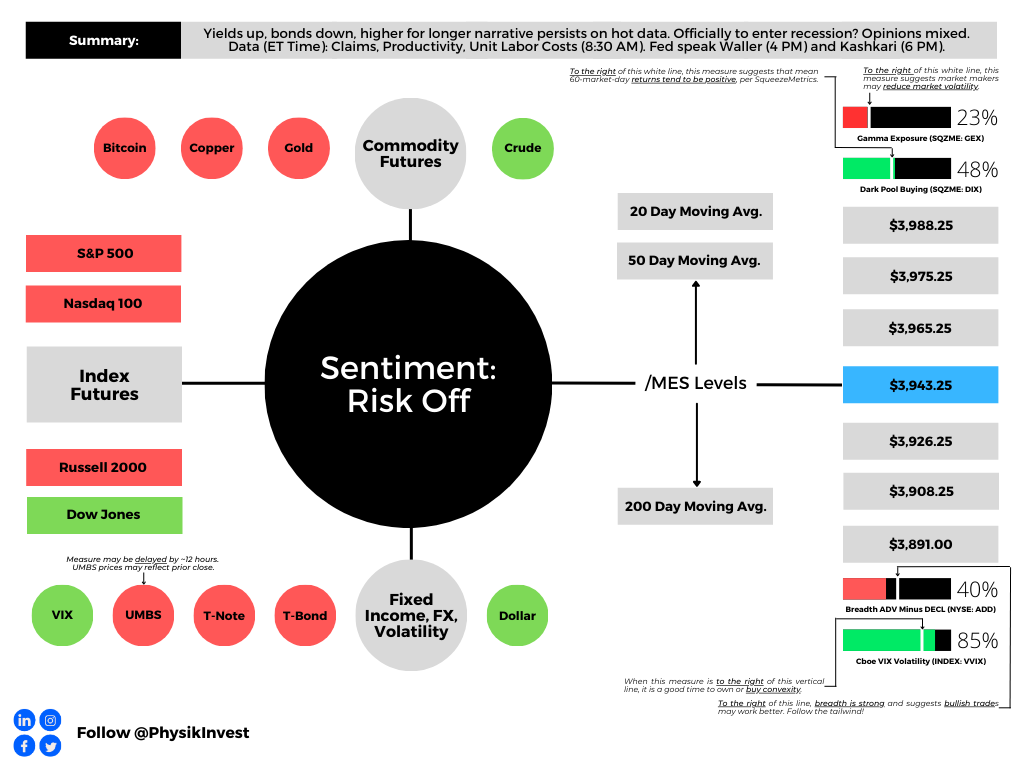
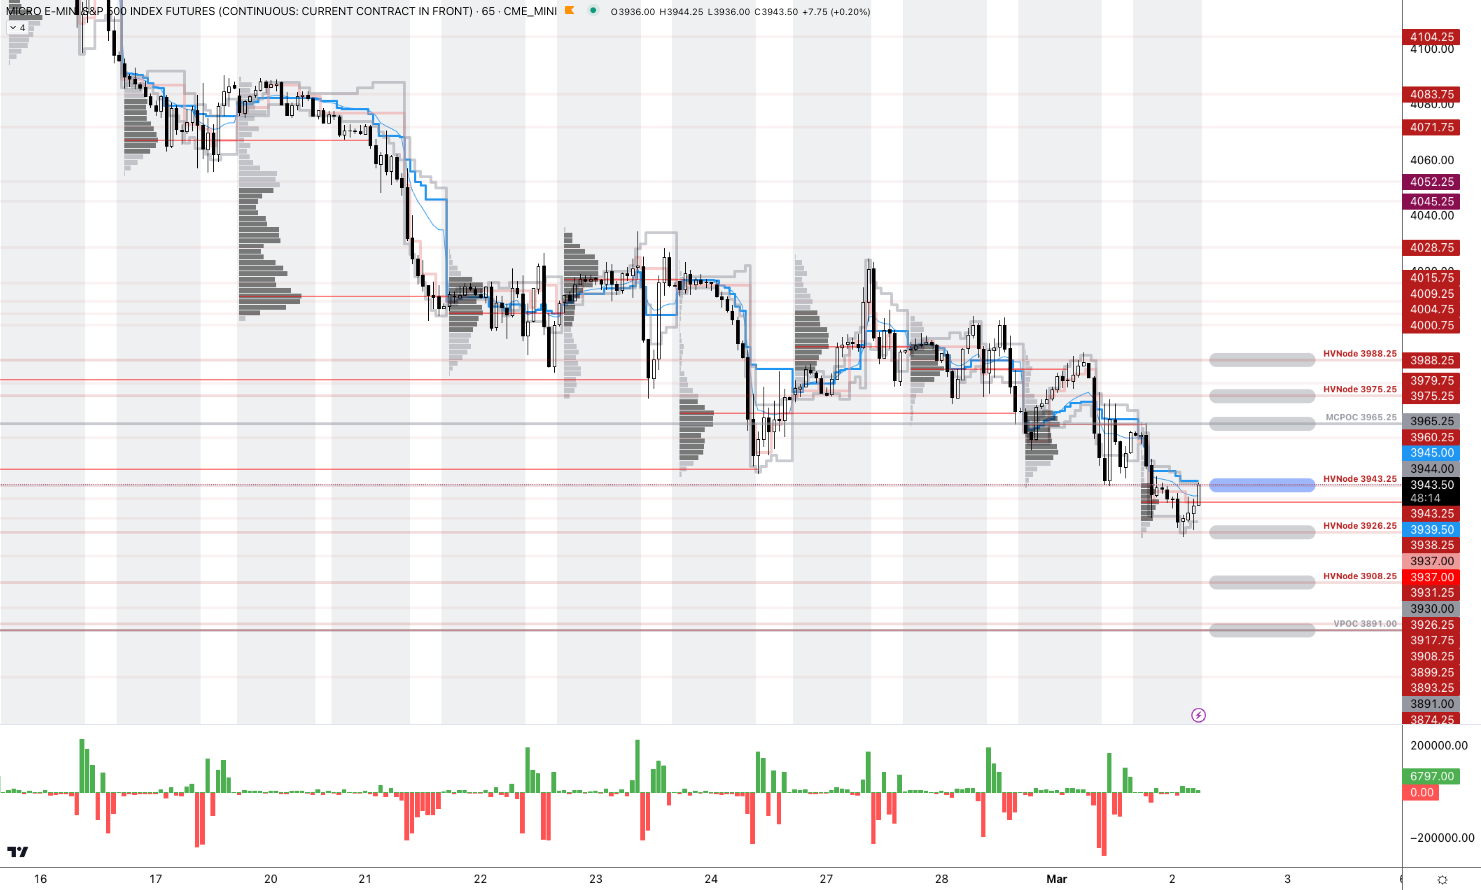
As of 6:00 AM ET, Thursday’s regular session (9:30 AM – 4:00 PM ET), in the S&P 500, is likely to open in the middle part of a negatively skewed overnight inventory, outside of the prior day’s range, suggesting a potential for immediate directional opportunity.
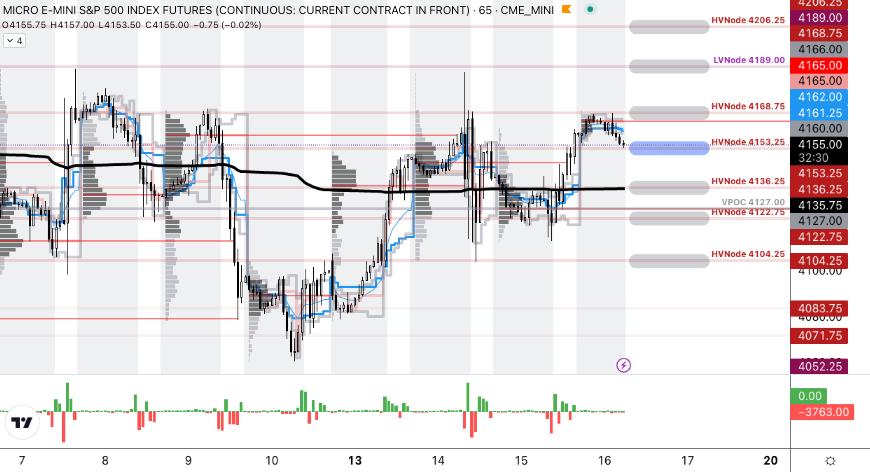
The S&P 500 pivot for today is $3,943.25.
Key levels to the upside include $3,965.25, $3,975.25, and $3,988.25.
Key levels to the downside include $3,926.25, $3,908.25, and $3,891.00.
Disclaimer: Click here to load the updated key levels via the web-based TradingView platform. New links are produced daily. Quoted levels likely hold barring an exogenous development.
Definitions
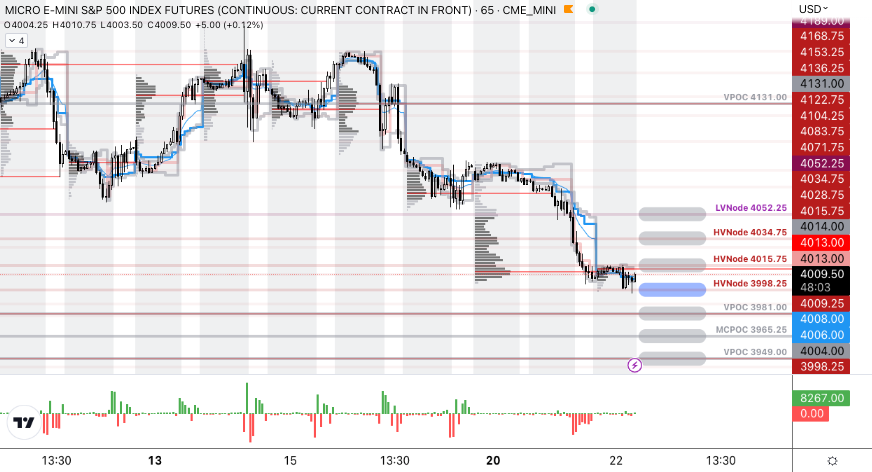
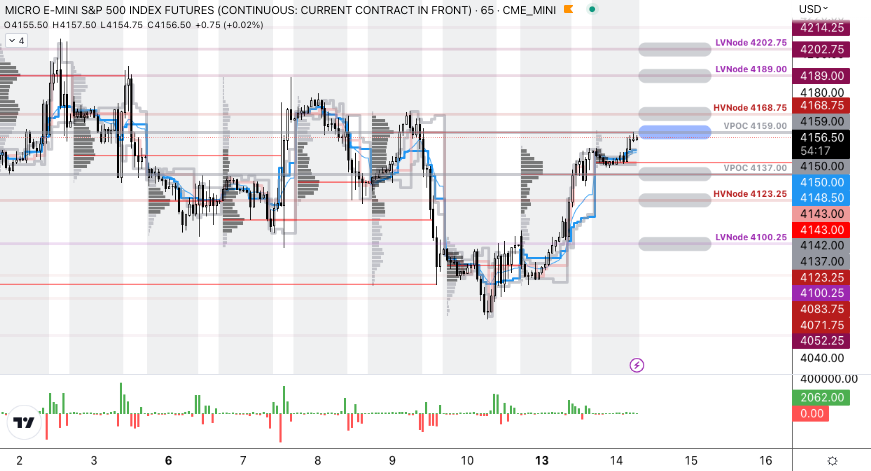
Volume Areas: Markets will build on areas of high-volume (HVNodes). Should the market trend for a period of time, this will be identified by a low-volume area (LVNodes). The LVNodes denote directional conviction and ought to offer support on any test.
If participants auction and find acceptance in an area of a prior LVNode, then future discovery ought to be volatile and quick as participants look to the nearest HVNodes for more favorable entry or exit.
MCPOCs: Denote areas where two-sided trade was most prevalent over numerous sessions. Participants will respond to future tests of value as they offer favorable entry and exit.
POCs: Areas where two-sided trade was most prevalent in a prior day session. Participants will respond to future tests of value as they offer favorable entry and exit.
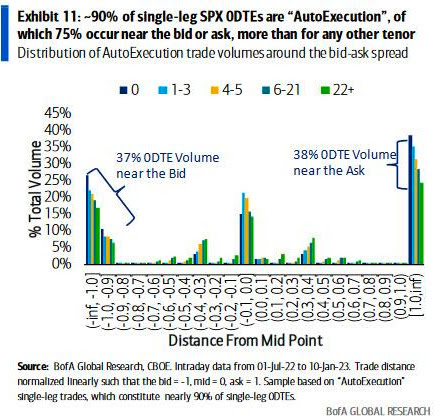
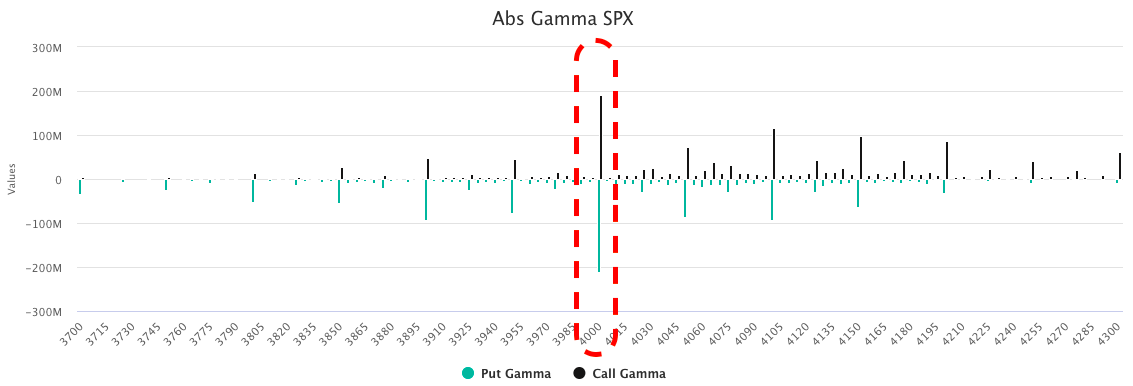
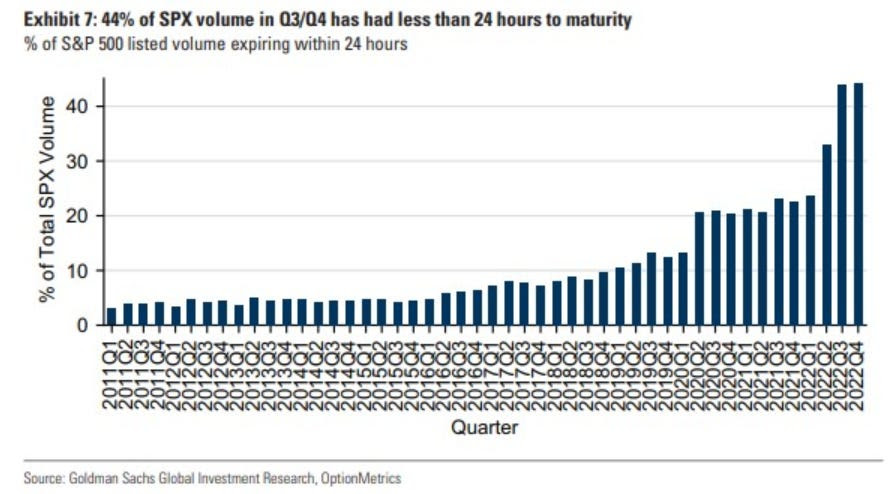
Options Expiration (OPEX): Reduction in dealer Gamma exposure. There is usually an increase in volatility after the removal of large options positions and associated hedging.
About
The author, Renato Leonard Capelj, spends the bulk of his time at Physik Invest, an entity through which he invests and publishes free daily analyses to thousands of subscribers. The analyses offer him and his subscribers a way to stay on the right side of the market.
Separately, Capelj is an accredited journalist with past works including interviews with investor Kevin O’Leary, ARK Invest’s Catherine Wood, FTX’s Sam Bankman-Fried, North Dakota Governor Doug Burgum, Lithuania’s Minister of Economy and Innovation Aušrinė Armonaitė, former Cisco chairman and CEO John Chambers, and persons at the Clinton Global Initiative.
Connect
Direct queries to renato@physikinvest.com. Find Physik Invest on Twitter, LinkedIn, Facebook, and Instagram. Find Capelj on Twitter, LinkedIn, and Instagram. Only follow the verified profiles.
Calendar
You may view this letter’s content calendar at this link.
Disclaimer
Do not construe this newsletter as advice. All content is for informational purposes. Capelj and Physik Invest manage their own capital and will not solicit others for it.