Categories
Commentary

Daily Brief For April 15, 2021

Market Commentary

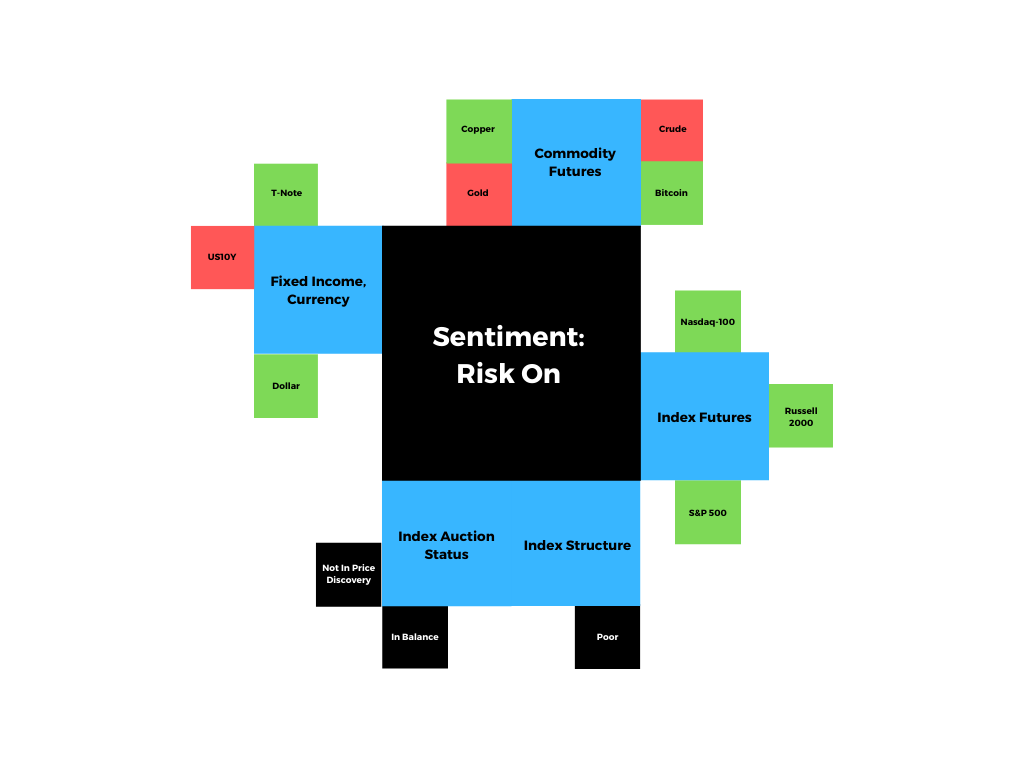
Index futures attempting to initiate out of balance and explore higher prices.

  • Fed to taper before rate increase.
  • Watch claims and other releases.
  • The market rejected lower prices.

What Happened: U.S. stock index futures rose ahead of releases on key economic data and earnings reports.

What To Expect: Thursday’s regular session (9:30 AM – 4:00 PM EST) may open inside of prior-range and -value, suggesting a limited potential for immediate directional opportunity. 

Adding, during the prior day’s regular trade, the worst-case outcome occurred, evidenced by an intraday liquidation that found responsive buyers near the prior day’s pull-back low at $4,120.00. 

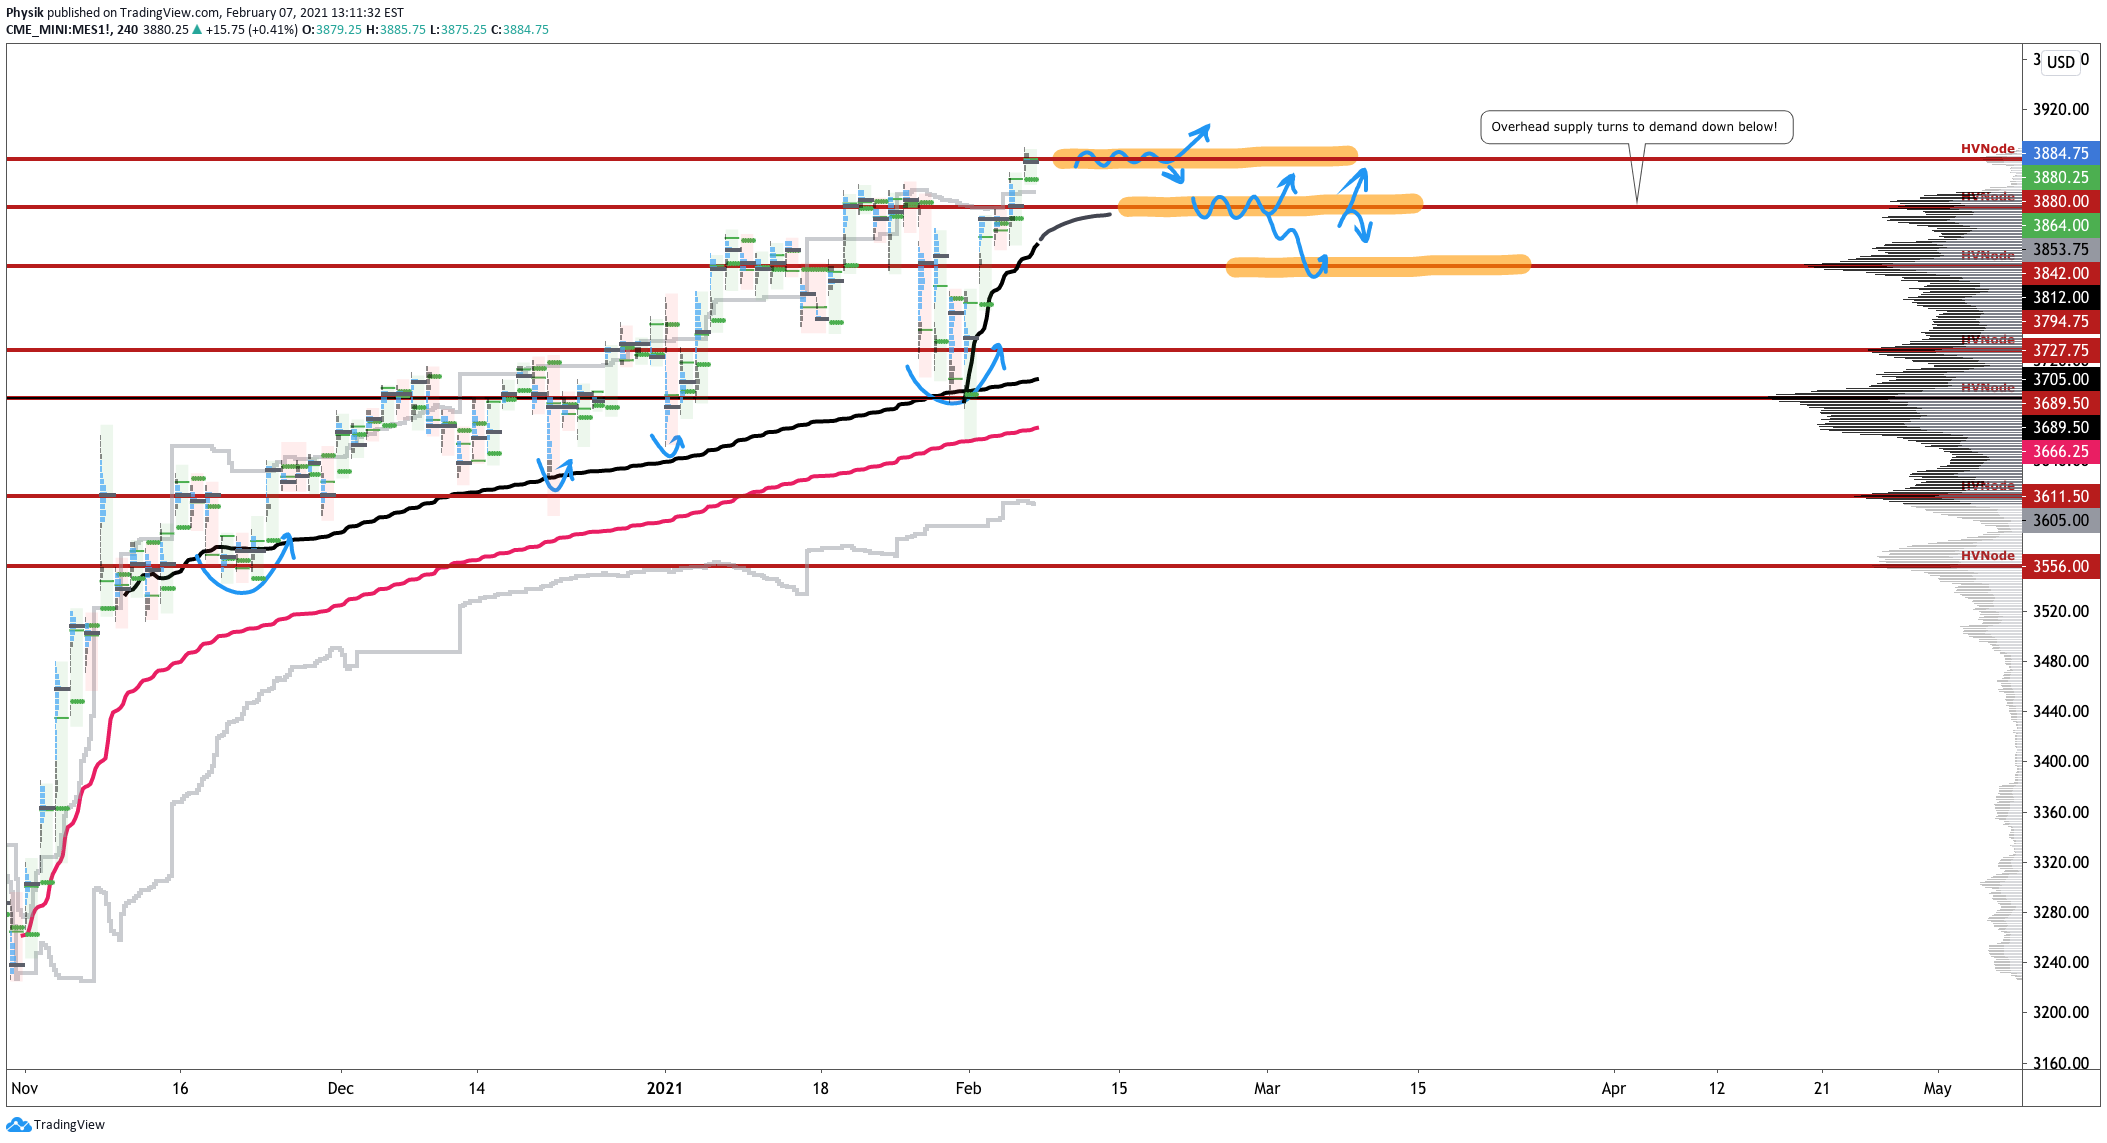
As noted in the past few commentaries, U.S. equity index futures are best positioned for balance (i.e., sideways trade) or further upside into Friday’s monthly options expiration (OPEX). Afterward, all bets are off. The potential to correct into the poor structure left behind by the prior week’s price discovery increases dramatically. Spending any considerable amount below the high-volume area (HVNode) at $3,900.00 would change the near-term bullish tone.

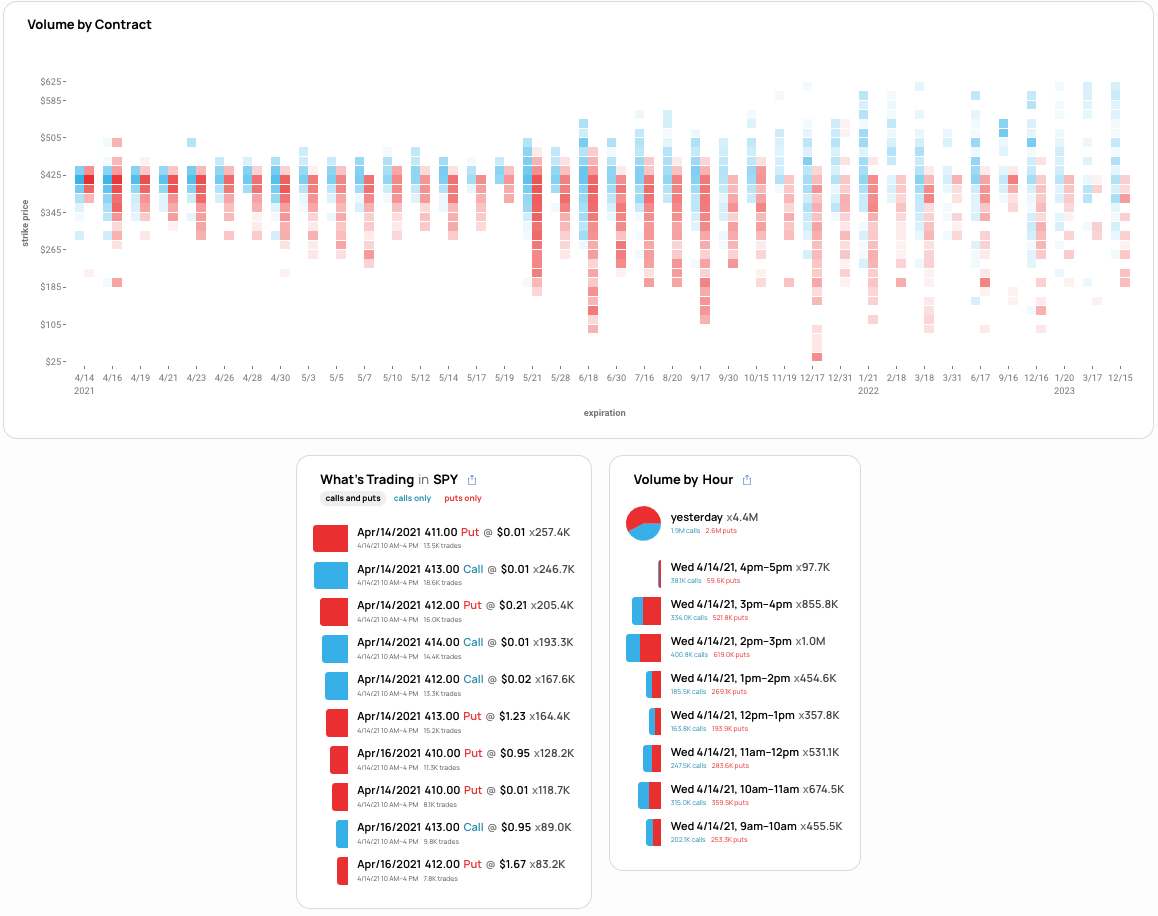
Option Expiration (OPEX) Significance: Option expiries mark an end to pinning (i.e, the theory that market makers and institutions short options move stocks to the point where the greatest dollar value of contracts will expire worthless) and the reduction dealer gamma exposure.

More On Volume Areas: A structurally sound market will build on past areas of high-volume (HVNode). Should the market trend for long periods of time, it will lack sound structure (identified as a low-volume area (LVNode) which denotes directional conviction and ought to offer support on any test). 
If participants were to auction and find acceptance into areas of prior low-volume, then future discovery ought to be volatile and quick as participants look to areas of high volume for favorable entry or exit.

For today, participants can trade from the following frameworks. 

In the best case, the S&P 500 trades sideways or higher; activity above yesterday’s fairest price to do business, $4,137.00, targets the $4,143.75 regular-trade high (RTH High). Initiative trade beyond the RTH High could reach as high as the $4,152.00 and $4,162.75 price extensions. In the worst case, the S&P 500 trades lower; activity below the regular-trade low (RTH Low) at $4,113.00 targets the $4,104.00 spike base and $4,092.50 untested POC (VPOC).

More On Spikes: Spike’s mark the beginning of a break from value. Spikes higher (lower) are validated by trade at or above (below) the spike base (i.e., the origin of the spike).

POCs: POCs (like HVNodes described above) are valuable as they denote areas where two-sided trade was most prevalent. Participants will respond to future tests of value as they offer favorable entry and exit.
Graphic: 4-hour profile chart of the Micro E-mini S&P 500 Futures.
Graphic: Physik Invest maps out the purchase of call and put options in the SPDR S&P 500 ETF Trust (NYSE: SPY), for April 14, 2021. Activity in the options market was primarily concentrated in short-dated tenors, in strikes as low as $364, which corresponds with $3,640 in the cash-settled S&P 500 Index (INDEX: SPX).
Graphic: SHIFT search shows that trade in the SPDR S&P 500 ETF Trust (NYSE: SPY) lacks duration. This could be construed as the absence of directional commitment.

News And Analysis

Markets | Wall Street banks pivot from pandemic to boom times. (Axios)

Markets | Chinese fund jumps 258% after ditching Dalio playbook. (BBG)

Economy | Consumer, main street demand for loans is lacking. (REU)

Economy | Freddie Mac sees rates and prices leveling off into 2022. (MND)

Economy | Biden infrastructure plan to boost growth, employment. (Moody’s)

Economy | U.S. economy gaining momentum, consumers confident. (REU)

Economy | U.S. import prices increase solidly, boosting inflation. (REU)

Politics | Biden to hit Putin with Russia sanctions after summit offer. (BBG)

Markets | BlackRock assets hit $9T on stimulus, vaccine hopes. (BBG)

Markets | Cathie Wood’s ARK buys into Coinbase, sells some Tesla. (REU)

Markets | VanEck launches new digital asset-focused ETF on Nasdaq. (TB)

What People Are Saying

Innovation And Emerging Trends

Supply Chain | Kroger launches a massive robot-filled fulfillment center. (TC)

Automotive | Ford takes aim at Tesla, GM with its autonomous system. (TC)

Crypto | AXA allows customers to pay insurance premiums in bitcoin. (TB)

FinTech | One Finance CEO eyes massive overhaul of digital finance. (Fox

 About

Renato founded Physik Invest after going through years of self-education, strategy development, and trial-and-error. His work reporting in the finance and technology space, interviewing leaders such as John Chambers, founder, and CEO, JC2 Ventures, Kevin O’Leary, Canadian businessman and Shark Tank host, Catherine Wood, CEO and CIO, ARK Invest, among others, afforded him the perspective and know-how very few come by.

Having worked in engineering and majored in economics, Renato is very detailed and analytical. His approach to the markets isn’t built on hope or guessing. Instead, he leverages the unique dynamics of time and volatility to efficiently act on opportunity.

Disclaimer

At this time, Physik Invest does not manage outside capital and is not licensed. In no way should the materials herein be construed as advice. Derivatives carry a substantial risk of loss. All content is for informational purposes only.

Categories
Commentary

Market Commentary For 3/19/2021

Notice: To view this week’s big picture outlook, click here.

What Happened: U.S. stock index futures auctioned higher as bond yields eased from their 14-month highs.

What Does It Mean: During Wednesday’s trade, alongside monetary policy announcements, the S&P 500 established a new all-time high.

Thereafter, participants took back the news-driven vertical price range, pushing indexes well into prior range.

All in all, Thursday’s dip comes after a significant recovery that managed to establish a new overnight all-time high in the S&P 500.

More On Overnight Rally Highs (Lows): Typically, there is a low historical probability associated with overnight rally-highs (lows) ending the upside (downside) discovery process.

Further, coming into Friday’s derivative expiry, market liquidity suggested strong selling Thursday with the resolve of resting orders (opportunistic buying or short covering into weakness) below the market. Speculative options activity was concentrated in near-dated tenors on the put-side, in the face of increased buying pressure (as witnessed through measures like DIX).

More On DIX: For every buyer is a seller (usually a market maker). Using DIX — which is derived from short sales (i.e., liquidity provision on the market making side) — we can measure buying pressure.

What To Expect: Friday’s regular session (9:30 AM – 4:00 PM ET) will likely open inside of prior-range, suggesting a limited potential for immediate directional opportunity.

During Thursday’s trade, lower prices failed to facilitate increased participation, evidenced by the S&P 500’s divergence from intraday value. The divergence continued until a test of the $3,904.25 low-volume area (LVNode) solicited a response.

More On Volume Areas: A structurally sound market will build on past areas of high-volume. Should the market trend for long periods of time, it will lack sound structure (identified as a low-volume area which denotes directional conviction and ought to offer support on any test). 

If participants were to auction and find acceptance into areas of prior low-volume, then future discovery ought to be volatile and quick as participants look to areas of high-volume for favorable entry or exit.

For today, participants can trade from the following frameworks.

In the best case, the S&P 500 finds acceptance (i.e., resolves higher or sideways), above the $3,937.25 Virgin Point of Control (VPOC). In the worst case, the S&P 500 finds acceptance (i.e., resolves lower or sideways) below the $3,937.25 VPOC.

More On POCs: POCs (like HVNodes described above) are valuable as they denote areas where two-sided trade was most prevalent. Participants will respond to future tests of value as they offer favorable entry and exit.

In case of higher prices, participants may look to auction as high as the $3,951.75 and $3,965.25 HVNodes. In case of lower prices, participants can look to the $3,904.25 and $3,879.25 low-volume LVNodes for a response.

Levels Of Interest: $3,937.25 VPOC.

Profile overlays on a 15-minute candlestick chart of the Micro E-mini S&P 500 Futures.
Categories
Commentary

Market Commentary For 3/18/2021

Notice: To view this week’s big picture outlook, click here.

What Happened: U.S. stock index futures auctioned higher after the Federal Reserve kept its policy rate unchanged and ramped up expectations for growth. Afterwards, the news-driven vertical price range was taken back, evidenced by an overnight liquidation that brought price back into range.

What Does It Mean: In light of reaffirmed monetary policy expectations, participants have more information to base their next move.

Heading into Wednesday’s policy meeting, stock indexes were balancing, trading back and forth in a small range. Now that participants have more information, attention is shifted to the Nasdaq-100’s relative weakness, the large March monthly options expiration (OPEX), after which, the interest at the $4,000.00 S&P 500 option strike will roll-off, as well as improving market breadth.

Bonus: Most funds are committed to holding long positions. In the interest of lower volatility returns, these funds will collar off their positions, selling calls to finance the purchase of downside put protection.

As a result of this activity, option dealers are long upside and short downside protection.

This exposure must be hedged; dealers will sell into strength as their call (put) positions gain (lose) value and buy into weakness as their call (put) positions lose (gain) value.

Now, unlike theory suggests, dealers will hedge call losses (gains) quicker (slower). This leads to “long-gamma,” a dynamic that crushes volatility and promotes momentum, observed by lengthy sprints, followed by rapid de-risking events as the market transitions into “short-gamma.”

If the interest near $4,000.00 S&P 500 is not rolled up in price and out in time, then option hedging requirements will change.

However, it is important to note that, in recent days, some exposure has been rolled up in price and out in time. This suggests an inclination by participants to maintain long exposure through OPEX.

What To Expect: Thursday’s regular session (9:30 AM – 4:00 PM ET) will likely open inside of prior-range and -value, suggesting a limited potential for immediate directional opportunity.

During Wednesday’s trade, participants found acceptance above the $3,931.00 Virgin Point of Control (VPOC), prior to establishing a new all-time rally-high. Overnight, participants failed to gather enough conviction to continue upside price exploration. Thereafter, prices came back into prior-range.

More On POCs: POCs (like HVNodes described above) are valuable as they denote areas where two-sided trade was most prevalent. Participants will respond to future tests of value as they offer favorable entry and exit.

Based on that information, for today, participants can trade from the following frameworks.

In the best case, the S&P 500 finds acceptance (i.e., resolves higher or sideways), above the $3,932.25 high-volume area (HVNode). In the worst case, the S&P 500 finds acceptance (i.e., resolves lower or sideways) below the $3,932.25 high-volume area (HVNode).

In case of higher prices, participants may look to auction as high as the $3,951.75 and $3,965.25 HVNodes. In case of lower prices, participants can look to the $3,904.25 low-volume area (LVNode) for a response.

More On Volume Areas: A structurally sound market will build on past areas of high-volume. Should the market trend for long periods of time, it will lack sound structure (identified as a low-volume area which denotes directional conviction and ought to offer support on any test). 

If participants were to auction and find acceptance into areas of prior low-volume, then future discovery ought to be volatile and quick as participants look to areas of high-volume for favorable entry or exit.

Levels Of Interest: $3,932.25 HVNode.

Profile overlays on a 15-minute candlestick chart of the Micro E-mini S&P 500 Futures.
Categories
Commentary

Market Commentary For 3/17/2021

Notice: To view this week’s big picture outlook, click here.

What Happened: U.S. stock index futures liquidated as investors weighed the implications of rising yields ahead of outcomes on a U.S. Federal Reserve policy meeting.

What Does It Mean: Heading into Wednesday’s session, which ought to be volatile as participants position themselves in response to new economic projections, responsive trade is the course of action.

This notion is supported by market liquidity metrics, which suggest buying pressure is leveling out, and options activity, which points to a build in interest at the $4,000 S&P 500 level, ahead of Friday’s monthly option expiration (OPEX).

More On Option Expiration (OPEX): Option expiries mark an end to pinning (i.e, the theory that market makers and institutions short options move stocks to the point where the greatest dollar value of contracts will expire worthless) and the reduction dealer gamma exposure.

What To Expect: Wednesday’s regular session (9:30 AM – 4:00 PM ET) will likely open just outside of prior-range and -value, suggesting a limited potential for immediate directional opportunity.

During Tuesday’s trade, participants established minimal excess at a new all-time rally-high before auctioning the S&P 500 below its $3,947.75 spike base, negating the bullishness of Monday’s end-of-day trade.

More On Spikes: Spike’s mark the beginning of a break from value. Spikes higher (lower) are validated by trade at or above (below) the spike base (i.e., the origin of the spike).

Excess: A proper end to price discovery; the market travels too far while advertising prices. Responsive, other-timeframe (OTF) participants aggressively enter the market, leaving tails or gaps which denote unfair prices.

For today, participants can trade from the following frameworks.

In the best case, the S&P 500 finds acceptance (i.e., resolves higher or sideways), above the $3,931.00 Virgin Point of Control (VPOC). In the worst case, the S&P 500 finds acceptance (i.e., resolves lower or sideways) below the $3,931.00 VPOC.

In case of higher prices, participants may look to auction as high as the $3,948.00 VPOC and $3,970.75 rally-high. In case of lower prices, participants can look to the $3,904.25 low-volume area (LVNode) for a response.

More On Volume Areas: A structurally sound market will build on past areas of high-volume. Should the market trend for long periods of time, it will lack sound structure (identified as a low-volume area which denotes directional conviction and ought to offer support on any test). 

If participants were to auction and find acceptance into areas of prior low-volume, then future discovery ought to be volatile and quick as participants look to areas of high-volume for favorable entry or exit.

More On POCs: POCs (like HVNodes described above) are valuable as they denote areas where two-sided trade was most prevalent. Participants will respond to future tests of value as they offer favorable entry and exit.

Levels Of Interest: $3,931.00 VPOC.

Profile overlays on a 15-minute candlestick chart of the Micro E-mini S&P 500 Futures.
Categories
Commentary

Market Commentary For The Week Ahead: ‘Ping-Pong’

Quote Of The Week: Excessive determinism is almost always the biggest enemy of stability. This seeming contradiction is behind the concept of metastability which captures the mode of market functioning in the last years. Metastability is what seems stable, but is not — a stable waiting for something to happen. [An] avalanche is a good example of metastability to keep in mind — a totally innocuous event can trigger a cataclysmic event (e.g., a skier’s scream, or simply continued snowfall until the snow cover is so massive that its own weight triggers an avalanche).

Quote by Aleksandar Kocic, Managing Director at Deutsche Bank AG (NYSE: DB), from Heisenberg Report.

Key Takeaways:

  • V-pattern recovery suggests higher prices.
  • Risks offset and funds looking to re-gross.
  • Dip presented a favorable buy opportunity.

What Happened: In light of a v-pattern recovery, after a quick de-risking event, U.S. stock indexes are positioned for further upside, as high as the 100% price projection, which happens to be above $4,000.00, a primary target in the S&P 500.

More On The V-Pattern: A pattern that forms after a market establishes a high, retests some support, and then breaks above said high. In most cases, this pattern portends continuation. 

What Does It Mean: This positive price action is happening in the context of bearish undercurrents, as evidenced by non-participatory speculative flows and delta, as well as a divergence in the DIX.

More On Volume Delta: Buying and selling power as calculated by the difference in volume traded at the bid and offer.

More On DIX: For every buyer is a seller (usually a market maker). Using DIX — which is derived from short sales (i.e., liquidity provision on the market making side) — we can measure buying pressure.

More On Speculative Flows: Participants looking to capitalize on either upside or downside through the purchase and sale of options, the right to buy or sell an asset at a later date and agreed upon price.

Adding, according to The Market Ear, similar risk rallies have happened after hedge fund de-grossing events; now, “Equities are rising along higher yields, dollar and [volatility], and the magic word here is discounting inflation.”

Further, since price pays, participants ought to discount the bearish undercurrents, and position themselves for upside. Hedge funds are doing so, as evidenced by an increase in gross exposures (Graphic 1), alongside other speculative participants that look to capitalize on their opinions through the options market (Graphic 2). 

Graphic 1: JPMorgan Chase & Co. (NYSE: JPM) data suggests normalization as “HFs add back to gross exposures.”
Graphic 2: Physik Invest maps out the purchase of call and put options in the SPDR S&P 500 ETF Trust, for the week ending February 6, 2021.

Last week, per Graphic 2, the SPDR S&P 500 ETF Trust, the largest ETF that tracks the S&P 500, saw a rise in purchases of short-dated call and put options. Given the tenor (i.e., the length of time remaining before contract expiration), there’s a lack of long-term commitment to direction.

Adding, early and late in the week, the purchase of put options dominated. This suggests participants were either looking to protect against or capitalize on downside. In the middle of the week, participants were looking to protect against or capitalize on upside. 

More On Options: If an option buyer was short (long) stock, he or she would buy a call (put) to hedge upside (downside) exposure. Option buyers can also use options as an efficient way to gain directional exposure.

The above, alongside the market’s re-entry into long-gamma (Graphic 3) and a normalization of the VIX futures term structure (see Graphic 4) in which longer-dated VIX expiries are more expensive, suggests the potential for less risk and volatility in equity markets.

More On Gamma: Gamma is the sensitivity of an option to changes in underlying price. Dealers that take the other side of option trades hedge their exposure to risk by buying and selling the underlying. 

When dealers are short-gamma, they hedge by buying into strength and selling into weakness. When dealers are long-gamma, they hedge by selling into strength and buying into weakness. The former exacerbates volatility. The latter calms volatility.

Graphic 3: SpotGamma suggests S&P 500 at or above “Long-Gamma” juncture.
Graphic 4: VIX Futures Term Structure per vixcentral.com.

What To Expect: U.S. stock indexes are best positioned for further balance or upside discovery.

Graphic 5: 4-hour profile chart of the Micro E-mini S&P 500 Futures.

In Graphic 5, the highlighted zones denote high-volume areas (HVNodes), or valuable areas to transact.

More On Volume Areas: A structurally sound market will build on past areas of high-volume. Should the market trend for long periods of time, it will lack sound structure (identified as a low-volume area which denotes directional conviction and ought to offer support on any test). 

If participants were to auction and find acceptance into areas of prior low-volume, then future discovery ought to be volatile and quick as participants look to areas of high-volume for favorable entry or exit.

Last Monday, participants found acceptance in prior low-volume. Thereafter, discovery was volatile and quick as participants looked to areas of high-volume for favorable entry and exit (e.g., where the market spent the majority of its time Tuesday through Thursday).

On Friday, the S&P 500 left the HVNode near $3,840.00. As stated, HVNodes can be thought of as building blocks — they also denote areas of supply and demand. In this case, $3,840.00 can now be thought of as an area of demand. The primary strategy is to respond to probes into these supply (i.e., selling responsively) and demand (i.e., buying responsively) areas as they offer favorable entry and exit.

What To Do: Participants will want to pay attention to last Thursday’s $3,855.00 Virgin Point Of Control, or VPOC (i.e., the fairest price to do business in a prior session), and end-of-day spike, as well as the $3,840.00 HVNode.

More On POCs: POCs (like HVNodes described above) are valuable as they denote areas where two-sided trade was most prevalent. Participants will respond to future tests of value as they offer favorable entry and exit.

More On Spikes: Spike’s mark the beginning of a break from value. Spikes higher (lower) are validated by trade at or above (below) the spike base (i.e., the origin of the spike).

Given the above references, the following frameworks ought to be applied.

In the best case, the S&P 500 does some backfilling to repair aforementioned poor structures. In such a case, participants would look for responsive buying to surface at or above the $3,840.00 HVNode

In the worst case, any break that finds increased involvement (i.e., supportive flows and delta) below the $3,840.00 HVNode, would favor continuation as low as the $3,794.75 and $3,727.75 HVNodes.

Note that the $3,727.75 HVNode corresponds with the $372 SPY put concentration, which may serve as a near-term target, or bottom, for a sell-off. 

Graphic 6: Profile overlays on a 15-minute candlestick chart of the Micro E-mini S&P 500 Futures.

Conclusions: Simplicity is key here.

Participants ought to look for favorable areas to transact, such as those high-volume areas in the S&P 500 featured in Graphic 5.

Levels Of Interest: $3,840.00 HVNode.

Photo by Josh Sorenson from Pexels.

Categories
Commentary

Market Commentary For The Week Ahead: ‘Rally On Pause’

Key Takeaways:

What Happened:

Alongside mixed economic releases, plans for added fiscal stimulus, as well as a start to the Q4 earnings season, U.S. index futures broke balance and auctioned lower.

Given that Friday’s worst case scenario was realized, U.S. stock indexes are positioned for further downside discovery.

Graphic 1: Profile overlays on a 30-minute candlestick chart of the Micro E-mini S&P 500 Futures

What To Expect: Friday’s session in the S&P 500 found responsive buying surface after a test of the $3,741.25 Virgin Point of Control, or VPOC (i.e., the fairest price to do business in a prior session).

Noting: POCs are valuable as they denote areas where two-sided trade was most prevalent. Participants will respond to future tests of value as they offer favorable entry and exit.

In the simplest way, high-volume areas can be thought of as building blocks. A structurally sound market will build on past areas of high-volume. Should the market trend for long periods of time, it will lack sound structure. If participants were to auction and find acceptance into areas of prior low-volume, then future discovery ought to be volatile and quick as participants look to areas of value for favorable entry or exit.

Thereafter, buying pressure quickly disappeared, and the S&P 500 confirmed the balance-break. Now, in light of the market’s search for an area to establish balanced, two-sided trade, participants will come into Tuesday’s session knowing the following:

  1. Prior to a multi-session consolidation, profile structures denoted the presence of short-covering. This was the result of old, weak-handed business emotionally buying to cover short positions, causing swift movement, followed by a stalled advance, or two-sided trade.
  2. Unsupportive speculative flows and delta (e.g., non-presence of committed buying or selling) in some instances, as can be viewed by the order flow graphics 2 and 3 below.
  3. The multi-month upside breakout targeting S&P 500 prices as high as $4,000.00 remains intact, per graphic 4.
  4. After a v-pattern recovery, the S&P 500 consolidated near the $3,800 high-open interest strike, forming a balance-area. This structure was resolved with Friday’s balance-break. A break-out from balance is usually the start of a short-term auction. Therefore, placing trades in the direction of the break is the normal course of action. Trading back into the consolidation (above $3,763.75), thereby invalidating the break-out, may portend a move to the other end of balance ($3,824.25).
Graphic 2: Divergent delta in the iShares Russell 2000 ETF (NYSE: IWM), one of the largest ETFs that track the Russell 2000
Graphic 3: Order flow in the SPDR S&P 500 ETF Trust (NYSE: SPY), the largest ETF that tracks the S&P 500
Graphic 4: Daily candlestick chart of the cash S&P 500 Index

Given the above dynamics, the following frameworks apply for next week’s shortened holiday trade.

In the best case, the S&P 500 remains above its $3,763.75 balance-area low (BAL). Expectations thereafter include continued balance or initiative buying to take out the $3,824.25 balance-area high (BAH).

In the worst case, the S&P 500 remains below its $3,763.75 BAL. Expectations thereafter include a test of the low-volume node (LVNode) near $3,732.75. A break of the LVNode would portend a response near the $3,703.25 balance-break projection.

Conclusions: For now, despite a negative balance-break jeopardizing the bullish thesis, broad-market indices are in a longer-term uptrend. Participants ought to look for favorable areas to transact, such as those big-picture high-volume areas featured in graphic 5.

Graphic 5: 4-hour profile chart of the Micro E-mini S&P 500 Futures

Levels Of Interest: $3,763.75 BAL, $3,824.25 BAH, $3,732.75 LVNode, $3,703.25 balance-break projection.

Cover photo by Oleg Magni from Pexels.