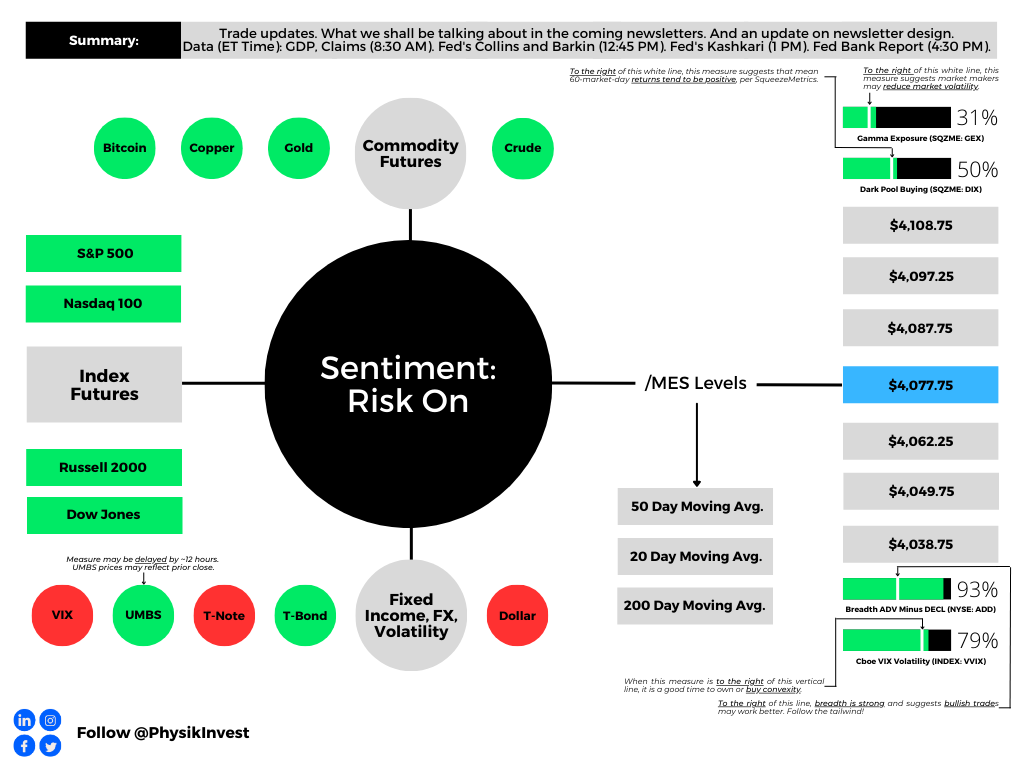
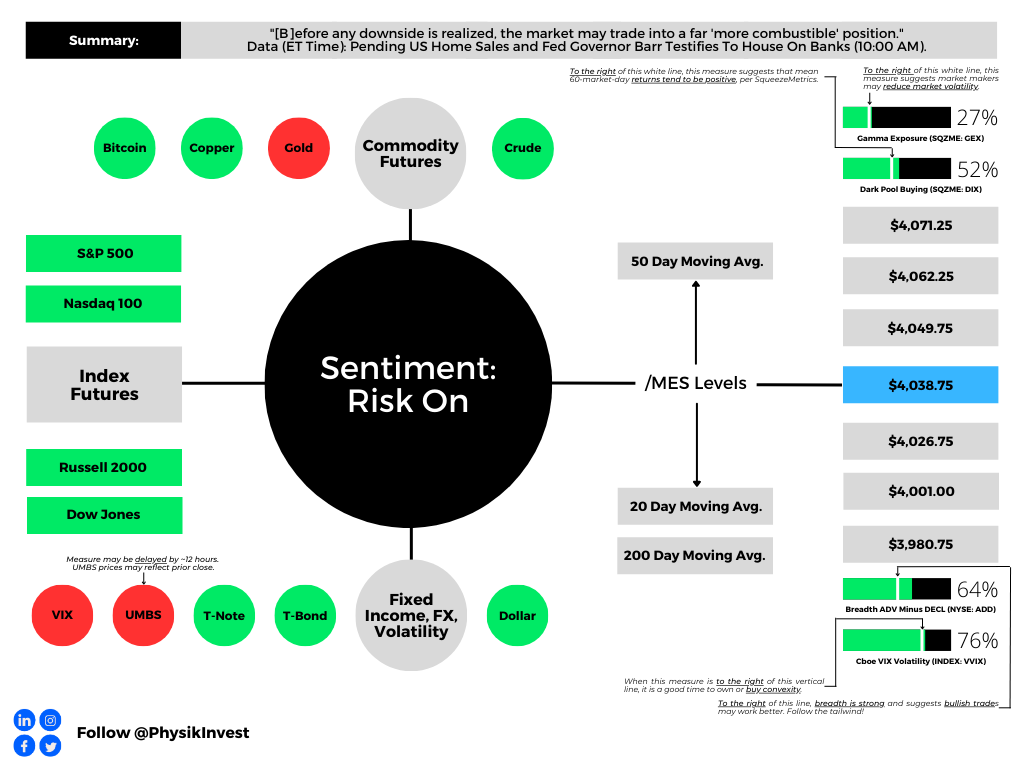
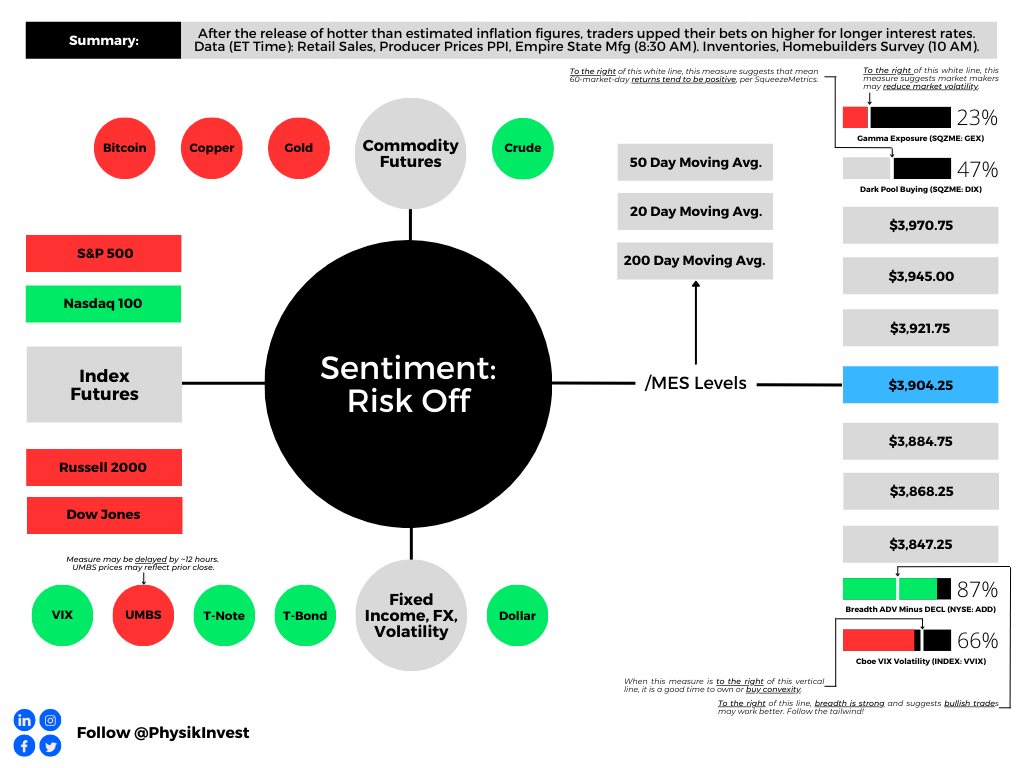
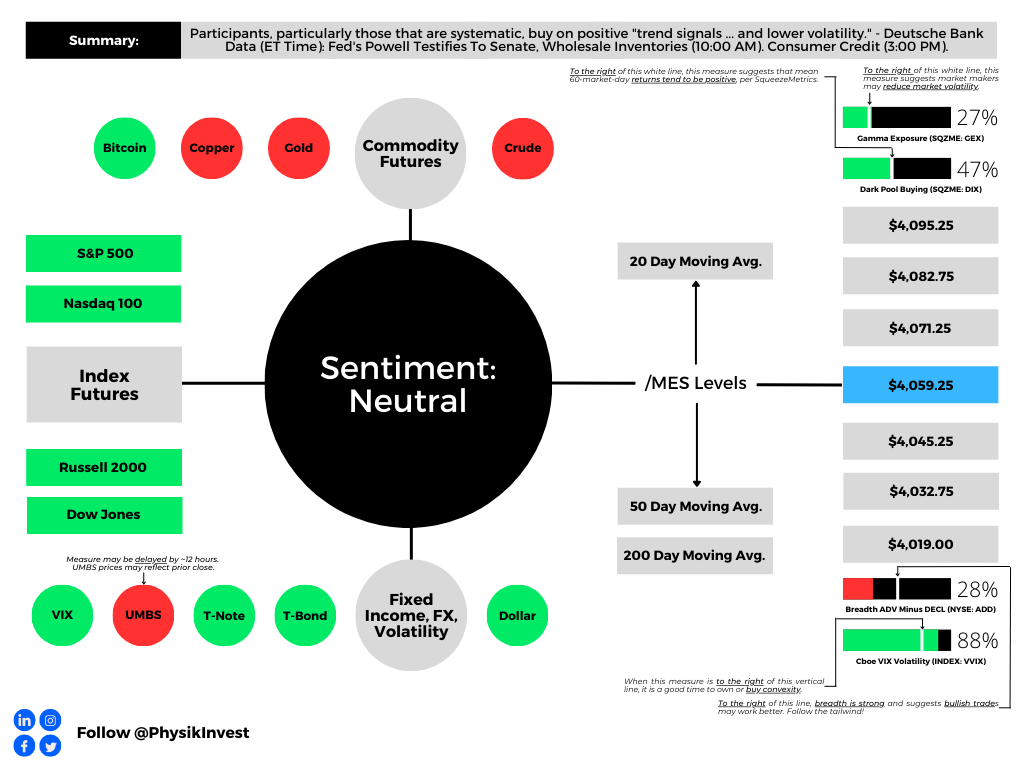
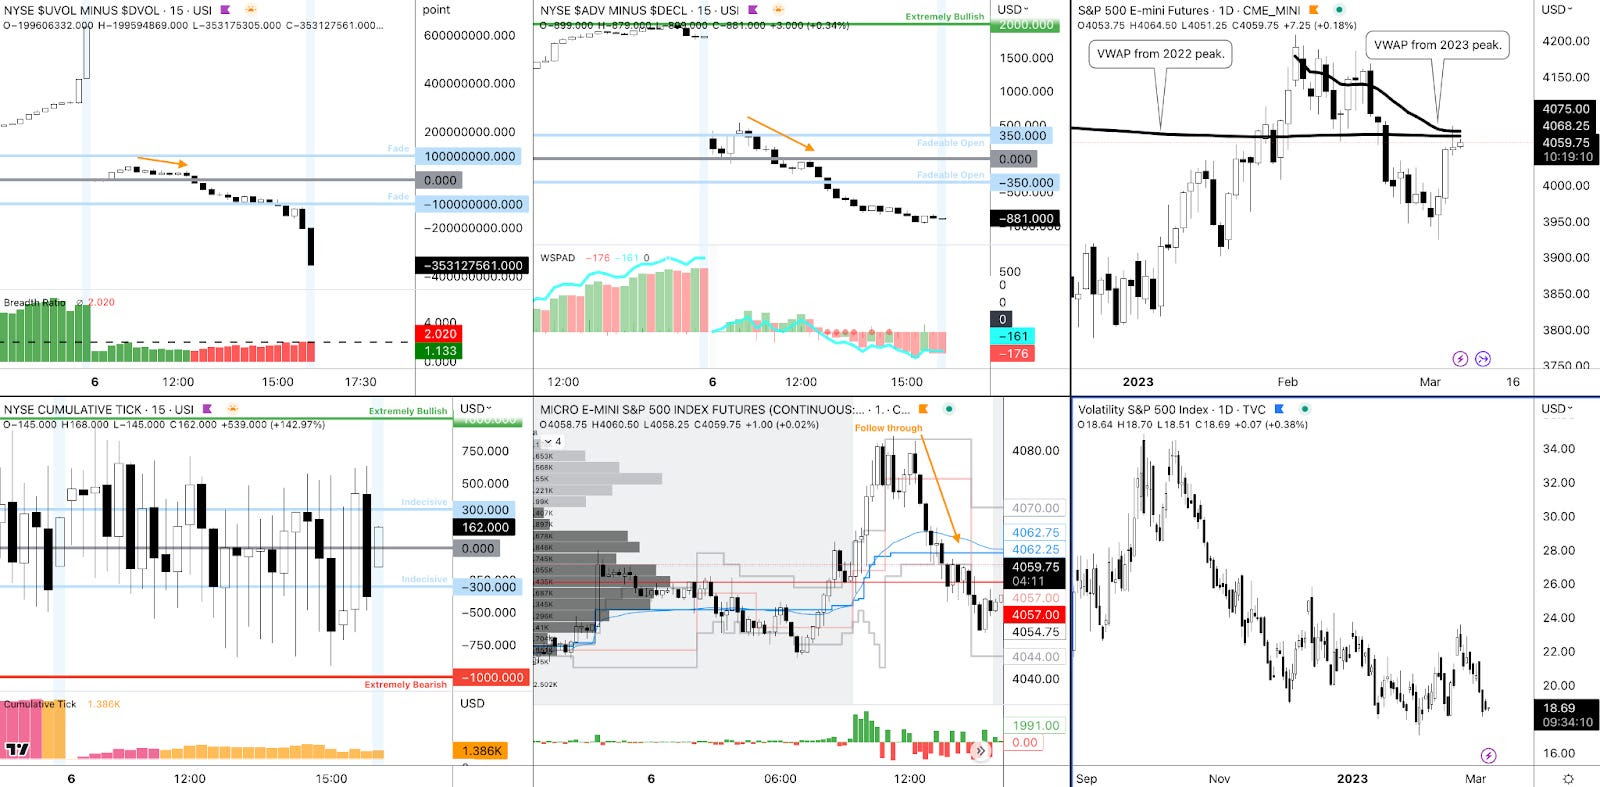
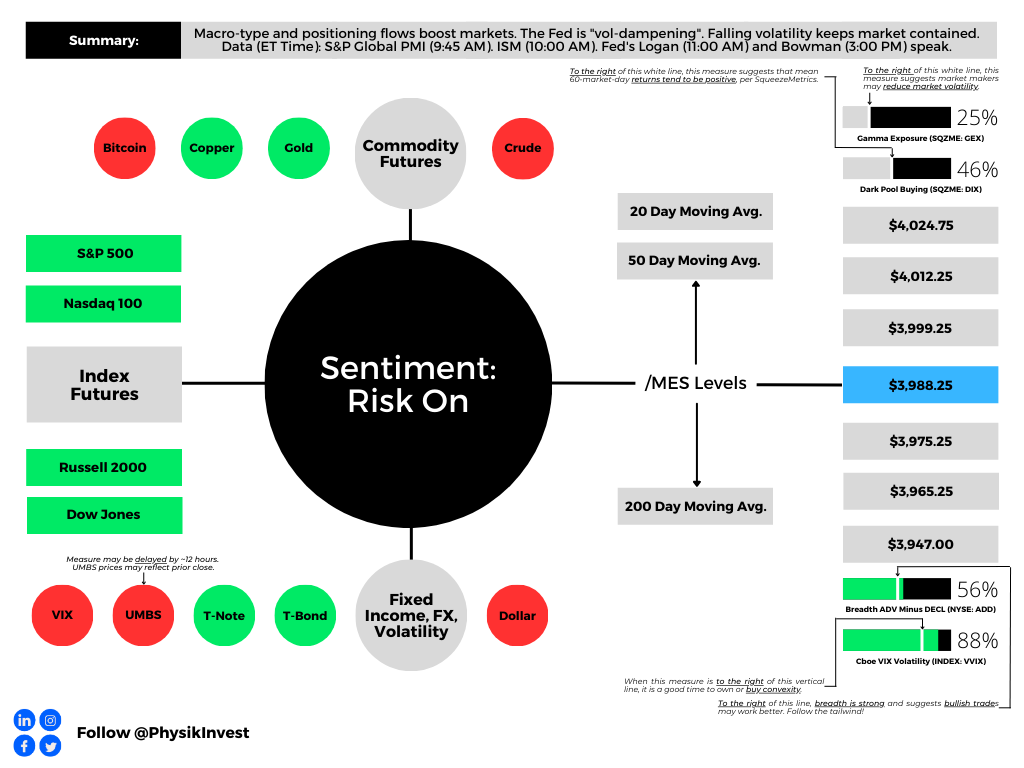
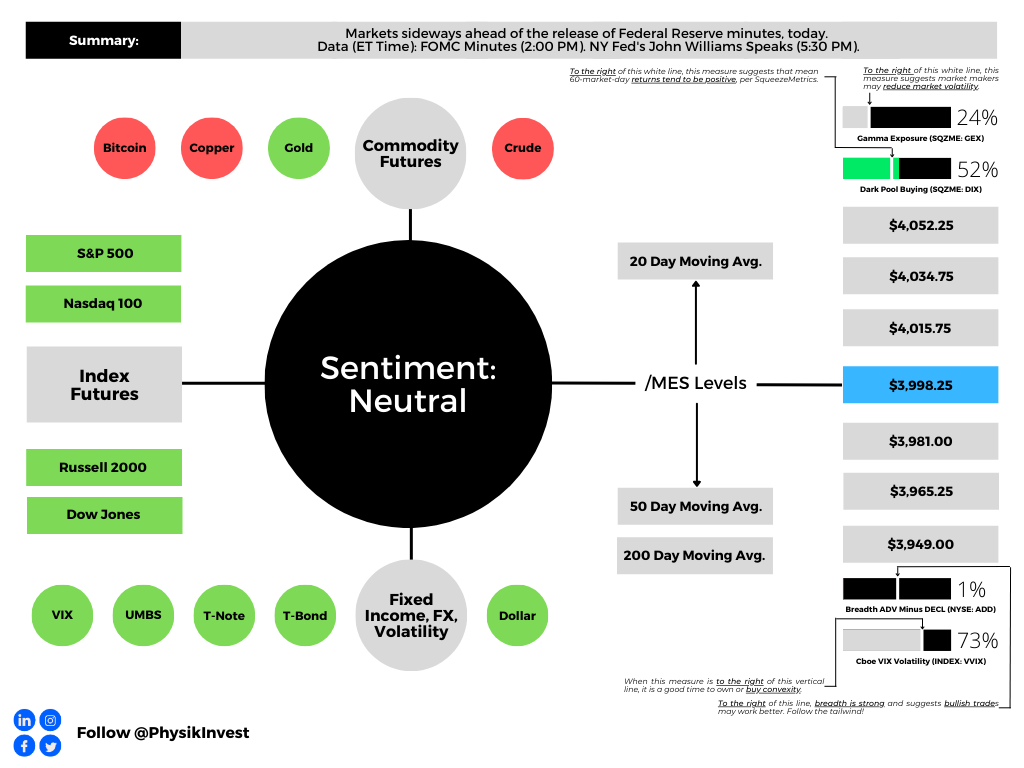
Graphic updated 6:30 AM ET. Sentiment Risk-On if expected /MES open is above the prior day’s range. /MES levels are derived from the profile graphic at the bottom of this letter. Click here for the latest levels. SqueezeMetrics Dark Pool Index (DIX) and Gamma (GEX) with the latter calculated based on where the prior day’s reading falls with respect to the MAX and MIN of all occurrences available. A higher DIX is bullish. The lower the GEX, the more (expected) volatility. Click to learn the implications of volatility, direction, and moneyness. Breadth reflects a reading of the prior day’s NYSE Advance/Decline indicator. The CBOE VIX Volatility Index (INDEX: VVIX) reflects the attractiveness of owning volatility. UMBS prices via MND. Click here for the economic calendar.
Administrative
Thanks for the feedback on the newsletter design! The technical section has returned for your viewing of crucial levels. We may update this section or merge it with another in the future. If you have any feedback, please comment or reply!
By the way, check out fx:macro’s neat market dashboard how-to-build guide! They have a fabulous newsletter, and this dashboard is an excellent component.
👉 A lot of people have asked about the Market Dashboard I'm using and how to build something similar
👉 I've put together a 35-page PDF with >50 screenshots going through the entire process using Excel and TradingView
In the coming sessions, there will be a dive into the geopolitical developments of late, far higher in quality than what we started this week with. For a sneak peek at what we will be talking about, look at this article, this podcast, and the Daily Brief for 1/4/23.
Positioning
In yesterday’s letter on positioning contexts, we concluded it was likely for markets to remain contained through month-end.
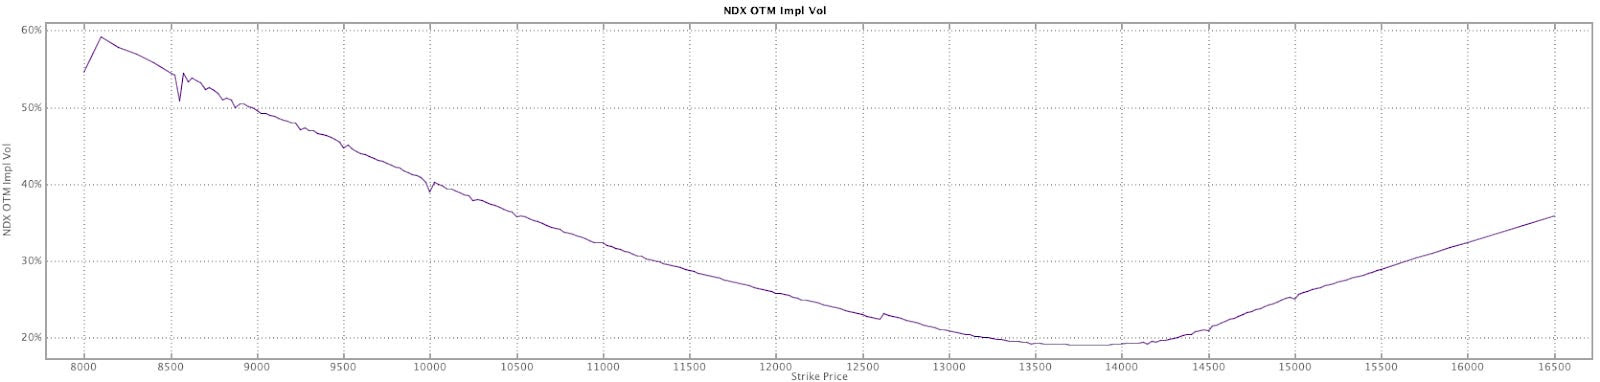
We said, “there is potential for markets to move into a far ‘more combustible’ position, … [and], with call skews far up meaningfully steep, still-present low- and zero-cost call structures” in previously depressed products like the Nasdaq 100 (INDEX: NDX), buoyed by financial tensions easing, were attractive to express the bullish view.
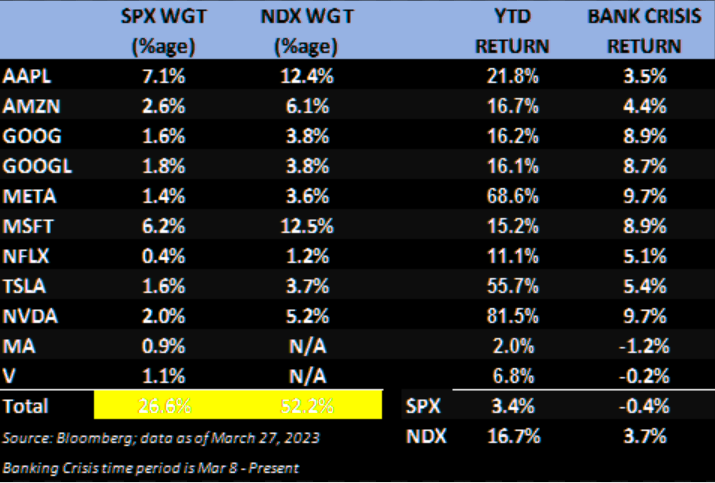
Graphic: Retrieved from JPMorgan Chase & Co (NYSE: JPM) via The Market Ear.
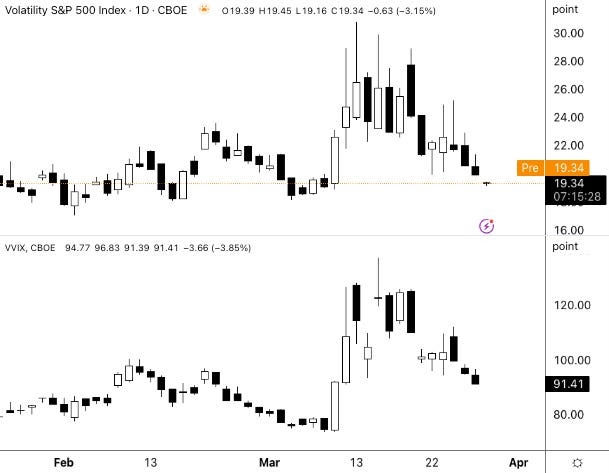
Though we weren’t too right about the potential for volatility to be sticky, which may be detrimental to some of the more expensive structures, such trades’ exposure to direction and movement appears to be offsetting time decay and volatility, sped up by the resolution of the liquidity crisis (i.e., the asset-liability mismatch at some banks that thought their depositors were far more loyal, hence less of a need to hedge risk) which prompted traders a few weeks back to demand protection and reprice options higher; the Merrill Lynch Option Volatility Estimate (INDEX: MOVE) and Cboe Volatility Index (INDEX: VIX) have come in dramatically. Please take a look at the full letter here.
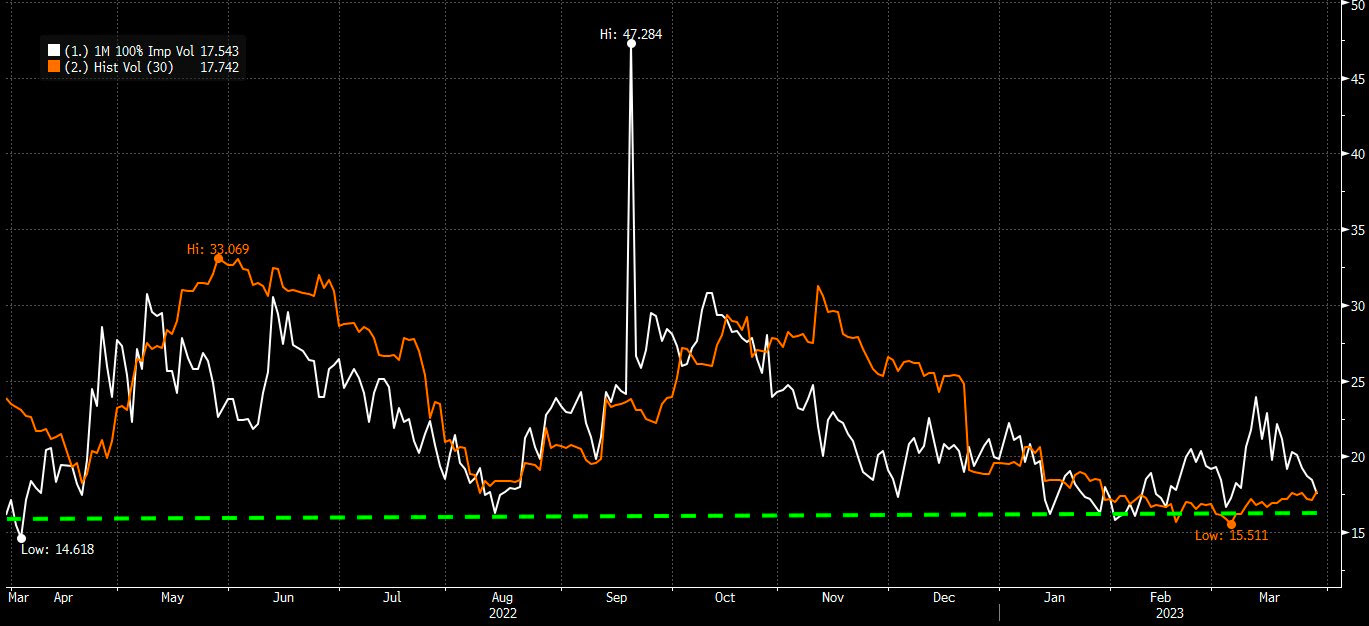
As stated on 3/29, the fundamental view hasn’t changed. Therefore, we may consider monetizing our structures now and in the near future and using those credits to offset debit risk in plays such as far-dated bear put spreads (i.e., buy put and sell another at a lower strike); options data and insight platform SpotGamma says the juice has been squeezed now with S&P 500 (INDEX: SPX) 1-month at-the-money implied volatility or IVOL pricing at 17%. “For a decline to continue, we need a change in volatility regime (i.e., soft landing, bank crisis resolved, etc.) because, with 1-month realized at 15%, you can argue there isn’t much juice left to squeeze.” Caution on the upside plays.
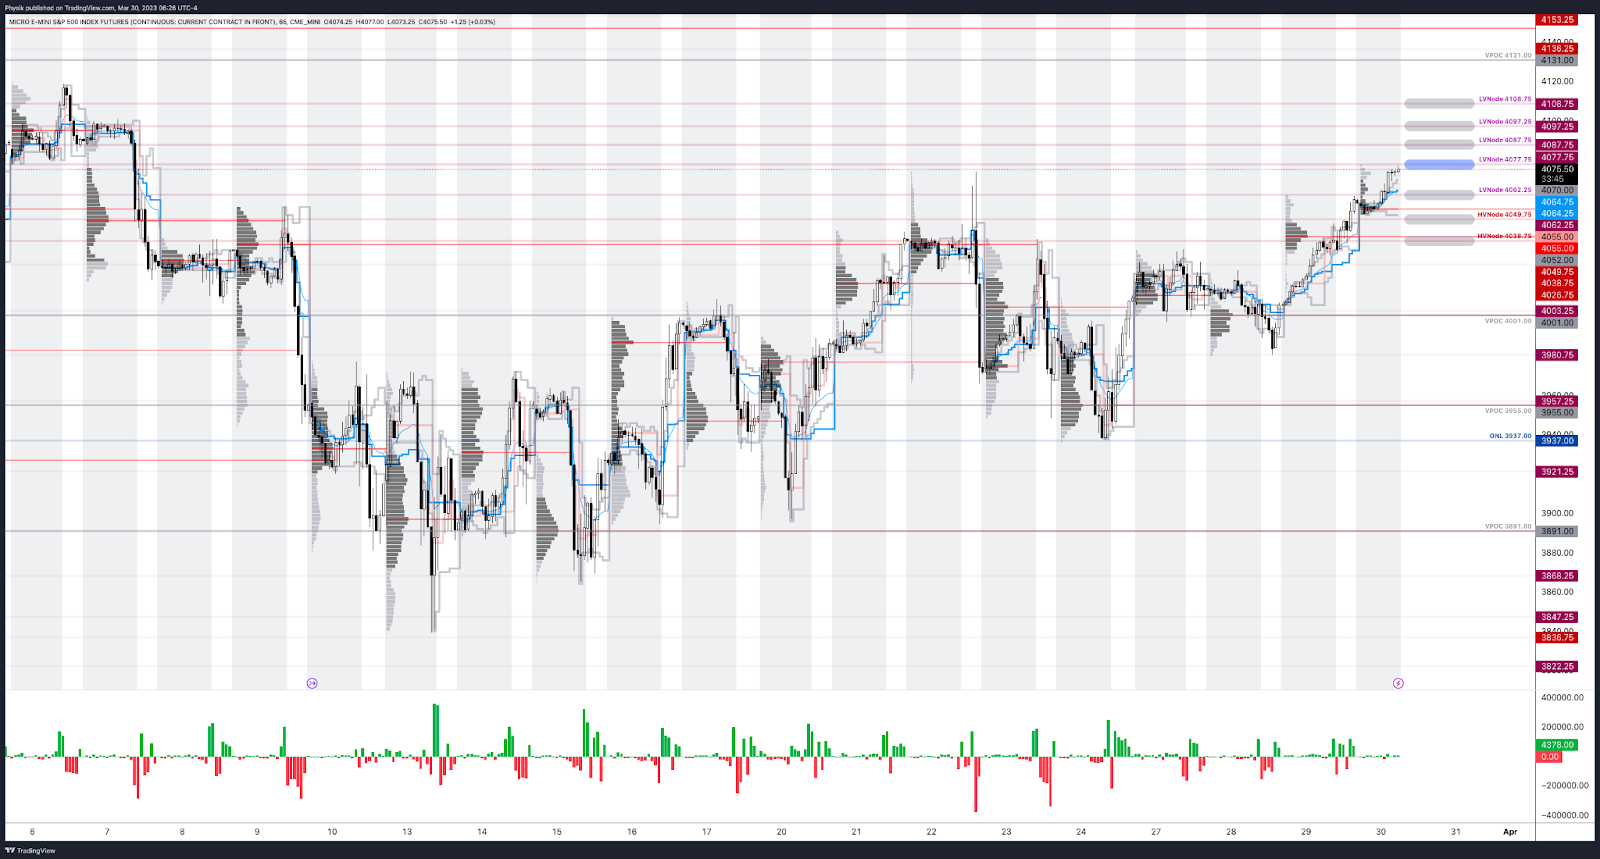
As of 6:30 AM ET, Thursday’s regular session (9:30 AM – 4:00 PM ET) in the S&P 500 will likely open in the upper part of a positively skewed overnight inventory, outside of the prior day’s range, suggesting a potential for immediate directional opportunity.
The S&P 500 pivot for today is $4,077.75.
Key levels to the upside include $4,087.75, $4,097.25, and $4,108.75.
Key levels to the downside include $4,062.25, $4,049.75, and $4,038.75.
Click here to load the updated key levels via the web-based TradingView platform.
New links are produced daily.
Quoted levels likely hold, barring an exogenous development.
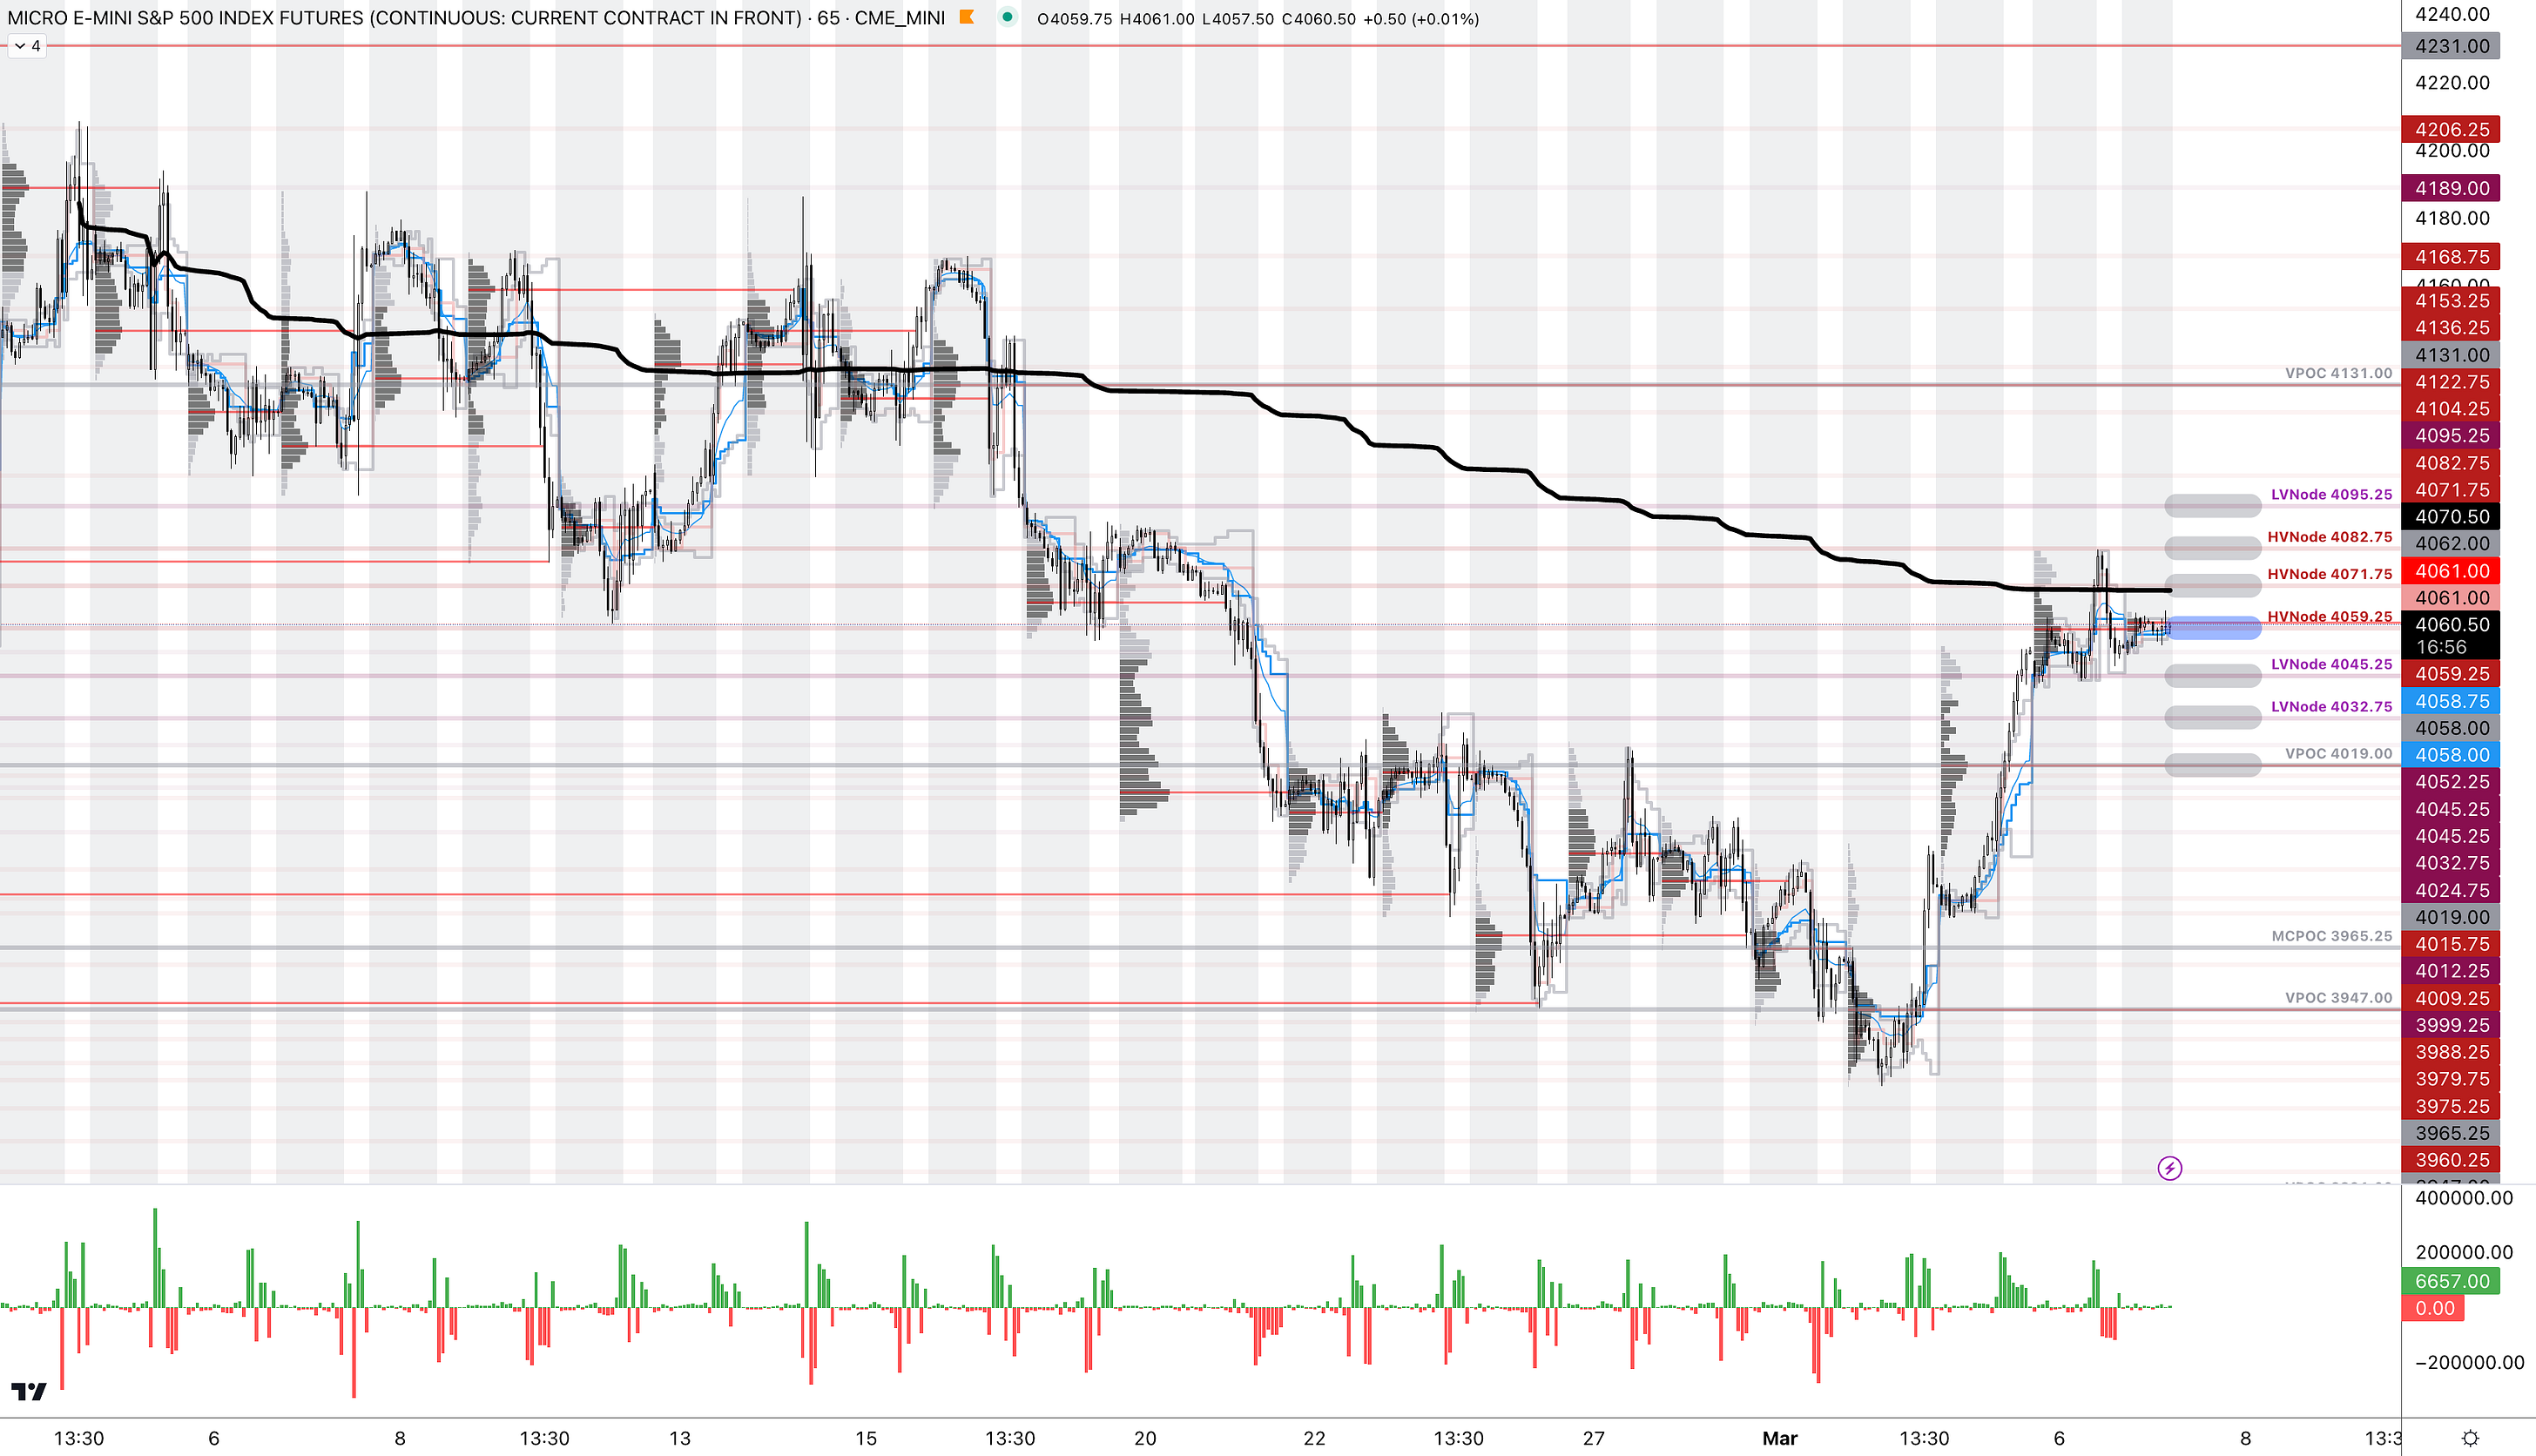
Graphic: 65-minute profile chart of the Micro E-mini S&P 500 Futures.
About
The author, Renato Leonard Capelj, spends the bulk of his time at Physik Invest, an entity through which he invests and publishes free daily analyses to thousands of subscribers. The analyses offer him and his subscribers a way to stay on the right side of the market.
You may view this letter’s content calendar at this link.
Disclaimer
Do not construe this newsletter as advice; all content is for informational purposes, and derivatives carry a substantial risk of loss. Capelj and Physik Invest, non-professional advisors, will never solicit others for capital or collect fees and disbursements for their work.
Physik Invest’s Daily Brief is a free newsletter sent to thousands of subscribers daily. Intrigued about what moves markets and how that can impact your financial wellness? Subscribe below.
Graphic updated 7:00 AM ET. Sentiment Risk-On if expected /MES open is above the prior day’s range. Click here for the latest levels. /MES levels are derived from the profile graphic at the bottom of this letter. SqueezeMetrics Dark Pool Index (DIX) and Gamma (GEX) with the latter calculated based on where the prior day’s reading falls with respect to the MAX and MIN of all occurrences available. A higher DIX is bullish. The lower the GEX, the more (expected) volatility. Click to learn the implications of volatility, direction, and moneyness. Breadth reflects a reading of the prior day’s NYSE Advance/Decline indicator. The CBOE VIX Volatility Index (INDEX: VVIX) reflects the attractiveness of owning volatility. UMBS prices via MND. Click here for the economic calendar.
Administrative
The newsletter format needs to evolve a bit. Feedback is welcomed! If you are looking for the link to the daily chart, see the caption below the graphic above. Take care!
Positioning
Fear of contagion prompted demands for protection. Measures of implied volatility or IVOL rose, and consequently, these demands for protection pressured markets.
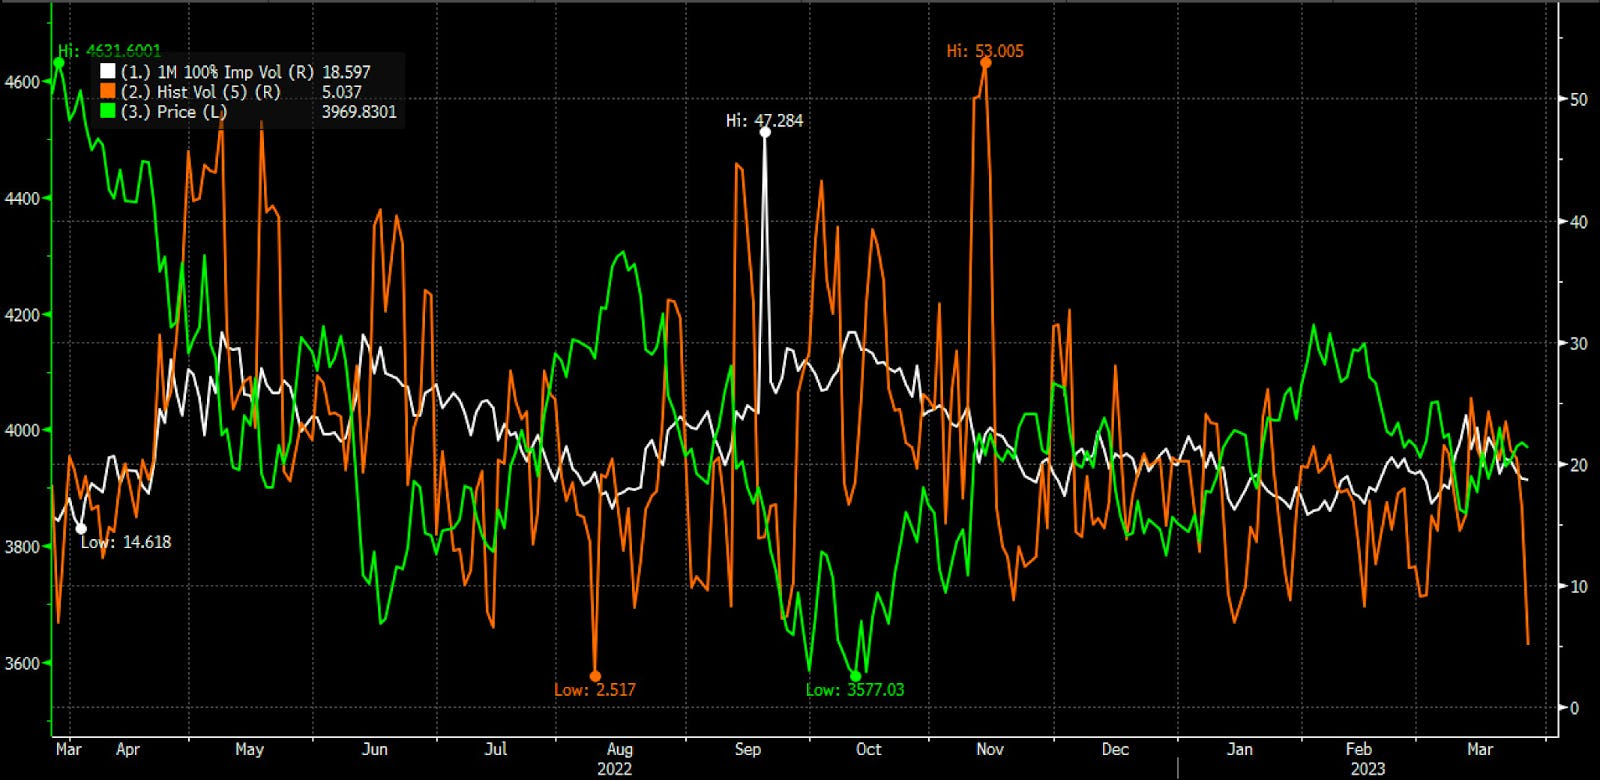
Previously, this letter explained for protection to keep its value, there would have to be a shift higher in realized volatility or RVOL. Well, RVOL did not come back in a big way at the index level, as many expected.
Thus, the positive effects of the bank-related stimulation and traders’ pulling forward their timeline for easing were compounded by the unwinding of hedging strategies.
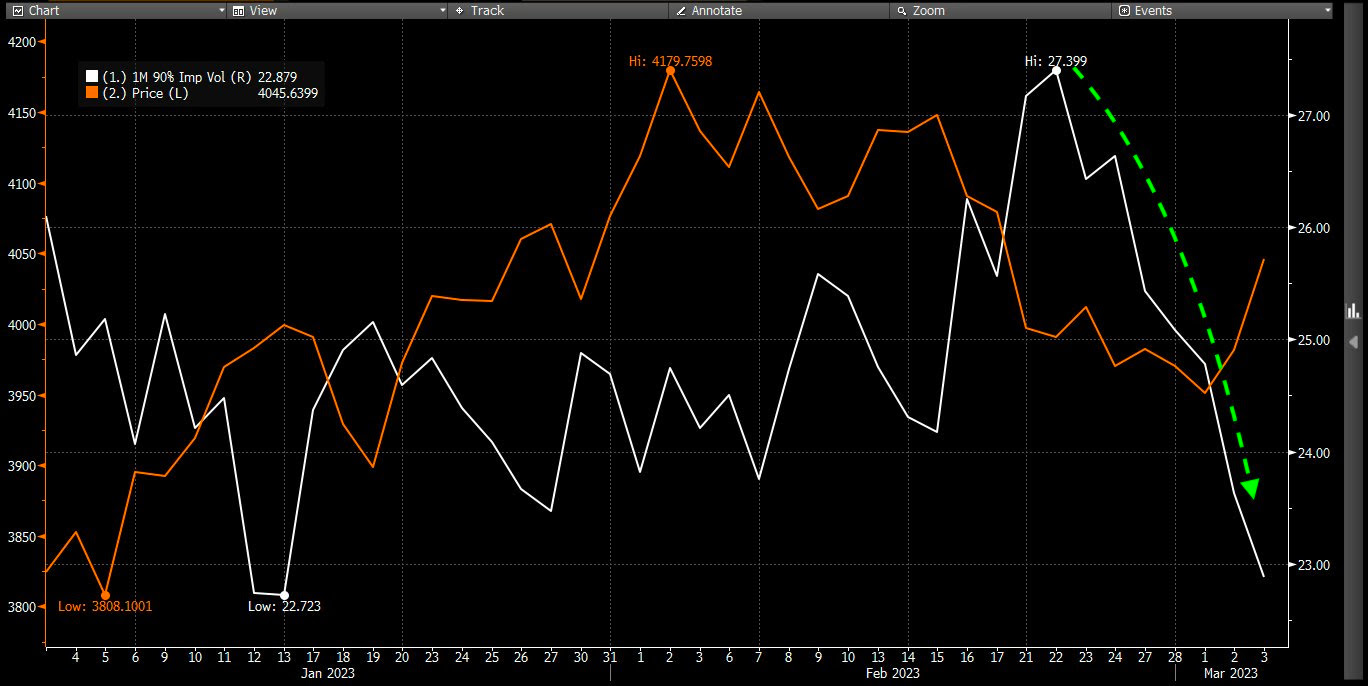
Graphic: Retrieved from Bloomberg via SpotGamma. “This drop in 5-day realized vol (orange) is pretty sharp, given it occurred from such a low relative level. ‘Can’t short it, don’t want to buy it.’ This vol decline comes as SPX put open interest was cleared with March OPEX, and big VIX call interest expired last week.”
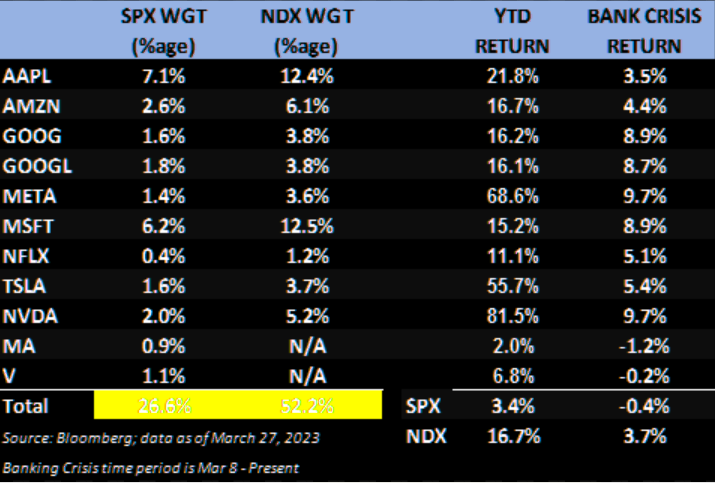
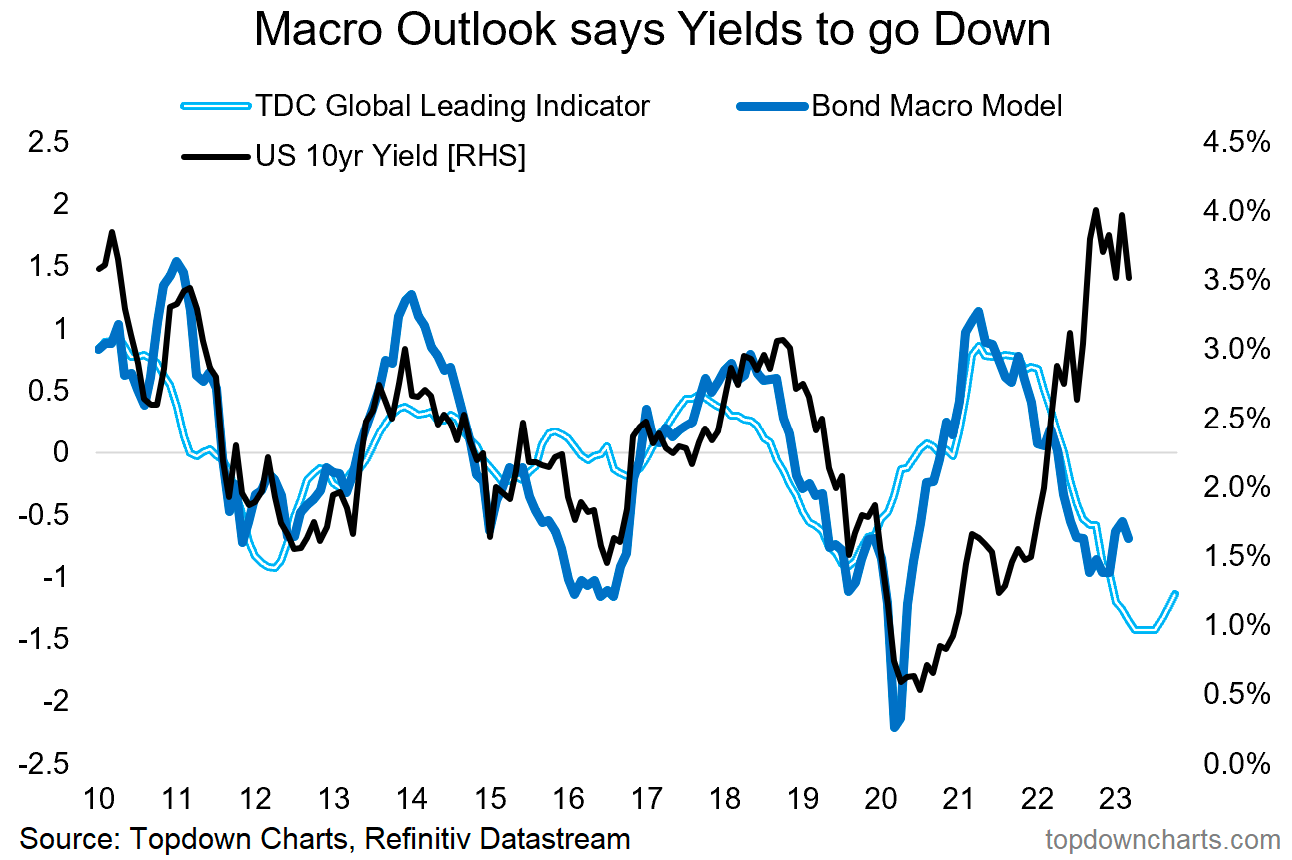
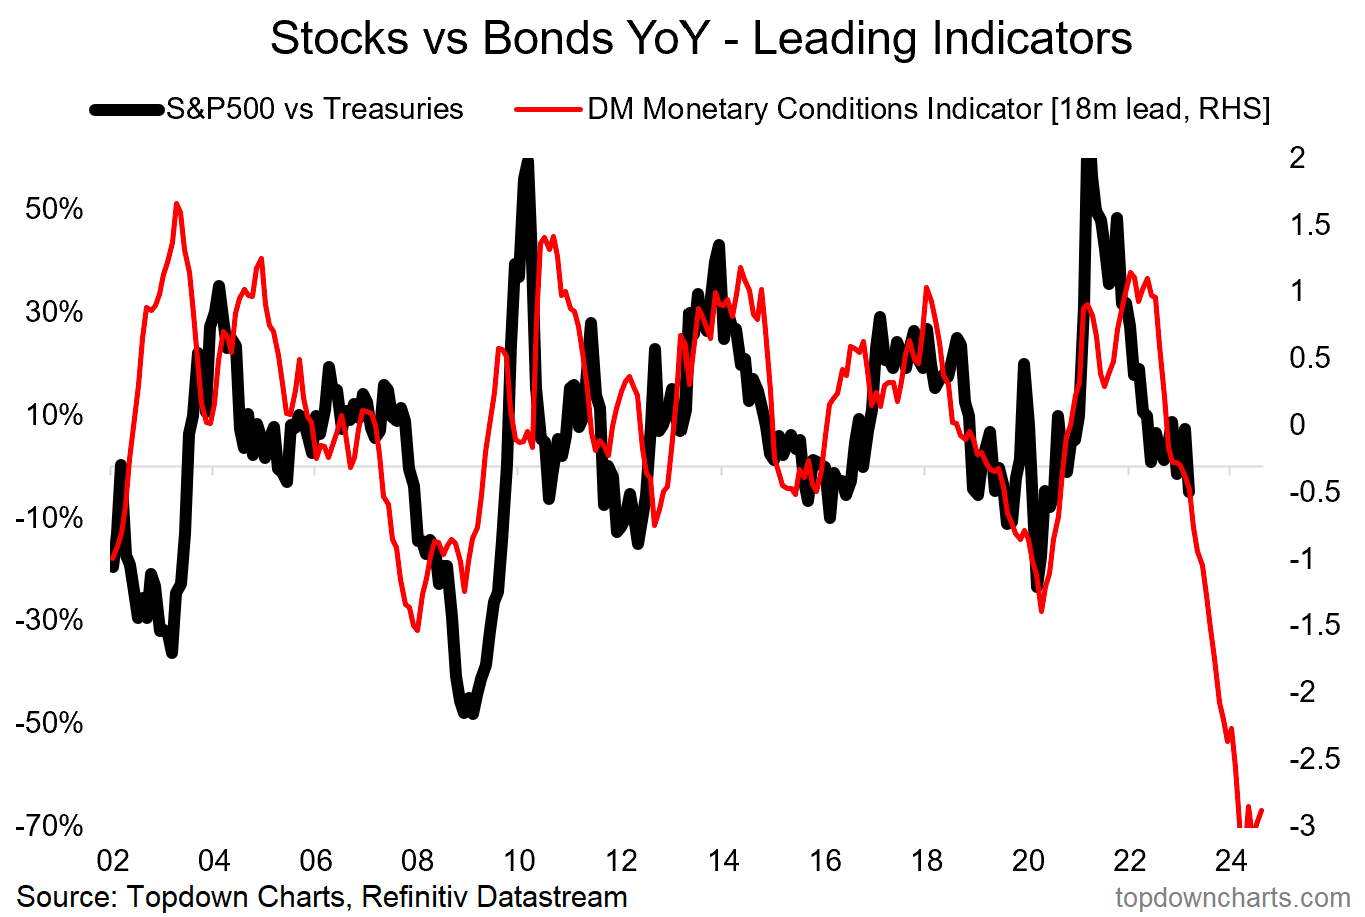
Previously depressed products like the Nasdaq 100 or NDX, which are generally very sensitive to monetary tightening, have performed well.
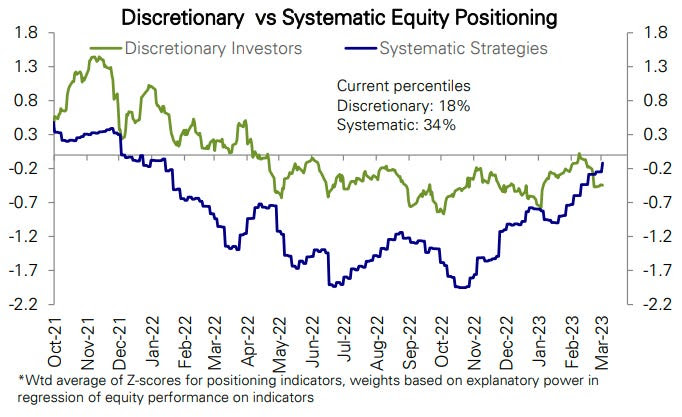
Graphic: Retrieved from Callum Thomas’ Topdown Charts.
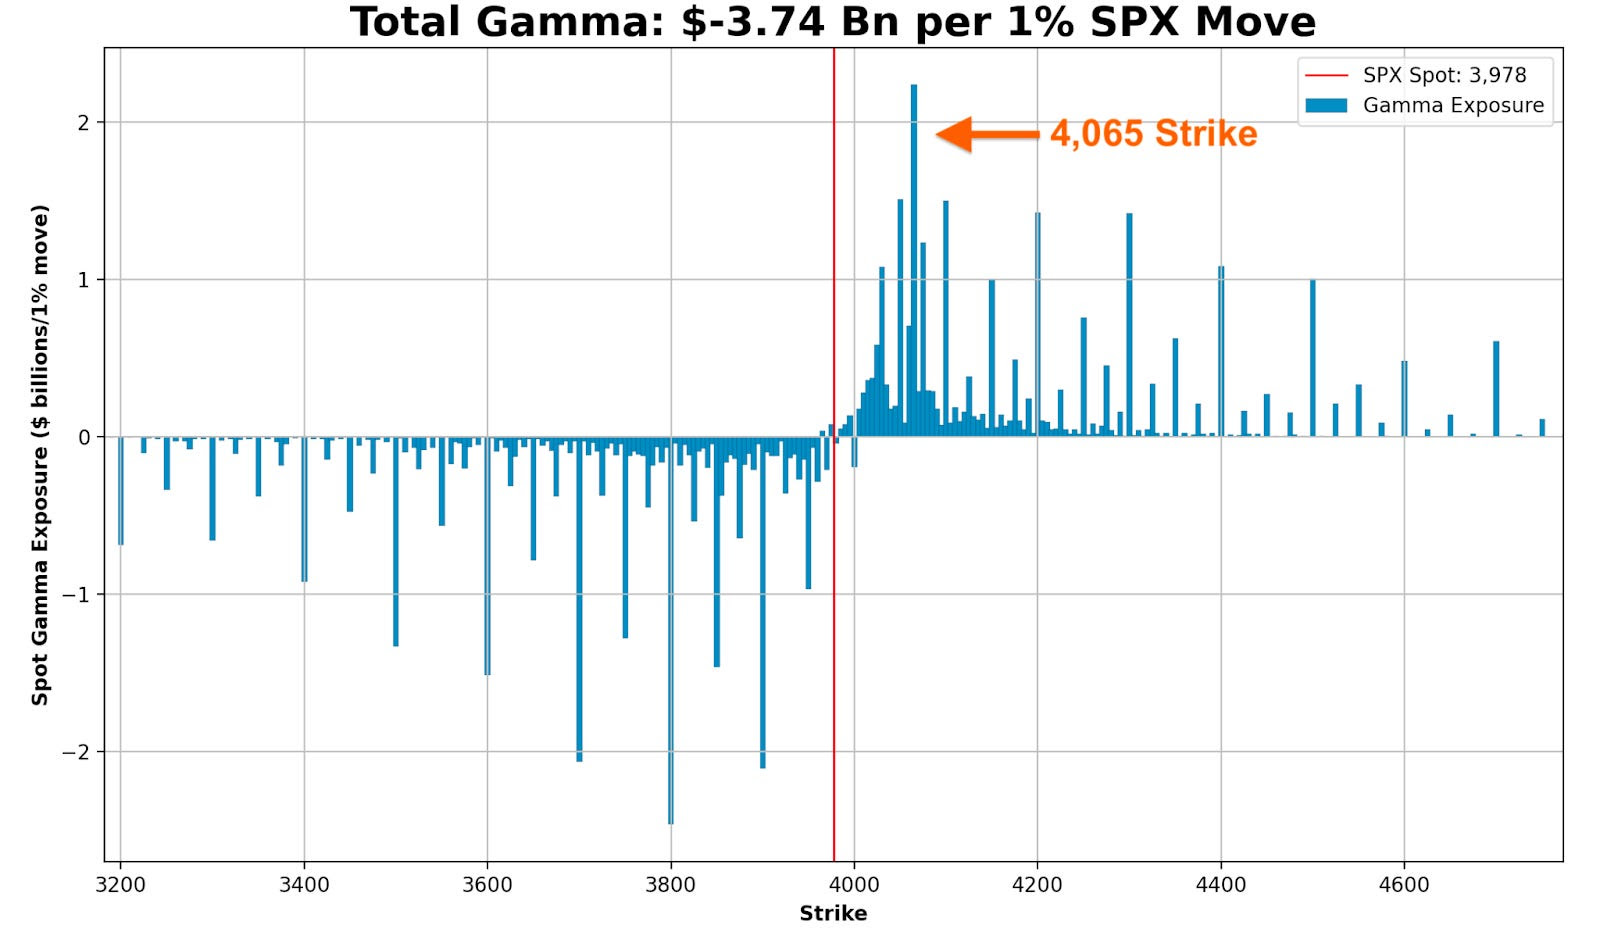
As we near month-end, there is a quarterly derivatives expiry. Above current S&P 500 or SPX levels is a significant concentration of soon-to-roll-off open interest held short by investors. This means the counterparties are dynamically hedging a call they own; they’re selling strength and buying weakness, albeit in a less and less meaningful way, as those options near this expiration and their probability of paying out (i.e., delta or exposure to direction) falls.
Some would allege that volatility compression and time decay would have solicited a more meaningful response from options counterparties at those strike prices above; the absence of downside follow-through had traders supplying previously demanded downside put protection and catalyzing a rally. However, there are not many things for the market to rally on, and so much time has passed that the charm effects (i.e., the impact of time passing on an options delta) have lessened dramatically, some explain.
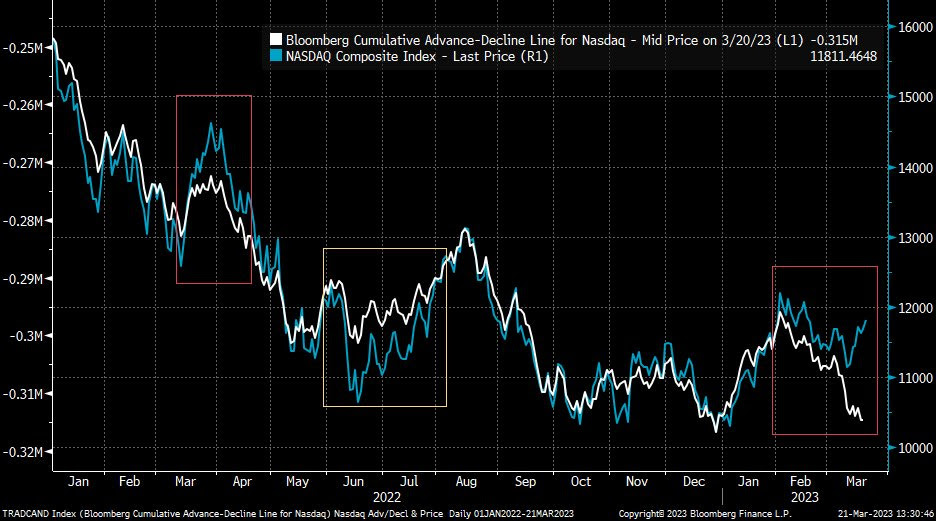
Graphic: Retrieved from Bloomberg via Liz Young. “The Nasdaq’s Cumulative Advance-Decline line has parted ways with index direction in recent days. In other words, the index has rallied despite weak breadth (more stocks falling than rising), the two lines are likely to find their way back together somehow…”
Therefore, it’s probably likely that the market remains contained through month-end. After, movement may increase. This letter acknowledged RVOL might come back in a big way, particularly with the bank intervention doing more to thwart credit creation.
The caveat is that markets can trade spiritedly for far longer. There is a potential for the markets to move into a far “more combustible” position. With call skews far up meaningfully steep, still-present low- and zero-cost call structures this letter has talked about in the past remain attractive.
Graphic: Retrieved from Charles Schwab Corporation-owned (NYSE: SCHW) thinkorswim.
If the market falls apart, your costs are low, and losses are minimal. If markets move higher into that “more combustible” position, wherein “volatility is sticky into a rally,” you may monetize your call structures and roll some of those profits into bear put spreads (i.e., buy put and sell another at a lower strike).
The signs of a “more combustible situation” would likely show when “volatility is sticky into a rally,” explains Kai Volatility’s Cem Karsan. To gauge combustibility, look to the options market.
Remember, calls trade at a lower IVOL than puts. As the market trades higher, it slides to a lower IVOL, reflected by broad IVOL measures. If broad IVOL measures are sticky/bid, “that’s an easy way to say that fixed-strike volatility is coming up and, if that can happen for days, that can unpin volatility and create a situation where dealers themselves are no longer [own] a ton of volatility; they start thinning out on volatility themselves, and that creates a more combustible situation.”
To explain the “thinning out” part of the last paragraph, recall participants often opt to own equity and downside (put) protection financed, in part, with sales of upside (call) protection. More demand for calls will result in counterparties taking on more exposure against movement (i.e., negative gamma) hedged via purchases of the underlying. Once that exposure expires and/or decays, that dealer-based support will be withdrawn. If the assumption is that equity markets are expensive now, then, after another rally, there may be more room to fall, all else equal (a simplistic way to look at this), hence the increased precariousness and combustibility.
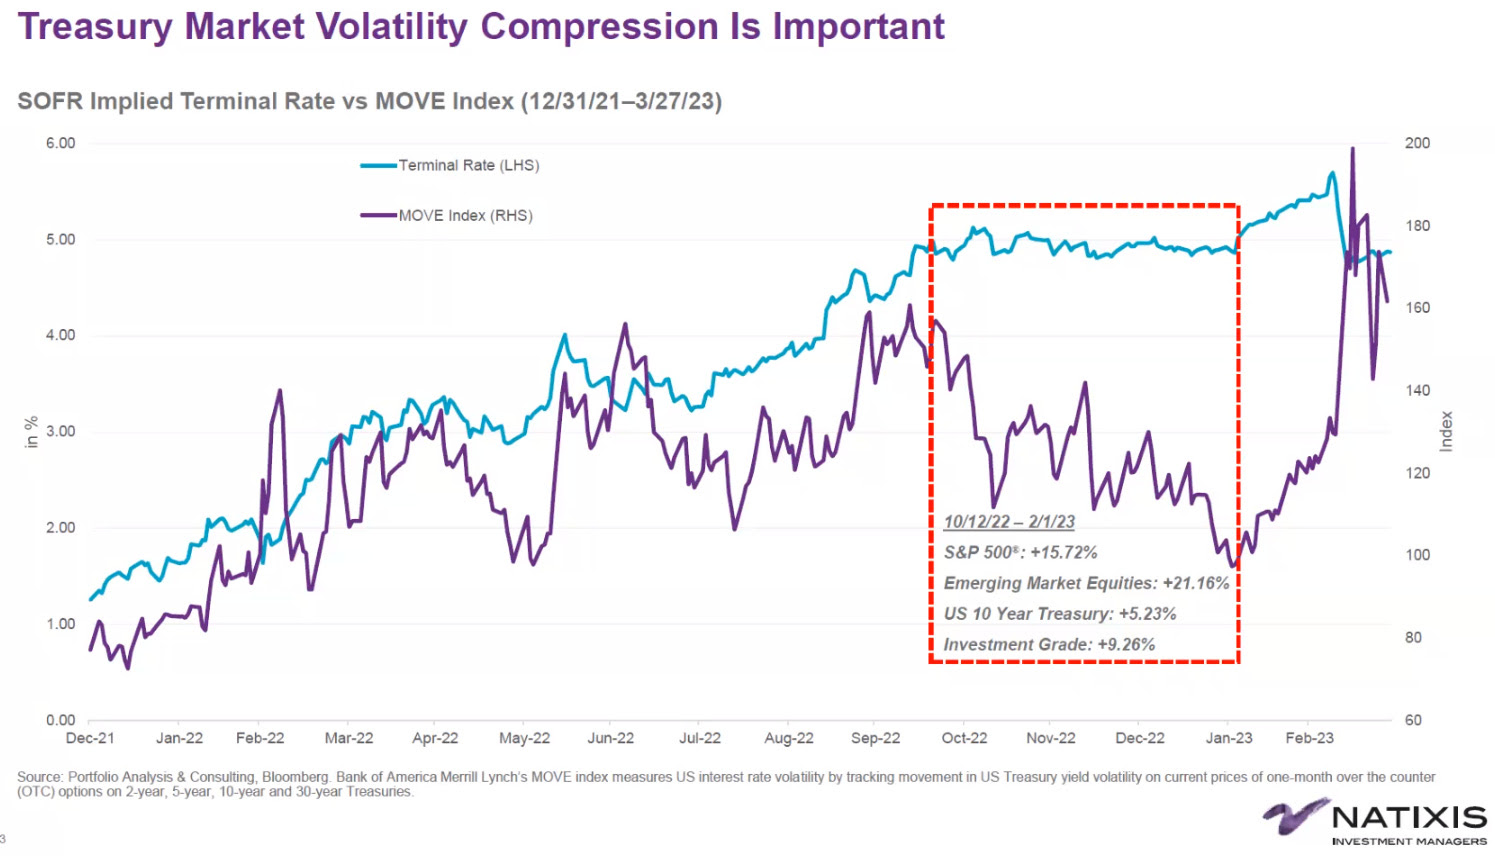
Graphic: Retrieved from Callum Thomas’ Topdown charts.
About
The author, Renato Leonard Capelj, spends the bulk of his time at Physik Invest, an entity through which he invests and publishes free daily analyses to thousands of subscribers. The analyses offer him and his subscribers a way to stay on the right side of the market.
You may view this letter’s content calendar at this link.
Disclaimer
Do not construe this newsletter as advice; all content is for informational purposes. Capelj and Physik Invest are non-professional advisors managing their own capital. They will never openly solicit others for capital or manage others’ capital to collect fees and disbursements.
Physik Invest’s Daily Brief is read free by thousands of subscribers. Join this community to learn about the fundamental and technical drivers of markets.
Graphic updated 6:15 AM ET. Sentiment Risk-Off if expected /MES open is below the prior day’s range. /MES levels are derived from the profile graphic at the bottom of this letter. Click here for the latest levels. SqueezeMetrics Dark Pool Index (DIX) and Gamma (GEX) with the latter calculated based on where the prior day’s reading falls with respect to the MAX and MIN of all occurrences available. A higher DIX is bullish. The lower the GEX, the more (expected) volatility. Click to learn the implications of volatility, direction, and moneyness. Breadth reflects a reading of the prior day’s NYSE Advance/Decline indicator. The CBOE VIX Volatility Index (INDEX: VVIX) reflects the attractiveness of owning volatility. UMBS prices via MND. Click here for the economic calendar.
Administrative
As indicated yesterday, through the end-of-this week, newsletters may be shorter due to the letter writer’s commitments. Therefore, please read the Daily Brief for March 14, if you haven’t already, for a big discussion on bond and equity market volatility, as well as the odds of the market falling apart or rising, and positioning contexts that support that movement. If there are any incomplete statements below, we shall complete them in the coming letters. We’re laying it all out for awareness. Take care!
Fundamental
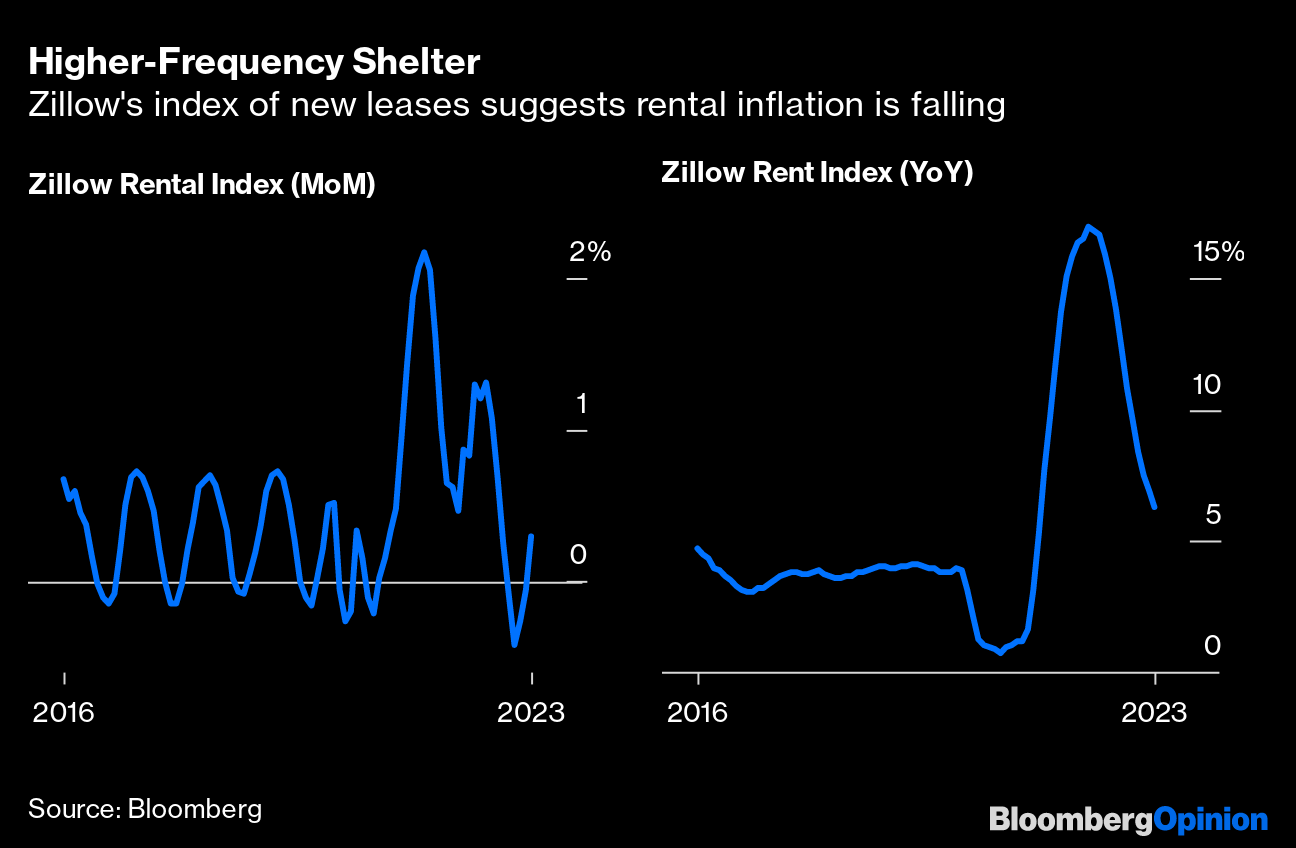
Headline inflation via CPI (Consumer Price Index) fell most on energy and core goods while shelter, food, and services inflation continues to be sticky. Core prices continue to be high, risking “inflationary psychology [] becoming ingrained,” Bloomberg’s John Authers explains.
“There’s nothing in this report to suggest that inflation is defeated already,” explained Authers. “Not to raise the fed funds rate next week, with median inflation above 7%, would be a sign of panic,” and an acknowledgment of uncertainties with regard to the banking system, as talked about in the Daily Brief on March 14.
To note, however, contagion appears contained, despite Moody’s Corporation (NYSE: MCO) cutting its outlook for the banking system to negative from stable, and placing lenders including First Republic Bank (NYSE: FRC) on a downgrade review.
JPMorgan Chase & Co’s (NYSE: JPM) Marko Kolanovic did cut his equity allocation warning that not all carry trades, something this letter has talked about numerous times before (i.e., borrow at a low rate and invest in something that provides higher return), can be bailed out. Kolanovic appears worried about commercial real estate, which Simplify Asset Management’s Michael Green just told your letter writer is in a bubble that “we’re seeing crack,” finally.
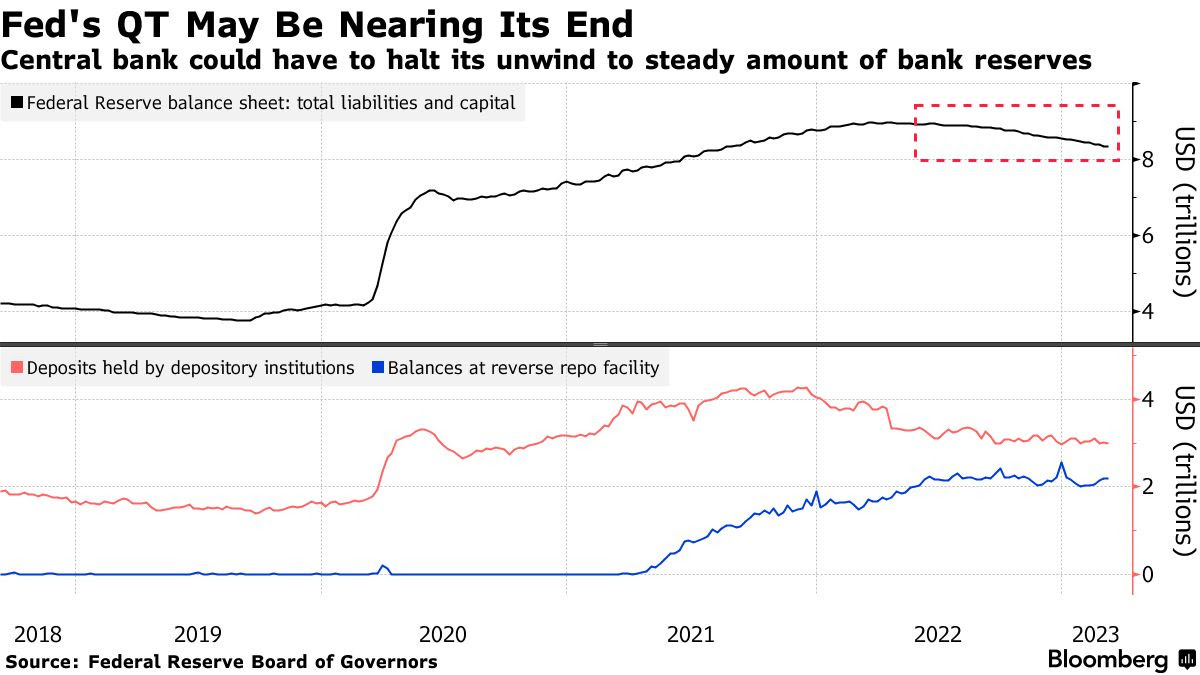
Graphic: Retrieved from Bloomberg. The Federal Reserve’s new Bank Term Funding Program or BTFP is “QE in another name – assets will grow on the Fed balance sheet which will increase reserves.” Recall that QE is the flow of capital into capital markets while QT is the opposite. Q is for quantitative while E is for easing and T is for tightening.
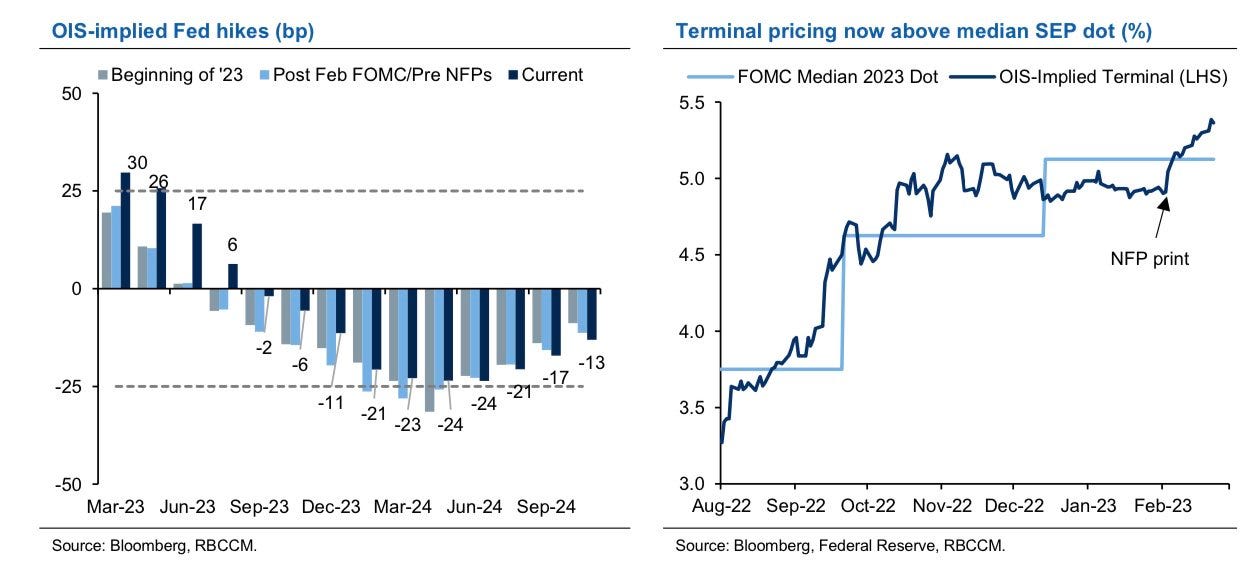
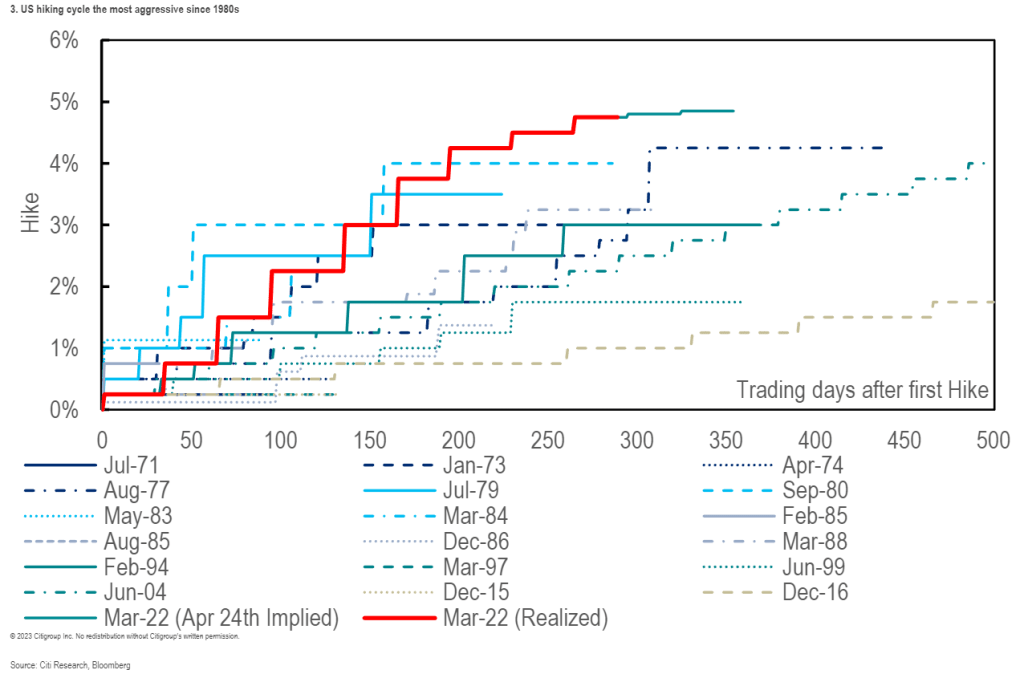
Anyways, following yesterday’s CPI, traders price higher odds of a 25 basis point hike which puts the terminal or peak fed funds rate at 4.75-5.00%. Following this spring, factoring potential inflation plateau and financial system uncertainties, traders foresee the Fed easing. By year-end, traders expect rates to fall down to 3.75-4.00%. Recall that at the beginning of last week, there were no expectations of easing in 2023. Also, traders thought the Fed would raise as high as 5.50-5.75%.
Mortgage rates, determined by changes in the price of mortgage-backed securities or MBSs, fell too.
ARK Invest’s Cathie Wood, who your letter writer had the honor of interviewing in person for Benzinga articles, thinks we’re on the cusp of the “roaring twenties” as inflation “is likely to surprise on the low side of expectations” with the banking crisis also leading to “bad deflation.”
“Today, five major innovation platforms are evolving at the same time – multiomics sequencing, robotics, energy storage, artificial intelligence, and blockchain technology, all of which are converging,” she elaborates.
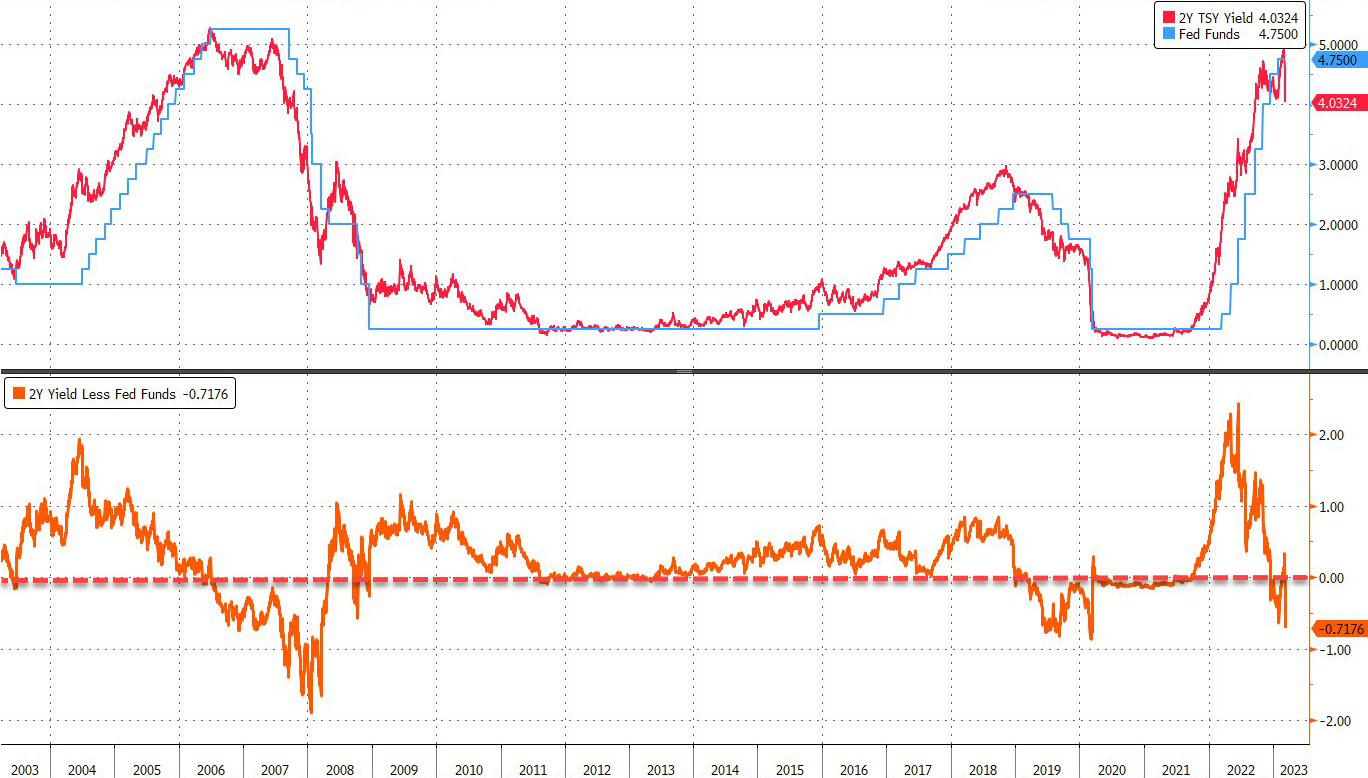
“Once the Fed stops looking backward at CPI inflation and starts addressing the deflationary banking crisis that a 19-fold increase in short rates and an inverted yield have caused, we would not be surprised to see a return to the Roaring Twenties.”
Graphic: Retrieved from Bloomberg.
On the backward-looking measures quote in the above paragraph, former Fed trader Joseph Wang notes that the Fed and central banks, in general, are aware segments of the market may break, but that won’t discourage them from tightening further.
“As the BOE saved the gilt market through purchases and kept tightening, so the Fed can save banks and keep tightening.”
Positioning
Tuesday’s letter said that following important events like CPI, the compression of wound implied volatility or IVOL, coupled with the nearing large options expirations (OpEx), sets the market up for potential short bursts of strength into the end of the month and next month.
That’s along the lines of what is happening. The S&P 500 rose mechanically after the release of CPI yesterday. Later, though the index succumbed, internally speaking the market remained strong through end-of-day, hence some short bursts boosted by some short-dated options activities, also.
As explained, yesterday, the recent re-grossing theme appears intact. Any further compression of wound IVOL and the passage of options expirations (OpEx) could support equities as month-end approaches. Though it may be too early to position for strength, one may consider it the way it was explained in the Daily Brief on March 14.
Technical
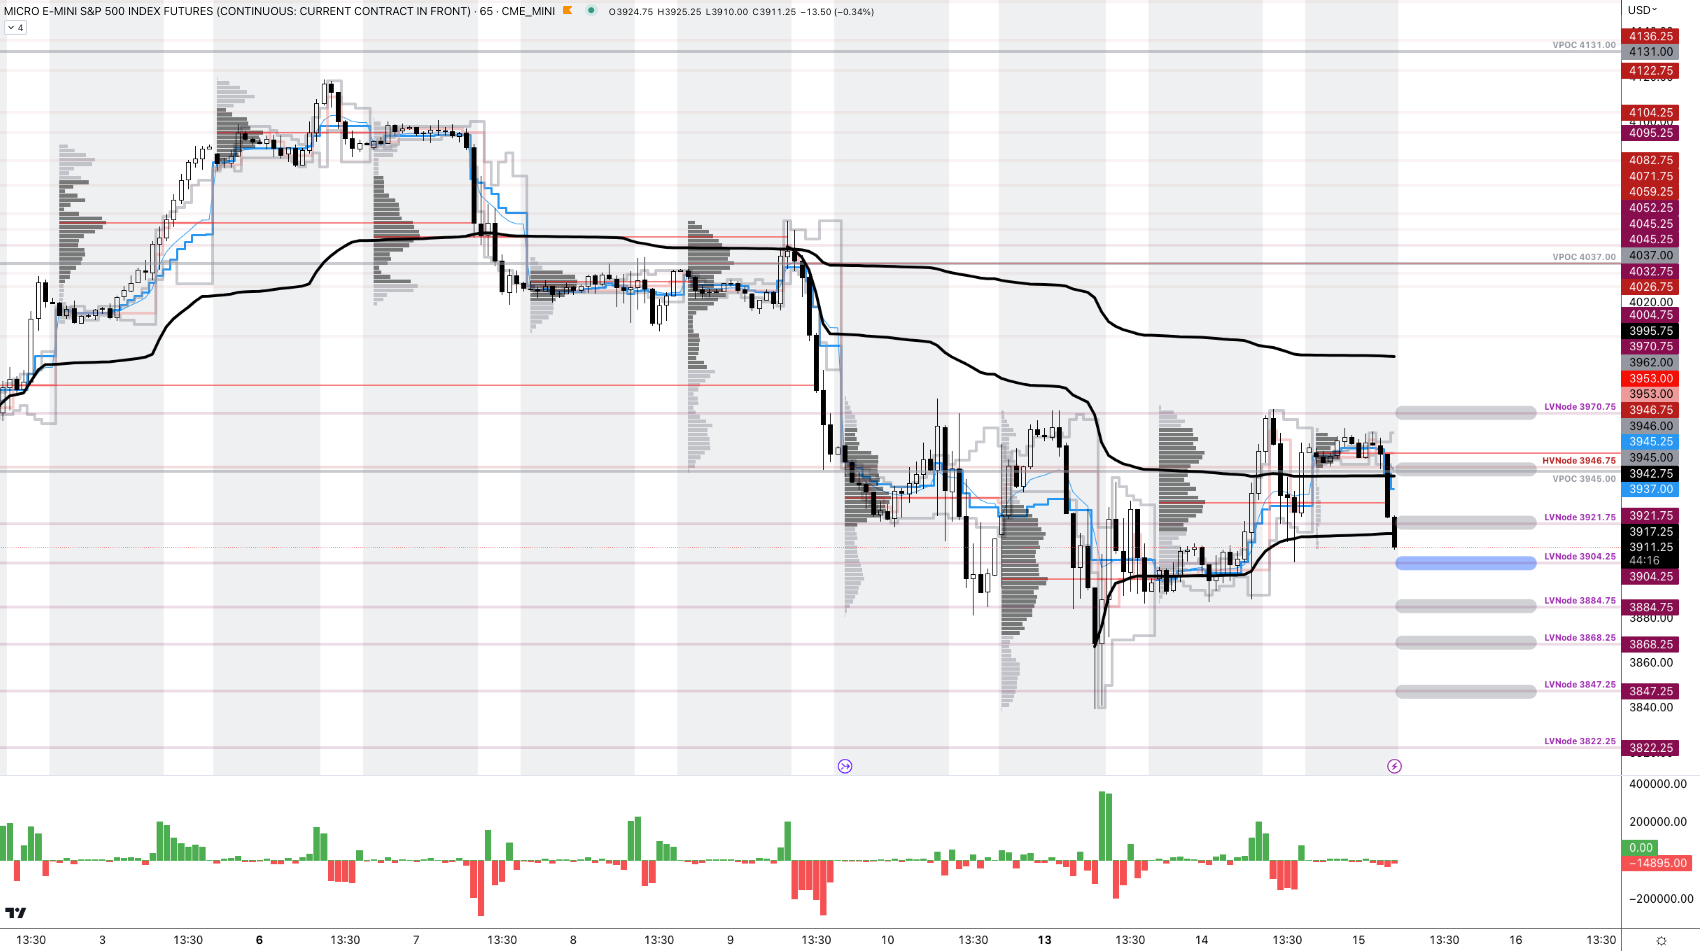
As of 6:15 AM ET, Wednesday’s regular session (9:30 AM – 4:00 PM ET), in the S&P 500, is likely to open in the middle part of a negatively skewed overnight inventory, inside of the prior day’s range, suggesting a limited potential for immediate directional opportunity.
The S&P 500 pivot for today is $3,904.25.
Key levels to the upside include $3,921.75, $3,945.00, and $3,970.75.
Key levels to the downside include $3,884.75, $3,868.25, and $3,847.25.
Disclaimer: Click here to load the updated key levels via the web-based TradingView platform. New links are produced daily. Quoted levels likely hold barring an exogenous development.
Graphic: 65-minute profile chart of the Micro E-mini S&P 500 Futures.
Definitions
Volume Areas: Markets will build on areas of high-volume (HVNodes). Should the market trend for a period of time, this will be identified by a low-volume area (LVNodes). The LVNodes denote directional conviction and ought to offer support on any test.
If participants auction and find acceptance in an area of a prior LVNode, then future discovery ought to be volatile and quick as participants look to the nearest HVNodes for more favorable entry or exit.
POCs: Areas where two-sided trade was most prevalent in a prior day session. Participants will respond to future tests of value as they offer favorable entry and exit.
Volume-Weighted Average Prices (VWAPs): A metric highly regarded by chief investment officers, among other participants, for quality of trade. Additionally, liquidity algorithms are benchmarked and programmed to buy and sell around VWAPs.
About
The author, Renato Leonard Capelj, spends the bulk of his time at Physik Invest, an entity through which he invests and publishes free daily analyses to thousands of subscribers. The analyses offer him and his subscribers a way to stay on the right side of the market.
You may view this letter’s content calendar at this link.
Disclaimer
Do not construe this newsletter as advice. All content is for informational purposes. Capelj and Physik Invest manage their own capital and will not solicit others for it.
Physik Invest’s Daily Brief is read free by thousands of subscribers. Join this community to learn about the fundamental and technical drivers of markets.
Graphic updated 5:40 AM ET. Sentiment Neutral if expected /MES open is inside of the prior day’s range. /MES levels are derived from the profile graphic at the bottom of this letter. Click here for the latest levels. SqueezeMetrics Dark Pool Index (DIX) and Gamma (GEX) with the latter calculated based on where the prior day’s reading falls with respect to the MAX and MIN of all occurrences available. A higher DIX is bullish. The lower the GEX, the more (expected) volatility. Click to learn the implications of volatility, direction, and moneyness. Breadth reflects a reading of the prior day’s NYSE Advance/Decline indicator. The CBOE VIX Volatility Index (INDEX: VVIX) reflects the attractiveness of owning volatility. UMBS prices via MND. Click here for the economic calendar.
Administrative
Morning, team. Still working on a bigger write-up for later this week. Here are some key things to know. Have a good day!
Positioning
After a boost bolstered by systematic-type investors acting on changes in trend and volatility, the market is at a pivot of sorts.
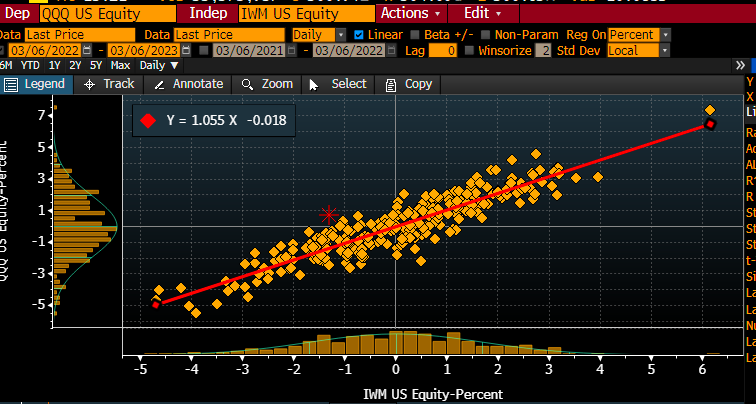
Graphic: Retrieved from Danny Kirsch of Piper Sandler Companies (NYSE: PIPR). The move in [Nasdaq 100] relative to [the Russell 2000], [S&P 500 versus Russell 2000] looks similar. Ties into re-grossing theme, adding longs (QQQ+SPY) and shorts (IWM). Also fits with recent bid for credit.”
After a test of key areas of confluence, measures of the market’s strength weakened heading into the late-day equity weakness, Monday.
Graphic: Key market internals retrieved from TradingView.
Further, lots of the bullishness of the trend change and falling volatility was spent. The market is in a precarious state heading into Jerome Powell’s testimony, today.
Following Powell’s testimony, ranges likely expand.
On one hand, FOMO-type demand for call options exposures, coupled with CTAs further “raising their equity exposure” on trend signals and lower volatility, may boost markets into a “more combustible” state the Daily Brief for February 17 explained.
Graphic: Retrieved from Deutsche Bank AG (NYSE: DB) via Bloomberg.
On the other hand, in the context of liquidity coming off of the table and the increased competition between equities and fixed income, should Powell disappoint, expansion of implied volatility (IVOL) on demands for protection, alone, could “draw markets lower” into the March 17 options expiration (OpEx), options data and insight provider SpotGamma says. For more on how to trade this precariousness and reduce portfolio downside, see the Daily Brief for March 3.
Technical
As of 5:30 AM ET, Tuesday’s regular session (9:30 AM – 4:00 PM ET), in the S&P 500, is likely to open in the upper part of a positively skewed overnight inventory, inside of the prior day’s range, suggesting a limited potential for immediate directional opportunity.
The S&P 500 pivot for today is $4,059.25.
Key levels to the upside include $4,071.25, $4,082.75, and $4,095.25.
Key levels to the downside include $4,045.25, $4,032.75, and $4,019.00.
Disclaimer: Click here to load the updated key levels via the web-based TradingView platform. New links are produced daily. Quoted levels likely hold barring an exogenous development.
Graphic: 65-minute profile chart of the Micro E-mini S&P 500 Futures.
Definitions
Volume Areas: Markets will build on areas of high-volume (HVNodes). Should the market trend for a period of time, this will be identified by a low-volume area (LVNodes). The LVNodes denote directional conviction and ought to offer support on any test.
If participants auction and find acceptance in an area of a prior LVNode, then future discovery ought to be volatile and quick as participants look to the nearest HVNodes for more favorable entry or exit.
POCs: Areas where two-sided trade was most prevalent in a prior day session. Participants will respond to future tests of value as they offer favorable entry and exit.
Volume-Weighted Average Prices (VWAPs): A metric highly regarded by chief investment officers, among other participants, for quality of trade. Additionally, liquidity algorithms are benchmarked and programmed to buy and sell around VWAPs.
About
The author, Renato Leonard Capelj, spends the bulk of his time at Physik Invest, an entity through which he invests and publishes free daily analyses to thousands of subscribers. The analyses offer him and his subscribers a way to stay on the right side of the market.
You may view this letter’s content calendar at this link.
Disclaimer
Do not construe this newsletter as advice. All content is for informational purposes. Capelj and Physik Invest manage their own capital and will not solicit others for it.
Physik Invest’s Daily Brief is read free by thousands of subscribers. Join this community to learn about the fundamental and technical drivers of markets.
Graphic updated 7:00 AM ET. Sentiment Risk-On if expected /MES open is above the prior day’s range. /MES levels are derived from the profile graphic at the bottom of this letter. Click here for the latest levels. SqueezeMetrics Dark Pool Index (DIX) and Gamma (GEX) with the latter calculated based on where the prior day’s reading falls with respect to the MAX and MIN of all occurrences available. A higher DIX is bullish. The lower the GEX, the more (expected) volatility. Click to learn the implications of volatility, direction, and moneyness. Breadth reflects a reading of the prior day’s NYSE Advance/Decline indicator. The CBOE VIX Volatility Index (INDEX: VVIX) reflects the attractiveness of owning volatility. UMBS prices via MND. Click here for the economic calendar.
Administrative
Lots of content today but a bit rushed at the desk. If anything is unclear, we will clarify it in the coming sessions. Have a great weekend! – Renato
Fundamental
Physik Invest’s Daily Brief for March 2 talked about balancing the implications of still-hot inflation and an economy on solid footing. Basically, the probability the economy is in a recession is lower than it was at the end of ‘22. For the probabilities to change markedly, there would have to be a big increase in unemployment, for one.
According to a blog by Unlimited’s Bruce McNevin, if the unemployment rate rises by about 1%, recession odds go up by 29%. If the non-farm payroll employment falls by about 2% or 3 million jobs, recession odds increase by about 74%. After a year or so of tightening, unemployment measures are finally beginning to pick up.
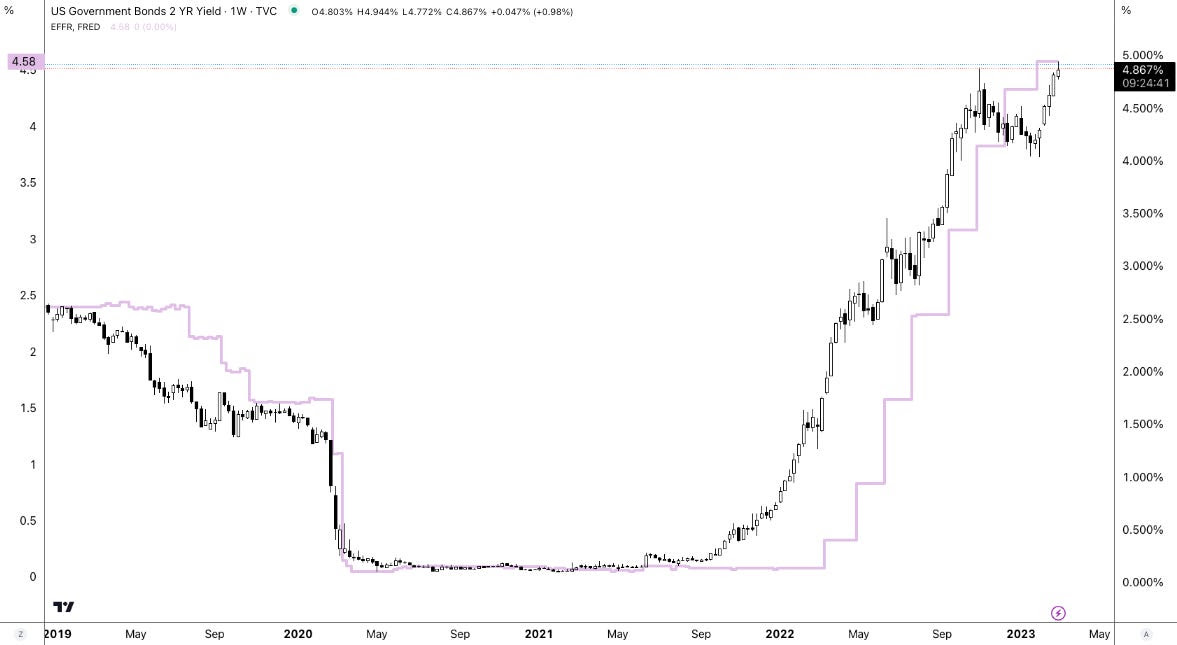
Policymakers, per recent remarks, maintain that more needs to be done, however. For instance, the Federal Reserve’s (Fed) Raphael Bostic, who generally carries an easier stance on monetary policy, mulled whether the Fed should raise interest rates beyond the 5.00-5.25% terminal rate consensus he previously endorsed. This commentary, coupled with newly released economic data, has sent yields surging at the front end.
Graphic: Retrieved from TradingView.
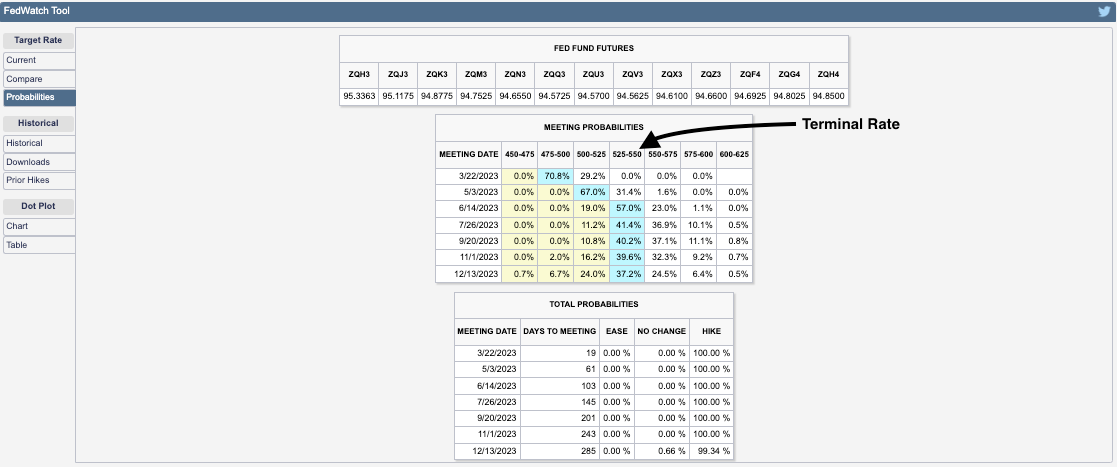
Traders are wildly repricing their terminal rate expectations this week. The terminal rate over the past few days has gone up from 5.25-5.50% to 5.50-5.75%, and back down to 5.25-5.50%.
Graphic: Retrieved from CME Group Inc (NASDAQ: CME).
Positioning
Stocks and bonds performed poorly. Commodity hedges are uninspiring also in that they do not hedge against (rising odds of) recession, per the Daily Brief for March 1.
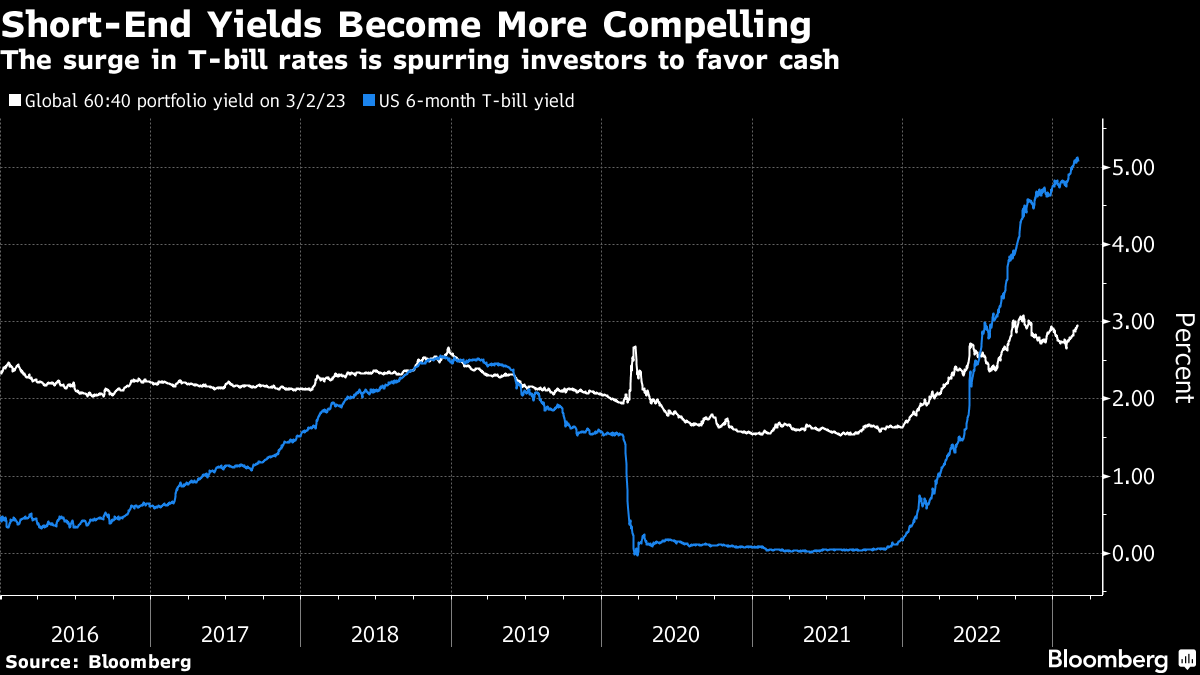
In navigating this precarious environment, this letter has put forward a few trade ideas including the sale of call options structures to finance put options structures, after the mid-February monthly options expiration (OpEx). Though measures suggest “we can [still] get cheap exposure to convexity while a lot of people are worried,” the location for similar (short call, long put) trades is not optimal. Rather, trades including building your own structured note, now catching the attention of some traders online, appear attractive now with T-bill rates surging.
Such trades reduce portfolio volatility and downside while providing upside exposure comparable to poorly performing traditional portfolio constructions like 60/40.
As an example, per IPS Strategic Capital’s Pat Hennessy, with $1,000,000 to invest and rates at ~5% (i.e., $50,000 is 5% of $1,000,000), one could buy 1000 USTs or S&P 500 (INDEX: SPX) Box Spreads which will have a value of $1 million at maturity for the price of $950,000.
With $50,000 left in cash, one can use options for leveraged exposure to an asset of their choosing, Hennessy explained. Should these options expire worthless, the $50,000 gain from USTs, at maturity, provides “a full return of principal.”
For traders who are focused on short(er)-term movements, one could allocate the cash remaining toward structures that buy and sell call options over very short time horizons (e.g., 0 DTE).
Knowing that the absence of range expansion to the downside, positioning flows may build a platform for the market to rally, one could lean into structures like fixed-width call option butterflies.
For instance, yesterday, Nasdaq 100 (INDEX: NDX) call option butterflies expanded in value ~10 times (i.e., $5 → $50). An example 0 DTE trade is the BUTTERFLY NDX 100 (Weeklys) 2 MAR 23 12000/12100/12200 CALL. Such trade could have been bought near ~$5.00 in debit and, later, sold for much bigger credits (e.g., ~$40.00).
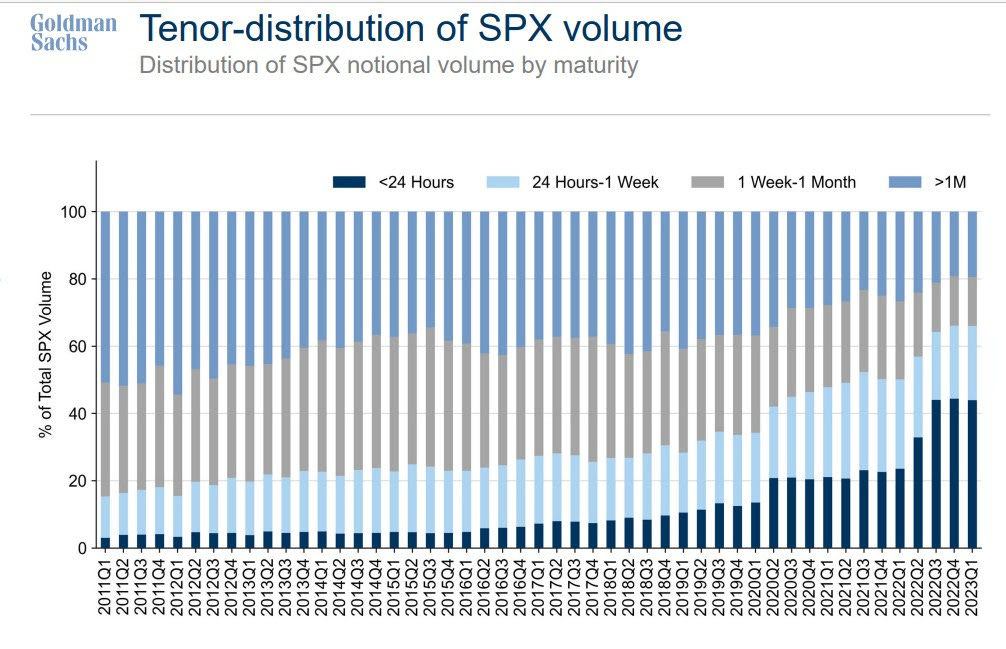
Such trade fits and plays on the narrative described in Physik Invest’s Daily Brief for February 24. That particular letter detailed Bank of America Corporation’s (NYSE: BAC) finding that “volume is uniquely skewed towards the ask early in the day but towards the bid later in the day” for these highly traded ultra-short-dated options.
Graphic: Retrieved from Goldman Sachs Group Inc (NYSE: GS) via Bloomberg.
Even options insight and data provider SqueezeMetrics agrees: “Buy 0 DTE call.” The typical “day doesn’t end above straddle b/e, but call makes money,” SqueezeMetrics explained. “Dealer and call-buyer both profit. Gap down, repeat.”
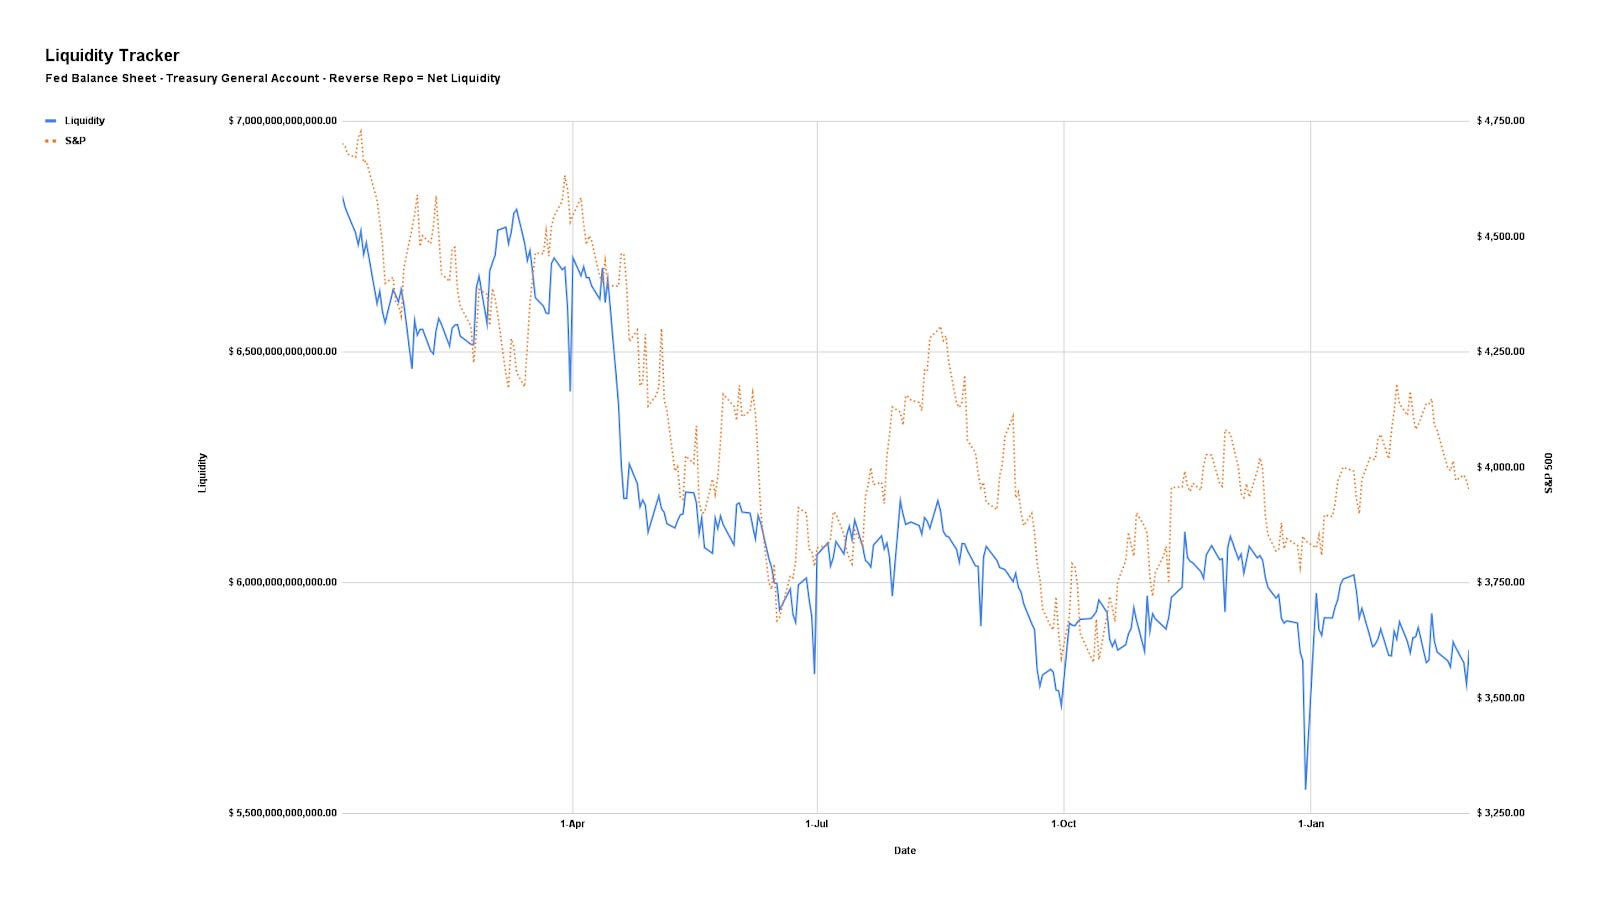
Anyways, back to the bigger trends impacted by liquidity coming off the table and increased competition between equities and fixed income.
Graphic: Via Physik Invest. Net Liquidity = Fed Balance Sheet – Treasury General Account – Reverse Repo.
As this letter put forth in the past, if the “market consolidates and doesn’t break,” as we see, the delta buy-back with respect to dropping implied volatility (IVOL) or vanna and buy-back with respect to the passage of time or charm could build a platform for a FOMO-driven call buying rally that ends in a blow-off.
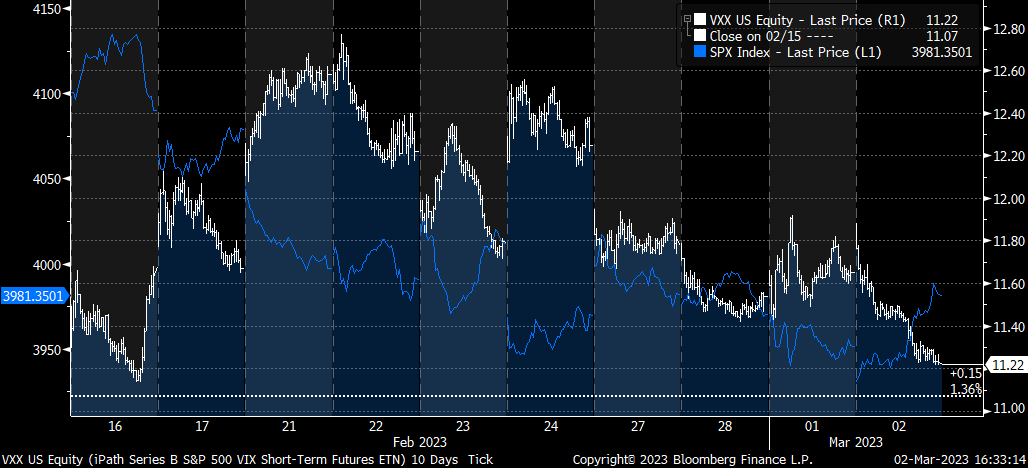
Graphic: Retrieved from Piper Sandler’s (NYSE: PIPR) Danny Kirsch. Short volatility and short stocks was attractive to trade. As your letter writer put in a recent SpotGamma note: “With IV at already low levels, the bullish impact of it falling further is weak, hence the SPX trending lower all the while IV measures (e.g., VIX term structure) have shifted markedly lower since last week. If IV was at a higher starting point, its falling would work to keep the market in a far more positive/bullish stance.”
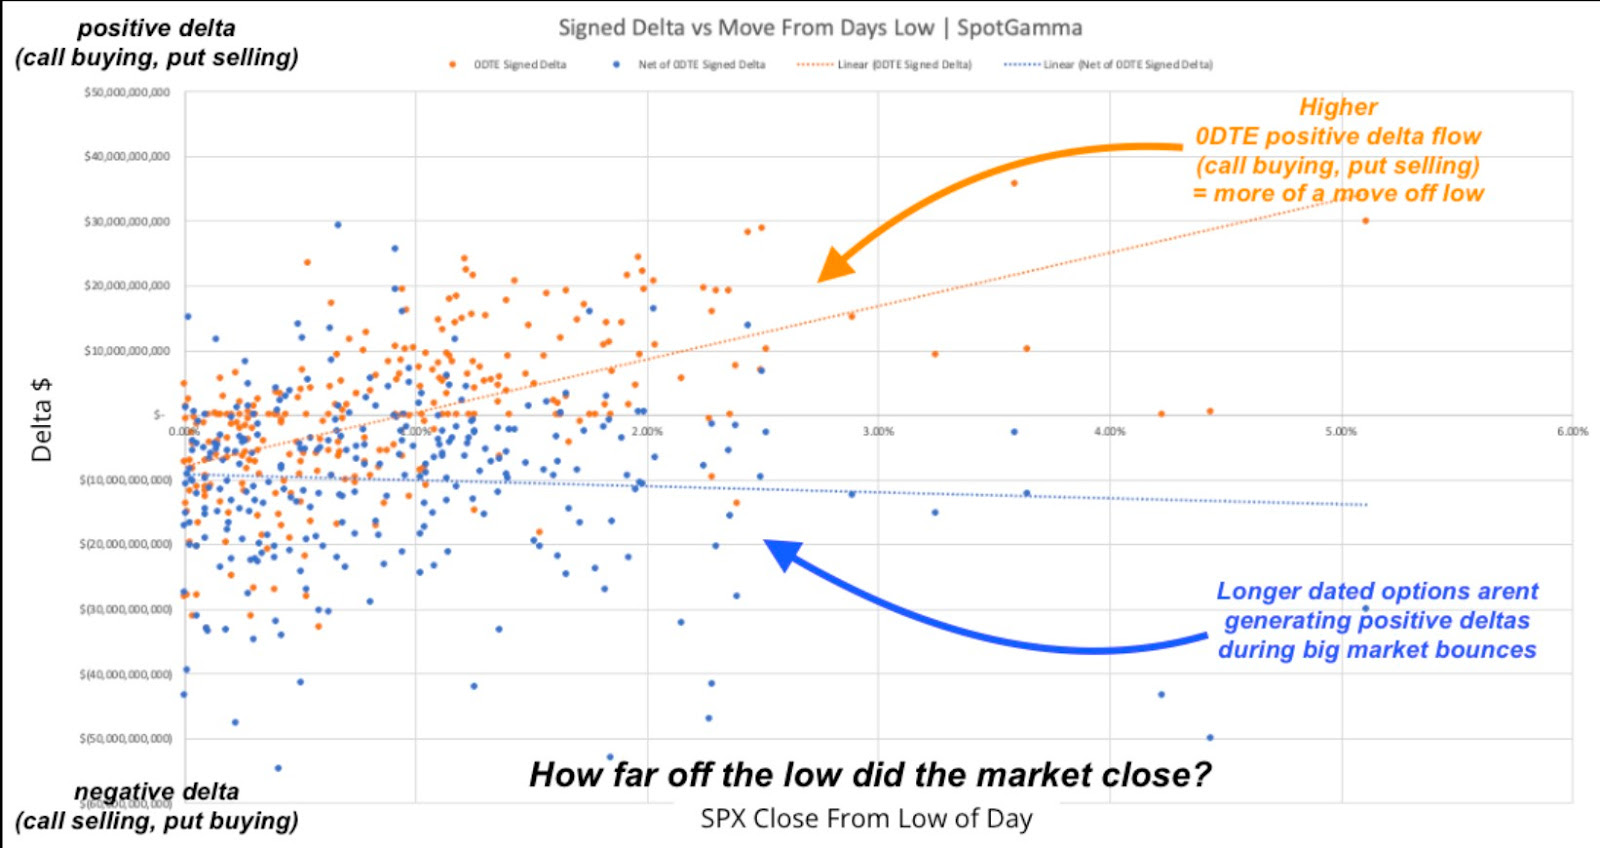
Per data by SpotGamma, another options insight and data provider your letter writer used to write for and highly recommends checking out, call buying, particularly over short time horizons, was often tied to market rallies.
“0DTE does not seem to be associated with betting on a large downside movement. Large downside market volatility appears to be driven by larger, longer-dated S&P volume,” SpotGamma founder Brent Kochuba said in the Bloomberg article. “Where 0DTE is currently most impactful is where it seems 0DTE calls are being used to ‘buy the dips’ after large declines. In a way this suppresses volatility.”
Anyways, the signs of a “more combustible situation” would likely show when “volatility is sticky into a rally,” explained Kai Volatiity’s Cem Karsan. To gauge combustibility, look to the Daily Brief for February 17.
Technical
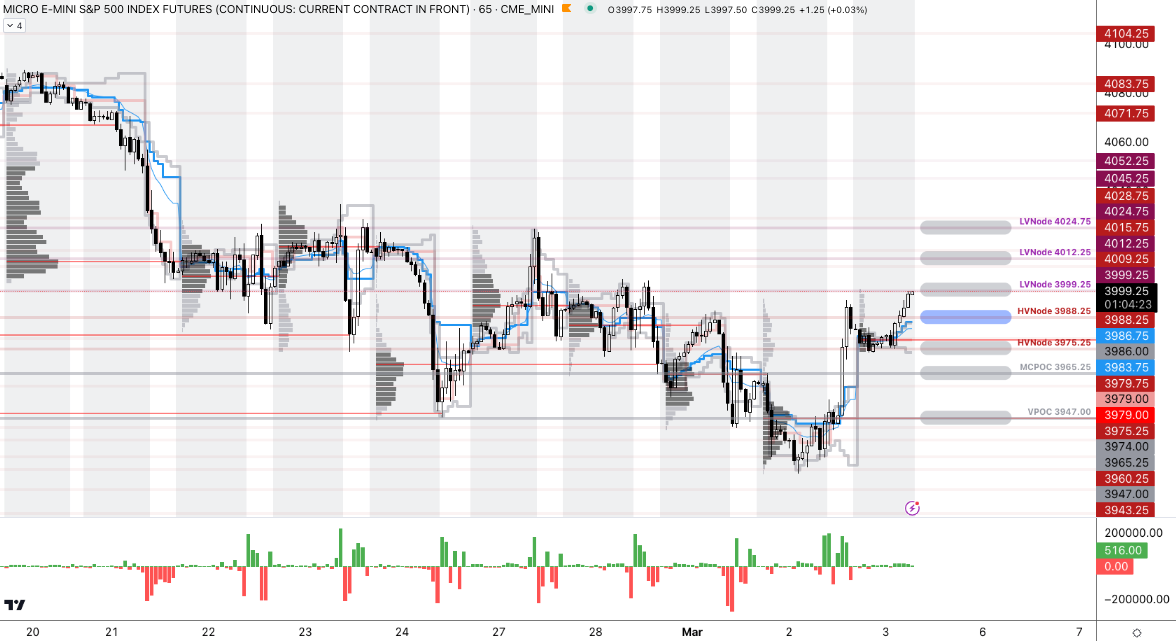
As of 6:50 AM ET, Friday’s regular session (9:30 AM – 4:00 PM ET), in the S&P 500, is likely to open in the upper part of a positively skewed overnight inventory, outside of the prior day’s range, suggesting a potential for immediate directional opportunity.
The S&P 500 pivot for today is $3,988.25.
Key levels to the upside include $3,999.25, $4,012.25, and $4,024.75.
Key levels to the downside include $3,975.25, $3,965.25, and $3,947.00.
Disclaimer: Click here to load the updated key levels via the web-based TradingView platform. New links are produced daily. Quoted levels likely hold barring an exogenous development.
Graphic: 65-minute profile chart of the Micro E-mini S&P 500 Futures.
Definitions
Volume Areas: Markets will build on areas of high-volume (HVNodes). Should the market trend for a period of time, this will be identified by a low-volume area (LVNodes). The LVNodes denote directional conviction and ought to offer support on any test.
If participants auction and find acceptance in an area of a prior LVNode, then future discovery ought to be volatile and quick as participants look to the nearest HVNodes for more favorable entry or exit.
Vanna: The rate at which the Delta of an option changes with respect to implied volatility.
Charm: The rate at which the Delta of an option changes with respect to time.
POCs: Areas where two-sided trade was most prevalent in a prior day session. Participants will respond to future tests of value as they offer favorable entry and exit.
MCPOCs: Denote areas where two-sided trade was most prevalent over numerous sessions. Participants will respond to future tests of value as they offer favorable entry and exit.
Options Expiration (OPEX): Reduction in dealer Gamma exposure. Often, there is an increase in volatility after the removal of large options positions and associated hedging.
Options: Options offer an efficient way to gain directional exposure.
If an option buyer was short (long) stock, he or she could buy a call (put) to hedge upside (downside) exposure. Additionally, one can spread, or buy (+) and sell (-) options together, strategically.
Commonly discussed spreads include credit, debit, ratio, back, and calendar.
Credit: Sell -1 option closer to the money. Buy +1 option farther out of the money.
Debit: Buy +1 option closer to the money. Sell -1 option farther out of the money.
Ratio: Buy +1 option closer to the money. Sell -2 options farther out of the money.
Back: Sell -1 option closer to the money. Buy +2 options farther out of the money.
Calendar: Sell -1 option. Buy +1 option farther out in time, at the same strike.
Typically, if bullish (bearish), sell at-the-money put (call) credit spread and/or buy a call (put) debit/ratio spread structured around the target price. Alternatively, if the expected directional move is great (small), opt for a back spread (calendar spread). Also, if credit spread, capture 50-75% of the premium collected. If debit spread, capture 2-300% of the premium paid.
Be cognizant of risk exposure to the direction (Delta), movement (Gamma), time (Theta), and volatility (Vega).
Negative (positive) Delta = synthetic short (long).
Negative (positive) Gamma = movement hurts (helps).
Negative (positive) Theta = time decay hurts (helps).
The author, Renato Leonard Capelj, spends the bulk of his time at Physik Invest, an entity through which he invests and publishes free daily analyses to thousands of subscribers. The analyses offer him and his subscribers a way to stay on the right side of the market.
You may view this letter’s content calendar at this link.
Disclaimer
Do not construe this newsletter as advice. All content is for informational purposes. Capelj and Physik Invest manage their own capital and will not solicit others for it.
Physik Invest’s Daily Brief is read free by thousands of subscribers. Join this community to learn about the fundamental and technical drivers of markets.
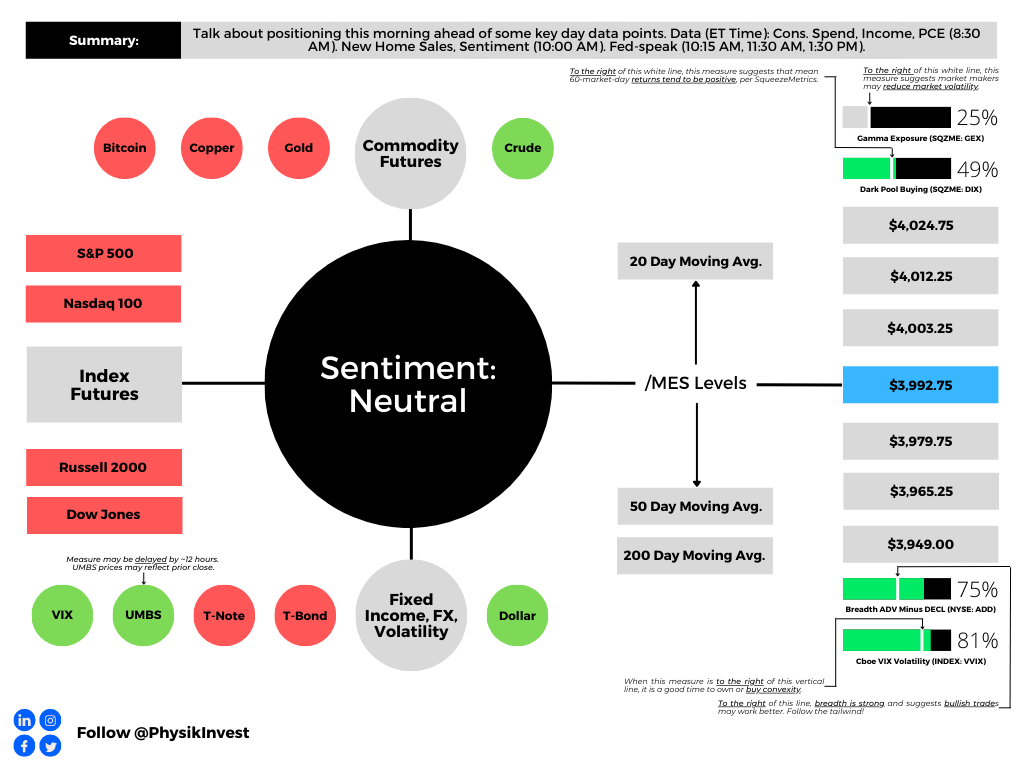
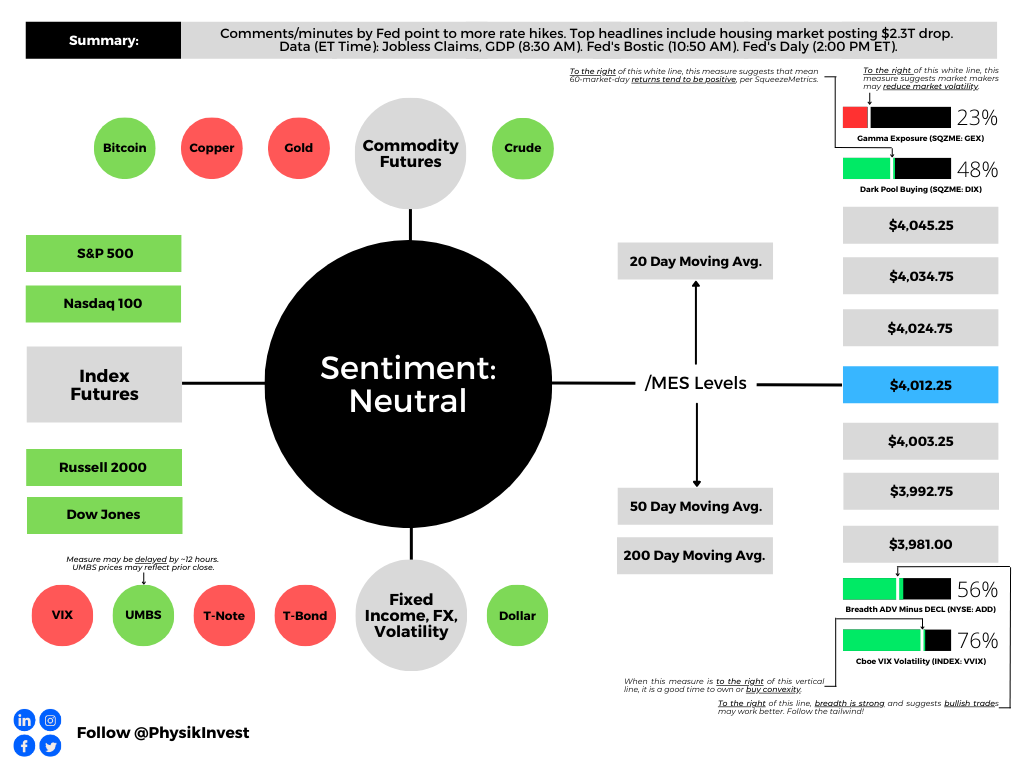
Graphic updated 8:25 AM ET. Sentiment Neutral if expected /MES open is inside of the prior day’s range. /MES levels are derived from the profile graphic at the bottom of this letter. Click here for the latest levels. SqueezeMetrics Dark Pool Index (DIX) and Gamma (GEX) with the latter calculated based on where the prior day’s reading falls with respect to the MAX and MIN of all occurrences available. A higher DIX is bullish. The lower the GEX, the more (expected) volatility. Click to learn the implications of volatility, direction, and moneyness. Breadth reflects a reading of the prior day’s NYSE Advance/Decline indicator. The CBOE VIX Volatility Index (INDEX: VVIX) reflects the attractiveness of owning volatility. UMBS prices via MND. Click here for the economic calendar.
Positioning
Traders continue to balance the risks of owning risk assets versus less-risky bonds, for instance. In what can be construed as a fear-of-missing-out (FOMO), some have sought upside equity exposure in a way that limits downside: call options.
Consequently, implied volatility (IVOL) on the call side, particularly in options with less time to expiration, continues to be elevated by upwards of 10.00% or more.
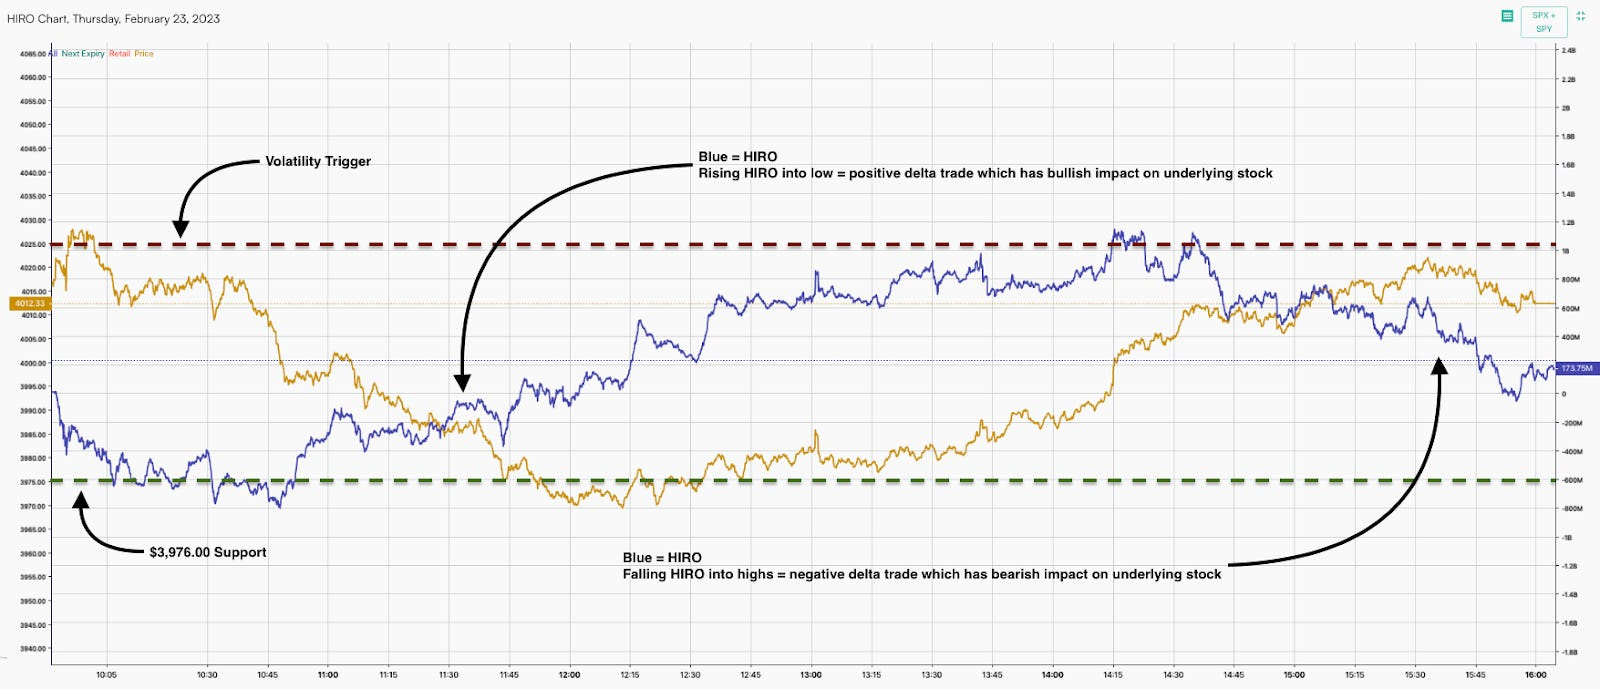
Further, this week’s trading has been dominated by the expected post-options expiry (OpEx) weakness, as well as short-term catalysts and trading. Take yesterday, for example, the market opened higher signaling a potential trend change on upbeat earnings reports, as I detailed in a SpotGamma note. Under the hood, however, there was little optimism. The S&P 500 (INDEX: SPX) succumbed to this weakness before reversing at a key support SpotGamma’s modeling established and rising toward a key resistance into session-end. Noteworthy was the options activity heading into the decline. We observe this activity with tools including SpotGamma’s HIRO indicator measuring the real-time hedging impact of traders’ options activities.
As the SPX traded lower, ultra-short-dated call buyers and put sellers synthetically bought the market. The hedging of this ultra-sensitive exposure portended a turn at the low. As the SPX resolved higher, this activity traded out, so to speak, as evidenced by ultra-short-dated call selling and put buying, hence mean-reversion into the close.
Graphic: Retrieved from SpotGamma.
SpotGamma’s founder said these “head-fakes” were to be expected. “Traders are uncertain and still are not committed to demanding longer-dated protection,” hence lower longer-dated IVOL.
In a Bank of America Corporation (NYSE: BAC) response to JPMorgan Chase & Co’s (NYSE: JPM) note on an ultra-short-dated options trading catastrophe looming, we learn that mean-reversion is, in part, a result of “traders buying short-dated options at the beginning of the day and unwinding those same positions late in the day,” I put in a SpotGamma note.
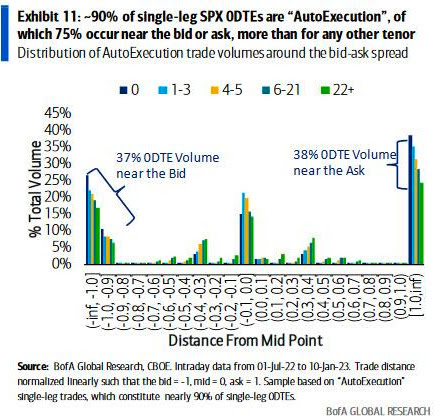
To quote BAC directly, half of all SPX ultra-short-dated options activity is “single-leg auto-execution.” Options IVOL is “at levels that are likely inconsistent with a market that has been overrun by option sellers,” contrary to JPM’s opinion, ZeroHedge said in one recap. “75% of trades occur near the bid or the ask – more than for any other tenor, and volume is uniquely skewed towards the ask early in the day but towards the bid later in the day.”
Consequently, a takeaway is that, as this letter has put forth in the past, ultra-short-dated options activity does not have a long-lasting impact. Rather, what is impactful is participants’ desire to carry exposure to options/protection that are farther-dated.
Graphic: Retrieved from Bank of America Corporation (NYSE: BAC) via SpotGamma.
As put in yesterday’s letter, the contexts for a far-reaching rally are weak. A change in the bearish context is likely to coincide with charged options values (i.e., wound IVOL or big put delta) or some fundamental, macro-type catalyst. In the latter, a caveat is that IVOL compression, alone, likely does little to inspire a far-reaching rally.
Technical
As of 7:30 AM ET, Friday’s regular session (9:30 AM – 4:00 PM ET), in the S&P 500, is likely to open in the lower part of a negatively skewed overnight inventory, inside of the prior day’s range, suggesting a limited potential for immediate directional opportunity.
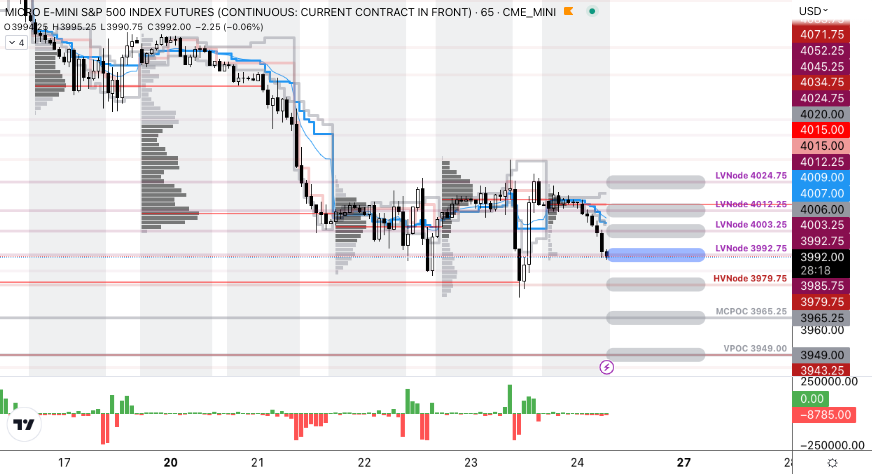
The S&P 500 pivot for today is $3,992.75.
Key levels to the upside include $4,003.25, $4,012.25, and $4,024.75.
Key levels to the downside include $3,979.75, $3,965.25, and $3,949.00.
Disclaimer: Click here to load the updated key levels via the web-based TradingView platform. New links are produced daily. Quoted levels likely hold barring an exogenous development.
Graphic: 65-minute profile chart of the Micro E-mini S&P 500 Futures.
Definitions
Volume Areas: Markets will build on areas of high-volume (HVNodes). Should the market trend for a period of time, this will be identified by a low-volume area (LVNodes). The LVNodes denote directional conviction and ought to offer support on any test.
If participants auction and find acceptance in an area of a prior LVNode, then future discovery ought to be volatile and quick as participants look to the nearest HVNodes for more favorable entry or exit.
POCs: Areas where two-sided trade was most prevalent in a prior day session. Participants will respond to future tests of value as they offer favorable entry and exit.
MCPOCs: Denote areas where two-sided trade was most prevalent over numerous sessions. Participants will respond to future tests of value as they offer favorable entry and exit.
About
The author, Renato Leonard Capelj, works in finance and journalism.
Capelj spends the bulk of his time at Physik Invest, an entity through which he invests and publishes free daily analyses to thousands of subscribers. The analyses offer him and his subscribers a way to stay on the right side of the market. Separately, Capelj is an options analyst at SpotGamma and an accredited journalist.
You may view this letter’s content calendar at this link.
Disclaimer
Do not construe this newsletter as advice. All content is for informational purposes. Capelj and Physik Invest manage their own capital and will not solicit others for it.
Physik Invest’s Daily Brief is read free by thousands of subscribers. Join this community to learn about the fundamental and technical drivers of markets.
Graphic updated 6:30 AM ET. Sentiment Neutral if expected /MES open is inside of the prior day’s range. /MES levels are derived from the profile graphic at the bottom of this letter. Click here for the latest levels. SqueezeMetrics Dark Pool Index (DIX) and Gamma (GEX) with the latter calculated based on where the prior day’s reading falls with respect to the MAX and MIN of all occurrences available. A higher DIX is bullish. The lower the GEX, the more (expected) volatility. Click to learn the implications of volatility, direction, and moneyness. Breadth reflects a reading of the prior day’s NYSE Advance/Decline indicator. The CBOE VIX Volatility Index (INDEX: VVIX) reflects the attractiveness of owning volatility. UMBS prices via MND. Click here for the economic calendar.
Fundamental
Bloomberg’s John Authers summarized well the release of the Federal Open Market Committee (FOMC) meeting minutes. He said that almost all officials “supported a step down in the pace of tightening by 25 basis points, while a ‘few’ favored or could have supported a bigger 50 basis-point hike. Nobody wanted to stop straightaway.”
“Participants observed that a restrictive policy stance would need to be maintained until the incoming data provided confidence that inflation was on a sustained downward path to 2%, which was likely to take some time,” the minutes said.
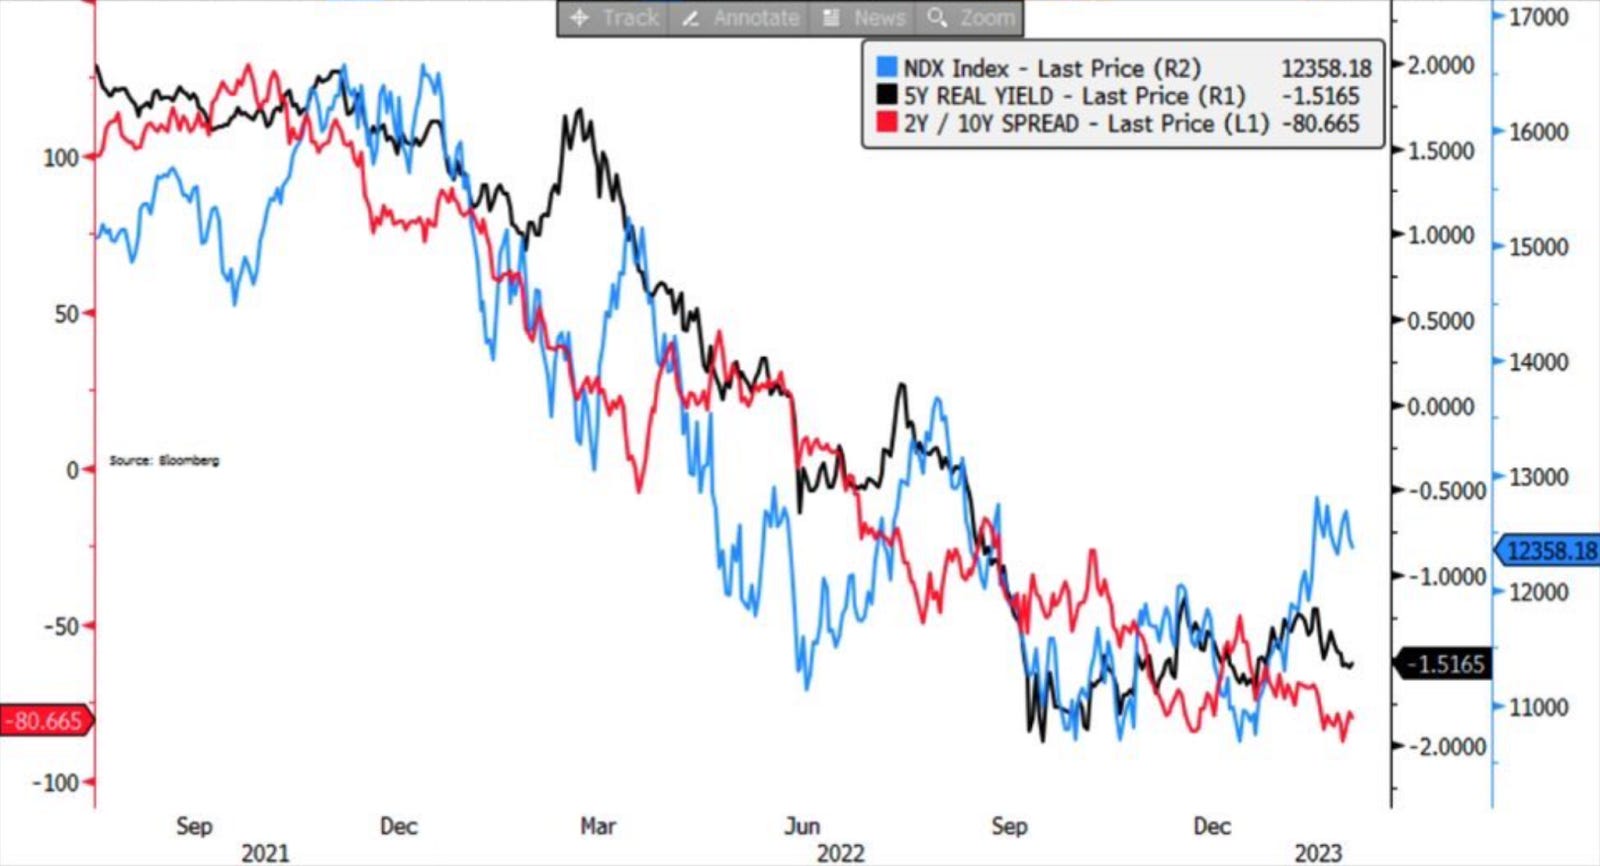
Graphic: Retrieved from Royal Bank of Canada (NYSE: RY).
Notwithstanding hits to markets like housing, which news has concentrated on, the S&P 500 (INDEX: SPX) is trading about 18x forward price-to-earnings, Bank of America Corporation (NYSE: BAC) said, the highest since March 2022 and 20% above the last decade’s average P/E.
Graphic: Retrieved from Bloomberg.
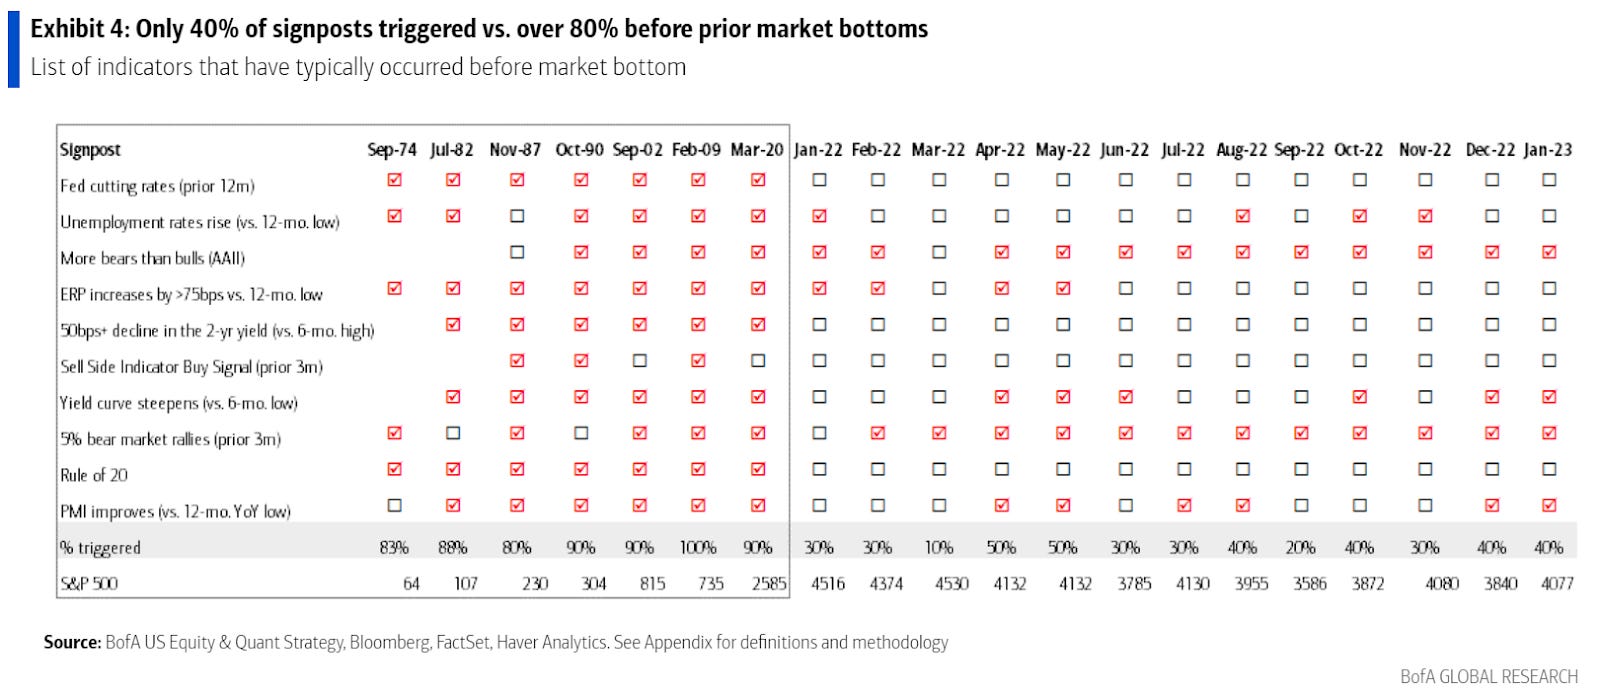
Per Savita Subramanian, “the traditional Rule of 20 … holds that the multiple should be whatever number results by subtracting the inflation rate from 20 — which with inflation at 6.4% would imply that the P/E needs to fall to 13.6.”
Graphic: Retrieved from Bank of America Corporation (NYSE: BAC) via Bloomberg.
Recall yesterday’s letter discussing the “risk-reward of holding bonds [looking] betterthan equity (earnings yield).”
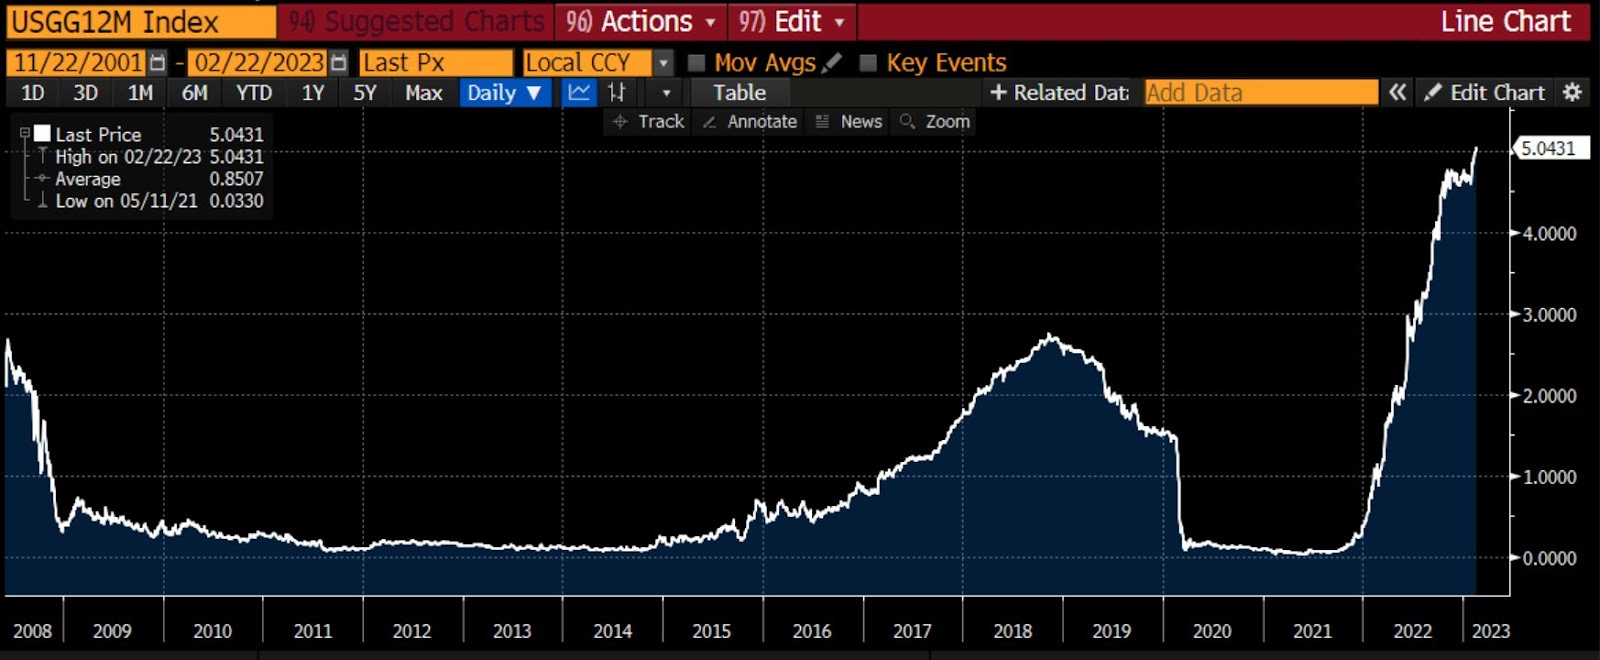
Graphic: Retrieved from Bloomberg’s Lisa Abramowicz. “Yields on 12-month T-bills have risen to their highest since 2001. Most of this has to do with Fed rate hike expectations.”
Positioning
The SPX’s decline is orderly and contained.
However, the break below $4,000.00 SPX did open the door to a “liquidity hole,” SpotGamma explained. New information has traders anticipating more equity market downside; traders are “reset[ing] to lower equity valuations” on the higher-for-longer rate narrative all the while “vanna and gamma hedging serve to pull markets lower.”
The contexts for a far-reaching rally are weak. A change in the context is likely to coincide with charged options values (i.e., wound implied volatility or big put delta).
Technical
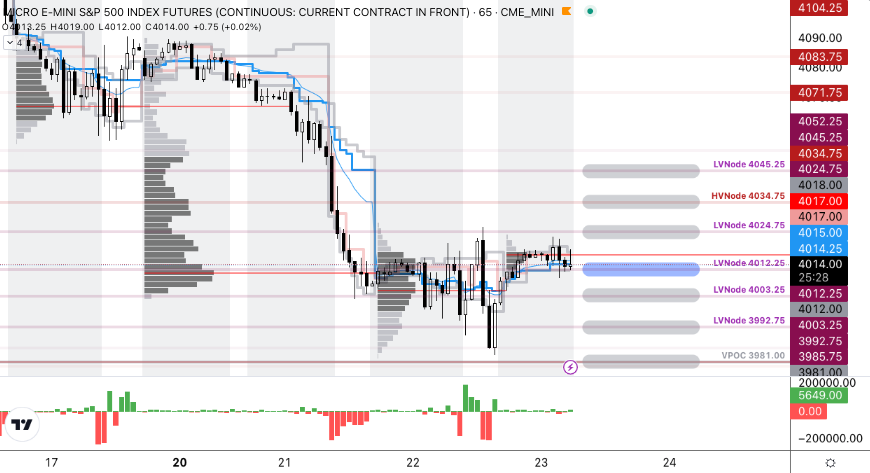
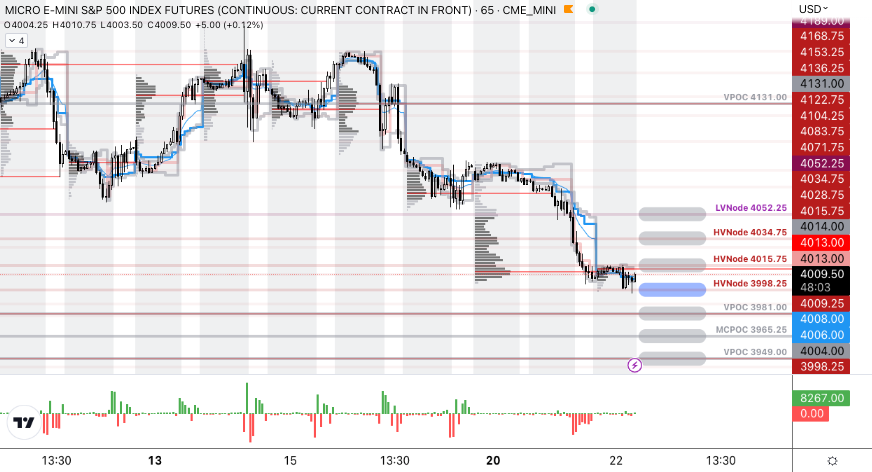
As of 6:30 AM ET, Thursday’s regular session (9:30 AM – 4:00 PM ET), in the S&P 500, is likely to open in the middle part of a positively skewed overnight inventory, inside of the prior day’s range, suggesting a limited potential for immediate directional opportunity.
The S&P 500 (FUTURE: /MES) pivot for today is $4,012.25.
Key levels to the upside include $4,024.75, $4,034.75, and $4,045.25.
Key levels to the downside include $4,003.25, $3,992.75, and $3,981.00.
Disclaimer: Click here to load the updated key levels via the web-based TradingView platform. New links are produced daily. Quoted levels likely hold barring an exogenous development.
Graphic: 65-minute profile chart of the Micro E-mini S&P 500 Futures.
Definitions
Volume Areas: Markets will build on areas of high-volume (HVNodes). Should the market trend for a period of time, this will be identified by a low-volume area (LVNodes). The LVNodes denote directional conviction and ought to offer support on any test.
If participants auction and find acceptance in an area of a prior LVNode, then future discovery ought to be volatile and quick as participants look to the nearest HVNodes for more favorable entry or exit.
Delta: An option’s exposure to the direction or underlying asset movement.
Gamma: The sensitivity of an option’s delta to changes in the underlying asset’s price.
Vanna: The rate at which the delta of an option changes with respect to implied volatility.
POCs: Areas where two-sided trade was most prevalent in a prior day session. Participants will respond to future tests of value as they offer favorable entry and exit.
About
The author, Renato Leonard Capelj, works in finance and journalism.
Capelj spends the bulk of his time at Physik Invest, an entity through which he invests and publishes free daily analyses to thousands of subscribers. The analyses offer him and his subscribers a way to stay on the right side of the market. Separately, Capelj is an options analyst at SpotGamma and an accredited journalist.
You may view this letter’s content calendar at this link.
Disclaimer
Do not construe this newsletter as advice. All content is for informational purposes. Capelj and Physik Invest manage their own capital and will not solicit others for it.
Physik Invest’s Daily Brief is read free by thousands of subscribers. Join this community to learn about the fundamental and technical drivers of markets.
Graphic updated 7:15 AM ET. Sentiment Neutral if expected /MES open is inside of the prior day’s range. /MES levels are derived from the profile graphic at the bottom of this letter. Click here for the latest levels. SqueezeMetrics Dark Pool Index (DIX) and Gamma (GEX) with the latter calculated based on where the prior day’s reading falls with respect to the MAX and MIN of all occurrences available. A higher DIX is bullish. The lower the GEX, the more (expected) volatility. Click to learn the implications of volatility, direction, and moneyness. Breadth reflects a reading of the prior day’s NYSE Advance/Decline indicator. The CBOE VIX Volatility Index (INDEX: VVIX) reflects the attractiveness of owning volatility. UMBS prices via MND. Click here for the economic calendar.
Fundamental
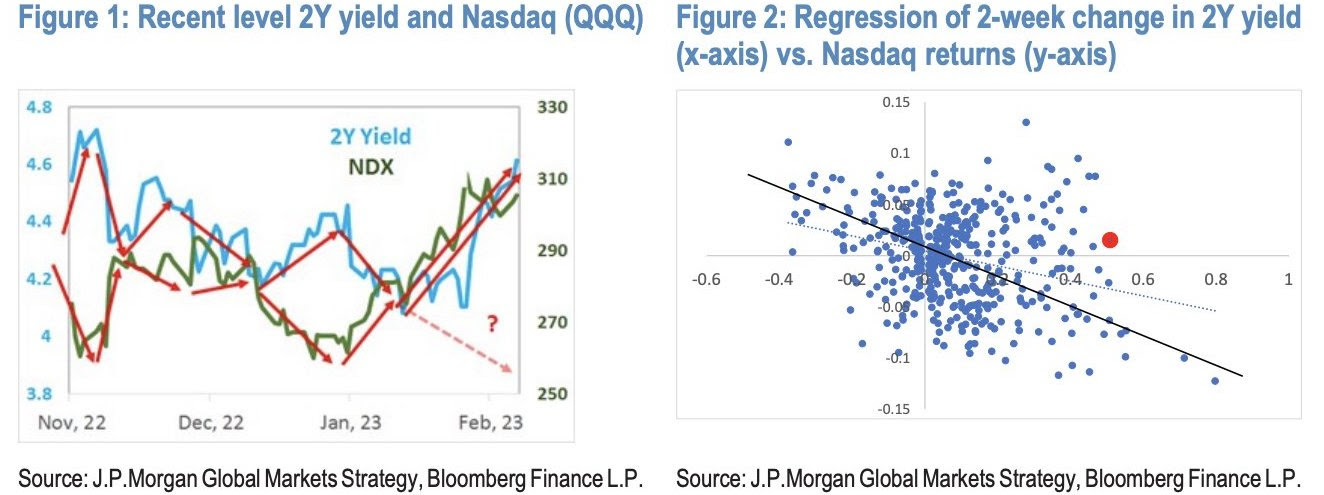
We look beyond all the doom-and-gloom narrative to the bond-equity divergence which JPMorgan Chase & Co’s (NYSE: JPM) Marko Kolanovic wrote about recently.
Essentially, regressions suggest the move in interest rates since the Federal Reserve’s (Fed) meeting earlier this month should have resulted in a 5-10% sell-off in the rate-sensitive Nasdaq. It didn’t. Per Kolanovic, “this divergence cannot go much further.”
Recall interest rates matter to discounted future cash flows. The higher rates are the, worse that is for equities, says Damped Spring’s Andy Constan well in an interview.
Interest rates matter elsewhere as well. When interest rates increase, “a mortgage goes down in price by a greater amount than the bond because the expected maturity of the mortgage becomes longer. The magnitude of this unbalanced price volatility characteristic is measured by a financial statistic called ‘convexity.’” Managing this convexity can be problematic and force feedback loops, just as we talk about with options per the below. See here for more.
Graphic: The “Biggest tail risk to SPX isn’t any macro data/virus/war but its own options market.”
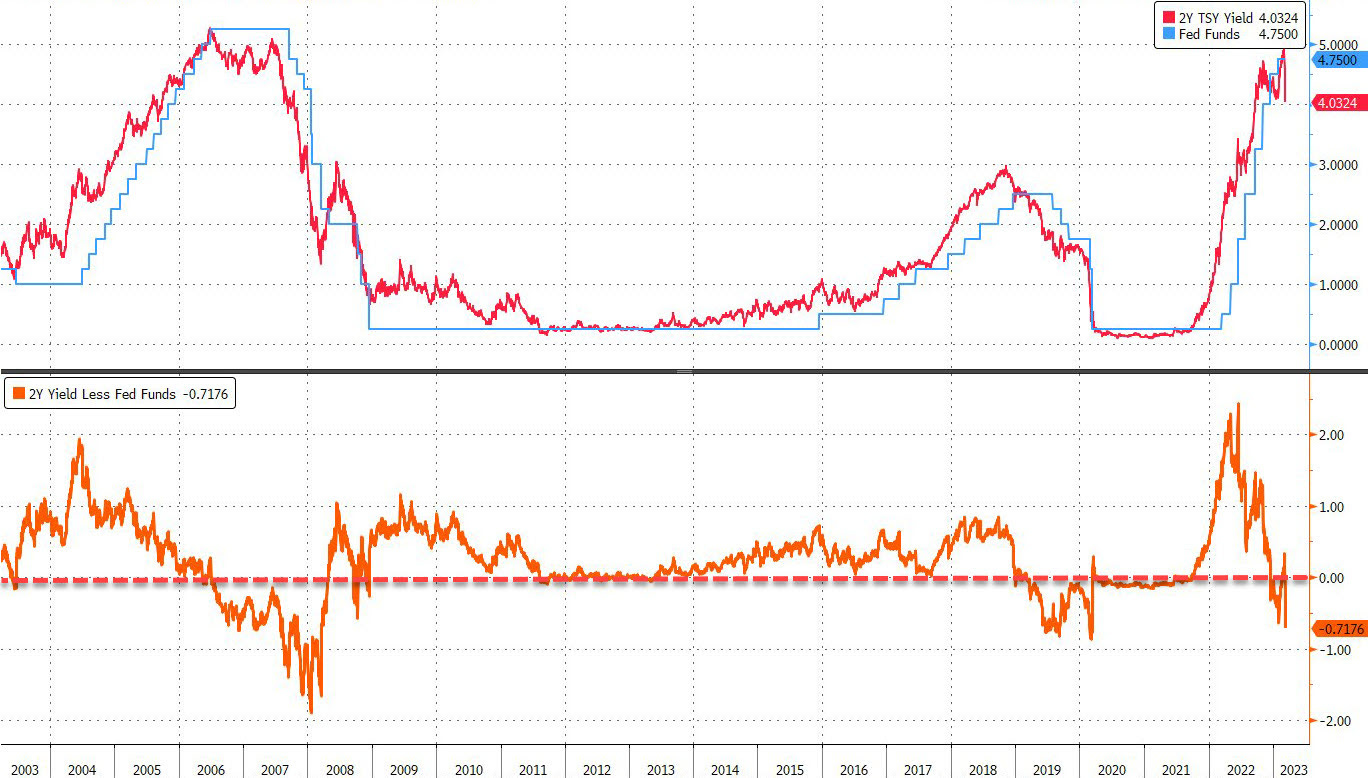
Kolanvoic ends: The “risk-reward of holding bonds at this level of short-term yields looks better than equity (earnings yield) than any time since the great financial crisis (i.e., the spread between 2y and equity earnings yield is at the lowest point since 2007).”
Graphic: Retrieved from JPMorgan Chase & Co (NYSE: JPM).
Positioning
This letter said there would be movement after last week’s options expirations (OpEx).
To quote the February 15 letter, ignoring the “excellent” liquidity and traders buying S&P 500 (INDEX: SPX) “hand over fist,” OpEx would result in a decline in counterparty exposure to positive gamma (i.e., positive exposure to movement). Support from an options positioning perspective would decline, and counterparties would “do less to disrupt and more to bolster movement.”
That’s along the lines of what’s happening, though the movement appears orderly.
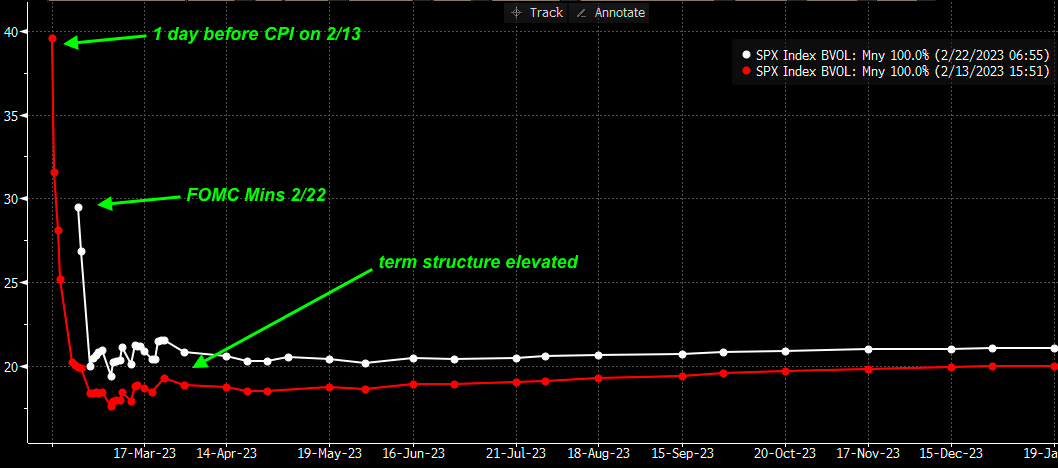
Per SpotGamma, “The selling appears contained, as evidenced by an upward trending [implied volatility or IVOL] term structure and light bid in topline measures of [IVOL] like the [Cboe Volatility Index (INDEX: VIX)].” Notwithstanding this light bid at the front of the term structure, there is no rush to protect, as would be evidenced by longer-dated IVOL shifting “materially higher as traders reset to lower equity valuations.”
Graphic: Retrieved from SpotGamma. “SPX term structure today vs 2/13 (day prior to CPI). Traders had higher vol expectations for CPI vs today’s FOMC minutes, but [the] term structure is now more elevated. Makes sense as SPX [is] -3% lower. However, the loss of stabilizing OPEX positioning, elevated IV, & flat gamma may lead to higher relative vol today.”
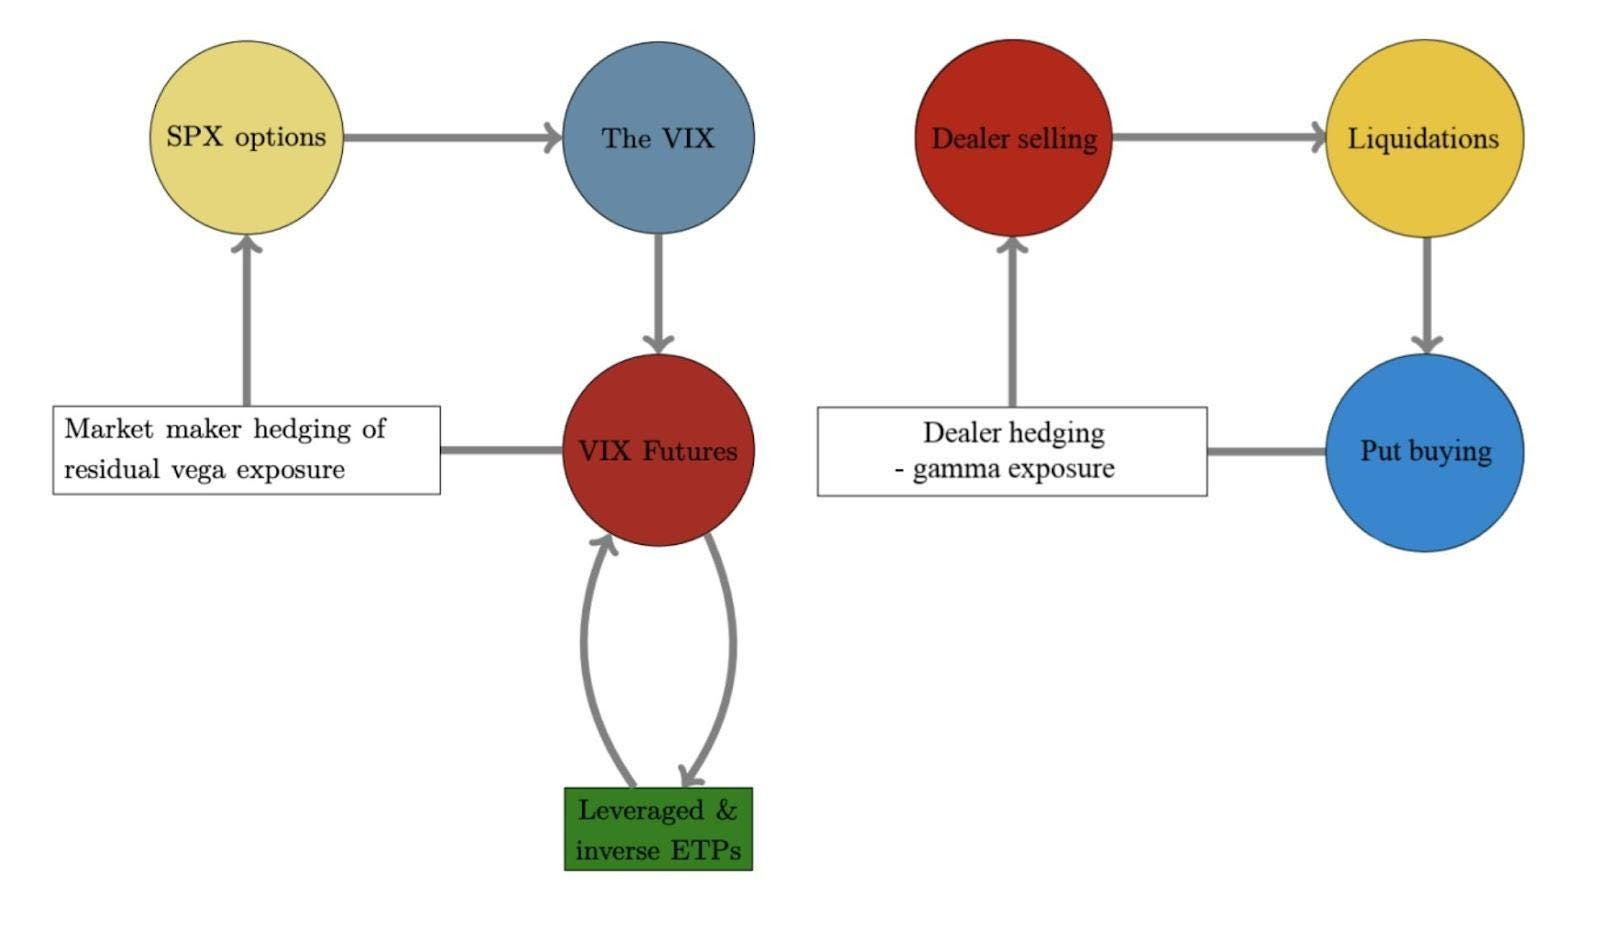
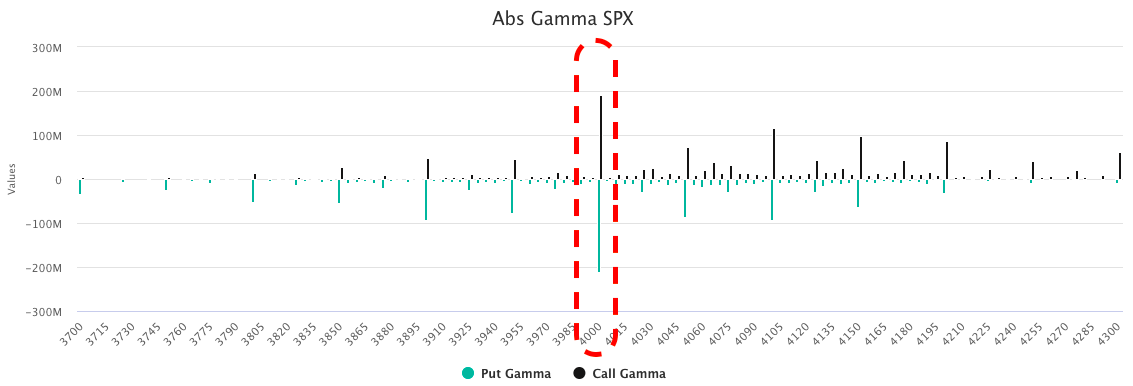
With there being many options positions concentrated near the $4,000.00 SPX area, markets may be at risk of accelerated selling. Below $4,000.00 traders desire to own predominantly puts, and this leaves counterparties “short puts and [] positive delta, as well as negative gamma and vega, meaning they lose money in an increasing way as the market trades lower and volatility increases.” To hedge, counterparties could sell futures or stocks into the decline. This accelerates selling.
So, with a break of that big $4,000.00 level increasing risk that selling accelerates, the desire to protect will bid IVOL and the marginal impact of its expansion can do more damage than good that any marginal compression can do.
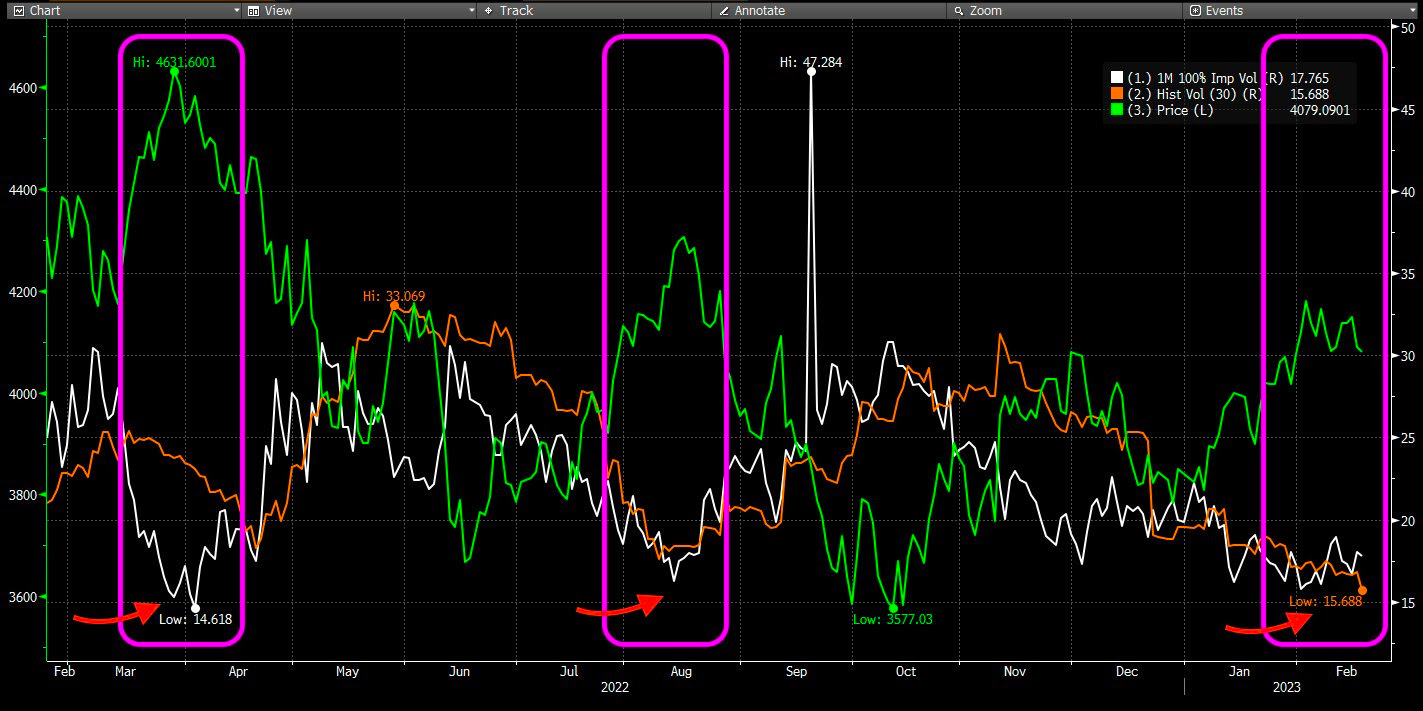
Graphic: Retrieved from SpotGamma. “IV has now compressed to levels associated with recent market tops. If realized vol (RV) declined, then IV could go lower. But, realized isn’t declining.”
In light of this, your letter writer leans negative delta, as well as positive gamma and vega. If the market trades lower, such a setup would make money in short.
Technical
As of 7:15 AM ET, Wednesday’s regular session (9:30 AM – 4:00 PM ET), in the S&P 500, is likely to open in the middle part of a negatively skewed overnight inventory, inside of the prior day’s range, suggesting a limited potential for immediate directional opportunity.
The S&P 500 pivot for today is $3,998.25.
Key levels to the upside include $4,015.75, $4,034.75, and $4,052.25.
Key levels to the downside include $3,981.00, $3,965.25, and $3,949.00.
Disclaimer: Click here to load the updated key levels via the web-based TradingView platform. New links are produced daily. Quoted levels likely hold barring an exogenous development.
Graphic: 65-minute profile chart of the Micro E-mini S&P 500 Futures.
Definitions
Volume Areas: Markets will build on areas of high-volume (HVNodes). Should the market trend for a period of time, this will be identified by a low-volume area (LVNodes). The LVNodes denote directional conviction and ought to offer support on any test.
If participants auction and find acceptance in an area of a prior LVNode, then future discovery ought to be volatile and quick as participants look to the nearest HVNodes for more favorable entry or exit.
Gamma: The sensitivity of an option’s Delta to changes in the underlying asset’s price.
CPOCs: Denote areas where two-sided trade was most prevalent over all sessions. Participants will respond to future tests of value as they offer favorable entry and exit.
POCs: Areas where two-sided trade was most prevalent in a prior day session. Participants will respond to future tests of value as they offer favorable entry and exit.
MCPOCs: Denote areas where two-sided trade was most prevalent over numerous sessions. Participants will respond to future tests of value as they offer favorable entry and exit.
Inversion Of VIX Futures Term Structure: Longer-dated VIX expiries are less expensive; is a warning of elevated near-term risks for equity market stability.
About
The author, Renato Leonard Capelj, works in finance and journalism.
Capelj spends the bulk of his time at Physik Invest, an entity through which he invests and publishes free daily analyses to thousands of subscribers. The analyses offer him and his subscribers a way to stay on the right side of the market. Separately, Capelj is an options analyst at SpotGamma and an accredited journalist.
You may view this letter’s content calendar at this link.
Disclaimer
Do not construe this newsletter as advice. All content is for informational purposes. Capelj and Physik Invest manage their own capital and will not solicit others for it.
Physik Invest’s Daily Brief is read by thousands of subscribers. You, too, can join this community to learn about the fundamental and technical drivers of markets.
Graphic updated 8:05 AM ET. Sentiment Risk-On if expected /ES open is above the prior day’s range. Click here for the latest levels. SqueezeMetrics Dark Pool Index (DIX) and Gamma (GEX) with the latter calculated based on where the prior day’s reading falls with respect to the MAX and MIN of all occurrences available. A higher DIX is bullish. At the same time, the lower the GEX, the more (expected) volatility. Click to learn the implications of volatility, direction, and moneyness. Breadth reflects a reading of the prior day’s NYSE Advance/Decline indicator. The CBOE VIX Volatility Index (INDEX: VVIX) reflects the attractiveness of owning volatility. UMBS price via MND. Click here for the calendar.
Fundamental
Companies are slowing price increases,
The Transcript, quoting earnings calls, shared with subscribers. Notwithstanding, consumer spending still reads strong. Mastercard Inc (NYSE: MA) measured ~9% growth in spending last month, and this points to the presence of inflation in the system that needs to be worked out.
Consequently, Federal Reserve (Fed) officials maintain that “more needs to be done”, and this is evident in traders’ guesses as to where rates peak (i.e., terminal rate), and when the eventual reduction in rates is set to occur (i.e., easing).
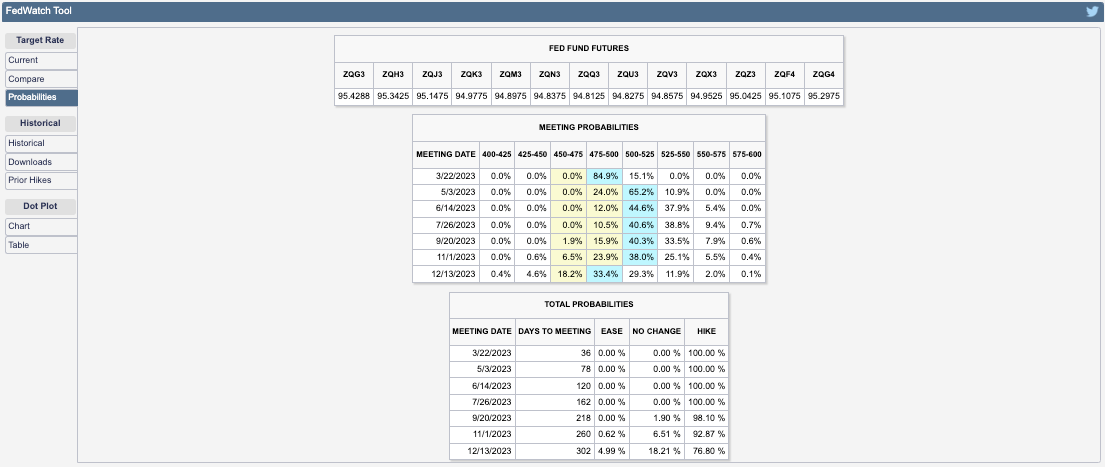
The free CME Group Inc (NASDAQ: CME) FedWatch Tool shows rates peaking in the 5.00-5.25% range through November. Then, in December, traders price a move back to the 4.75-5.00% range where we are now.
Graphic: Retrieved from CME Group Inc’s (NASDAQ: CME) Fedwatch Tool.
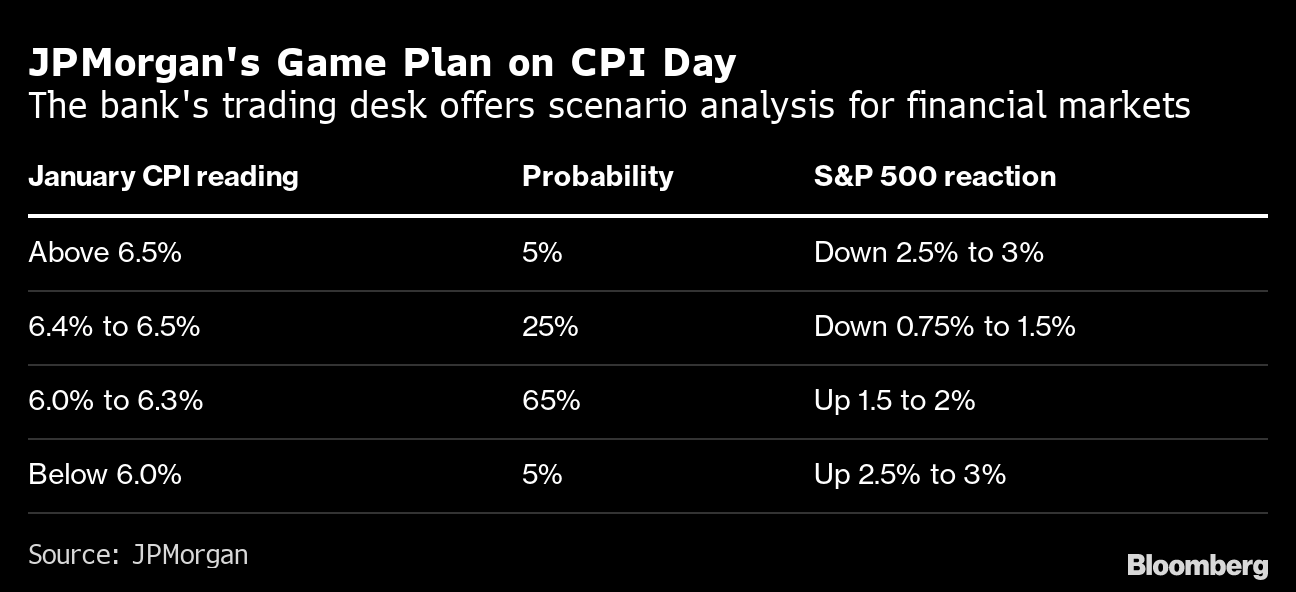
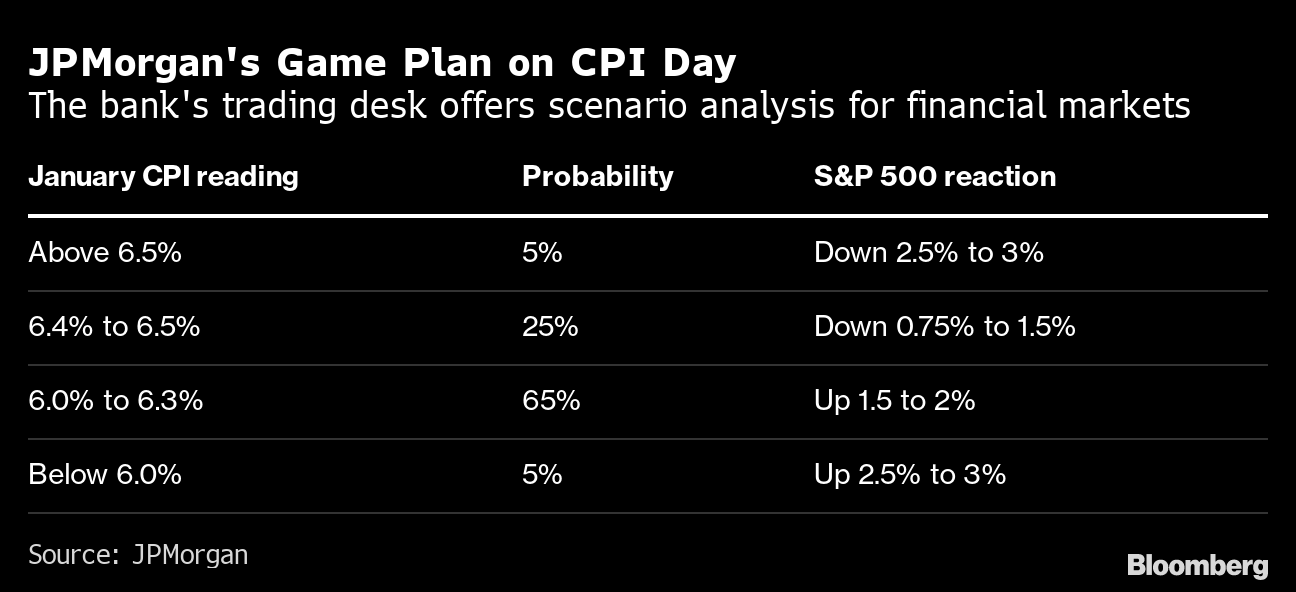
This is the pricing is in anticipation of rising consumer prices; the Consumer Price Index (CPI) due at 8:30 AM ET, is set to rise 0.5% in January, the most in a few months. Core CPI, which matters a lot to the Fed, is set to advance by about 0.4%.
JPMorgan Chase & Co (NYSE: JPM) thinks that “data close to estimates would be treated as confirming a continued cooling in inflation, which would imply a fall for bond yields and the dollar, while tech shares would lead an advance for US stocks.”
“But, anyequitygains are likely to fade, [JPM] warned, ‘once investors shift attention to a relatively slower pace of disinflation than the previous two months, where each CPI print saw a decrease of 60 basis points.’”
So in-line CPI, coupled with a strong January jobs report, will “corroborate recent comments from Fed officials that further interest-rate hikes are likely forthcoming,” Bloomberg adds. In a post by Joseph Wang, a former Fed trader, “a higher interest rate environment implies a more potent [quantiative tightening or] QT.”
“The Fed’s aggressive hikes have yet to reach the bulk of bank deposits, which is the foundational financial asset for many households. These deeply negative real yields may be extending the portfolio rebalancing impact of QE. Some households have escaped financial repression by moving into Treasury bills or money market funds, but that is not the only refuge. The perceived return of risk assets likely remains high for many, as the memory of the 2021 boom is still fresh.” Further, a “sizable yield upgrade being forced onto the market may indicate a more impactful QT.”
QT, to put it simply, is the flow of capital out of capital markets. Higher rates for longer and more QT arenot good for risk assets. Though money is flowing from other parts of the world, which, in part, has bolstered buying of assets over the past months, accelerating “QT shifts the composition of financial assets towards those that better reflect the Fed’s restrictive stance.”
Positioning
In the post-CPI expirations, implied volatility (IVOL), a demonstration of traders’ fears and demands for protection, is wound and is likely to serve as a catalyst for a fast move after CPI. Should fears be assuaged (i.e., barring the unexpected), wound volatility is likely to compress and this may result in a short-term market boost.
However, the sale and expiry of protection, after CPI and particularly the coming options expiration (OpEx), is likely to put the market in a precarious position.
According to SpotGamma, “current positioning, a result of re-grossing over the past weeks and months, has boosted dealer exposure to positive gamma.” This means counterparties (i.e., dealers) make money when the market moves and hedge in a manner that reduces volatility, “hence more rangebound trade as we have seen.”
Following OpEx, counterparty exposure to positive gamma will decline and “leave markets more at the whim of macro-type repositioning” which counterparties will do less to disrupt and more to bolster (i.e., add to movement).
Therefore, as SpotGamma summarizes, “[b]e prepared for potential relief immediately after CPI. However, across a longer time horizon, there is potential for weakness and that weakness may be exacerbated by dealer hedging.”
Technical
As of 7:15 AM ET, Tuesday’s regular session (9:30 AM – 4:00 PM ET), in the S&P 500, is likely to open in the upper part of a balanced overnight inventory, outside of the prior day’s range, suggesting a potential for immediate directional opportunity.
The S&P 500 pivot for today is $4,159.00.
Key levels to the upside include $4,168.75, $4,189.00, and $4,202.75.
Key levels to the downside include $4,137.00, $4,123.25, and $4,100.25.
Disclaimer: Click here to load the updated key levels via the web-based TradingView platform. New links are produced daily. Quoted levels likely hold barring an exogenous development.
Graphic: 65-minute profile chart of the Micro E-mini S&P 500 Futures.
Definitions
Volume Areas: Markets will build on areas of high-volume (HVNodes). Should the market trend for a period of time, this will be identified by a low-volume area (LVNodes). The LVNodes denote directional conviction and ought to offer support on any test.
If participants auction and find acceptance in an area of a prior LVNode, then future discovery ought to be volatile and quick as participants look to the nearest HVNodes for more favorable entry or exit.
POCs: Areas where two-sided trade was most prevalent in a prior day session. Participants will respond to future tests of value as they offer favorable entry and exit.
About
The author, Renato Leonard Capelj, works in finance and journalism.
Capelj spends the bulk of his time at Physik Invest, an entity through which he invests and publishes free daily analyses to thousands of subscribers. The analyses offer him and his subscribers a way to stay on the right side of the market. Separately, Capelj is an options analyst at SpotGamma and an accredited journalist.
Physik Invest’s Daily Brief is read by thousands of subscribers. You, too, can join this community to learn about the fundamental and technical drivers of markets.
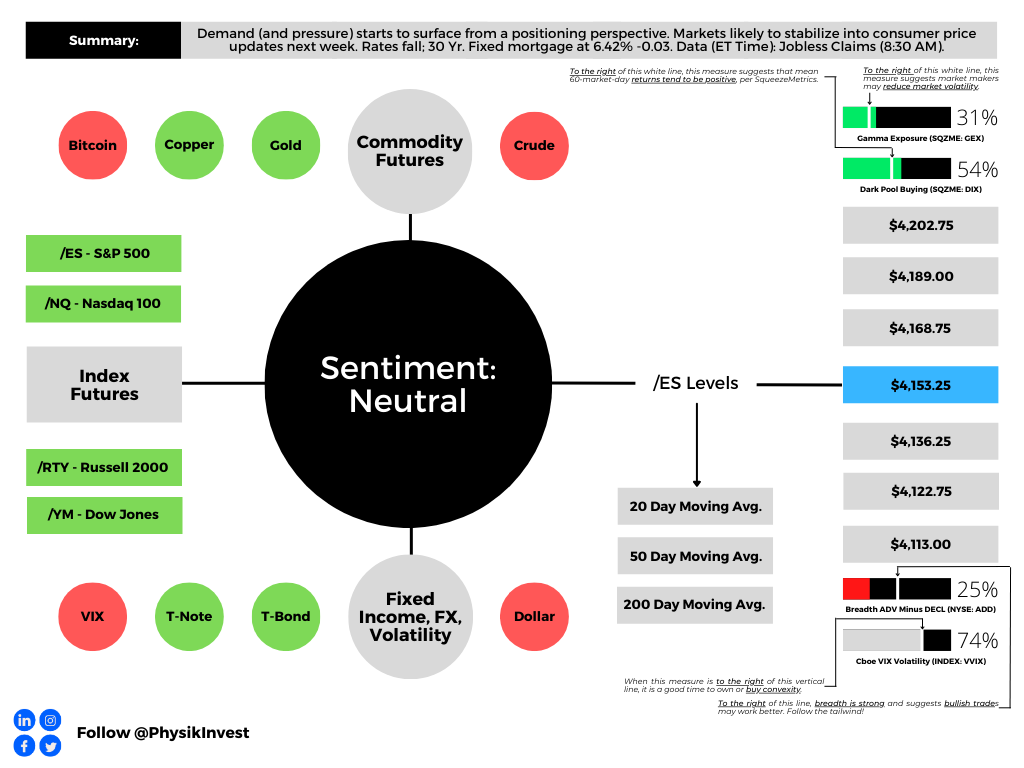
Graphic updated 7:20 AM ET. Sentiment Neutral if expected /ES open is inside of the prior day’s range. /ES levels are derived from the profile graphic at the bottom of this letter. Click here for the latest levels. SqueezeMetrics Dark Pool Index (DIX) and Gamma (GEX) with the latter calculated based on where the prior day’s reading falls with respect to the MAX and MIN of all occurrences available. A higher DIX is bullish. At the same time, the lower the GEX, the more (expected) volatility. Click to learn the implications of volatility, direction, and moneyness. Breadth reflects a reading of the prior day’s NYSE Advance/Decline indicator. The CBOE VIX Volatility Index (INDEX: VVIX) reflects the attractiveness of owning volatility.
Positioning
The cross-cutting forces on inflation are set to net out says Bob Elliott, the CIO at Unlimited. The former Bridgewater Associates executive thinks short-term inflation pressures are skewed upward, and that new data suggests “the respite in inflation … is probably going to fade and higher numbers are going to print.”
In short, disinflation from oil prices and the amelioration of supply chains “cannot persist, and that’s what we’re seeing now. It looks like those upward pressures on inflation are moving faster than the pace that services prices and housing costs are moving down.”
Consequently, there is a potential for broad inflation measures to remain higher for longer, hence the thinking that the Federal Reserve (Fed) indeed stays tougher on inflation for longer (i.e., higher rates for longer). This would support traders’ recent desire to bet large on downside movement next week when the Consumer Price Index (CPI) is set to update.
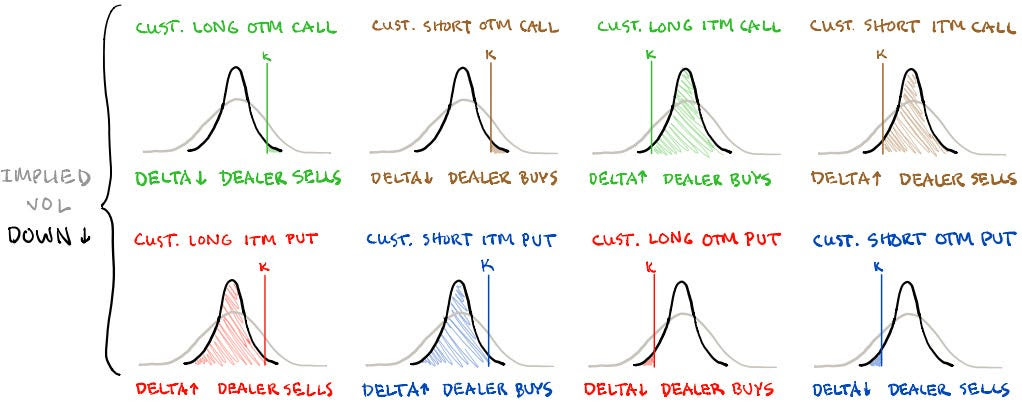
Publicized by Kai Volatility’s Cem Karsan and Damped Spring’s Andy Constan, some trader(s) bought to open 24,000 put options at the $4,050.00 S&P 500 (FUTURE: /ES) strike expiring February 17, 2023. The trade coincided with market makers selling to open “roughly 7,200 [/ES] futures contracts worth roughly $1.5 billion.” This “caused the local low,” Constan, who also worked at Bridgewater (and your letter writer had the honor of interviewing before), explained.
This trade, and others like it, compounded the pressures of the dealers selling their existing stock and futures “to re-hedge their call options exposures that are declining in value.”
Graphic: Retrieved from SqueezeMetrics.
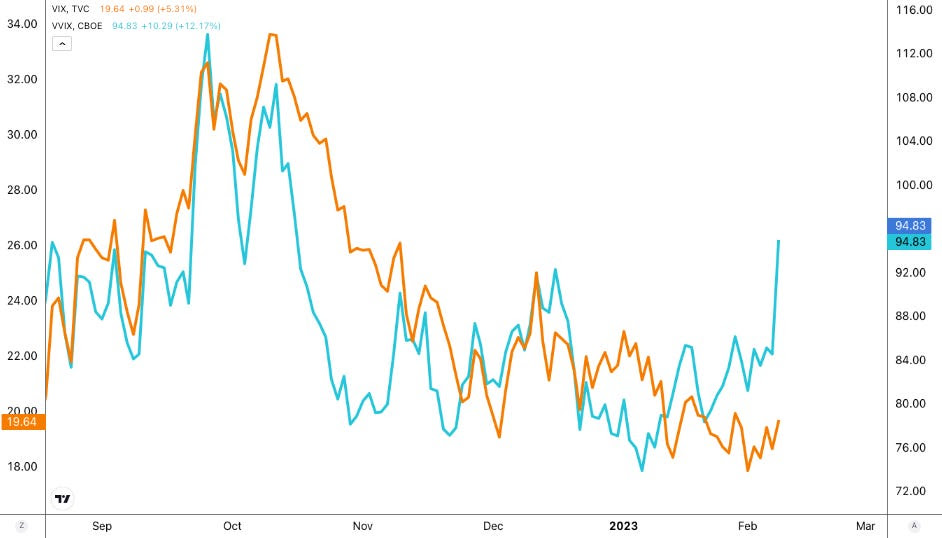
Accordingly, the Cboe Volatility Index (INDEX: VIX) is bid, as is the Cboe VIX Volatility Index (INDEX: VVIX), which your letter writer talked about in a SpotGamma note last night. Basically, traders are hedging more, and this is observed by previously low readings of convexity moving higher. Still, given that there is still some time to CPI, there’s potential for “current prices the SPX trades at [to] appear sticky for lack of better phrasing,” SpotGamma explained; pre-CPI, traders often sell short-term volatility as a bet on limited movement. It’s the post-CPI expirations in which implied volatility (IVOL) is wound and will serve as a catalyst for a fast move higher or lower.
Graphic: Retrieved from TradingView. Blue = VVIX. Orange = VIX.
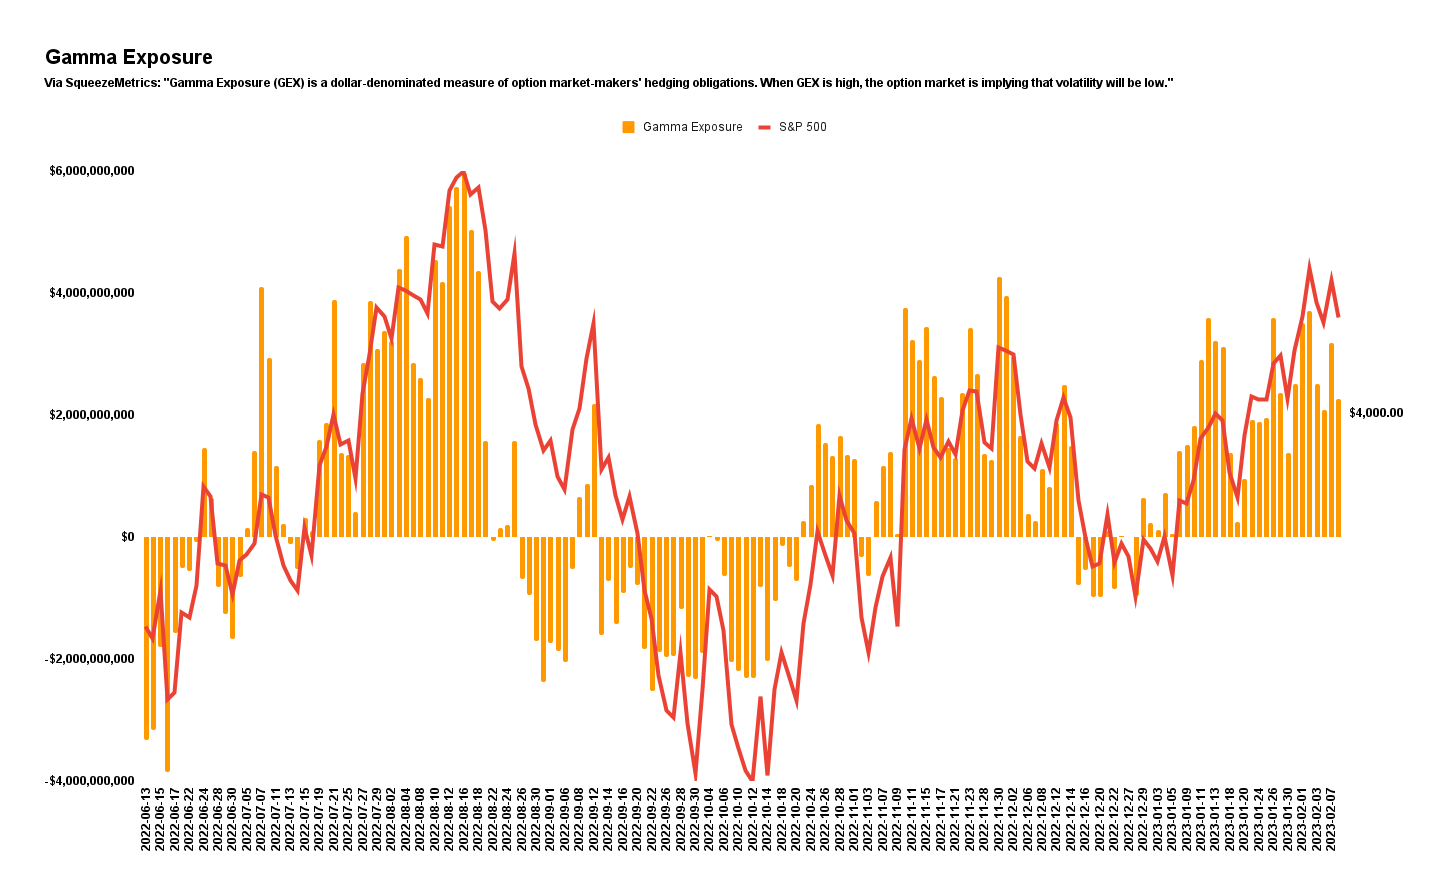
So, in the short-term, there may be some pinning, followed by an expansion of range into the mid-February (2/17) monthly options expiration (OpEx). This event likely puts the market in a precarious position and at the whims of macro-type repositioning, which may be bearish based on the insights this letter has covered in the past.
Graphic: Retrieved from Physik Invest. Data from SqueezeMetrics. Gamma exposure is set to fall in mid-February, and this may result in less support from the options market.
Trades that look and are working well include those that use short-call vertical credits to finance long-put vertical debits out months from now. For instance, for every two units of short call verticals (SOLD -1 VERTICAL SPX 100 19 MAY 23 [AM] 4150/4200 CALL), your letter writer is looking to own one unit of the long put vertical (BUY +1 VERTICAL SPX 100 16 JUN 23 [AM] 3450/3350 PUT). Remember that your letter writer may not necessarily think the market will trade that far, rather it may be a bet on IVOL repricing.
A case study on last week’s ultra-successful call ratio spreads is coming soon. Take care and watch your risk!
Technical
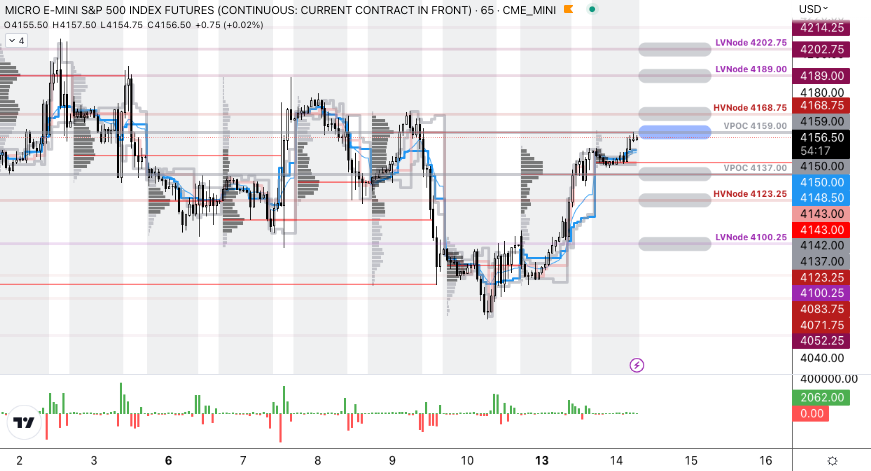
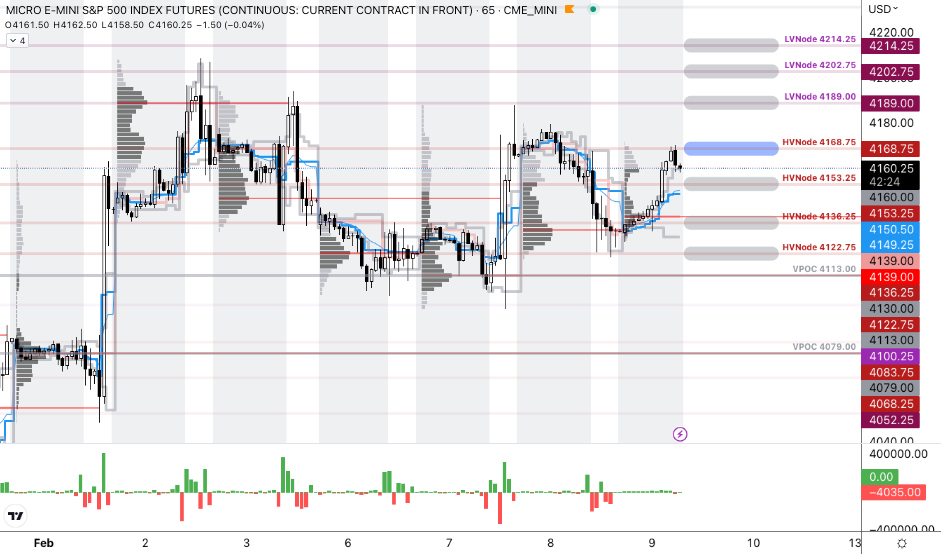
As of 7:20 AM ET, Thursday’s regular session (9:30 AM – 4:00 PM ET), in the S&P 500, is likely to open in the upper part of a positively skewed overnight inventory, inside of the prior day’s range, suggesting a limited potential for immediate directional opportunity.
The S&P 500 pivot for today is $4,168.75.
Key levels to the upside include $4,189.00, $4,202.75, and $4,214.25.
Key levels to the downside include $4,153.25, $4,136.25, and $4,122.75.
Disclaimer: Click here to load the updated key levels via the web-based TradingView platform. New links are produced daily. Quoted levels likely hold barring an exogenous development.
Graphic: 65-minute profile chart of the Micro E-mini S&P 500 Futures.
Definitions
Volume Areas: Markets will build on areas of high-volume (HVNodes). Should the market trend for a period of time, this will be identified by a low-volume area (LVNodes). The LVNodes denote directional conviction and ought to offer support on any test.
If participants auction and find acceptance in an area of a prior LVNode, then future discovery ought to be volatile and quick as participants look to the nearest HVNodes for more favorable entry or exit.
About
The author, Renato Leonard Capelj, works in finance and journalism.
Capelj spends the bulk of his time at Physik Invest, an entity through which he invests and publishes free daily analyses to thousands of subscribers. The analyses offer him and his subscribers a way to stay on the right side of the market. Separately, Capelj is an options analyst at SpotGamma and an accredited journalist.