Categories
Commentary

Daily Brief For February 1, 2023

Physik Invest’s Daily Brief is read by thousands of subscribers. You, too, can join this community to learn about the fundamental and technical drivers of markets.
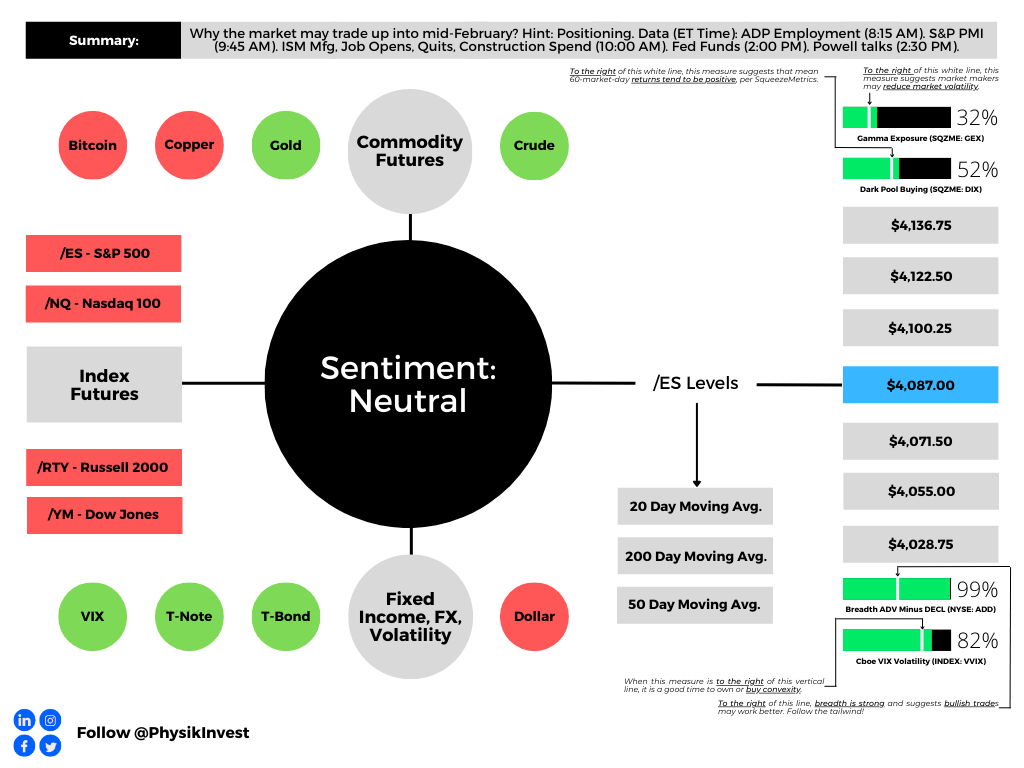
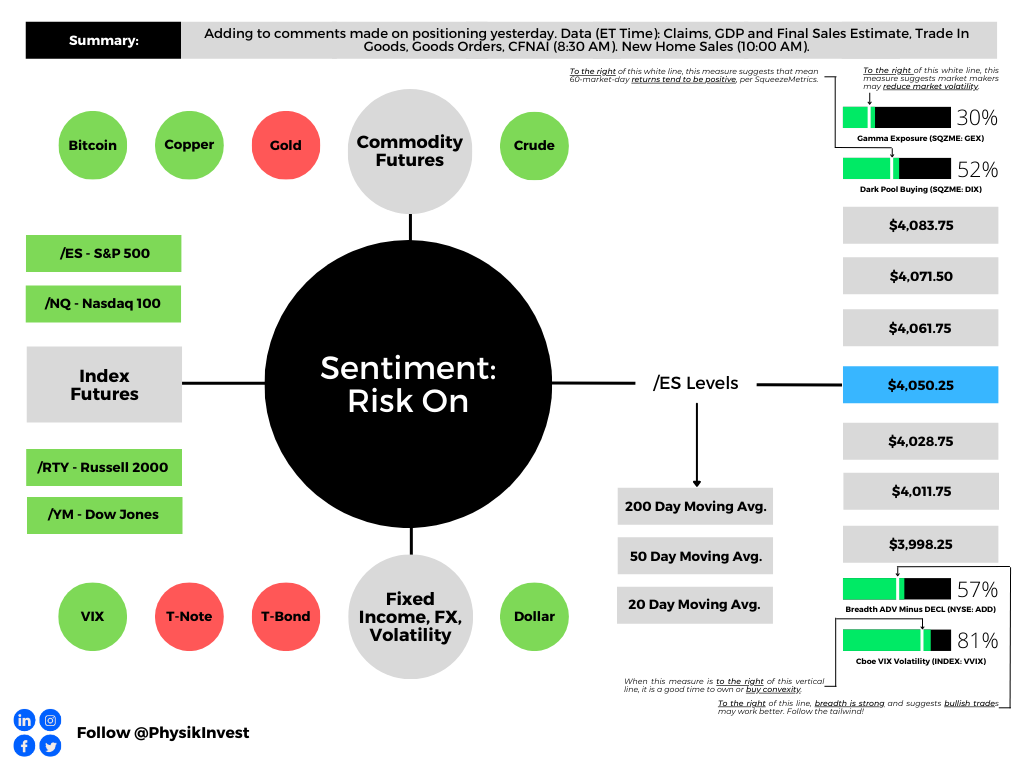
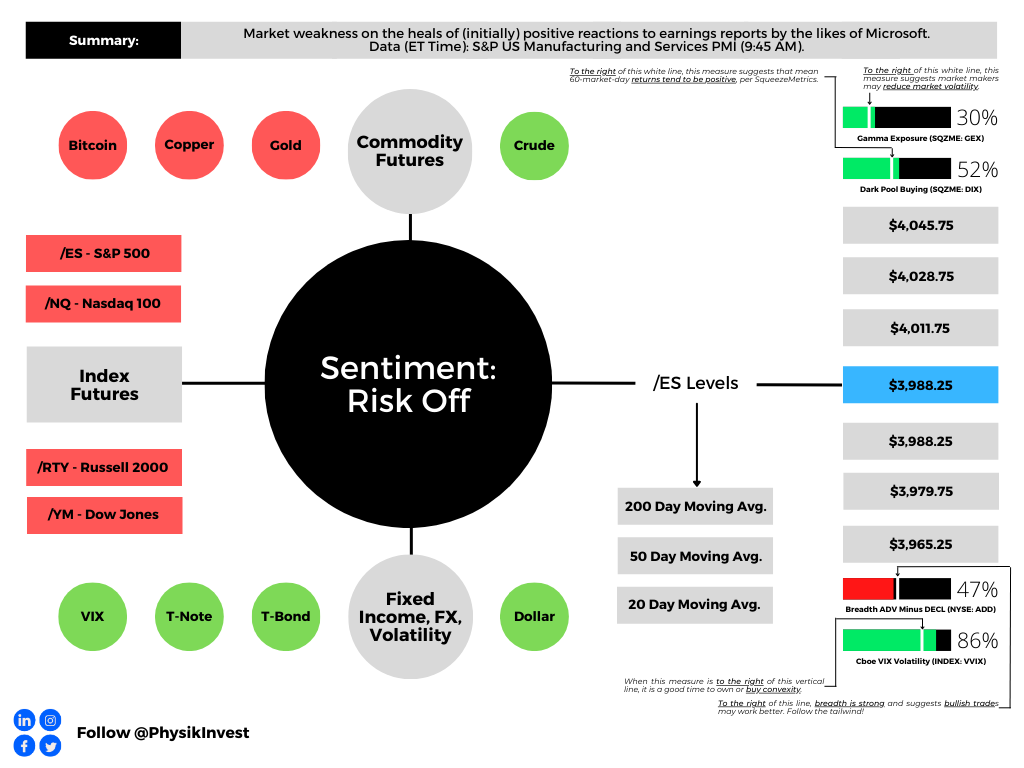
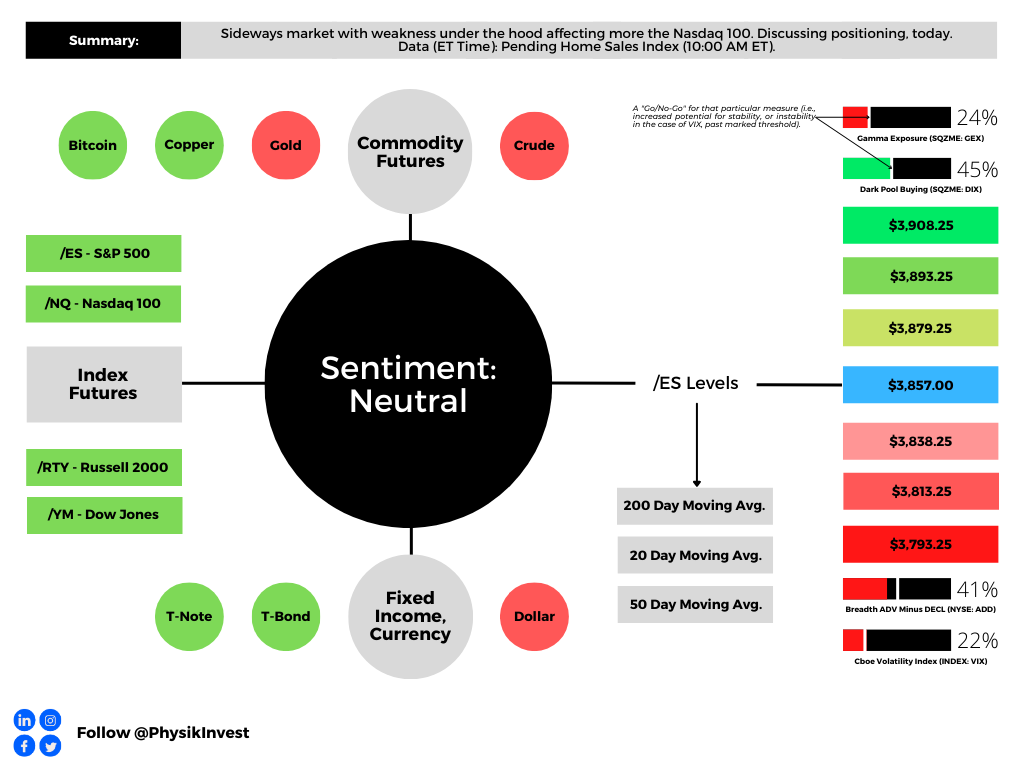
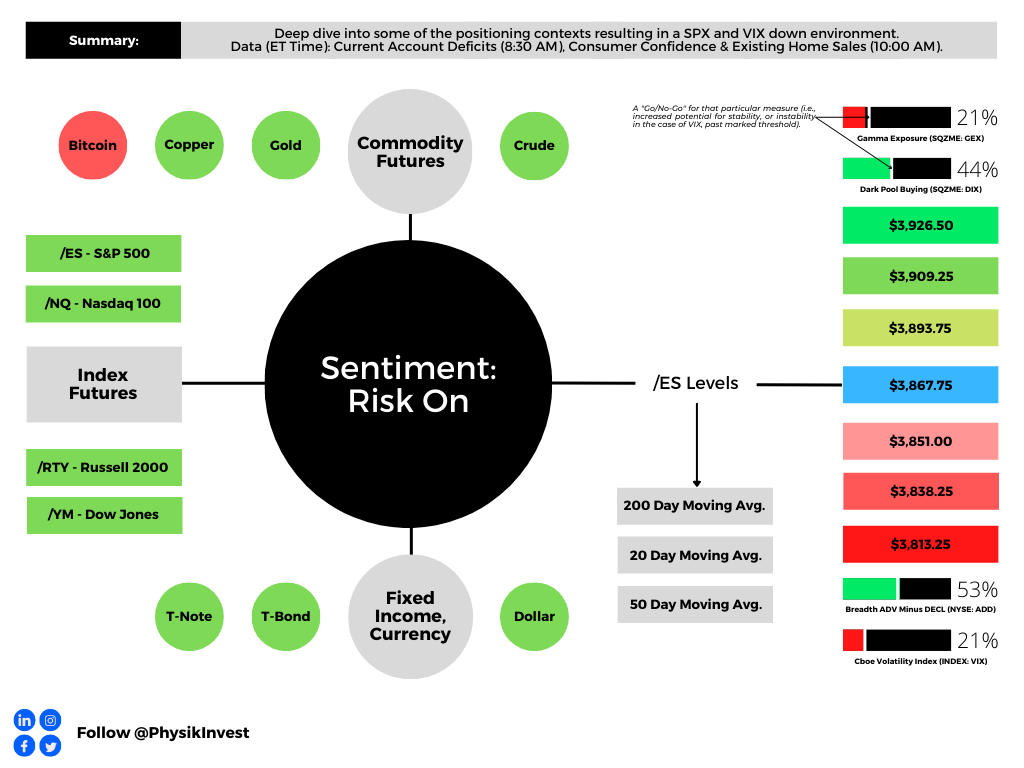
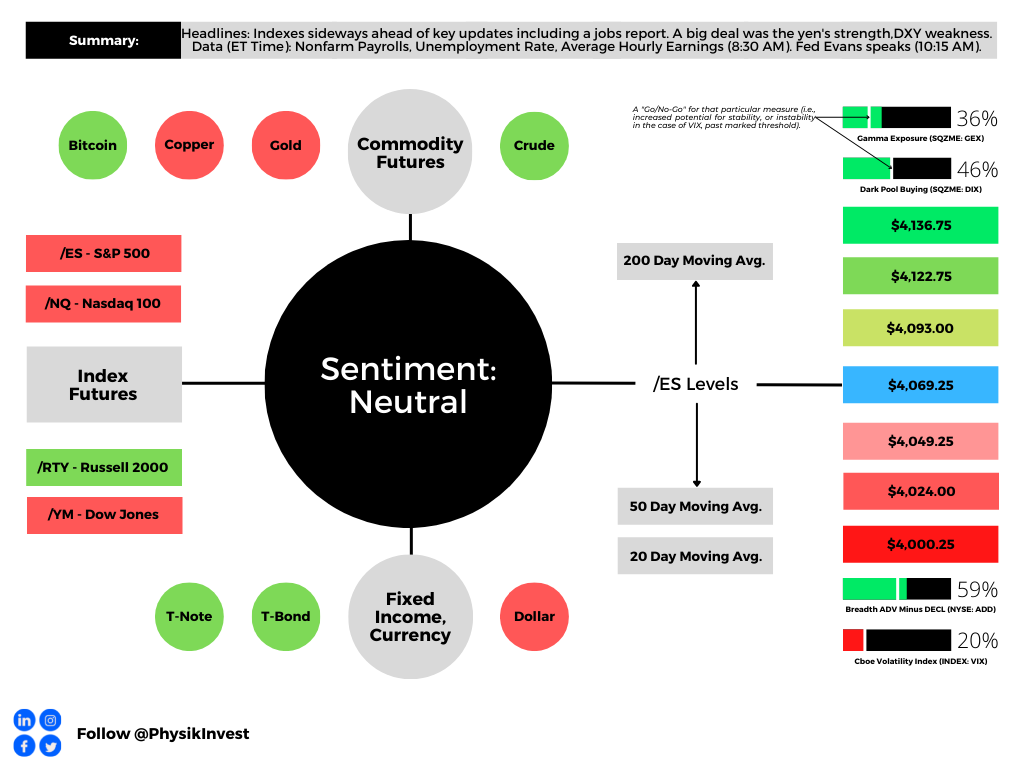
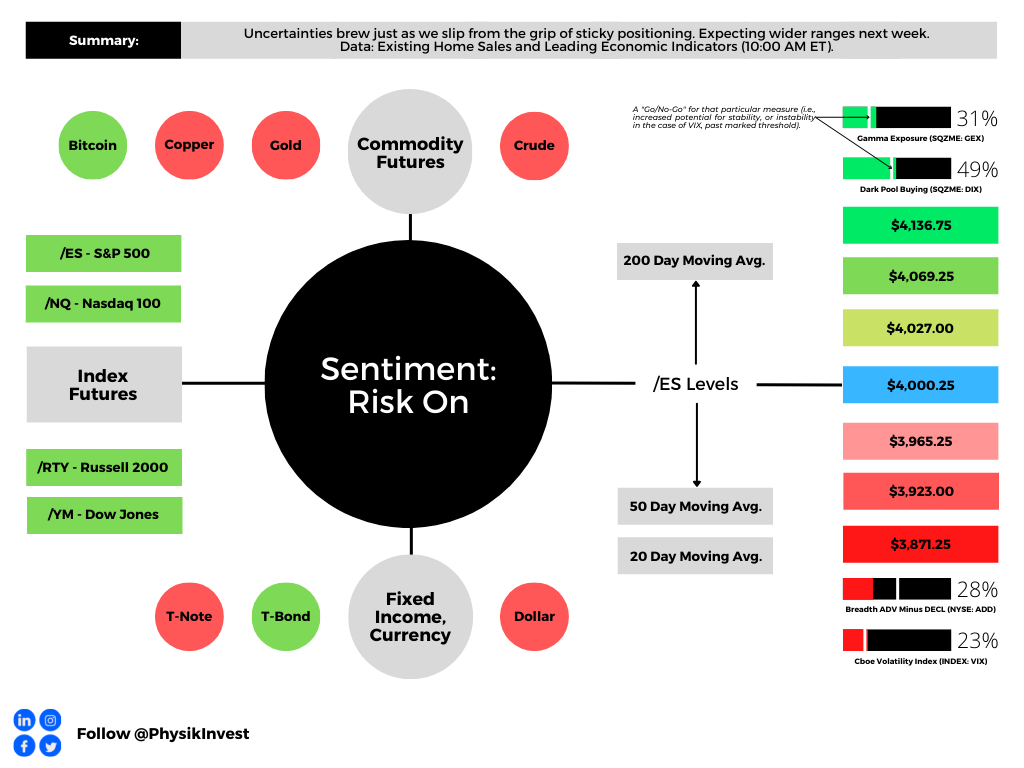
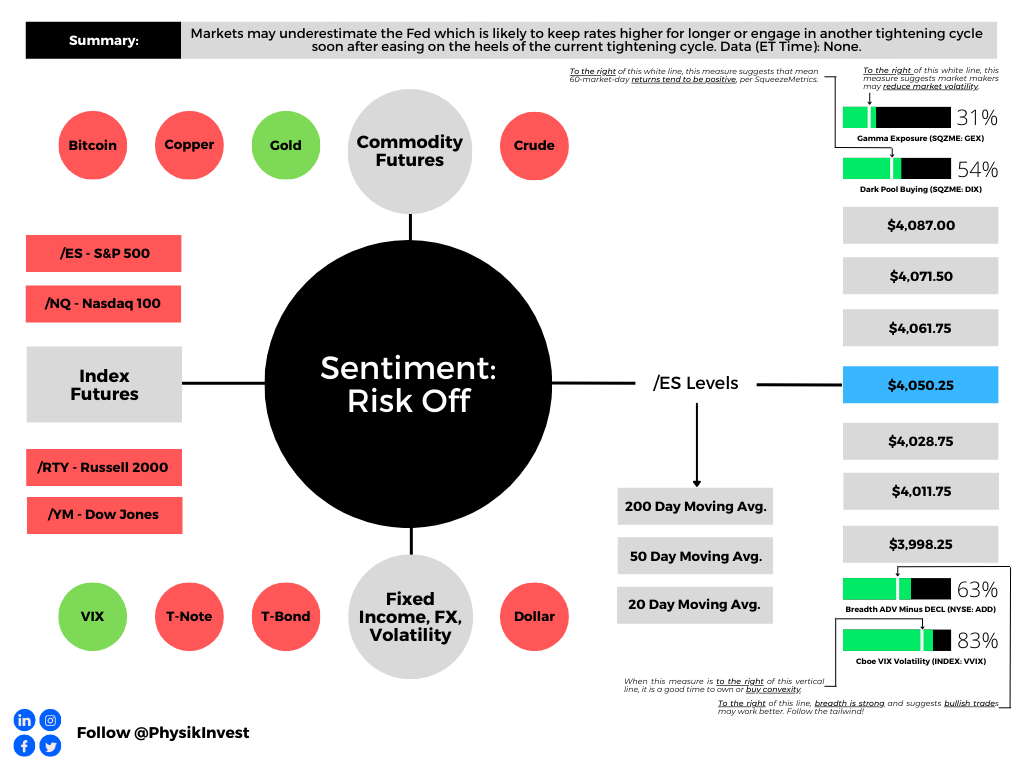
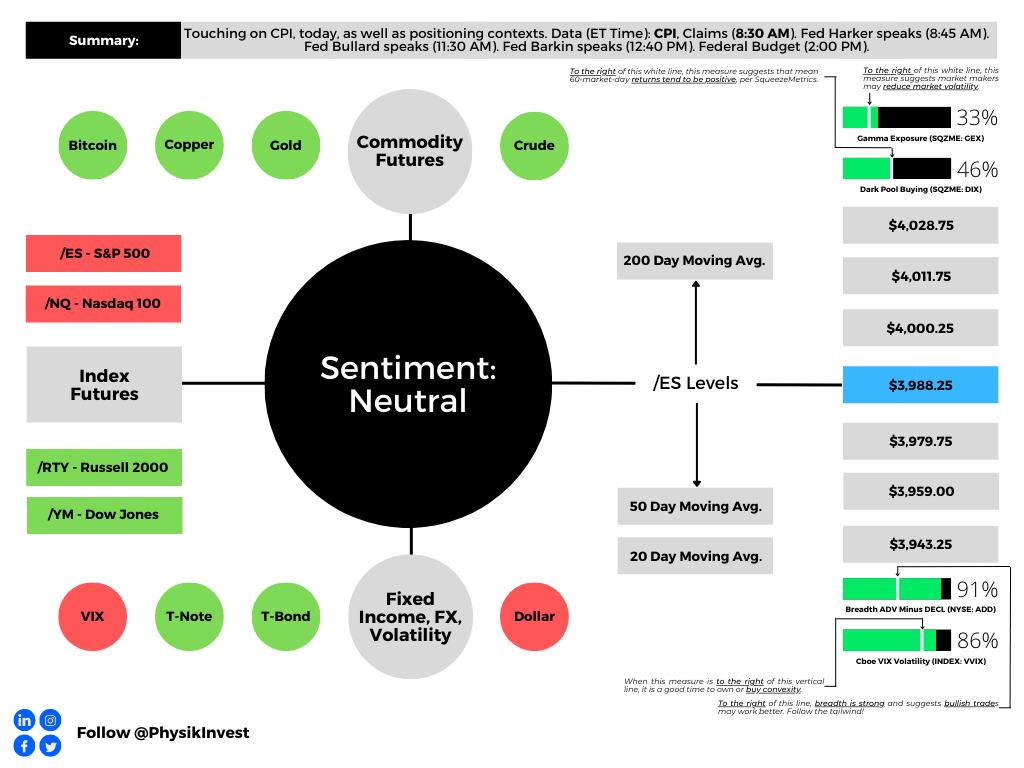
Graphic updated 8:00 AM ET. Sentiment Neutral if expected /ES open is inside of the prior day’s range. /ES levels are derived from the profile graphic at the bottom of this letter. Click here for the latest levels. SqueezeMetrics Dark Pool Index (DIX) and Gamma (GEX) with the latter calculated based on where the prior day’s reading falls with respect to the MAX and MIN of all occurrences available. A higher DIX is bullish. At the same time, the lower the GEX, the more (expected) volatility. Click to learn the implications of volatility, direction, and moneyness. Breadth reflects a reading of the prior day’s NYSE Advance/Decline indicator. The CBOE VIX Volatility Index (INDEX: VVIX) reflects the attractiveness of owning volatility.

Positioning

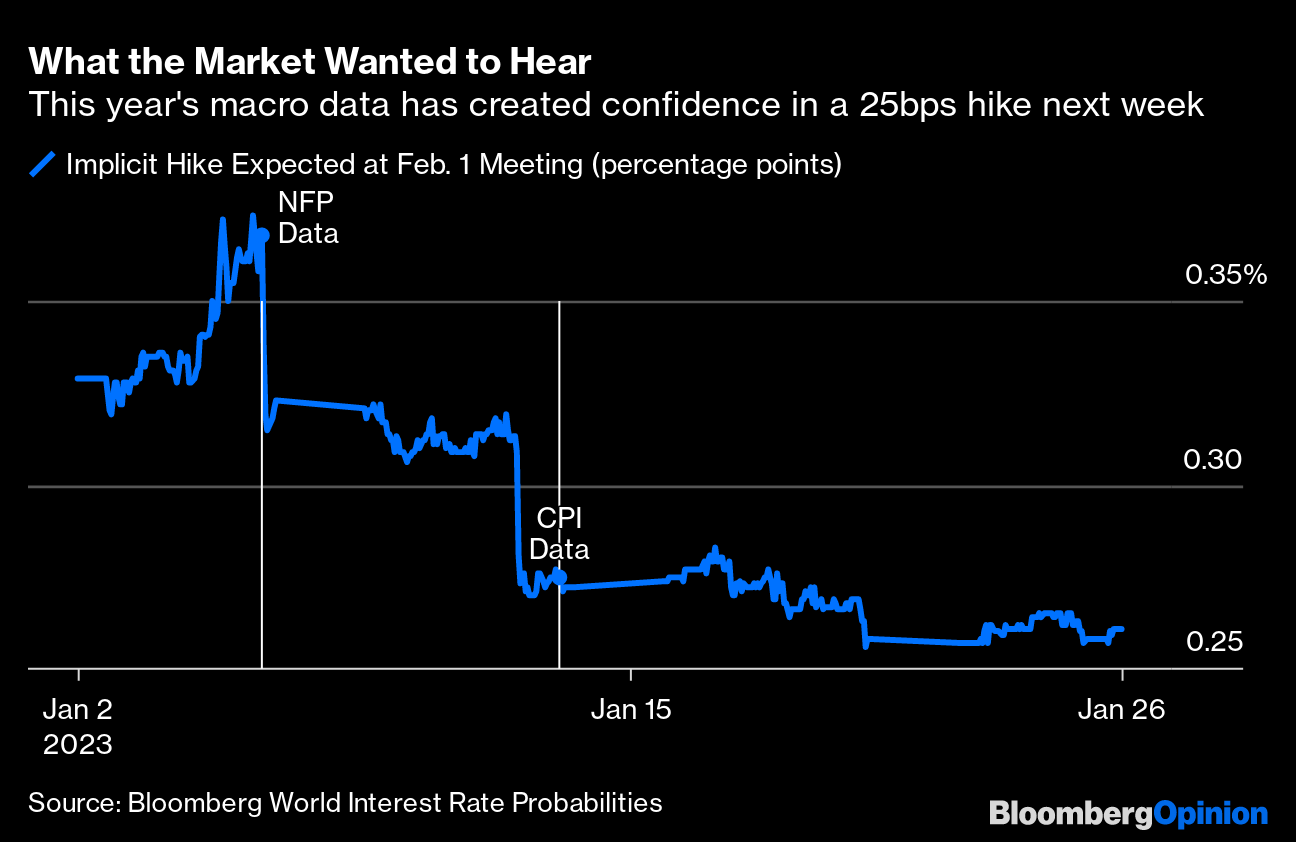
Markets think the Federal Reserve (Fed) raises its benchmark rate by 25 basis points. Notwithstanding the less aggressive hike, strategists believe the Fed will stay tougher on inflation for far longer and, accordingly, crush traders’ optimism.

“I suspect the Fed messaging tomorrow will push back against the pivot narrative and thereby current bond market pricing,” DoubleLine Capital CIO Jeffrey Gundlach said. Former investment banker and trader, as well as the president of the Minneapolis Fed, Neel Kashkari warned the Fed is set on finishing the job and cutting inflation, even if it costs millions of Americans their jobs. “I’ve spent enough time around Wall Street to know that they are culturally, institutionally, optimistic,” he said.

Further, relief in markets (e.g., stocks, housing) is a boon for asset owners and may enable companies to raise cash, bid up equipment prices, and demand new hires. 
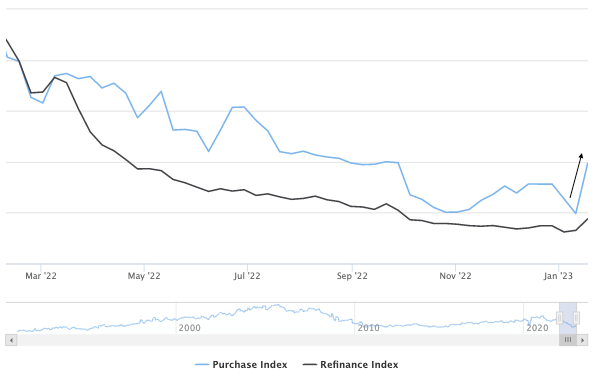
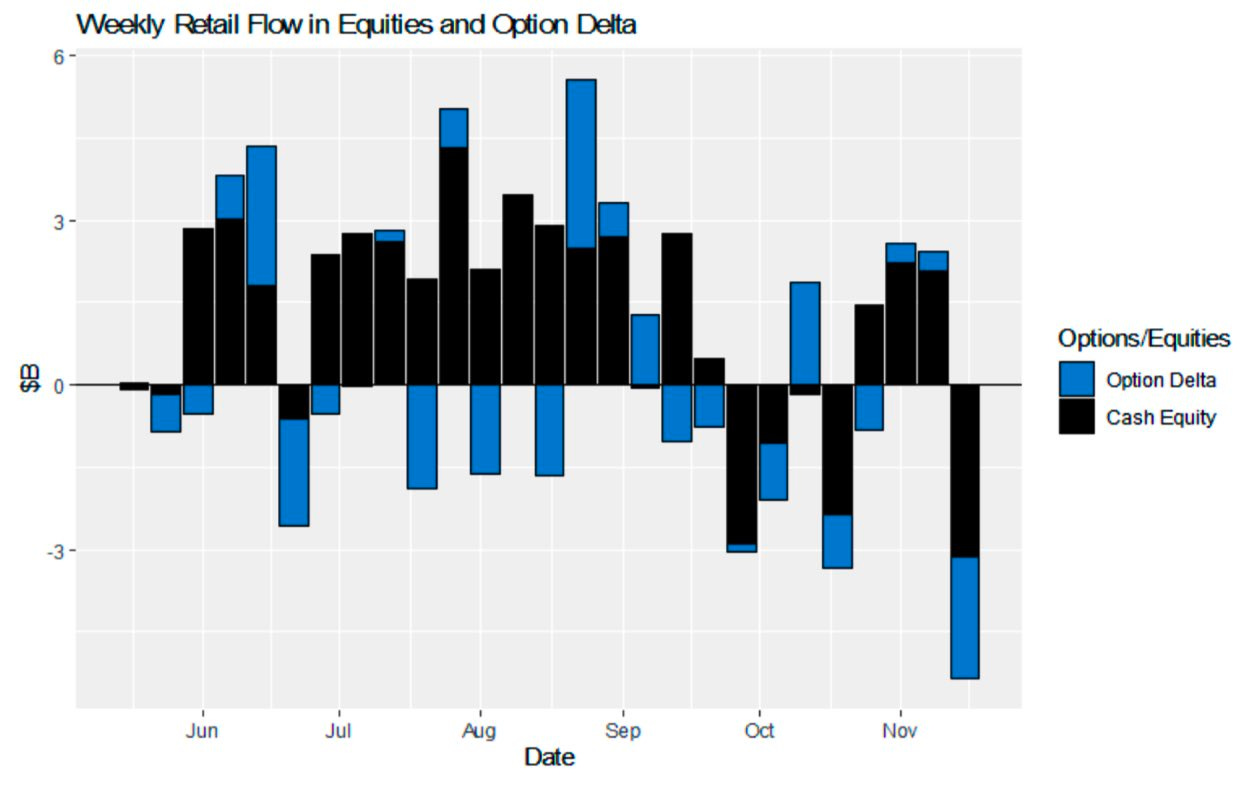
Graphic: Retrieved from Mortgage News Daily. “A trend of [increasing] purchase applications implies home buyer demand is [increasing].” The prevailing narrative is that the Fed wants less inflation and less demand. This narrative’s been disrupted, in part. Recall our Monday letter talking about investors’ desire to put their cash to work and the demand for treasuries (i.e., bond bid and yield pressured) which forced investors into previously depressed assets.

With inflation still a problem, regardless of whether there are better solutions as we put forth in the January 31 letter, the Fed is looking to keep rates above 5% for the rest of 2023, though markets are pricing a pivot far earlier and at a lower rate.
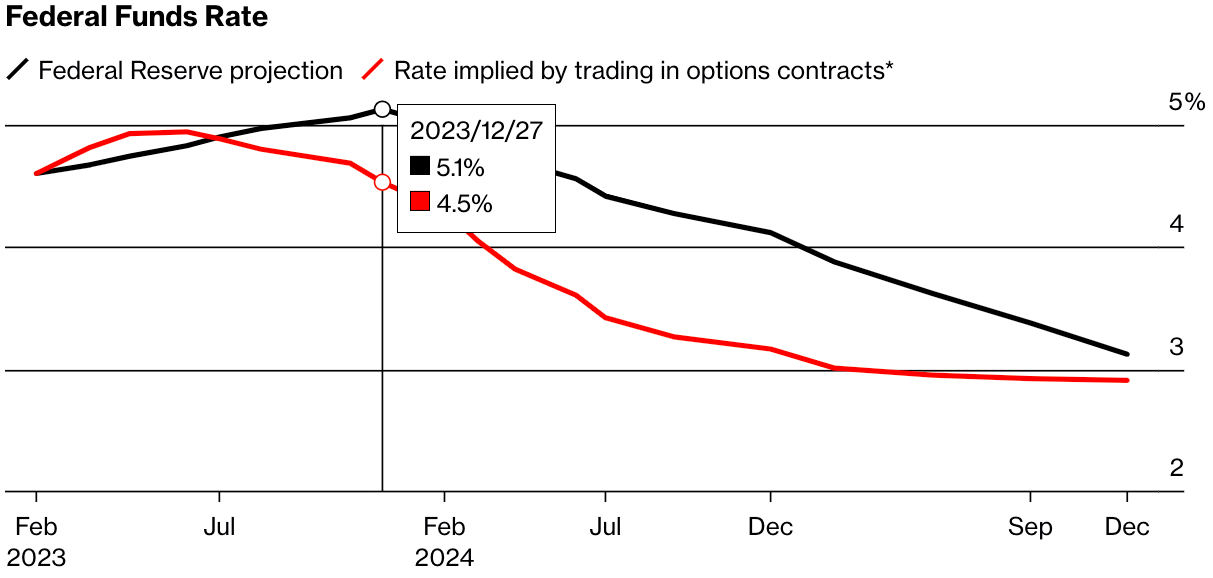
Graphic: Retrieved from Bloomberg.

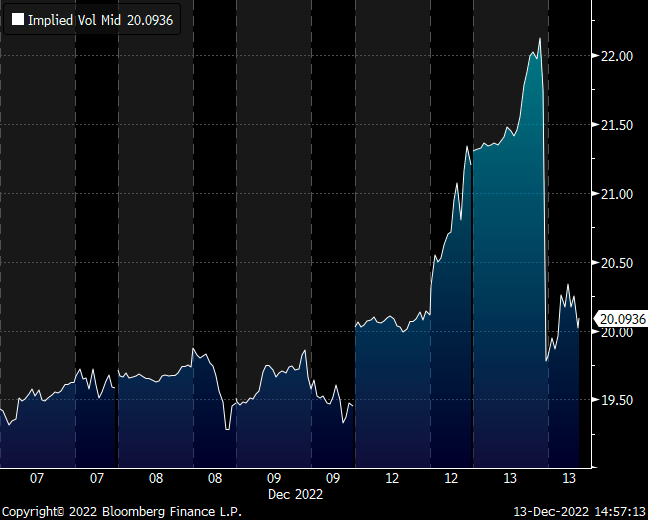
Despite the expectation of toughness from the Fed, markets have not broken down. Rather, if we zoom out, they are trending sideways to higher and may continue to do so. That’s according to Kai Volatility’s Cem Karsan who says that implied volatility (IVOL) is heightened across options with very little time to expiry (1- to 3-days). 

“Event vol, which is the pricing of one-, two-, and three-day options, is significantly higher than everything else behind it right now,” he said, noting that customers’ or traders’ demands for downside put protection is the culprit. That said, despite the committee’s recent hawkishness, “the market responded relatively well at those levels, and you’re seeing vol come back down.”
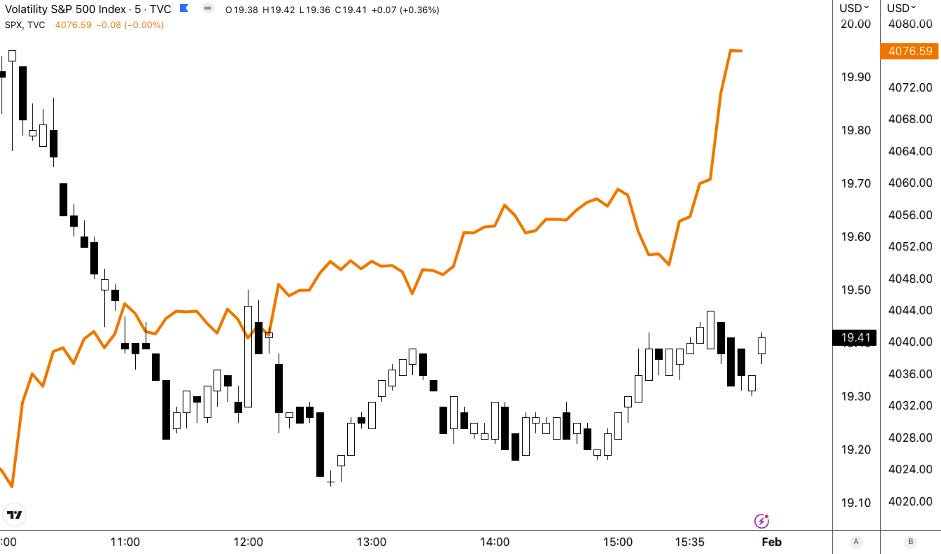
Graphic: Retrieved from TradingView. First included in SpotGamma’s PM Note for 1/31/2023. During Tuesday’s strength, measures of IVOL, such as the Cboe Volatility Index (INDEX: VIX) fell, though the VIX did not move lower in as sharp of a fashion that the S&P 500 (INDEX: SPX) traded higher. In fact, the VIX trended up into the close, after a mid-day bottom, suggesting some left-over hedging demands ahead of some important macroeconomic drivers this week.

“I think that’s kind of likely what you’re going to see, regardless of what the Fed does,” Karsan added. That’s because, barring some unexpected development, traders will not be able to justify the pricing of ultra-short-dated options post-Fed; the supply and expiry of short-dated options will coincide with the dealers or market makers who are short-stock against the puts they supplied buying back their hedges.

“Vol structurally affects how markets move. Puts are the way people hedge in the market and dealers are short the puts. If you have an event vol that comes down, those vanna and charm effects will naturally lead to a buyback,” post-Fed.

For context, vanna is the change in an options delta with respect to changes in IVOL. Charm is the change in an options delta with respect to changes in time. These are second-order derivatives of an option’s value, once to time or IVOL, and once to delta.

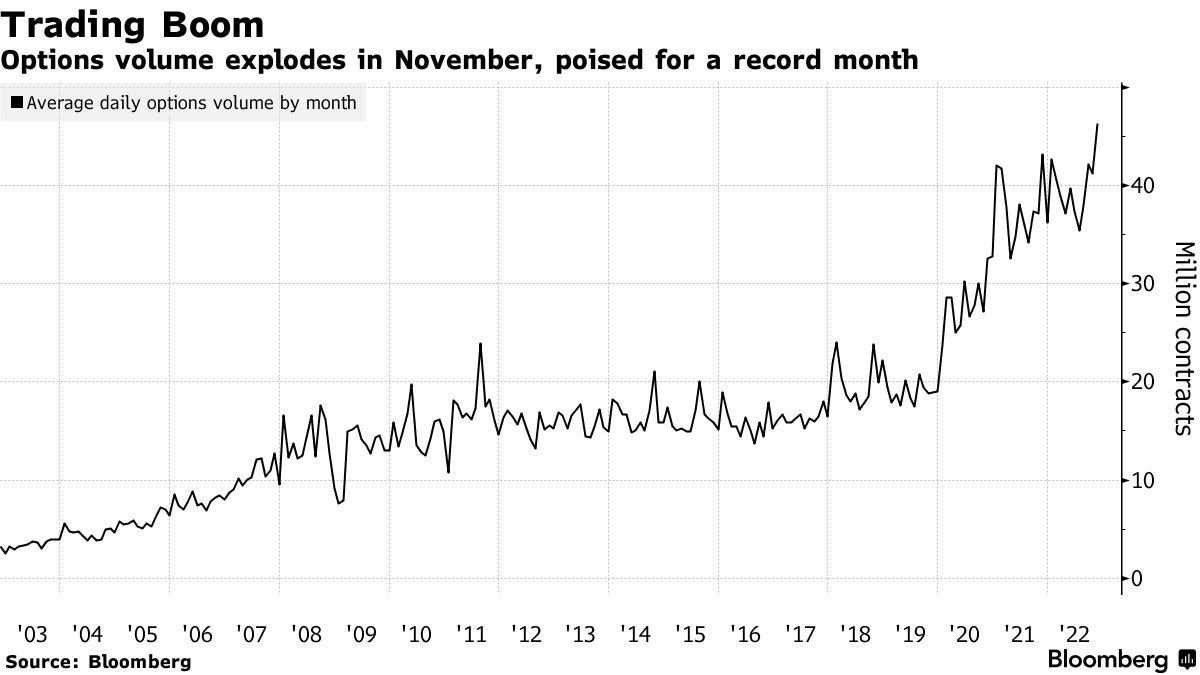
As your letter writer explained in a SpotGamma analysis yesterday, we saw an interest to hedge heading into this week’s Fed announcement. This coincided with a slight rebound in measures like the Cboe VIX Volatility (INDEX: VVIX) (which, in general, reads low and suggests convexity is a good place to be), and put a damper on the rally, hence its climax on Friday.
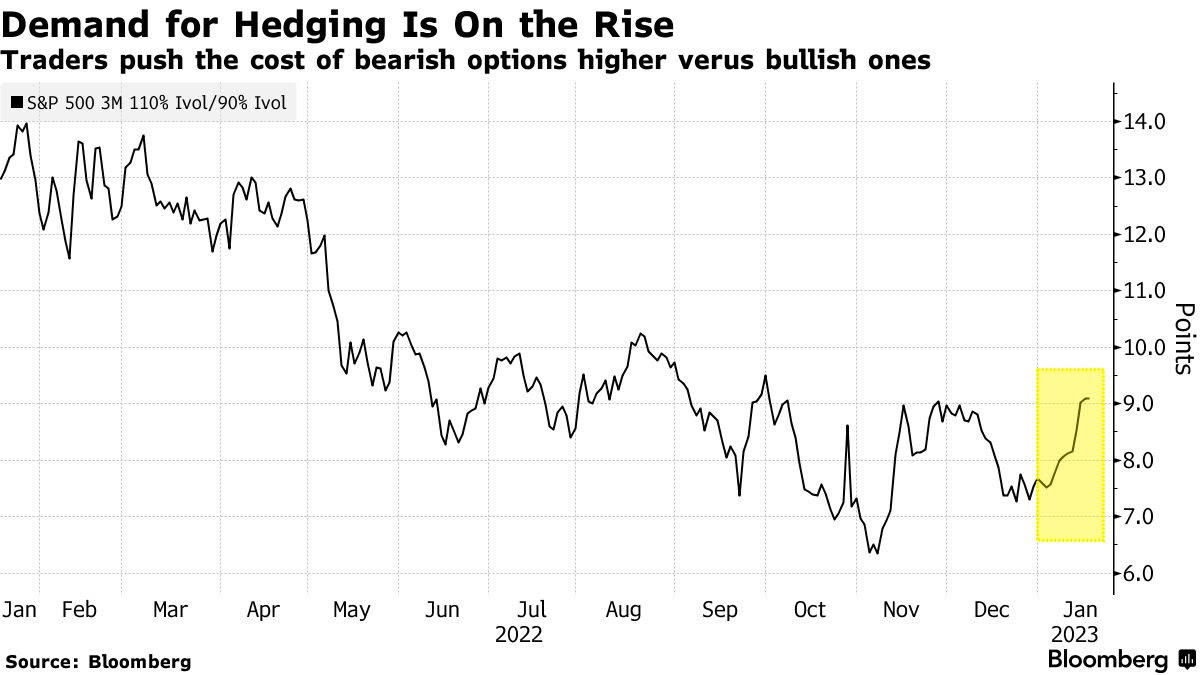
Graphic: Retrieved from Bloomberg.

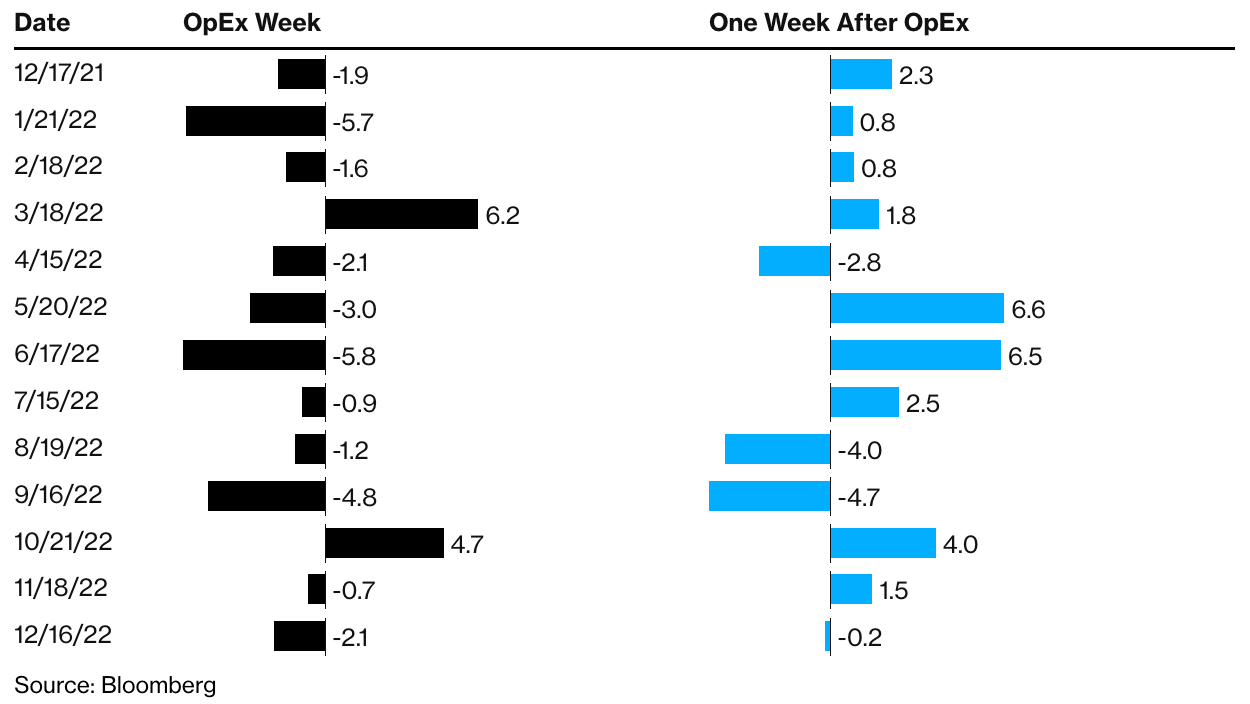
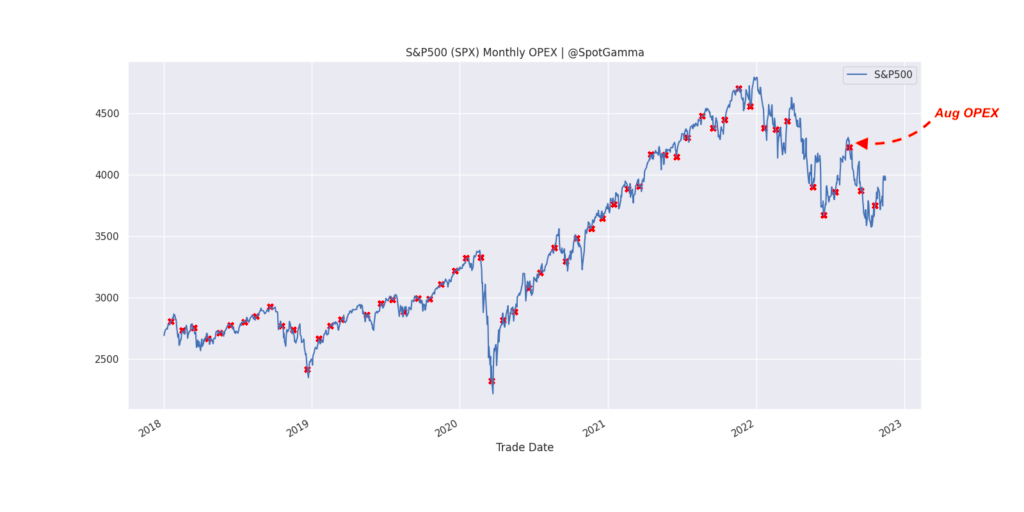
Moreover, if “macroeconomic events do not disappoint, IVOL compression may provide markets a boost,” SpotGamma explained. “Notwithstanding, the marginal compression of heightened IVOL, because of its lower starting point, probably does less to encourage a longer-lasting rally,” hence the thought that, if there was to be relief post-Fed, it would likely last up until the mid-February monthly options expiration (OpEx). OpEx’s removal of traders’ options protection (as well as dealers’ supportive buyback to those options that were demanded), may leave the market at risk of bearish macro-type flows.

Compounding the risk is traders’ expected reaction in case of weakness. The desire to hedge during a drop would coincide with a re-pricing in IVOL dangerous to anyone who is short volatility, hence this letter’s recent focus on owning the S&P 500 (INDEX: SPX) via call butterflies and call ratio spreads, the sorts of trades that would benefit from an SPX and VIX up environment (the result of traders bidding up call options due to their fear of missing out, in the context of less liquidity to absorb those demands).

To summarize everything, we have the Fed rate decision coming up. After, markets will be volatile but more likely to trend higher into mid-February, bolstered by traders’ fears of missing out in the context of a lower liquidity environment, as well as stimulus (e.g., falling Treasury General Account played into an easing of financial conditions by making it easier for banks to lend and finance trading activities). After mid-February, the window for markets to weaken and accelerate to the downside may open, based on the information we have today.

As an aside, the last time the Nasdaq 100 (INDEX: NDX) was up more than 10% in January was in 2001, The Market Ear informed subscribers yesterday.
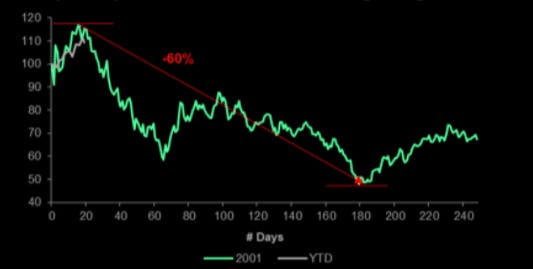
Graphic: Retrieved from BNP Paribas ADR (OTC: BNPQY) via The Market Ear.

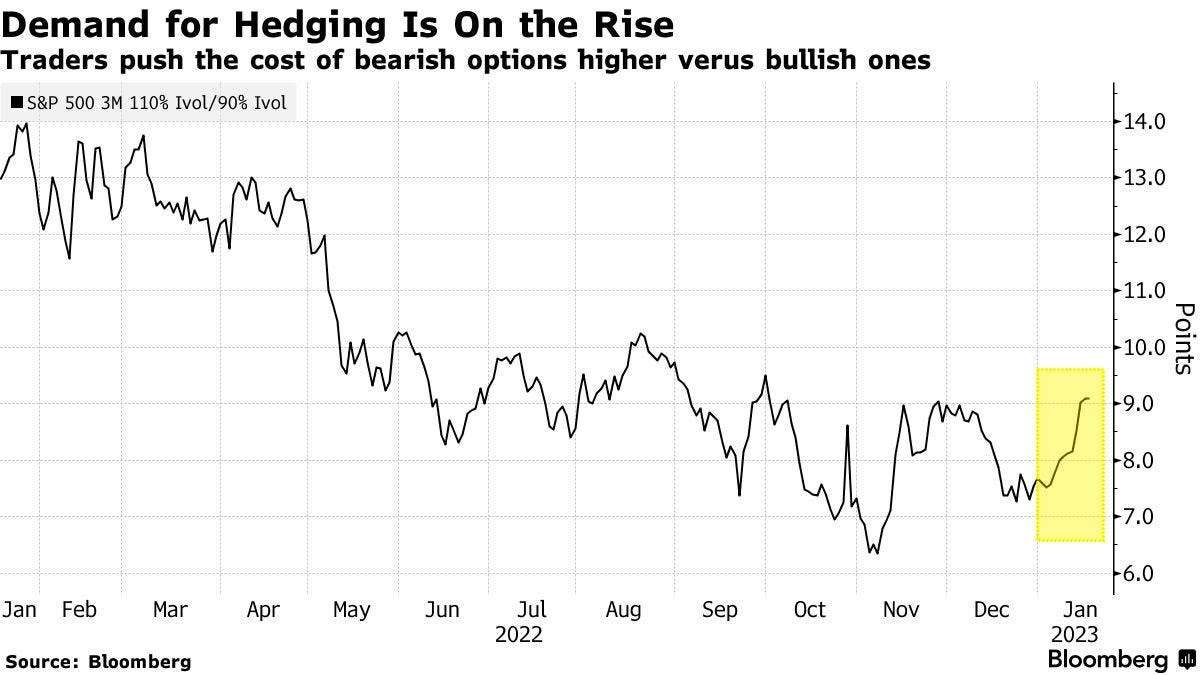
Should you wish to hedge, longer-dated SPX IVOL is cheap, relative to recent history.
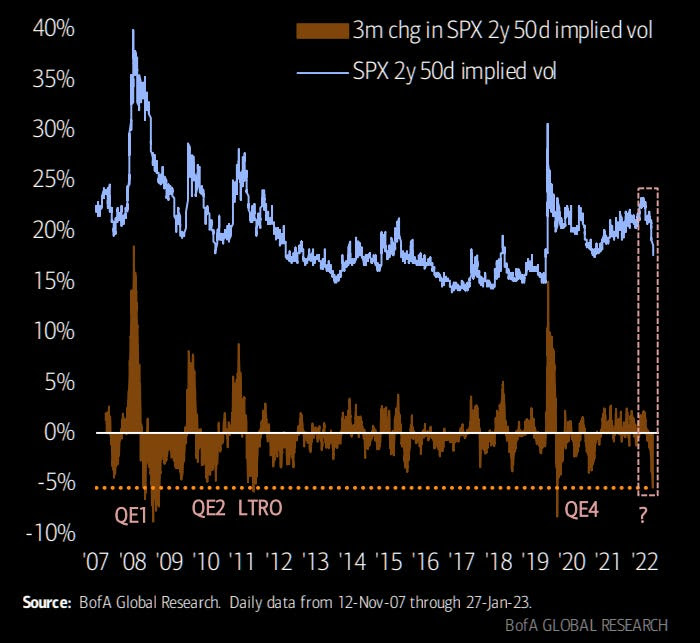
Graphic: Retrieved from Bank of America Corporation (NYSE: BAC) via The Market Ear.

Finally, if you’re interested in following further along the fundamental conversation in Tuesday’s letter, check out Dr. Pippa Malmgren’s post on “ancient empires springing back to life.”

Technical

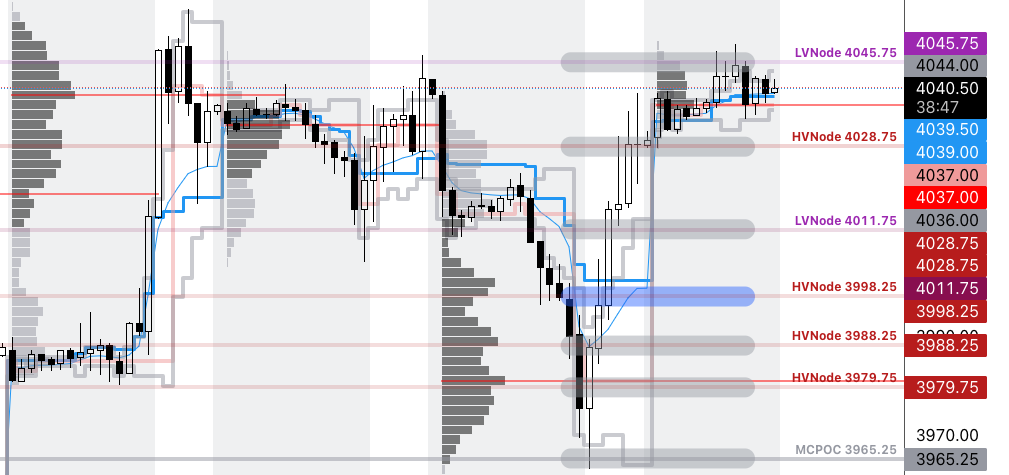
As of 8:00 AM ET, Wednesday’s regular session (9:30 AM – 4:00 PM ET), in the S&P 500, is likely to open in the middle part of a negatively skewed overnight inventory, inside of the prior range, suggesting a limited potential for immediate directional opportunity.

The S&P 500 pivot for today is $4,087.00. 

Key levels to the upside include $4,100.25, $4,122.50, and $4,136.75.

Key levels to the downside include $4,071.50, $4,055.00, and $4,028.75.

Disclaimer: Click here to load the updated key levels via the web-based TradingView platform. New links are produced daily. Quoted levels hold weight barring an exogenous development.
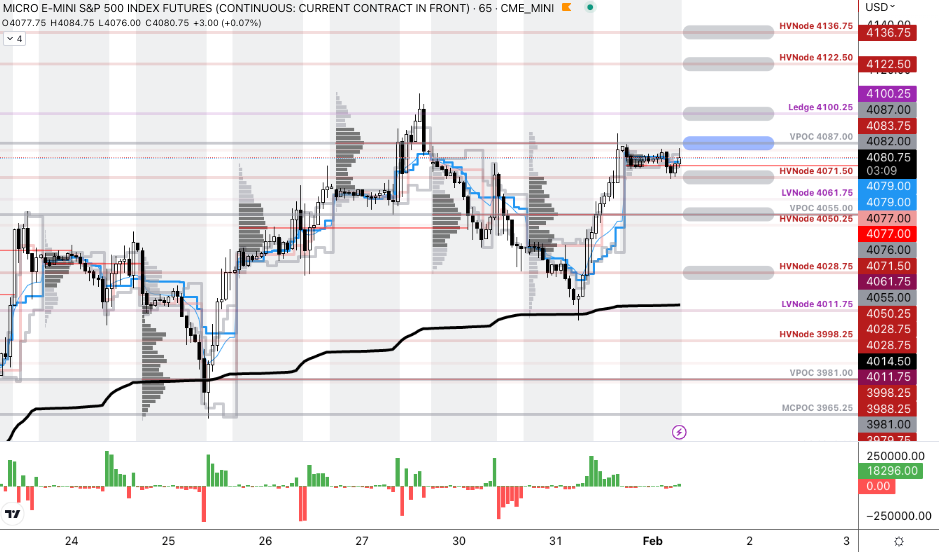
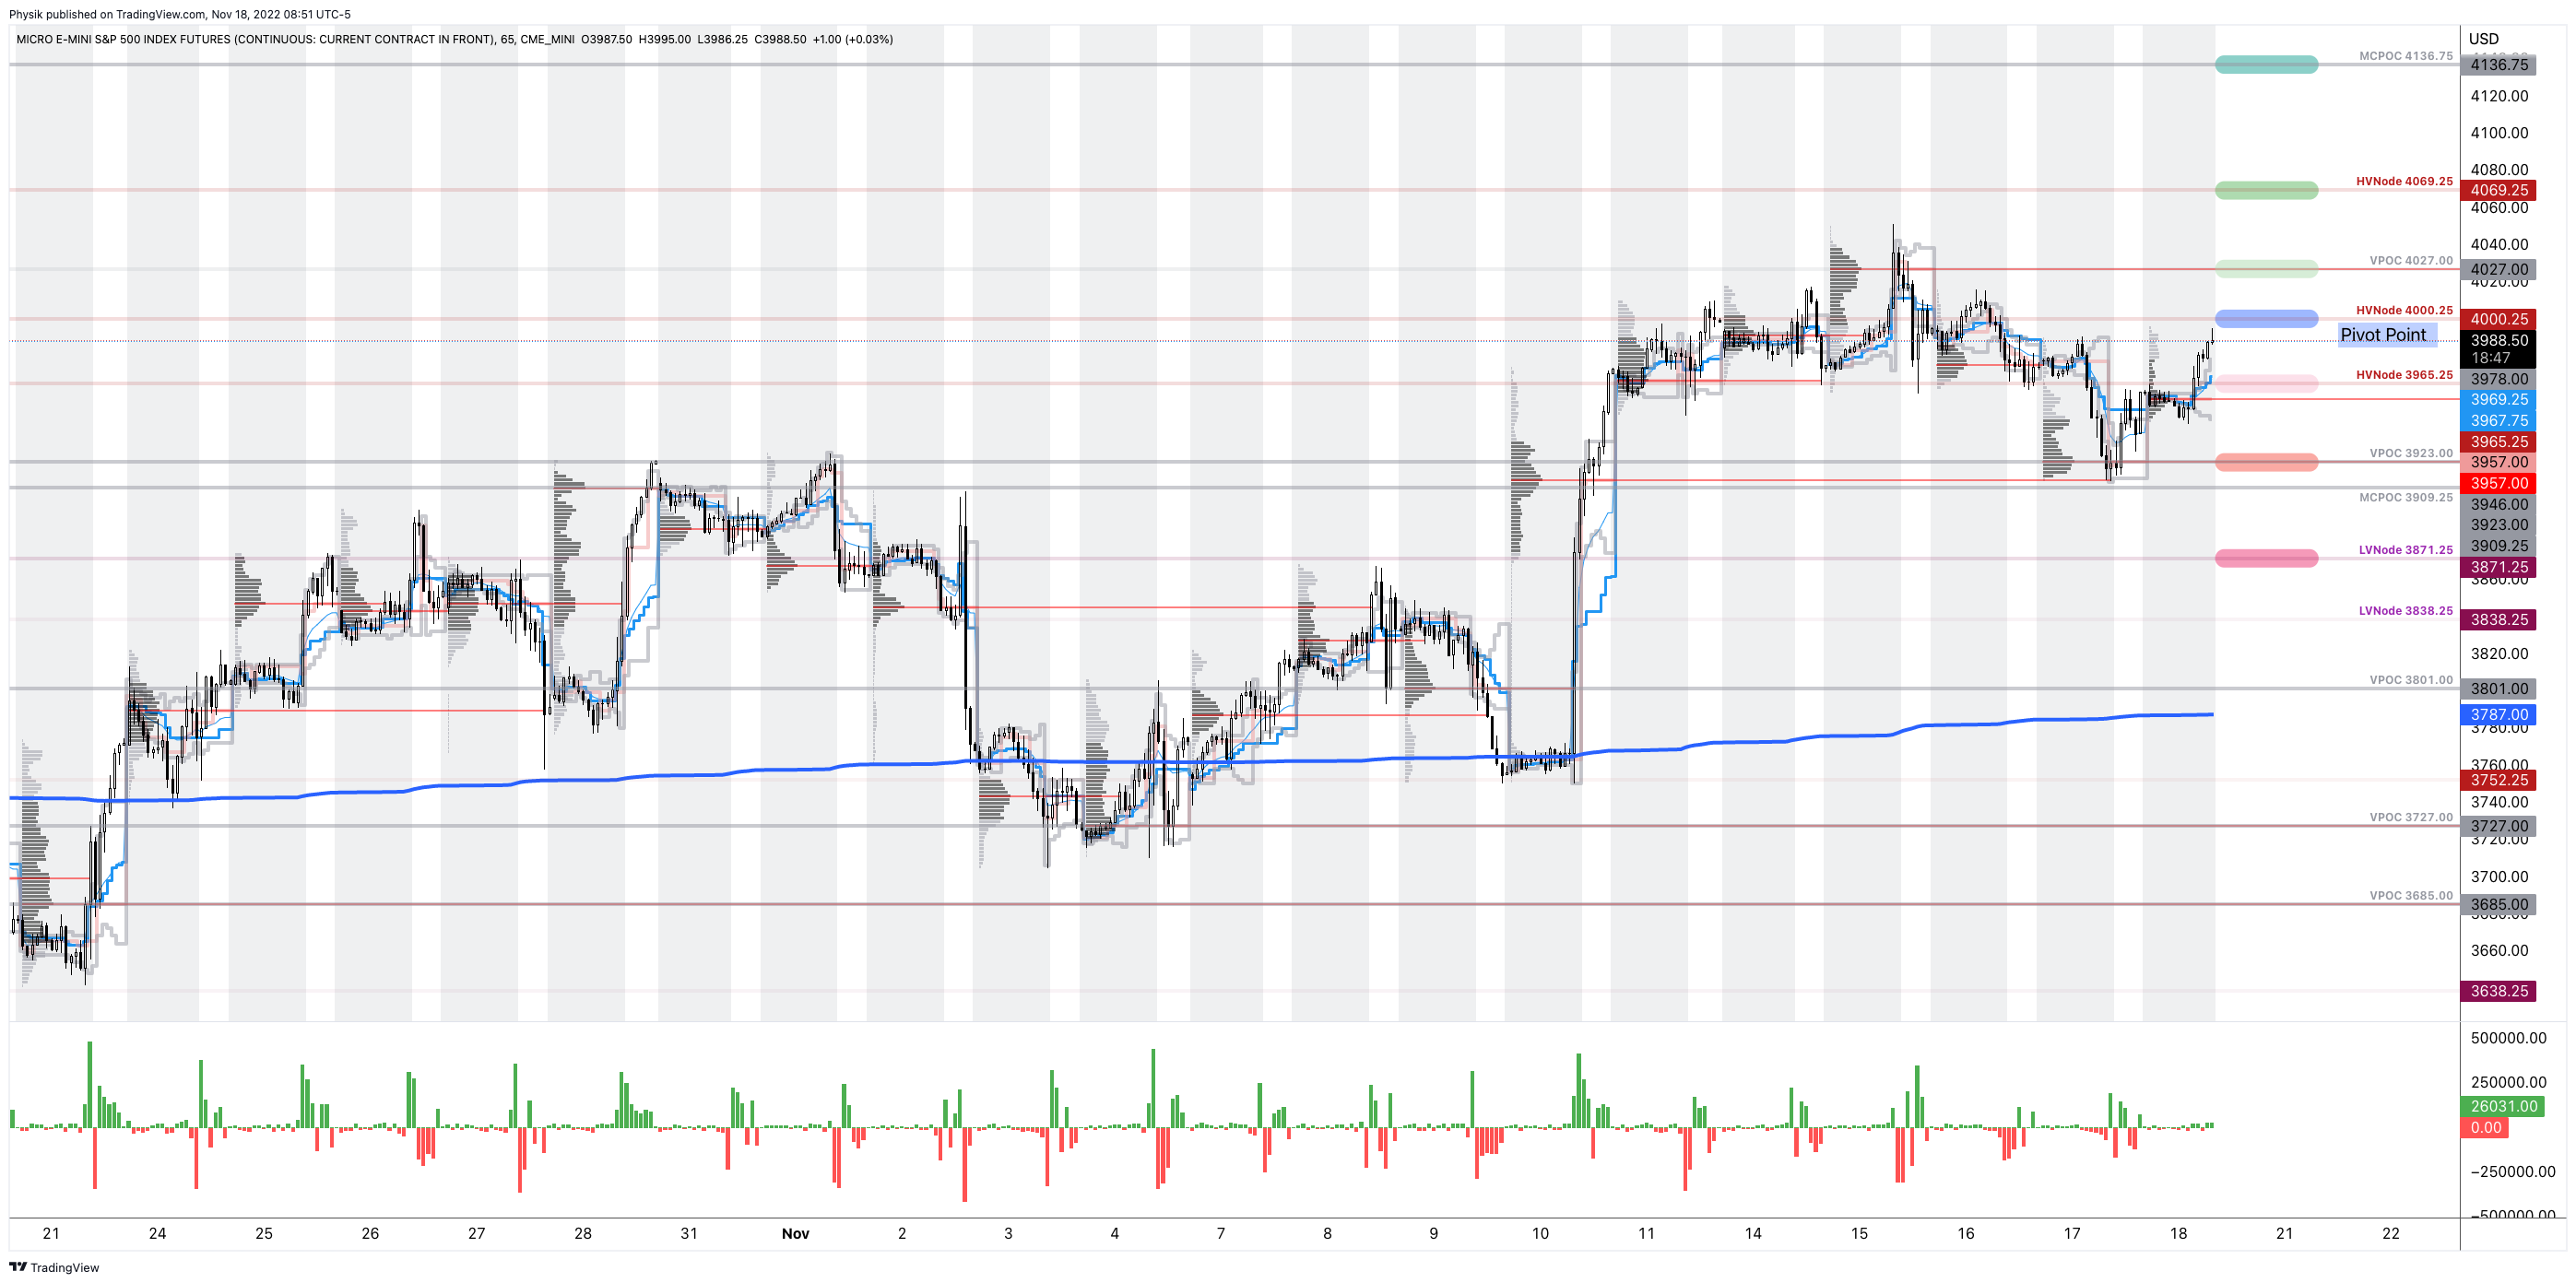
Graphic: 65-minute profile chart of the Micro E-mini S&P 500 Futures.

Definitions

Volume Areas: Markets will build on areas of high-volume (HVNodes). Should the market trend for a period of time, this will be identified by a low-volume area (LVNodes). The LVNodes denote directional conviction and ought to offer support on any test.

If participants auction and find acceptance in an area of a prior LVNode, then future discovery ought to be volatile and quick as participants look to the nearest HVNodes for more favorable entry or exit.

POCs: Areas where two-sided trade was most prevalent in a prior day session. Participants will respond to future tests of value as they offer favorable entry and exit.


About

In short, Renato Leonard Capelj is an economics graduate working in finance and journalism.

Capelj spends most of his time as the founder of Physik Invest through which he invests and publishes daily analyses to subscribers, some of whom represent well-known institutions.

Separately, Capelj is an equity options analyst at SpotGamma and an accredited journalist interviewing global leaders in business, government, and finance.

Past works include conversations with investor Kevin O’Leary, ARK Invest’s Catherine Wood, FTX’s Sam Bankman-Fried, Lithuania’s Minister of Economy and Innovation Aušrinė Armonaitė, former Cisco chairman and CEO John Chambers, and persons at the Clinton Global Initiative.

Contact

Direct queries to renato@physikinvest.com or Renato Capelj#8625 on Discord.

Calendar

You may view this letter’s content calendar at this link.

Disclaimer

Do not construe this newsletter as advice. All content is for informational purposes.

Categories
Commentary

Daily Brief For January 30, 2023

Physik Invest’s Daily Brief is read by thousands of subscribers. You, too, can join this community to learn about the fundamental and technical drivers of markets.

Graphic updated 8:45 AM ET. Sentiment Risk-Off if expected /ES open is below the prior day’s range. /ES levels are derived from the profile graphic at the bottom of this letter. Click here for the latest levels. SqueezeMetrics Dark Pool Index (DIX) and Gamma (GEX) with the latter calculated based on where the prior day’s reading falls with respect to the MAX and MIN of all occurrences available. A higher DIX is bullish. At the same time, the lower the GEX, the more (expected) volatility. Click to learn the implications of volatility, direction, and moneyness. Breadth reflects a reading of the prior day’s NYSE Advance/Decline indicator. The CBOE VIX Volatility Index (INDEX: VVIX) reflects the attractiveness of owning volatility.

Fundamental

Since the start of 2023, markets have trended higher. This has coincided with traders’ expectations that inflation has peaked and the pace of tightening should slow or peak soon, China re-opening, and the aversion of an energy crisis abroad, given a warmer-than-expected winter.

Graphic: Retrieved from Bloomberg.

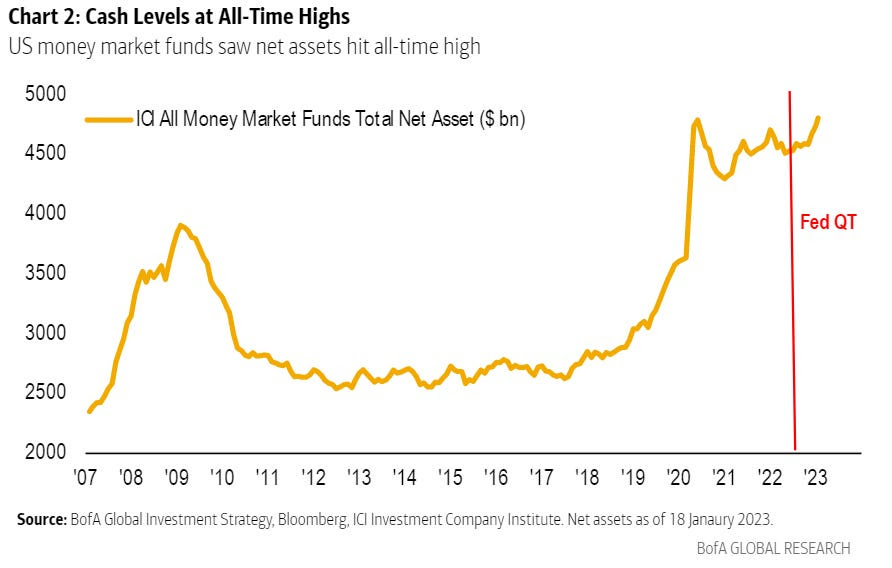
Investors continue to sit on a lot of cash, at this time. 

Graphic: Retrieved from Bank Of America Corporation (NYSE: BAC) via Bloomberg.

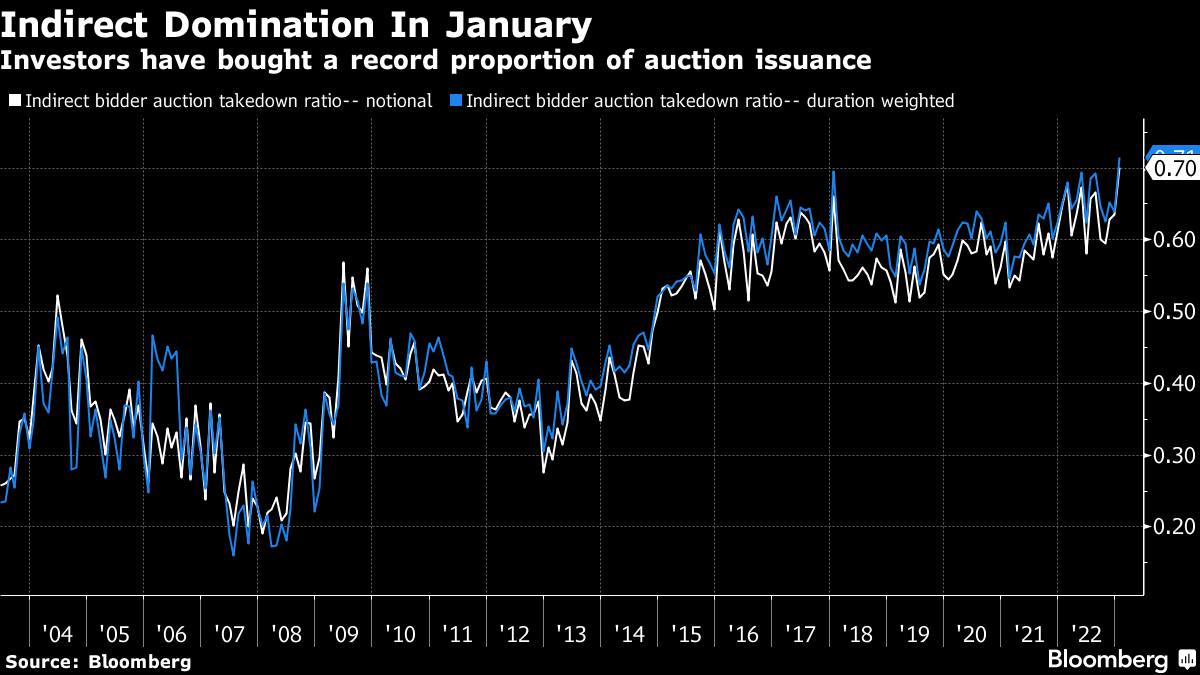
Some, in their desire to put their cash to work, have demanded Treasuries.

Graphic: Retrieved from Bloomberg. “Each of the Treasury auctions this month were awarded at a yield lower than expected based on pre-sale trading, known as ‘stopping through’ — meaning that demand was strong. Primary dealers (who are obligated to bid) in Thursday’s $35 billion offering of seven-year notes picked up just 6.1% of the securities, the smallest in any Treasury note or bond auction in data going back to 2003.”

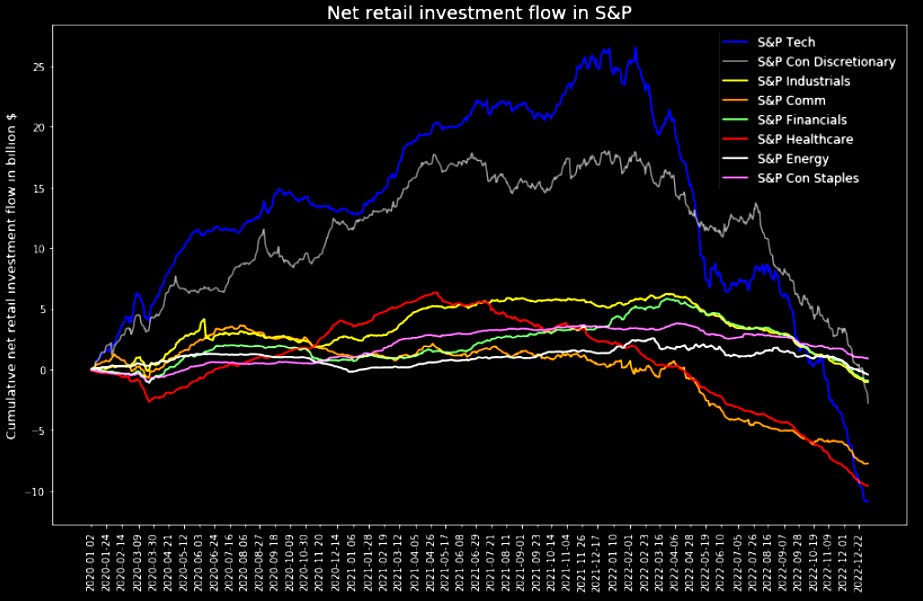
Strong demand during Treasury auctions (i.e., bond bid and yield pressured), as some suggest, is forcing investors into previously depressed equities which Goldman Sachs Group Inc (NYSE: GS) showed investors selling heavily leading up to 2023.

Graphic: Retrieved from Goldman Sachs Group Inc (NYSE: GS) via The Market Ear.

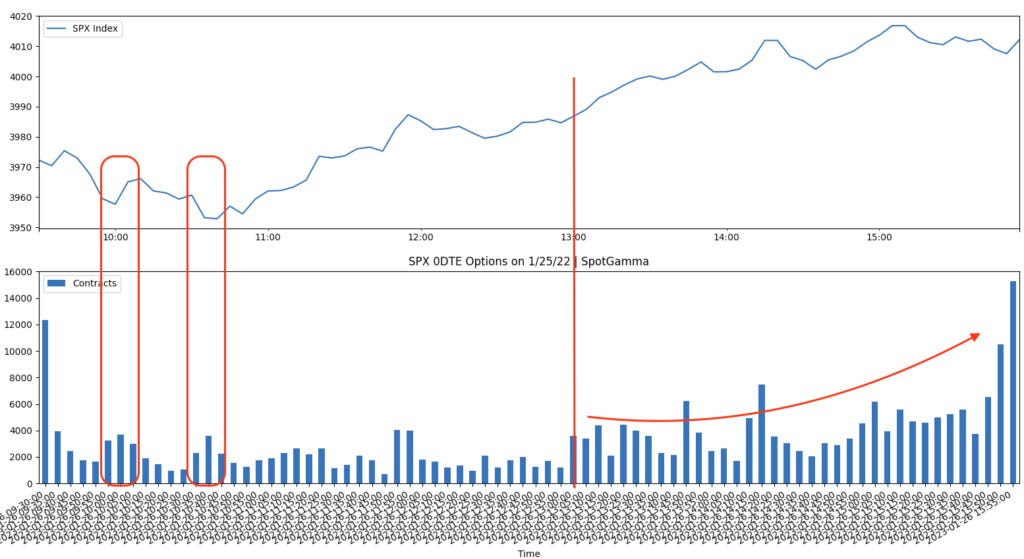
In fact, Treasury auctions have coincided with big demand for short-dated exposure to call options and short-covering.

Graphic: Retrieved from SpotGamma’s Weekend Note. “Last week’s bullishness appeared to be bolstered by very strong treasury auctions, which ignited the trade of short-dated (i.e., 0 DTE) call options. You can see this relationship in the image below wherein large 0DTE options flow (bottom) were triggered by the 1 PM ET treasury auction (red vertical line).”

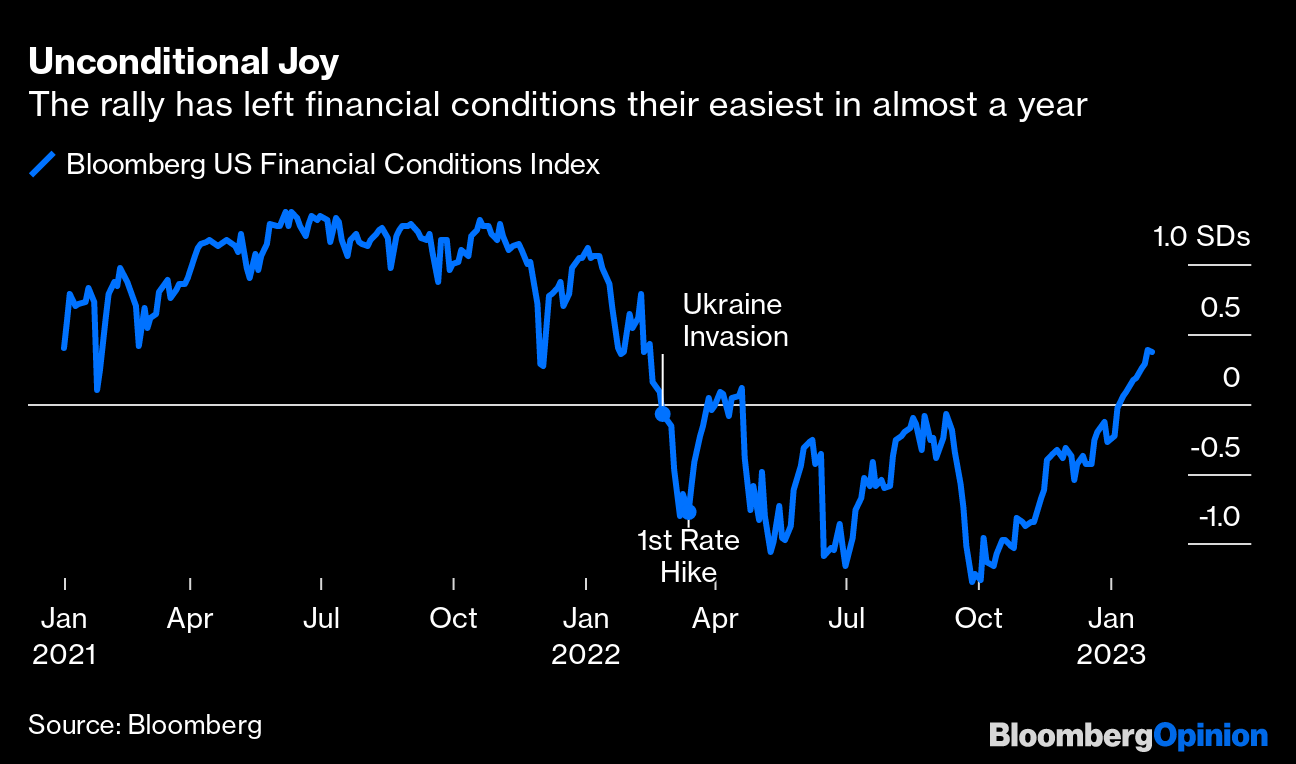
Additionally, the markets have enjoyed a liquidity boost, also a driver of equity market relief. The Treasury General Account (TGA), or the government’s checking account, if we will, was driven down and played into an easing of financial conditions which has benefitted stocks.

Graphic: Retrieved from Bloomberg.

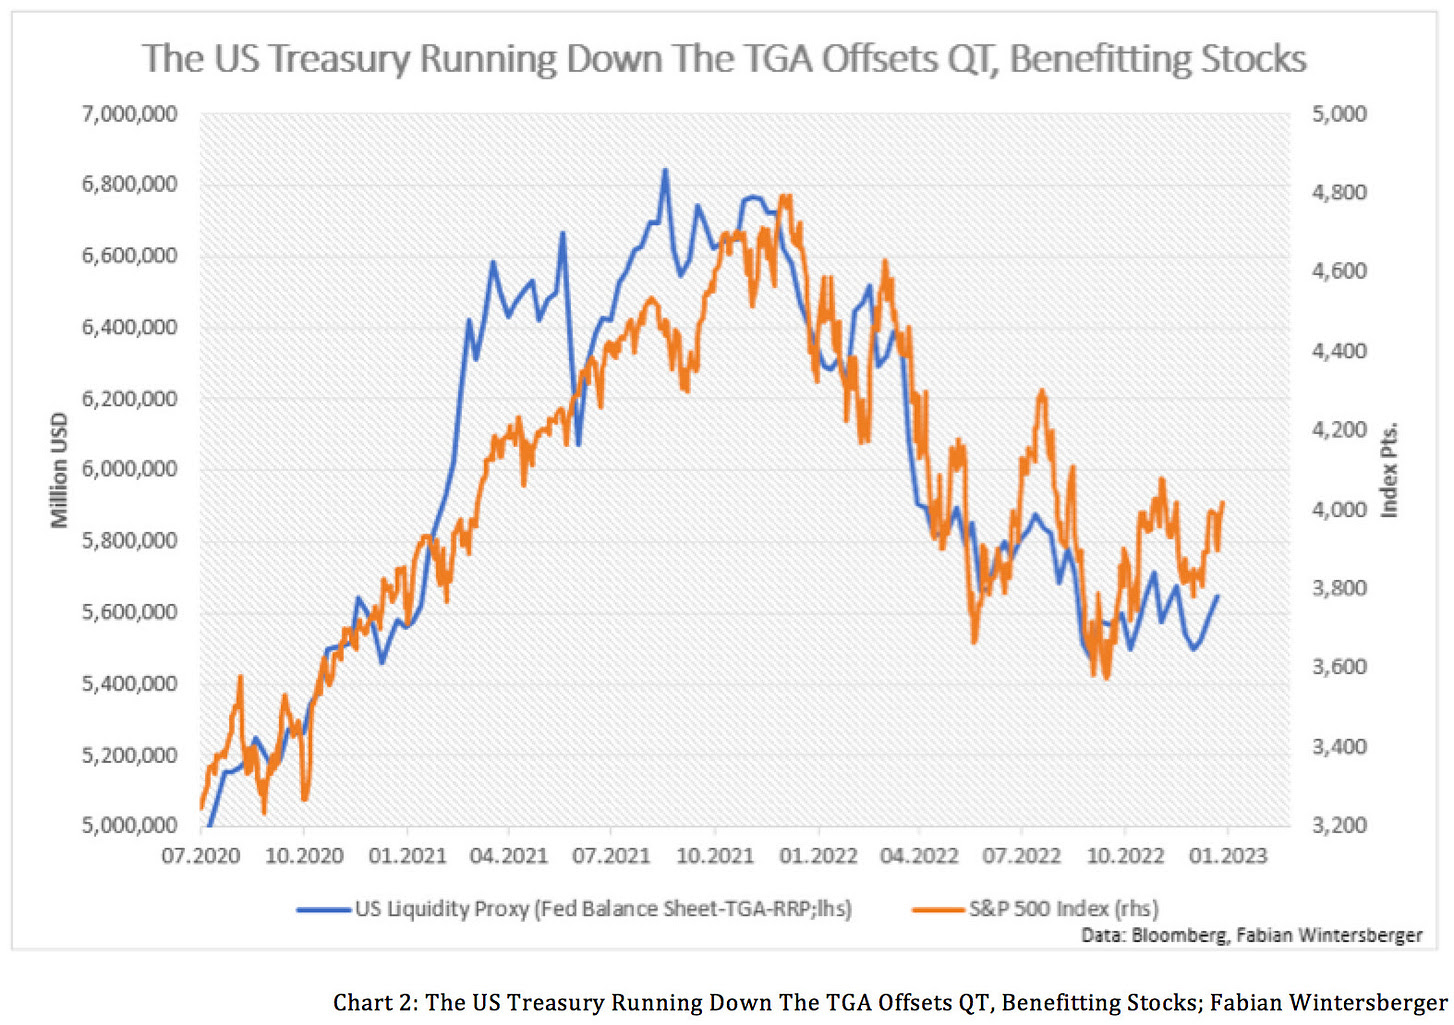
Per past letters, we note that a falling TGA is likely to be accompanied by a rise in bank reserves (liabilities to the Fed), increasing the room banks have to lend and finance trading activities which add to market liquidity. This added market liquidity, some suggest, is due to the debt ceiling. Consequently, once a debt ceiling deal is signed, run for the hills!

Graphic: Retrieved from Fabian Wintersberger. “One driving factor is the US is facing its debt ceiling (again). Hence, the US treasury needs to run off its Treasury General Account, which injects liquidity into markets from which stock markets benefit.”

Morgan Stanley (NYSE: MS) concurs:

“[T]he single most important driver of equities over the last year has been excess liquidity, and it’s about to turn more restrictive. The amount of liquidity in the system is about to change again – the Treasury is increasing bill issuance sizes, which will drain liquidity from the system. The Treasury could build cash by more than $200 billion over the span of a month – which on top of QT will effectively drain nearly $300 billion from bank reserves – which implies the S&P 500 should be 6% lower over the net month.”

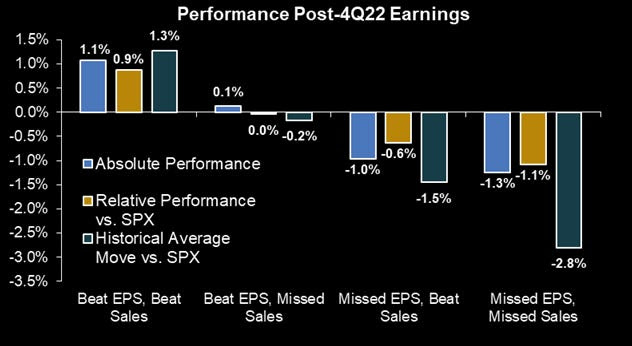
Anyways, strategists think markets are underestimating the Fed which is likely to keep rates higher for longer. There are not enough restrictions to reduce inflation. This would ultimately boost capital costs, leading to earnings misses and lower EPS.

Graphic: Retrieved from Morgan Stanley (NYSE: MS) via The Market Ear. “[M]isses, both on revenue and margin, were not punished as much as they have been historically.”

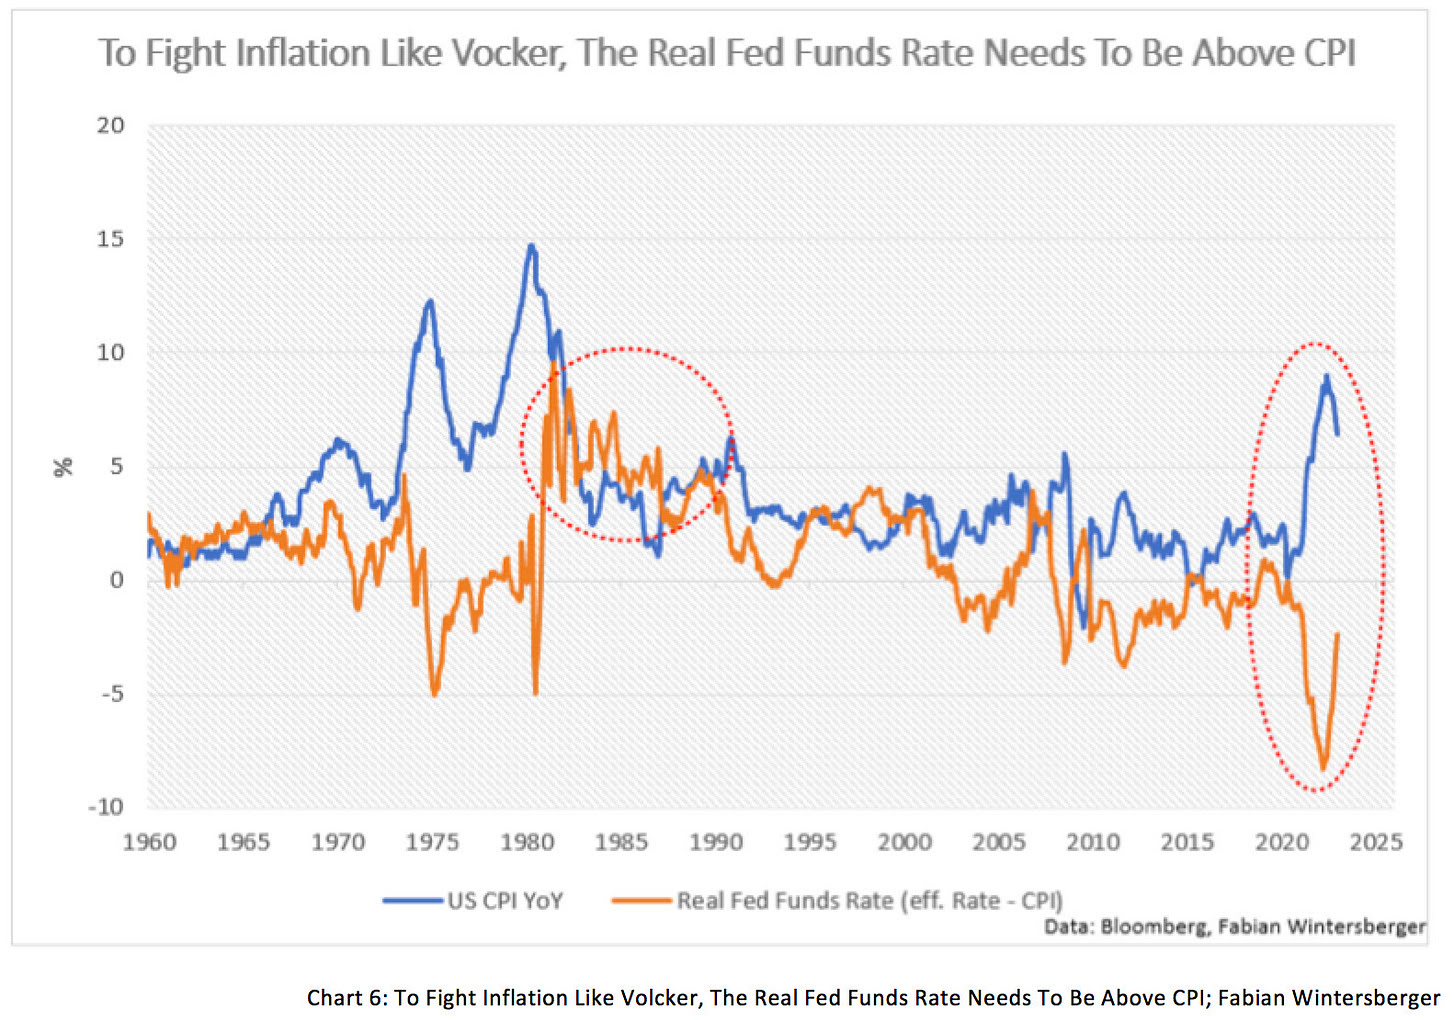
If this market strength is, in part, the result of a so-called front-running of the Fed’s pivot from tightening, either the failure to realize a pivot or an eventual pivot may be followed by the markets selling (i.e., buy the rumor and sell the news scenario). 

Graphic: Retrieved from Fabian Wintersberger. “Neither the ECB nor the Fed is restrictive enough to bring inflation back to 2 %. A look at the Volcker era shows that it is necessary to increase real interest rates above the inflation rate for a prolonged period to achieve that.”

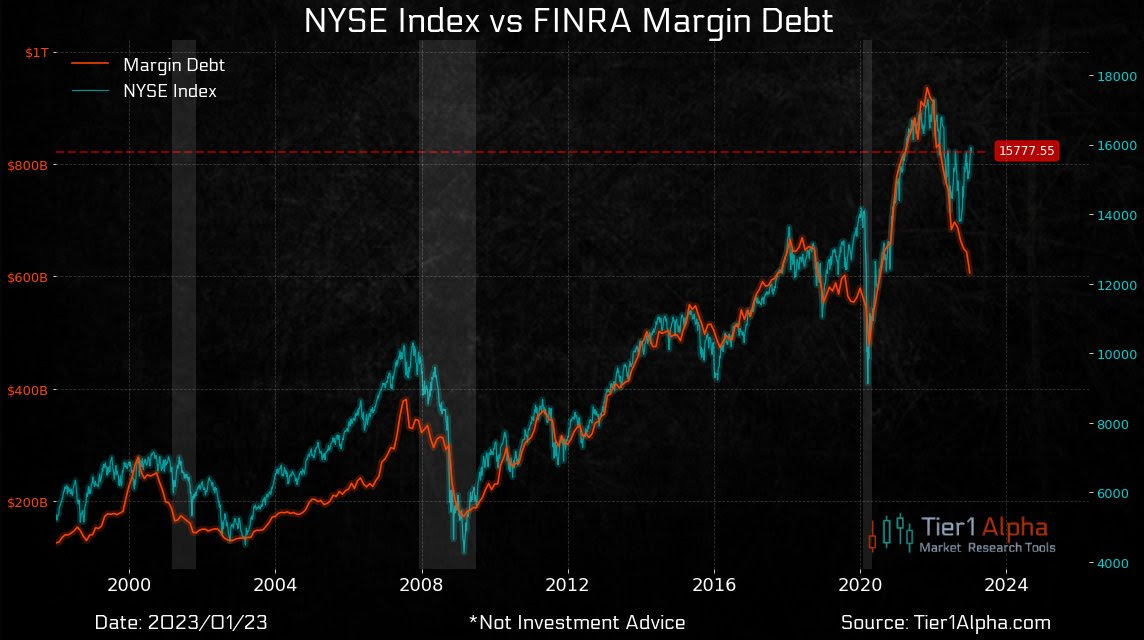
A chart to tack on here at the end of the section is FINRA margin debt versus the S&P 500 (INDEX: SPX). In short, this measure is not supportive of the move up in stocks. More on this sometime later. Take care!

Graphic: Retrieved from Tier1Alpha via Callum Thomas.

Technical

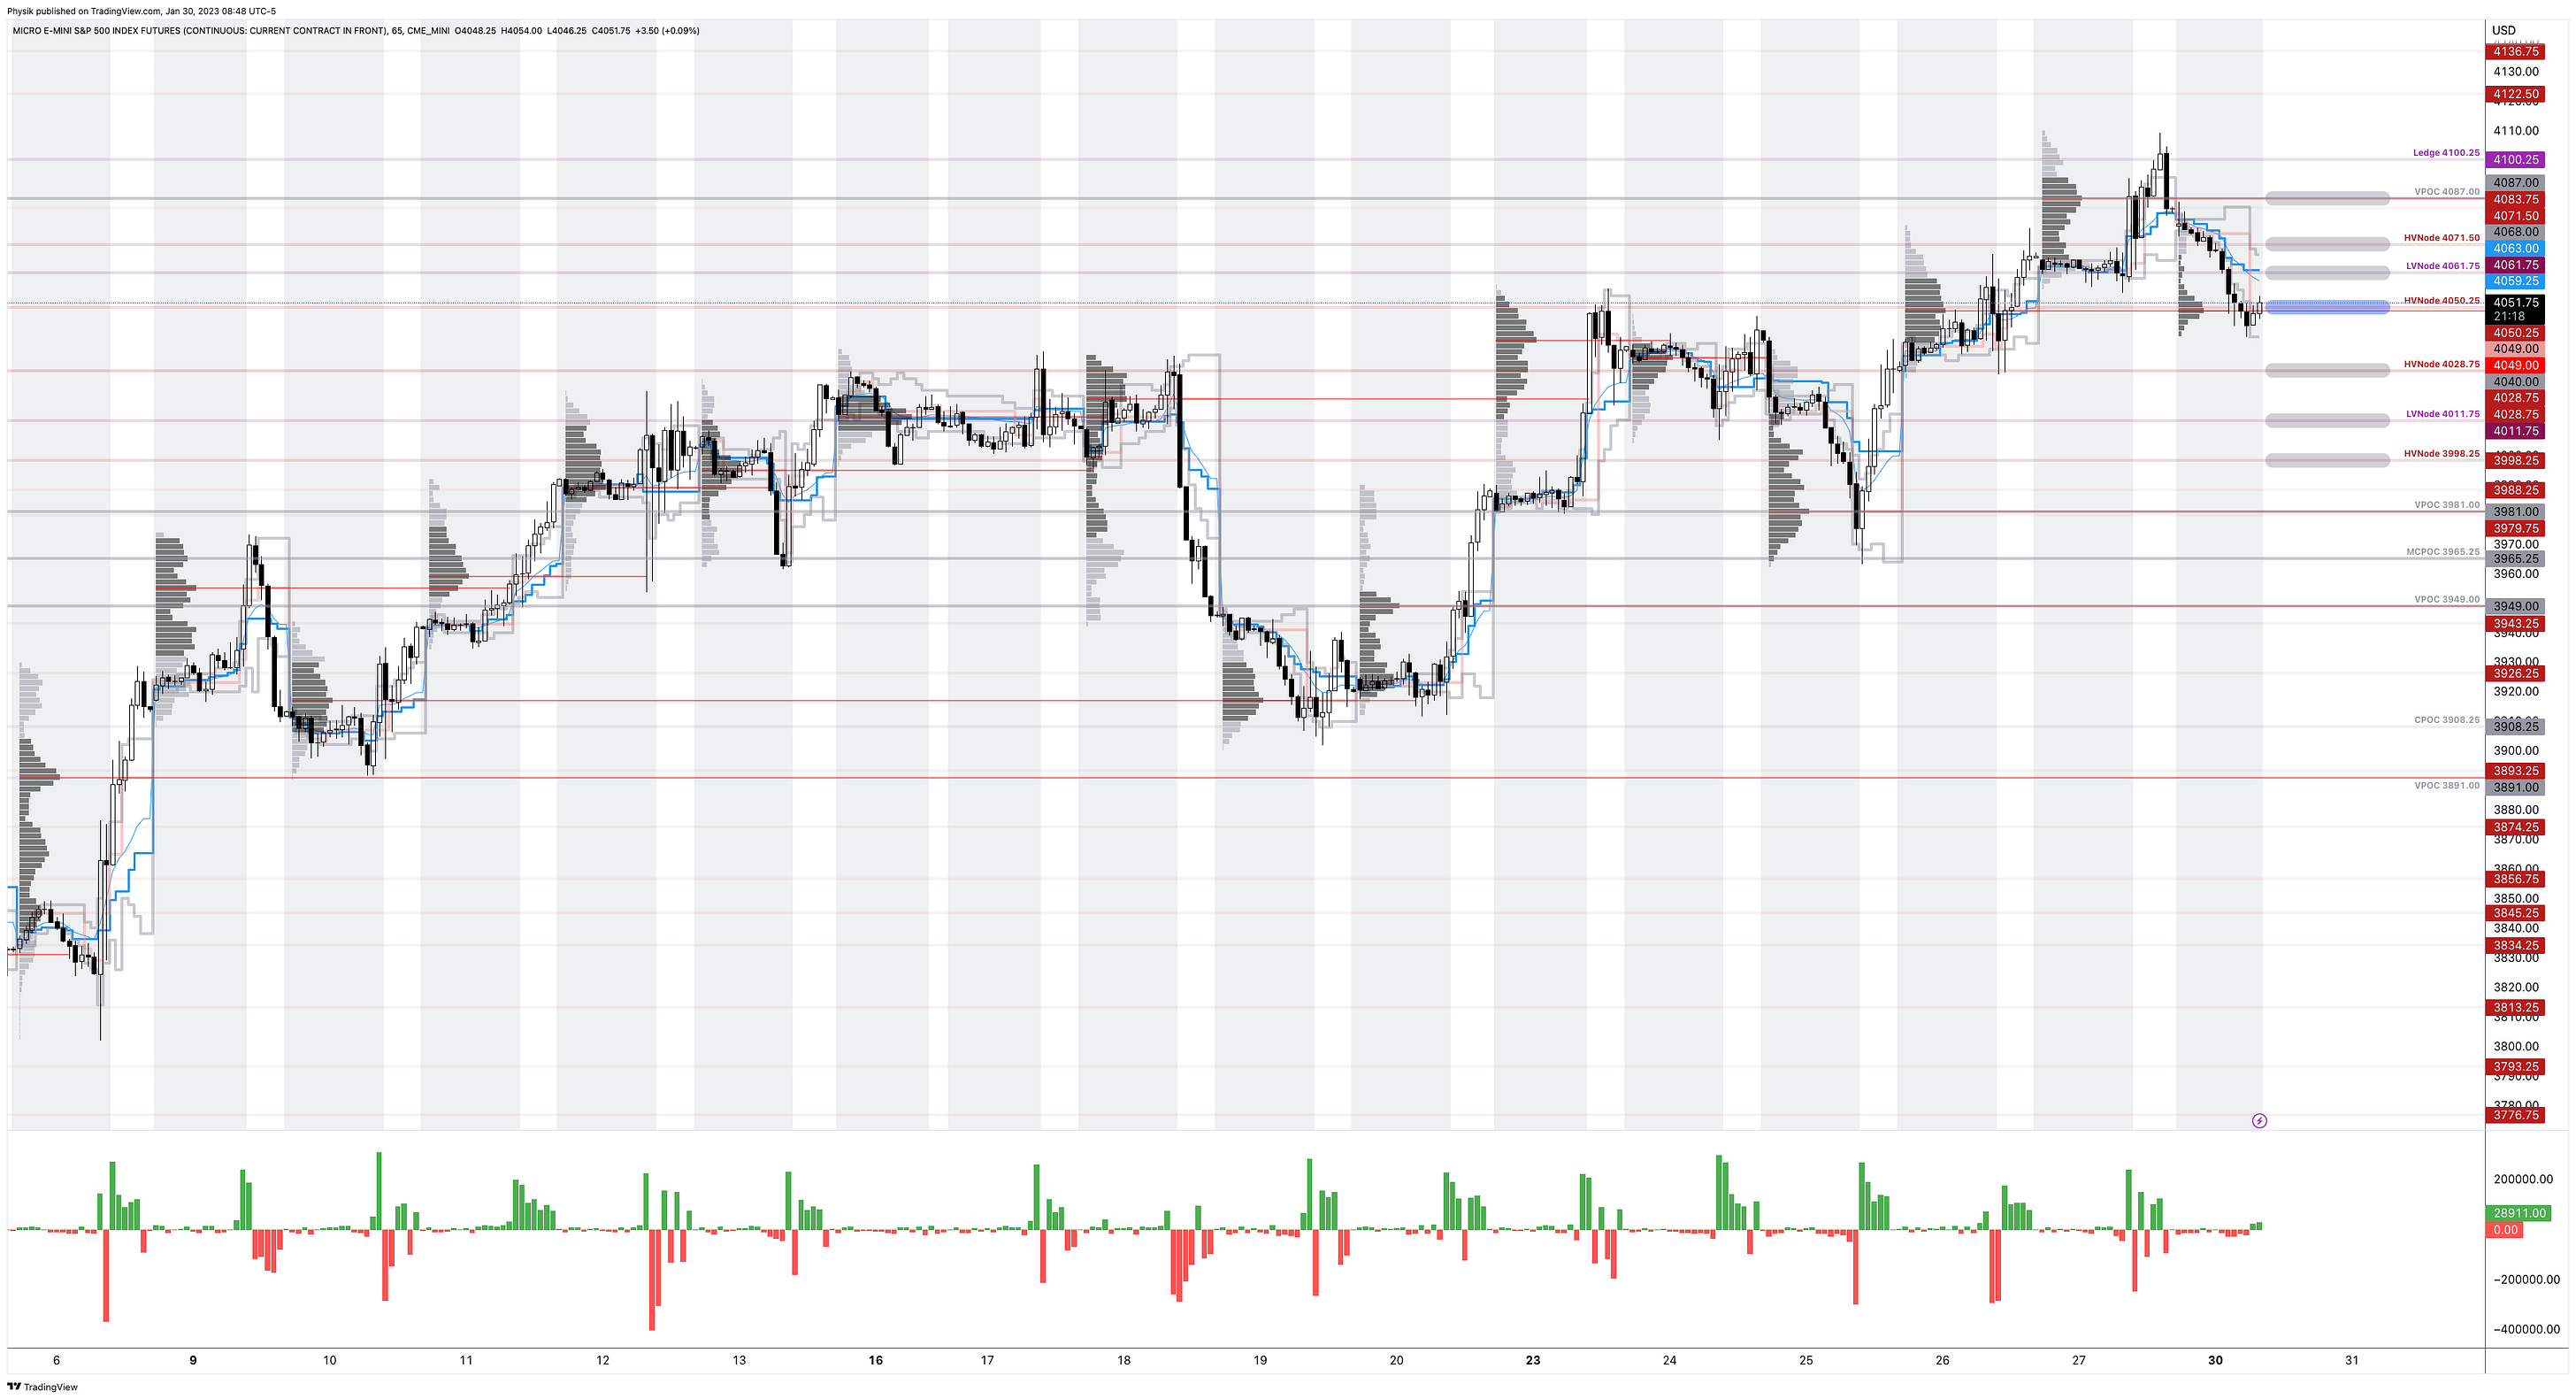
As of 8:45 AM ET, Monday’s regular session (9:30 AM – 4:00 PM ET), in the S&P 500, is likely to open in the lower part of a negatively skewed overnight inventory, outside of the prior range, suggesting a potential for immediate directional opportunity.

The S&P 500 pivot for today is $4,050.25. 

Key levels to the upside include $4,061.75, $4,071.50, and $4,087.00.

Key levels to the downside include $4,028.75, $4,011.75, and $3,998.25.

Disclaimer: Click here to load the key levels via the TradingView platform. New links are produced daily. Quoted levels hold weight barring exogenous event.

Graphic: 65-minute profile chart of the Micro E-mini S&P 500 Futures.

Definitions

Volume Areas: Markets will build on areas of high-volume (HVNodes). Should the market trend for a period of time, this will be identified by a low-volume area (LVNodes). The LVNodes denote directional conviction and ought to offer support on any test.

If participants auction and find acceptance in an area of a prior LVNode, then future discovery ought to be volatile and quick as participants look to the nearest HVNodes for more favorable entry or exit.

POCs: Areas where two-sided trade was most prevalent in a prior day session. Participants will respond to future tests of value as they offer favorable entry and exit.


About

In short, Renato Leonard Capelj is an economics graduate working in finance and journalism.

Capelj spends most of his time as the founder of Physik Invest through which he invests and publishes daily analyses to subscribers, some of whom represent well-known institutions.

Separately, Capelj is an equity options analyst at SpotGamma and an accredited journalist interviewing global leaders in business, government, and finance.

Past works include conversations with investor Kevin O’Leary, ARK Invest’s Catherine Wood, FTX’s Sam Bankman-Fried, Lithuania’s Minister of Economy and Innovation Aušrinė Armonaitė, former Cisco chairman and CEO John Chambers, and persons at the Clinton Global Initiative.

Contact

Direct queries to renato@physikinvest.com or Renato Capelj#8625 on Discord.

Calendar

You may view this letter’s content calendar at this link.

Disclaimer

Do not construe this newsletter as advice. All content is for informational purposes.

Categories
Commentary

Daily Brief For January 26, 2023

Physik Invest’s Daily Brief is read by thousands of subscribers. You, too, can join this community to learn about the fundamental and technical drivers of markets.

Graphic updated 8:00 AM ET. Sentiment Risk-On if expected /ES open is above the prior day’s range. /ES levels are derived from the profile graphic at the bottom of this letter. Click here for the latest levels. SqueezeMetrics Dark Pool Index (DIX) and Gamma (GEX) with the latter calculated based on where the prior day’s reading falls with respect to the MAX and MIN of all occurrences available. A higher DIX is bullish. At the same time, the lower the GEX, the more (expected) volatility. Click to learn the implications of volatility, direction, and moneyness. Breadth reflects a reading of the prior day’s NYSE Advance/Decline indicator. The CBOE VIX Volatility Index (INDEX: VVIX) reflects the attractiveness of owning volatility.

Positioning

It’s a dynamic this letter has discussed before. Levels quoted in the bottom section of this letter have proved useful in recent trade, marking the bottom and top of rallies precisely. A factor to blame is short-term participation. Let’s explain this further.

Graphic: 65-minute profile chart of the Micro E-mini S&P 500 Futures.

For instance, as SpotGamma said this morning, volumes at options strikes, very close to levels this letter quotes, are very large relative to the open interest changes. These volumes are large enough to add to the movement and result in responses to certain areas, but their impact is not long-lasting. In fact, some suggest the activity is part of “trading for risk positioning” and the impact “can net out” over a longer time horizon.

It is this letter writer’s opinion that the noise is easy to get swept into. Rather, we are interested in participating in the bigger strides, hence the trades we’ve quoted prior.

As your letter writer elaborated in a recent note for SpotGamma, following weakness heading into the January monthly options expiration (OpEx), the window was open for relief. A cross above big inflections like the 200-day simple moving average, a trigger for some to buy stocks, coupled with measures like the Cboe Volatility Index (INDEX: VIX) trending higher, partly the result of the fear of missing out and hedging in a lower liquidity environment, had us leaning optimistic.

Graphic: Retrieved from Bloomberg.

Notwithstanding, with measures like the Cboe VIX Volatility (INDEX: VVIX) “at low levels and rebounding” implying “(1) traders are looking to hedge for cheap and (2) convexity remains a good place to be”, we had the interest to limit downside via call structures with long and short options. The short options help us harvest a bit of call skew and lower the cost of the spread, helping it retain “value better through time.”

Graphic: Retrieved from Bloomberg.

In short, though “the marginal positivity of further IV compression likely does little to keep stocks on an upward trajectory”, SpotGamma explained, structures we explained recently may enable you to get on the right side of an SPX and VIX up environment (explained by SpotGamma), all the while limiting downside on the eventual turn.

If you’re averse to directional risk, consider trades like the Box Spreads we talked about many letters back, which are now gaining popularity.

Technical

As of 8:00 AM ET, Thursday’s regular session (9:30 AM – 4:00 PM ET), in the S&P 500, is likely to open in the upper part of a positively skewed overnight inventory, outside of prior-range and -value, suggesting a potential for immediate directional opportunity.

Our S&P 500 pivot for today is $4,050.25. 

Key levels to the upside include $4,061.75, $4,071.50, and $4,083.75.

Key levels to the downside include $4,028.75, $4,011.75, and $3,998.25.

Click here to load updated key levels into the web-based TradingView platform. All levels are derived using the 65-minute timeframe. New links are produced, daily. 

Graphic: 65-minute profile chart of the Micro E-mini S&P 500 Futures.

Definitions

Volume Areas: Markets will build on areas of high-volume (HVNodes). Should the market trend for long periods of time, it will be identified by low-volume areas (LVNodes). LVNodes denote directional conviction and ought to offer support on any test.

If participants auction and find acceptance in an area of a prior LVNode, then future discovery ought to be volatile and quick as participants look to HVNodes for favorable entry or exit.

POCs: Denote areas where two-sided trade was most prevalent in a prior day session. Participants will respond to future tests of value as they offer favorable entry and exit.


About

In short, Renato Leonard Capelj is an economics graduate working in finance and journalism.

Capelj spends most of his time as the founder of Physik Invest through which he invests and publishes daily analyses to subscribers, some of whom represent well-known institutions.

Separately, Capelj is an equity options analyst at SpotGamma and an accredited journalist interviewing global leaders in business, government, and finance.

Past works include conversations with investor Kevin O’Leary, ARK Invest’s Catherine Wood, FTX’s Sam Bankman-Fried, Lithuania’s Minister of Economy and Innovation Aušrinė Armonaitė, former Cisco chairman and CEO John Chambers, and persons at the Clinton Global Initiative.

Contact

Direct queries to renato@physikinvest.com or Renato Capelj#8625 on Discord.

Calendar

You may view this letter’s content calendar at this link.

Disclaimer

Do not construe this newsletter as advice. All content is for informational purposes.

Categories
Commentary

Daily Brief For January 25, 2023

Physik Invest’s Daily Brief is read by thousands of subscribers. You, too, can join this community to learn about the fundamental and technical drivers of markets.

Graphic updated 8:00 AM ET. Sentiment Risk-Off if expected /ES open is below the prior day’s range. /ES levels are derived from the profile graphic at the bottom of this letter. Click here for the latest levels. SqueezeMetrics Dark Pool Index (DIX) and Gamma (GEX) with the latter calculated based on where the prior day’s reading falls with respect to the MAX and MIN of all occurrences available. A higher DIX is bullish. At the same time, the lower the GEX, the more (expected) volatility. Click to learn the implications of volatility, direction, and moneyness. Breadth reflects a reading of the prior day’s NYSE Advance/Decline indicator. The CBOE VIX Volatility Index (INDEX: VVIX) reflects the attractiveness of owning volatility.

Positioning

After a rocky end to 2022, the result of rebalances and repositioning, stocks rallied in the face of incredibly bearish sentiment and off-sides positioning. The detailed Daily Brief for January 24 discussed this context.

Presently, the S&P 500 (INDEX: SPX) is riding above an important inflection (i.e., the 200-day simple moving average) which is a trigger for many traders to flip to owning stocks. At the same time, implied volatility (IVOL), as measured by measures such as the Cboe Volatility Index (INDEX: VIX), is trending higher, and that’s, in part, a result of options hedging in a lower liquidity environment.

Anyways, little is expected to change until the middle of February, this letter quoted Kai Volatility’s Cem Karsan stating, yesterday. Following mid-February, a window for weakness opens. This could be a problem for some traders who are short volatility.

The reason being is as follows. Traders’ disinterest in hedging downside leaves them offside should the market drop quickly. Consequently, the demand for hedges (puts) will coincide with a re-pricing in IVOL dangerous to anyone who is short volatility.

Given the unstable SPX and VIX up environment, attractive trades provide exposure to the upside while limiting the downside. Structures such as call butterflies or ratio spreads, as included in yesterday’s letter, may work well.

In yesterday’s example, owning the 20-point FEB 1×2 Tesla Call Ratio Spread resulted in about 400% profit in the span of 14 days or so (i.e., $0.20 db → $1.00 cr). The loss was limited* to about $20.00 at entry while the exit was marked in excess of $100.00.

*Note that losses can exceed the entry debit should the underlying stock trade very far beyond the ratio spread’s short strikes.

Similar trades can be structured in the indexes such as the Nasdaq 100 (INDEX: NDX) where there is a steeper skew that may enable us to collect more credit in the options we are short, helping us lower the cost of the entire spread we own.

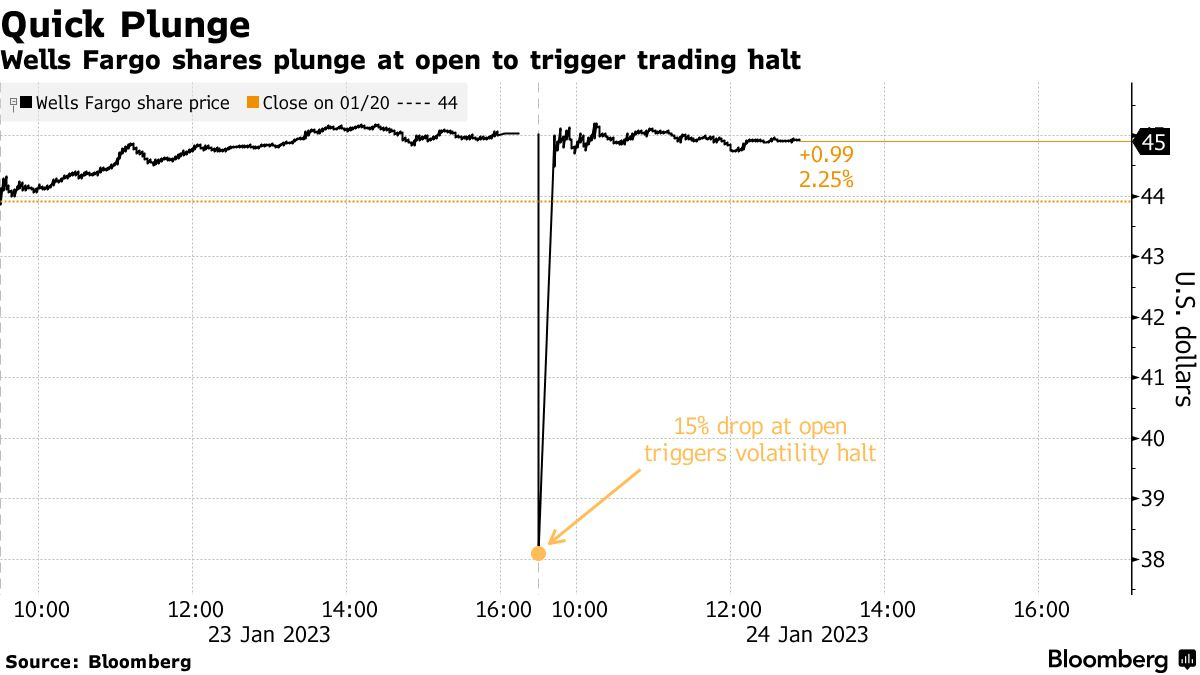
If you’re leaning toward the indexes, then you may avoid some of the volatility we saw yesterday when large swaths of stocks on the Intercontinental Exchange Inc-owned (NYSE: ICE) New York Stock Exchange commenced trading with an open book some reports have suggested.

As SpotGamma explained yesterday, “movement-reducing hedging activities” in the indexes “can mask realized volatility (RV) under the hood in single stocks.” Therefore, your index positions may be better isolated from what’s going on under the hood.

Graphic: Retrieved from Bloomberg.

Technical

As of 8:00 AM ET, Wednesday’s regular session (9:30 AM – 4:00 PM ET), in the S&P 500, is likely to open in the lower part of a negatively skewed overnight inventory, outside of prior-range and -value, suggesting a potential for immediate directional opportunity.

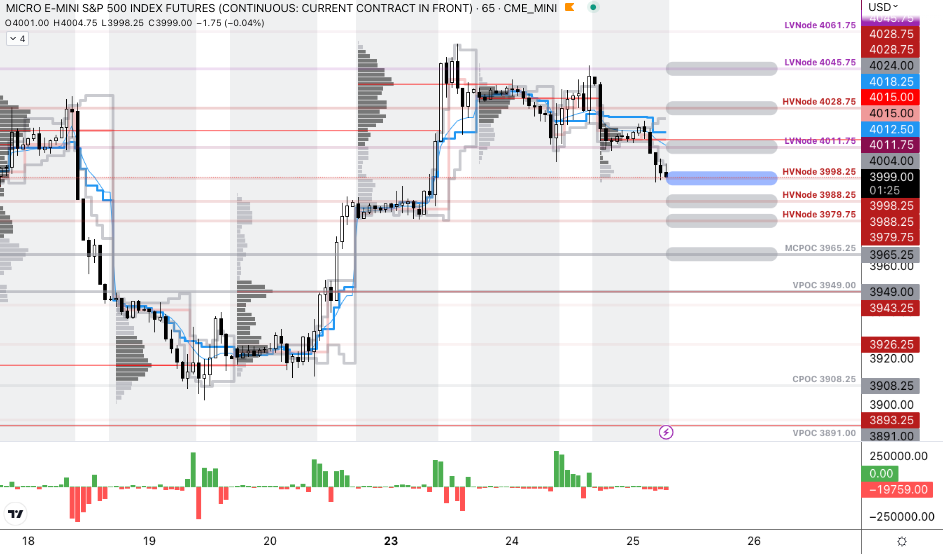
Our S&P 500 pivot for today is $3,998.25. 

Key levels to the upside include $4,011.75, $4,028.75, and $4,045.75.

Key levels to the downside include $3,988.25, $3,979.75, and $3,965.25.

Click here to load updated key levels into the web-based TradingView platform. All levels are derived using the 65-minute timeframe. New links are produced, daily. 

Graphic: 65-minute profile chart of the Micro E-mini S&P 500 Futures.

Definitions

Volume Areas: Markets will build on areas of high-volume (HVNodes). Should the market trend for long periods of time, it will be identified by low-volume areas (LVNodes). LVNodes denote directional conviction and ought to offer support on any test.

If participants auction and find acceptance in an area of a prior LVNode, then future discovery ought to be volatile and quick as participants look to HVNodes for favorable entry or exit.

MCPOCs: Denote areas where two-sided trade was most prevalent over numerous sessions. Participants will respond to future tests of value as they offer favorable entry and exit.


About

In short, Renato Leonard Capelj is an economics graduate working in finance and journalism.

Capelj spends most of his time as the founder of Physik Invest through which he invests and publishes daily analyses to subscribers, some of whom represent well-known institutions.

Separately, Capelj is an equity options analyst at SpotGamma and an accredited journalist interviewing global leaders in business, government, and finance.

Past works include conversations with investor Kevin O’Leary, ARK Invest’s Catherine Wood, FTX’s Sam Bankman-Fried, Lithuania’s Minister of Economy and Innovation Aušrinė Armonaitė, former Cisco chairman and CEO John Chambers, and persons at the Clinton Global Initiative.

Contact

Direct queries to renato@physikinvest.com or Renato Capelj#8625 on Discord.

Calendar

You may view this letter’s content calendar at this link.

Disclaimer

Do not construe this newsletter as advice. All content is for informational purposes.

Categories
Commentary

Daily Brief For January 12, 2023

Physik Invest’s Daily Brief is read by thousands of subscribers. You, too, can join this community to learn about the fundamental and technical drivers of markets.

Graphic updated 8:45 AM ET. Sentiment Neutral if expected /ES open is inside of the prior day’s range. /ES levels are derived from the profile graphic at the bottom of this letter. Levels may have changed since initially quoted; click here for the latest levels. SqueezeMetrics Dark Pool Index (DIX) and Gamma (GEX) with the latter calculated based on where the prior day’s reading falls with respect to the MAX and MIN of all occurrences available. A higher DIX is bullish. At the same time, the lower the GEX, the more (expected) volatility. Click to learn the implications of volatility, direction, and moneyness. Breadth reflects a reading of the prior day’s NYSE Advance/Decline indicator. The CBOE VIX Volatility Index (INDEX: VVIX) measure reflects the total attractiveness of owning volatility.

Administrative

A quick letter today, apologies.

Given the large, post-CPI movement, the above dashboard may be out of date!

Separately, your letter writer will be heading to Davos, Switzerland during next week’s World Economic Forum. Let me know if you’ll be in town. Take care!

Fundamental

Today, market participants received data that appears in line with estimates.

Expected was a 6.5% rise year-over-year (YoY) and a 0.1% fall month-over-month (MoM). These numbers were +7.1% and +0.1% the release prior.

Mattering most is core inflation, which the Fed has more control over. The expectation was that core CPI rose 5.7% YoY and 0.3% MoM. In the release prior, these numbers were 6.0% and 0.2%, respectively.

Overall, the view that inflation is trending in the right direction is supported.

We often unpack the implications, but we will save that for a coming analysis.

Positioning

We saw meaningful outperformance in realized volatility (RVOL). This was, in part, a result of increased demand for short-dated exposures to movements (i.e., gamma), as well as a supply of farther-dated volatility (i.e., +gamma worked, +vega did not).

The trends, as your letter writer explained in recent write-ups, and in a Benzinga article, may eventually exhaust; measures like the VVIX, which is the volatility of the VIX or the volatility of the S&P 500’s volatility, are printing at levels seen in 2017. 

According to Kai Volatility’s Cem Karsan, markets are in a transition period and what’s worked in 2022 may not work as well in 2023; trades are becoming crowded and S&P 500 volatility skews have hit a lower bound of sorts. That was echoed by The Ambrus Group’s Kris Sidial who said that “we can get cheap exposure to convexity while a lot of people are worried.”

Since the start of the year, the skew shifted meaningfully higher while the S&P 500 and VIX have moved higher in sync, as well. Some, like SpotGamma, have their own explanation (e.g., the fear of missing out on a move higher results in call buying that bids volatility), expressing that this may be a trend that persists through events like Thursday’s consumer price update.

This letter’s takeaway is as follows. Markets can experience more of the same. As history has shown, the right trade may turn out to be short volatility across longer time horizons, and long/own volatility across shorter time horizons, for longer (i.e., current trends promoting realized volatility outperformance may persist longer).

However, should current trends persist, the market is likely to become far less well-hedged, as Karsan said in the video. If a catalyst arises, there may be a repricing in volatility which traders would not want to be on the wrong side of. Notwithstanding, as Sidial says, “[if] you’re trading volatility, let there be an underlying catalyst for doing so.” Don’t just buy it because it is cheap, or sell it because it is expensive.

We’ll go through the charts and implications in far more detail over the coming sessions. Your letter writer is stretched for time this morning. Take care!

Technical

As of 7:30 AM ET, Thursday’s regular session (9:30 AM – 4:00 PM ET), in the S&P 500, is likely to open in the upper part of a positively skewed overnight inventory, outside of prior-range and -value, suggesting a potential for immediate directional opportunity.

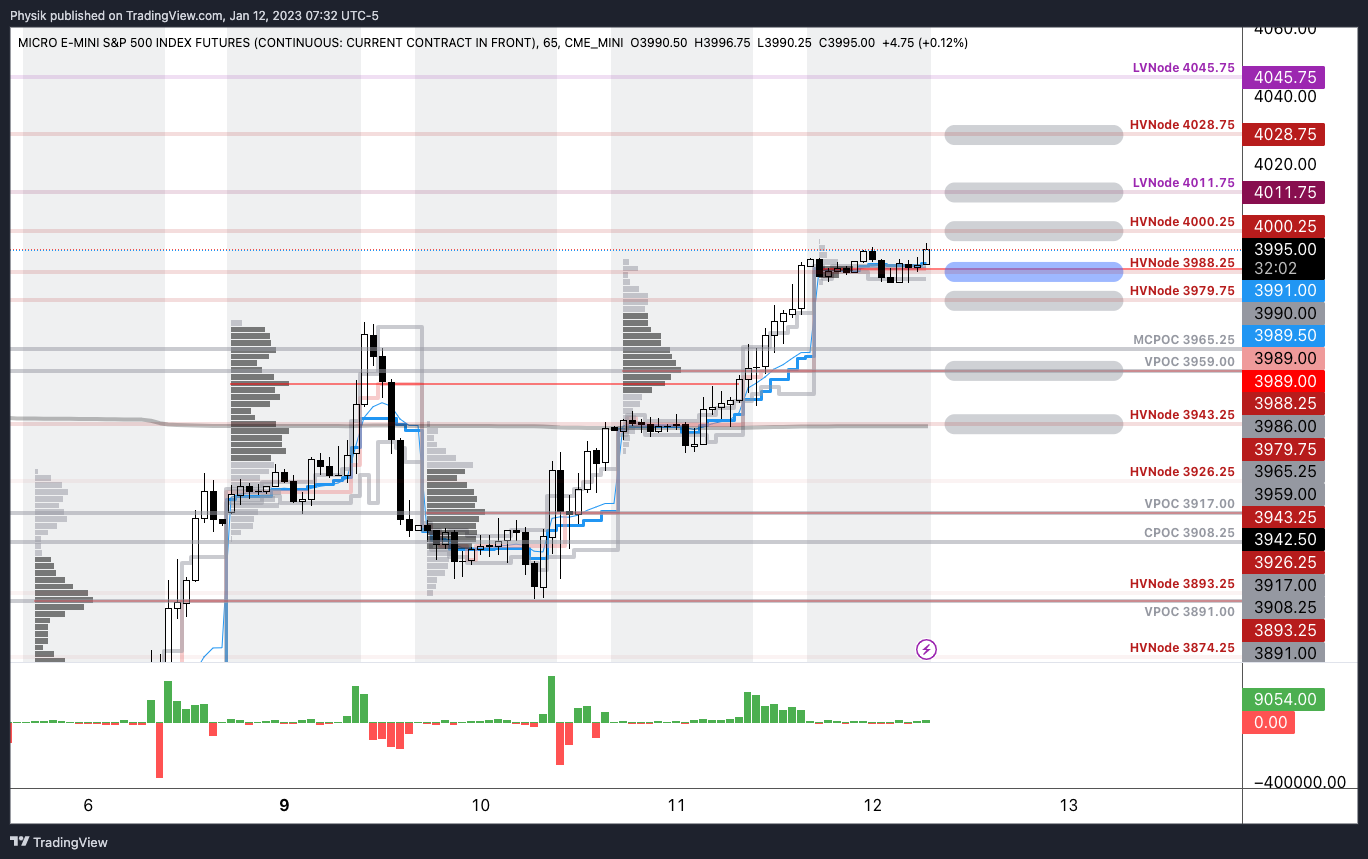
Our S&P 500 pivot for today is $3,988.25 HVNode. 

Key levels to the upside include $4,000.25, $4,011.75, and $4,028.75.

Key levels to the downside include $3,979.75, $3,959.00, and $3,943.25.

Click here to load today’s key levels into the web-based TradingView platform. All levels are derived using the 65-minute timeframe. New links are produced, daily. 

As a disclaimer, the S&P 500 could trade beyond the levels quoted in the letter. Therefore, you should load the above link on your browser for more relevant levels.

Graphic: 65-minute profile chart of the Micro E-mini S&P 500 Futures.

Definitions

Volume Areas: Markets will build on areas of high-volume (HVNodes). Should the market trend for long periods of time, it will be identified by low-volume areas (LVNodes). LVNodes denote directional conviction and ought to offer support on any test.

If participants auction and find acceptance in an area of a prior LVNode, then future discovery ought to be volatile and quick as participants look to HVNodes for favorable entry or exit.

POCs: Denote areas where two-sided trade was most prevalent in a prior day session. Participants will respond to future tests of value as they offer favorable entry and exit.

MCPOCs: Denote areas where two-sided trade was most prevalent over numerous sessions. Participants will respond to future tests of value as they offer favorable entry and exit.


About

In short, an economics graduate working in finance and journalism.

Capelj spends most of his time as the founder of Physik Invest through which he invests and publishes daily analyses to subscribers, some of whom represent well-known institutions.

Separately, Capelj is an equity options analyst at SpotGamma and an accredited journalist interviewing global leaders in business, government, and finance.

Past works include conversations with investor Kevin O’Leary, ARK Invest’s Catherine Wood, FTX’s Sam Bankman-Fried, Lithuania’s Minister of Economy and Innovation Aušrinė Armonaitė, former Cisco chairman and CEO John Chambers, and persons at the Clinton Global Initiative.

Contact

Direct queries to renato@physikinvest.com or Renato Capelj#8625 on Discord.

Calendar

You may view this letter’s content calendar at this link.

Disclaimer

Do not construe this newsletter as advice. All content is for informational purposes.

Categories
Commentary

Daily Brief For December 28, 2022

Physik Invest’s Daily Brief is read by thousands of subscribers. You, too, can join this community to learn about the fundamental and technical drivers of markets.

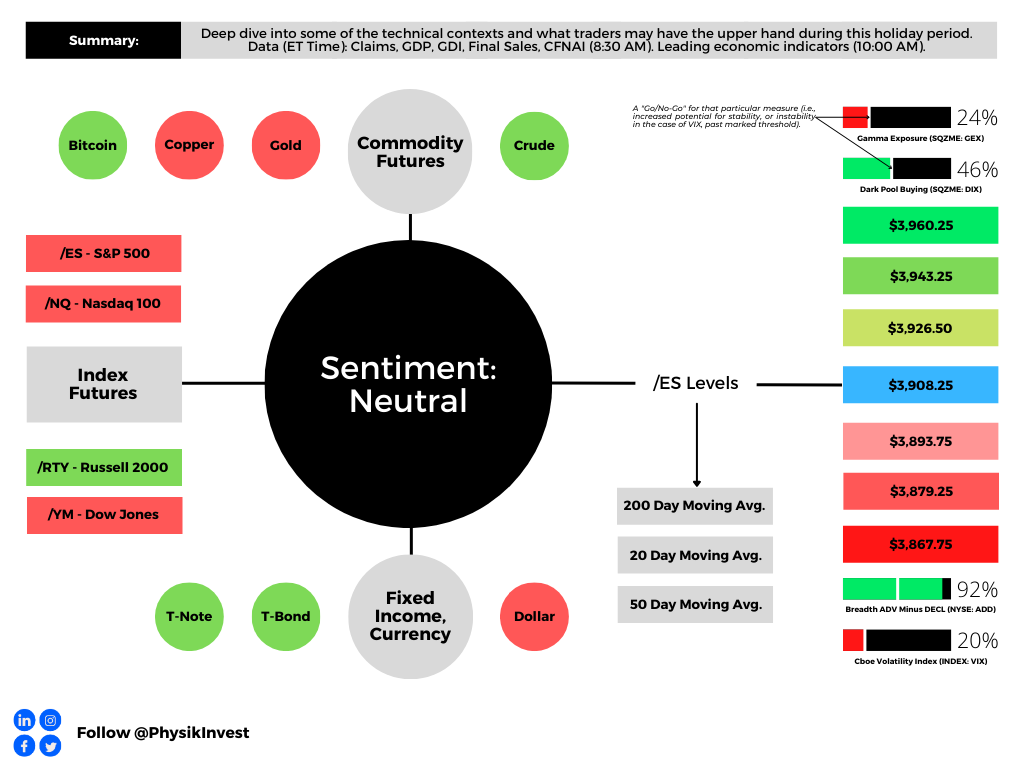
Graphic updated 6:40 AM ET. Sentiment Neutral if expected /ES open is inside of the prior day’s range. /ES levels are derived from the profile graphic at the bottom of this letter. Levels may have changed since initially quoted; click here for the latest levels. SqueezeMetrics Dark Pool Index (DIX) and Gamma (GEX) with the latter calculated based on where the prior day’s reading falls with respect to the MAX and MIN of all occurrences available. A higher DIX is bullish. At the same time, the lower the GEX, the more (expected) volatility. Click to learn the implications of volatility, direction, and moneyness. Breadth reflects a reading of the prior day’s NYSE Advance/Decline indicator. VIX reflects a current reading of the CBOE Volatility Index (INDEX: VIX) from 0-100.

Positioning

In Physik Invest’s Market Intelligence letter for December 21, we discussed the potential for “pressure on options prices [to] remain through December.” In short, on the odds that “nothing happens through the holidays,” it made sense to sell implied volatility (IVOL) after CPI and FOMC targeting an end-of-month expiration.

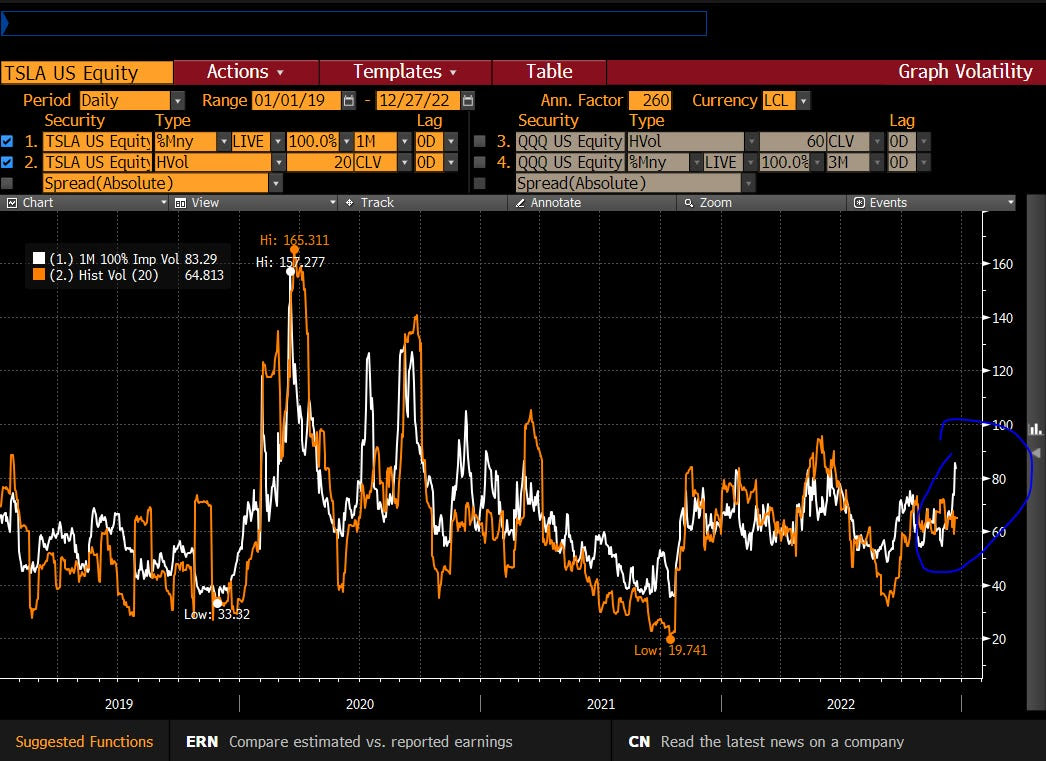
The downward trajectory in IVOL remains intact in spite of some pockets of weakness under the hood in index heavyweights like Tesla Inc (NASDAQ: TSLA); expectations of future movement remain mute at both the index and single stock levels. As a result, short volatility trades (e.g., short straddle) in the indexes and near current market prices, expiring later this month, are doing really well.

Graphic: Retrieved from Kris Sidial. Tesla Inc (NASDAQ: TSLA) 1-month IVOL “relatively muted throughout the pain.”

Part of the equation resulting in this sideways market and tame IVOL environment was discussed in the December 21 letter. Today we add color.

In short, traders’ anticipation of a market drop, as evidenced by them reducing equity exposures into and through the 2022 market decline, coupled with the exploitation of loopholes manifesting increased demand for short-dated exposure to movements (i.e., gamma), and a supply of IVOL that is farther-dated, has put a lid on broad equity IVOL measures like the Cboe Volatility Index (INDEX: VIX) and pushed skew lower.

Consequently, hedges performing well have a lot of +gamma intraday and exposure to realized volatility (RVOL), and less exposure to longer-dated IVOL. The other side of this trade (and those who may be warehousing this risk) has exposure to -gamma and, to hedge that, they must act in a manner that exacerbates realized movement, hence RVOL’s meaningful outperformance.

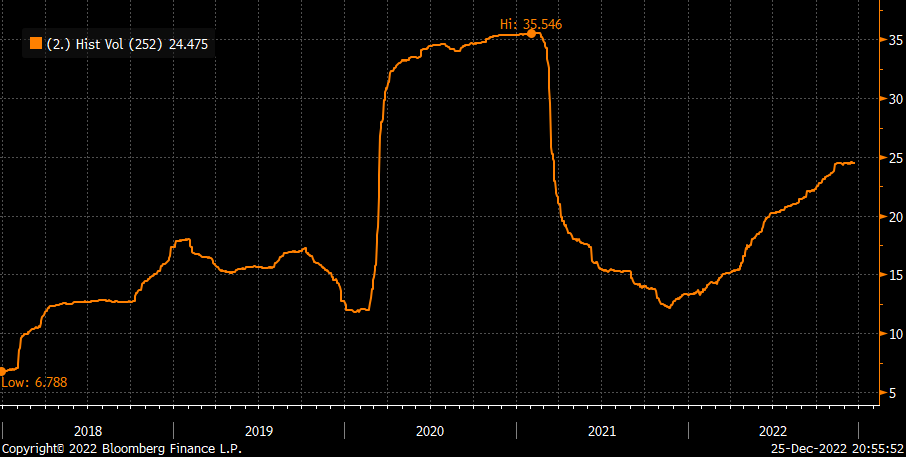
In fact, RVOL in 2022 is nearly two times the level of RVOL in 2021, all the while the IVOL term structure is basically at the “same place it was a year ago,” according to Danny Kirsch of Piper Sandler Companies (NYSE: PIPR).

Graphic: Retrieved from Danny Kirsch, the head of options at Piper Sandler Companies (NYSE: PIPR). “Rolling 1 year realized volatility [for] … 2022 nearly 2x the level of 2021, speaks to long gamma and not vega for 2022.”

In a two-and-a-half-hour Twitter Spaces discussion, Kai Volatility’s Cem Karsan discussed what is the potential cause of this. Some of the blame rests on the way margin calculations (i.e., the loophole mentioned earlier); less cash must be posted if trades are closed the same day, basically. 

Anyways, at the macro level, yes, the trends continue. Generally speaking, IVOL is mute and not accounting for the activity in short-dated options, as discussed by The Ambrus Group’s recent paper, while RVOL is about two times the level it was in 2021, making +gamma profitable.

However, at the micro level, so to speak, as we started out this discussion, traders’ anticipation that “nothing happens through the holidays,” has resulted in the supply of short-dated volatility, boosting the stickiness of open interest at current market prices.

Let’s unpack this further and explain why this activity won’t continue forever.

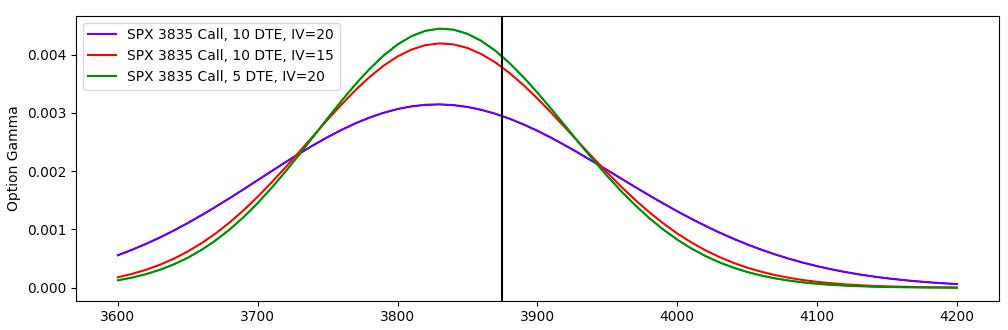
Near current market prices sit large concentrations of options positions. For instance, we have the $3,835.00 SPX strike (the call part of a massively popular collar trade that is rolled every quarter). At $3,835.00 is the short strike of a big collar trade.

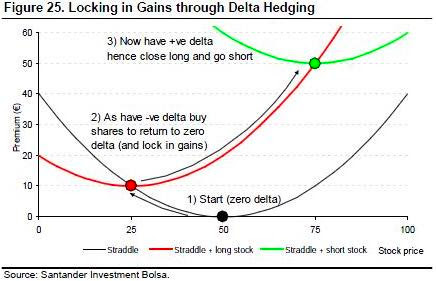
This means the trader (or fund owner) is short the call, hence -delta and -gamma. The other side (or counterpart) is long the call, hence +delta and +gamma.

In theory, the other side, in response to this exposure, will buy weakness and sell strength. In other words, to hedge a long call, the other side sells futures. If the market falls, the call’s delta will fall and become less positive. Therefore, the other side will buy back some of their initial futures hedges (reduce -delta from short futures) to neutralize delta risk. If the market rises, the other side will have more exposure to +delta. To neutralize the delta, the other side will sell more futures.

As a consequence, the market pins.

Graphic: Retrieved from Banco Santander SA (NYSE: SAN).

This is a trend, as we discussed on December 21, that likely continues through year-end. After year-end, the market is likely to “move more freely,” per SpotGamma, “because this options activity that is promoting mean reversion will no longer be there,” and, therefore, the indexes likely trade more “in sync with its wild constituents of the likes of Tesla and beyond.”

More on what’s next:

As Karsan dissected, yesterday, there’s a “liquidity premium” that’s getting crowded short; in this less well-hedged market environment, traders’ realization with respect to liquidity and collateral needs for supporting trading activities may provide the context for some sharp drops. But first, it’s likely (though not certain) the market experiences some relief. Knowing that the long-end is cheap (hence near-zero percentile skew) on a supply and demand basis, it does not make sense to sell options blindly out in time.

Technical

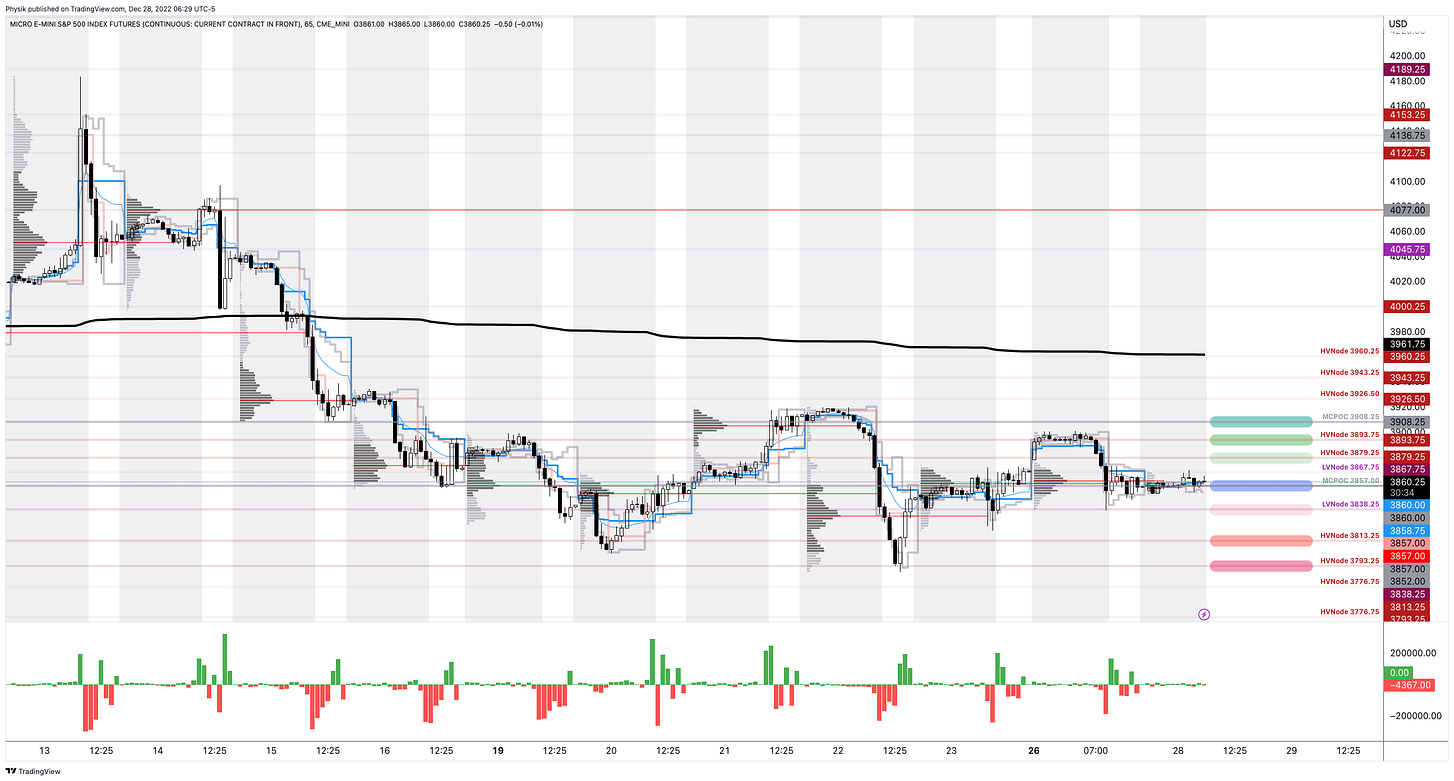
As of 6:30 AM ET, Wednesday’s regular session (9:30 AM – 4:00 PM ET), in the S&P 500, is likely to open in the middle part of a balanced overnight inventory, inside of prior-range and -value, suggesting a limited potential for immediate directional opportunity.

Our S&P 500 pivot for today is $3,857.00. 

Key levels to the upside include $3,879.25, $3,893.75, and $3,908.25. 

Key levels to the downside include $3,838.25, $3,813.25, and $3,793.25.

Click here to load today’s key levels into the web-based TradingView platform. All levels are derived using the 65-minute timeframe. New links are produced, daily.

Graphic: 65-minute profile chart of the Micro E-mini S&P 500 Futures.

Definitions

Volume Areas: Markets will build on areas of high-volume (HVNodes). Should the market trend for long periods of time, it will be identified by low-volume areas (LVNodes). LVNodes denote directional conviction and ought to offer support on any test.

If participants auction and find acceptance in an area of a prior LVNode, then future discovery ought to be volatile and quick as participants look to HVNodes for favorable entry or exit.

MCPOCs: Denote areas where two-sided trade was most prevalent over numerous sessions. Participants will respond to future tests of value as they offer favorable entry and exit.


About

In short, an economics graduate working in finance and journalism.

Capelj spends most of his time as the founder of Physik Invest through which he invests and publishes daily analyses to subscribers, some of whom represent well-known institutions.

Separately, Capelj is an equity options analyst at SpotGamma and an accredited journalist interviewing global leaders in business, government, and finance.

Past works include conversations with investor Kevin O’Leary, ARK Invest’s Catherine Wood, FTX’s Sam Bankman-Fried, Lithuania’s Minister of Economy and Innovation Aušrinė Armonaitė, former Cisco chairman and CEO John Chambers, and persons at the Clinton Global Initiative.

Contact

Direct queries to renato@physikinvest.com or Renato Capelj#8625 on Discord.

Calendar

You may view this letter’s content calendar at this link.

Disclaimer

Do not construe this newsletter as advice. All content is for informational purposes.
Categories
Commentary

Daily Brief For December 22, 2022

Physik Invest’s Daily Brief is read by thousands of subscribers. You, too, can join this community to learn about the fundamental and technical drivers of markets.

Graphic updated 5:30 AM ET. Sentiment Neutral if expected /ES open is inside of the prior day’s range. /ES levels are derived from the profile graphic at the bottom of this letter. Levels may have changed since initially quoted; click here for the latest levels. SqueezeMetrics Dark Pool Index (DIX) and Gamma (GEX) with the latter calculated based on where the prior day’s reading falls with respect to the MAX and MIN of all occurrences available. A higher DIX is bullish. At the same time, the lower the GEX, the more (expected) volatility. Click to learn the implications of volatility, direction, and moneyness. Breadth reflects a reading of the prior day’s NYSE Advance/Decline indicator. VIX reflects a current reading of the CBOE Volatility Index (INDEX: VIX) from 0-100.

Technical

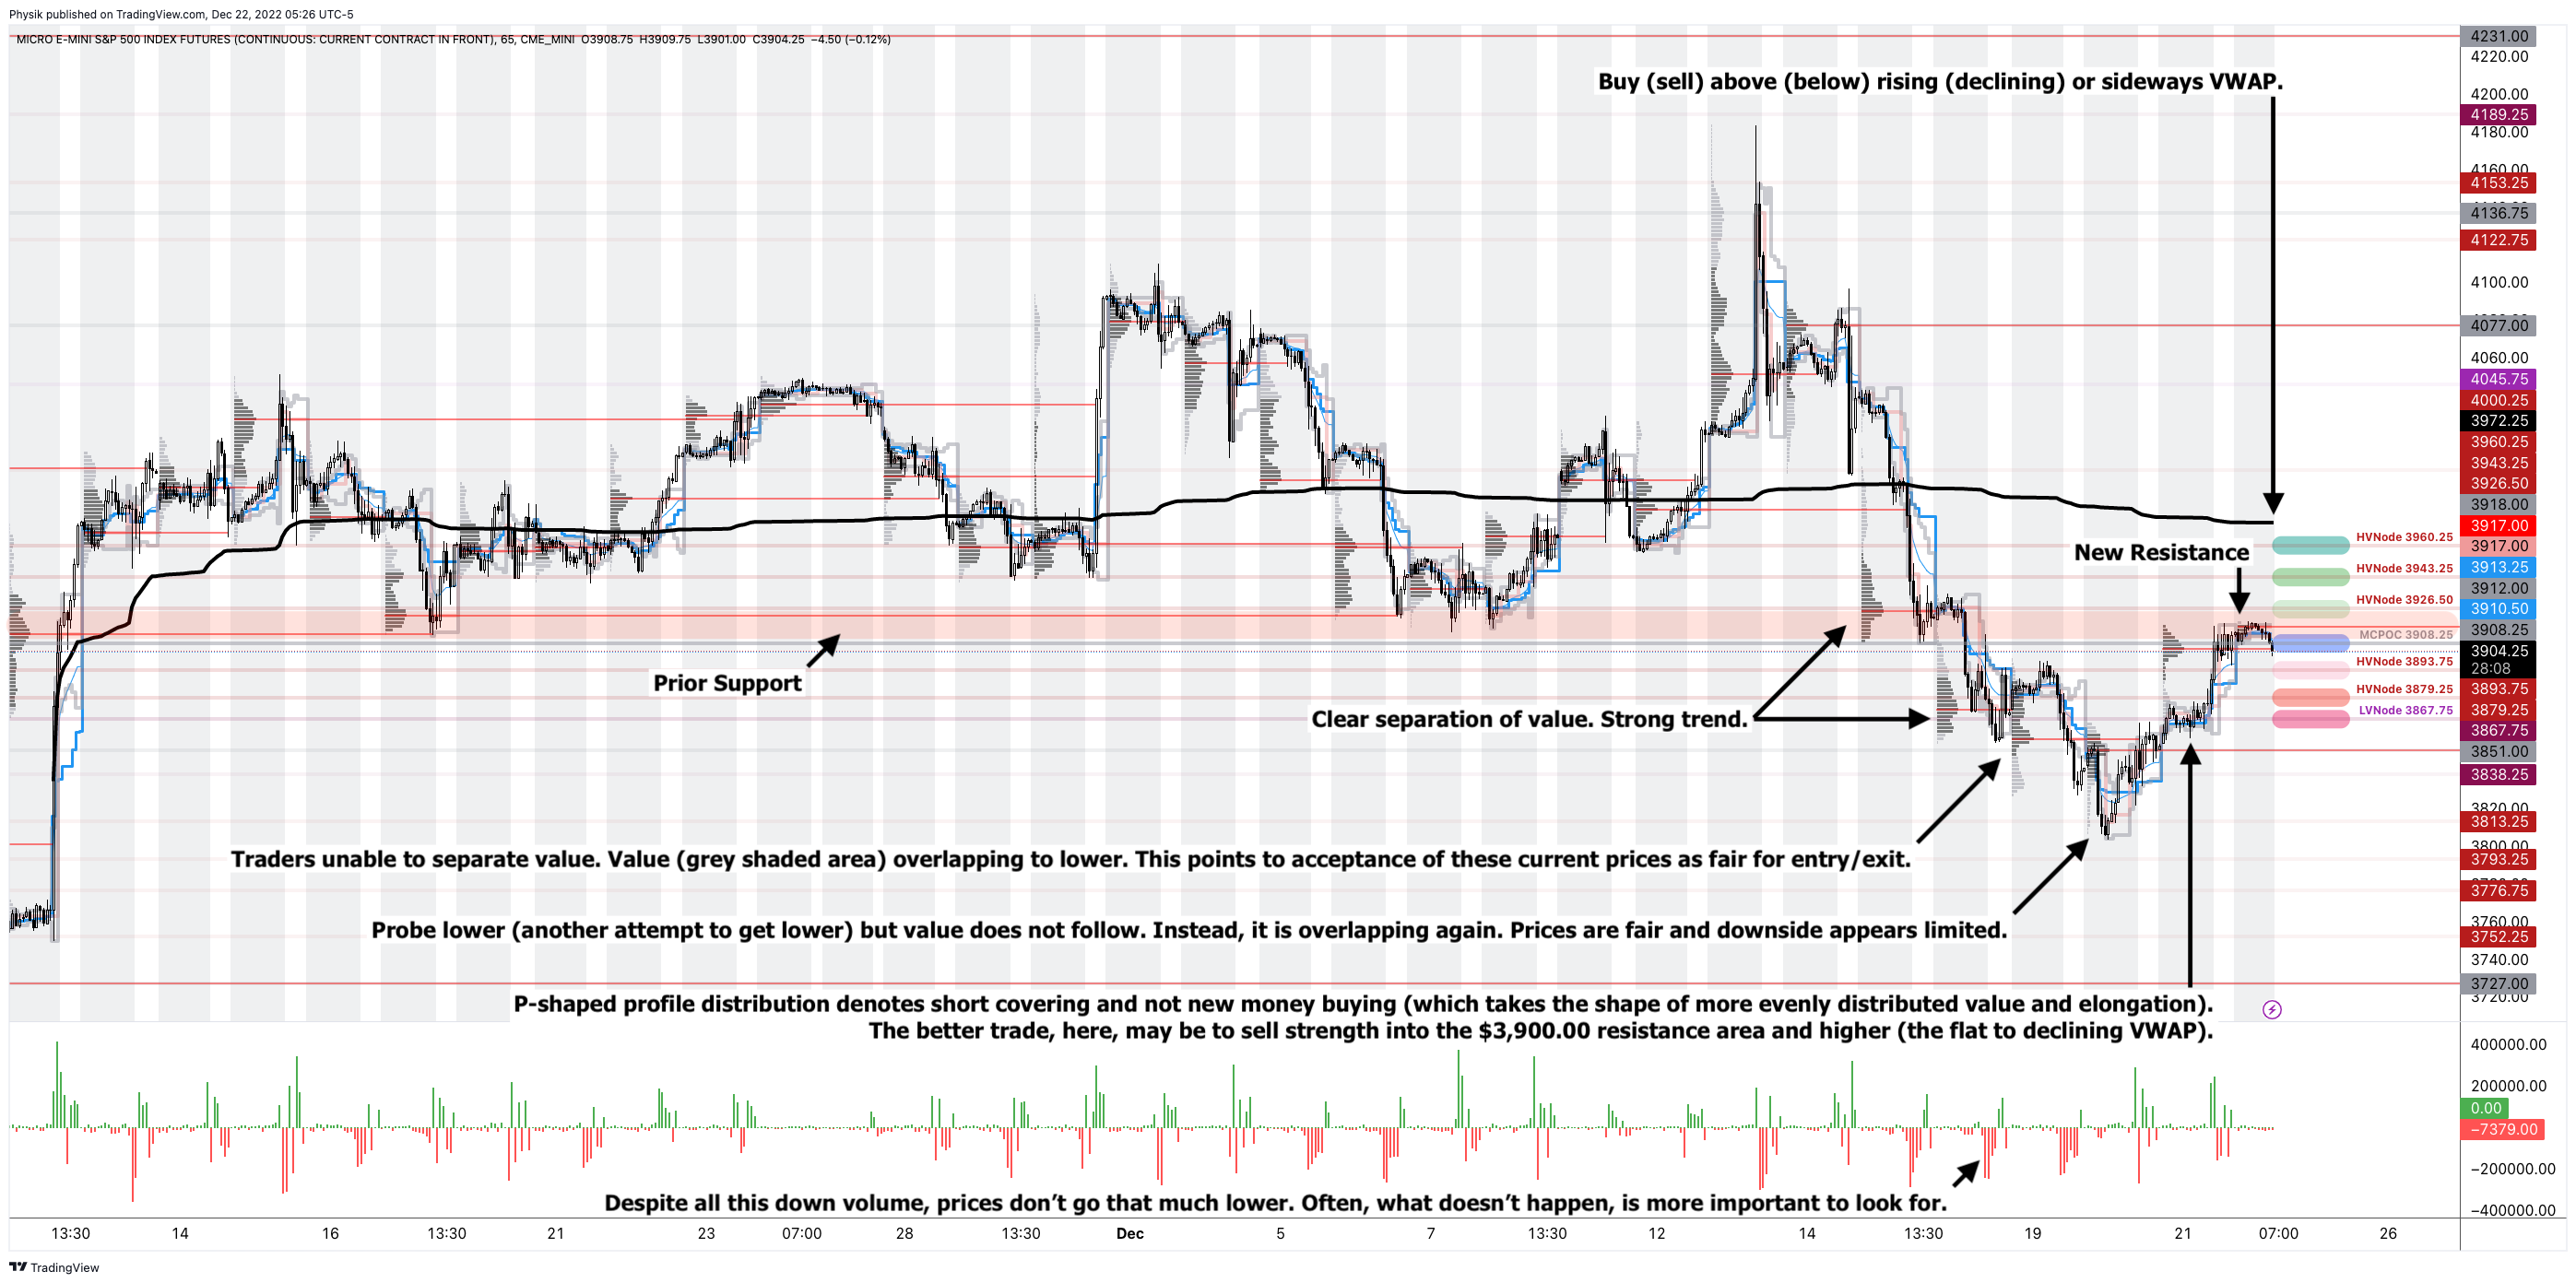
As of 5:30 AM ET, Thursday’s regular session (9:30 AM – 4:00 PM ET), in the S&P 500, is likely to open in the lower part of a balanced overnight inventory, inside of prior-range and -value, suggesting a limited potential for immediate directional opportunity.

Our S&P 500 pivot for today is $3,908.25. 

Key levels to the upside include $3,926.50, $3,943.25, and $3,960.25. 

Key levels to the downside include $3,893.75, $3,879.25, and $3,867.75.

Click here to load today’s key levels into the web-based TradingView platform. All levels are derived using the 65-minute timeframe. New links are produced, daily.

Graphic: 65-minute profile chart of the Micro E-mini S&P 500 Futures.

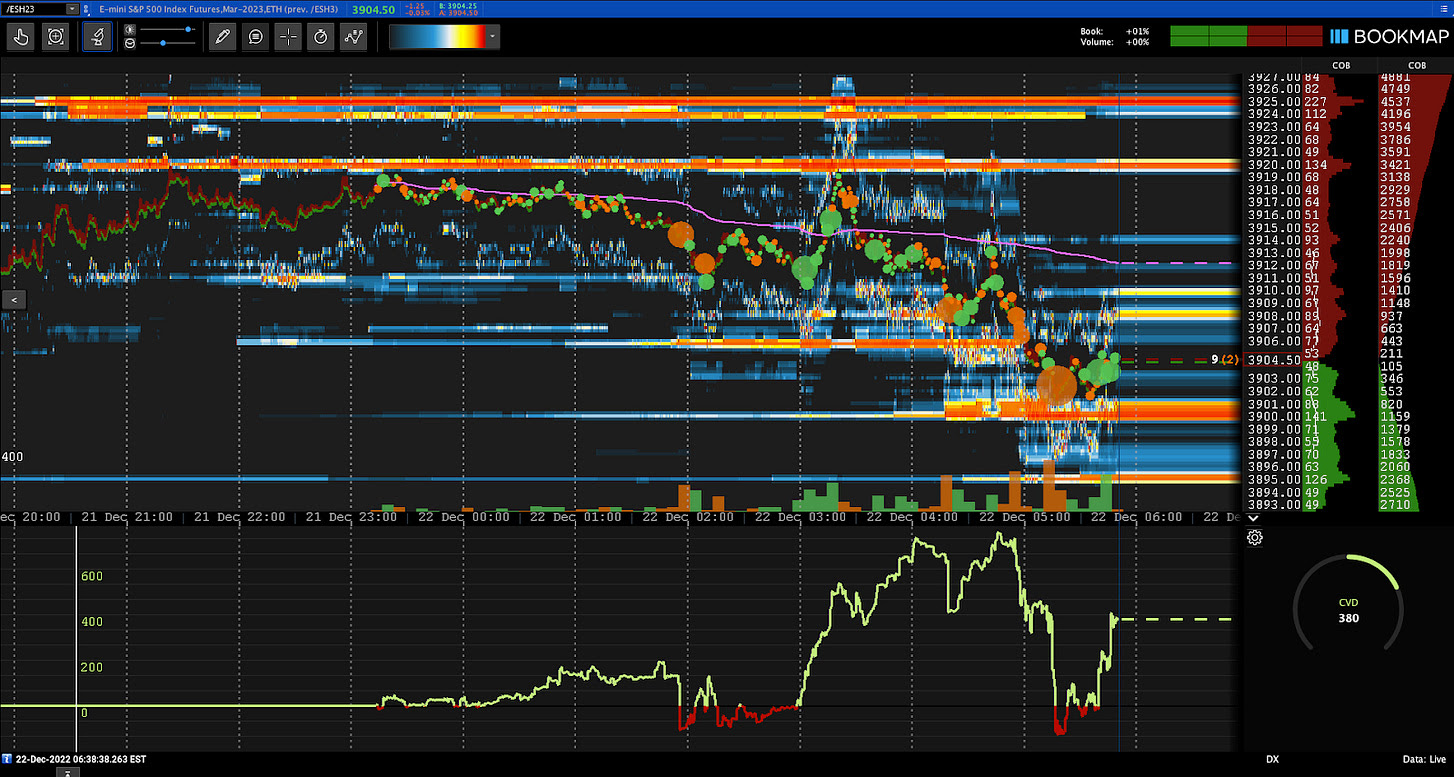
Checking Bookmap, a tool that allows us to visualize market liquidity, today, we see orders near the $3,920.00 – $3,925.00 area in the E-mini S&P 500 (FUTURE: /ES). These are orders to enter or exit trades at the resistance area highlighted in the 65-minute profile chart above.

Graphic: Market liquidity in the E-mini S&P 500 Future via thinkorswim’s Bookmap integration.

Considerations: Traders may have noticed responsiveness near key-technical areas visually discernable on a chart. In the Daily Brief for December 21, we discussed the positioning contexts to blame for this. After big events last week, an absence of the unexpected (i.e., what traders sought to hedge and/or bet on) prompted the sale of options protection, a pressure on options prices.

Graphic: Retrieved from SpotGamma.

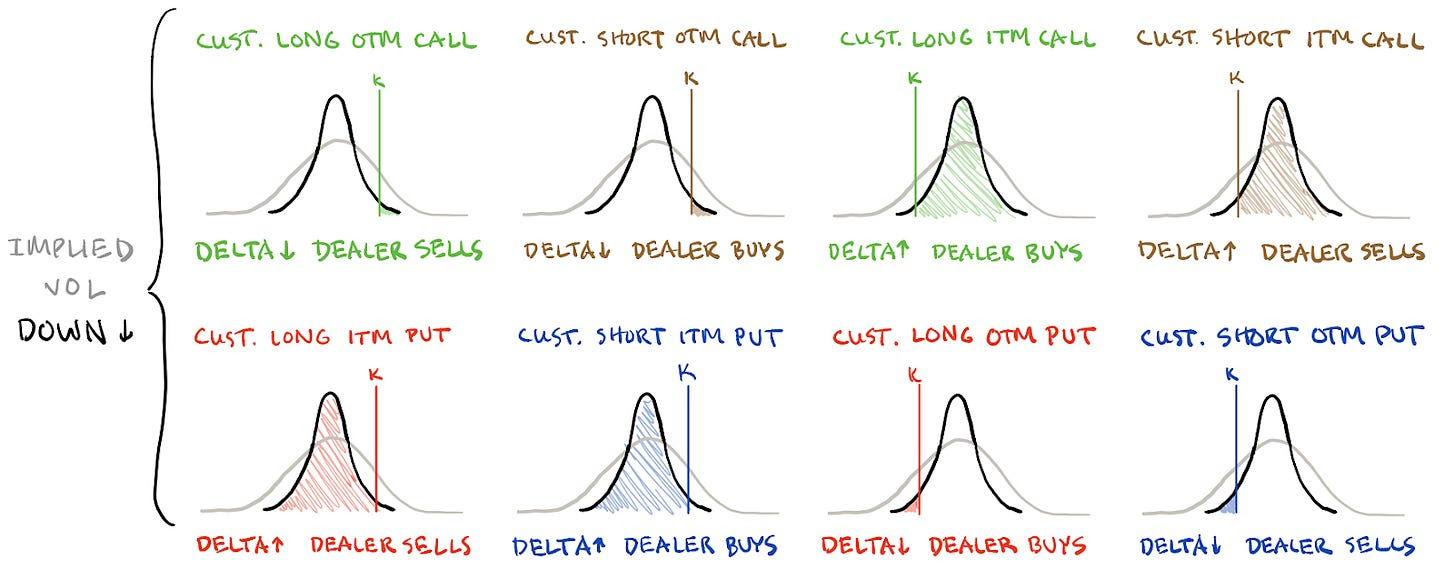
As a result, the S&P 500 is sliding into lower levels of fixed-strike and top-line implied volatility (IVOL) measures. Given the current positioning, when IVOL is on a downward trajectory, counterparties sell strength and buy weakness. For instance, there is a ton of short-call open interest at the $3,835.00 strike. Customers are (mainly) short these calls. Dealers (on the other side) sell underlying to re-hedge their rising positive Delta exposure from the in-the-money call. This mutes movement.

Graphic: Retrieved from SqueezeMetrics.

This more positive Delta is a consequence of IVOL falling and Gamma (sensitivity to movement) rising. A higher Gamma implies a more variable Delta and, hence, less stable directional risk.

Graphic: Retrieved from SpotGamma.

Basically, as IVOL falls, the extrinsic or time value (theta) of the option falls and, given that in this case, the option is in the money, its intrinsic value (Delta) rises.

Graphic: Retrieved from The Options Industry Council.

While this is happening (i.e., orderly index selling and lower IVOL), big constituents like Tesla Inc (NASDAQ: TSLA) are swinging far more amid traders’ uneasiness and bets, there.

Weakness under the hood, relative to the indexes, and responsiveness to very minute technical levels won’t last; yes, in the interim, you may lean on these levels provided. Again, however, don’t expect that to last.

IVOL is performing poorly and that’s resulted in investors moving to better-performing strategies including short volatility. As a consequence, the broader market is in a less-well-hedged position. Coupled with the removal of the index-level support contexts (i.e., positioning that’s promoting responses to key areas) and some exogenous catalysts, we could see higher realized volatility (RVOL) and less immunity from the weaknesses happening under the hood in single stocks, in the new year.


Definitions

Volume Areas: Markets will build on areas of high-volume (HVNodes). Should the market trend for long periods of time, it will be identified by low-volume areas (LVNodes). LVNodes denote directional conviction and ought to offer support on any test.

If participants auction and find acceptance in an area of a prior LVNode, then future discovery ought to be volatile and quick as participants look to HVNodes for favorable entry or exit.

MCPOCs: Denote areas where two-sided trade was most prevalent over numerous sessions. Participants will respond to future tests of value as they offer favorable entry and exit.


About

In short, an economics graduate working in finance and journalism.

Capelj spends most of his time as the founder of Physik Invest through which he invests and publishes daily analyses to subscribers, some of whom represent well-known institutions.

Separately, Capelj is an equity options analyst at SpotGamma and an accredited journalist interviewing global leaders in business, government, and finance.

Past works include conversations with investor Kevin O’Leary, ARK Invest’s Catherine Wood, FTX’s Sam Bankman-Fried, Lithuania’s Minister of Economy and Innovation Aušrinė Armonaitė, former Cisco chairman and CEO John Chambers, and persons at the Clinton Global Initiative.

Contact

Direct queries to renato@physikinvest.com or Renato Capelj#8625 on Discord.

Calendar

You may view this letter’s content calendar at this link.

Disclaimer

Do not construe this newsletter as advice. All content is for informational purposes.
Categories
Commentary

Daily Brief For December 21, 2022

Physik Invest’s Daily Brief is read by thousands of subscribers. You, too, can join this community to learn about the fundamental and technical drivers of markets.

Graphic updated 9:35 AM ET. Sentiment Risk-On if expected /ES open is above the prior day’s range. /ES levels are derived from the profile graphic at the bottom of this letter. Levels may have changed since initially quoted; click here for the latest levels. SqueezeMetrics Dark Pool Index (DIX) and Gamma (GEX) with the latter calculated based on where the prior day’s reading falls with respect to the MAX and MIN of all occurrences available. A higher DIX is bullish. At the same time, the lower the GEX, the more (expected) volatility. Click to learn the implications of volatility, direction, and moneyness. Breadth reflects a reading of the prior day’s NYSE Advance/Decline indicator. VIX reflects a current reading of the CBOE Volatility Index (INDEX: VIX) from 0-100.

Positioning

Traders may have observed a unique market dynamic occurring in the past sessions.

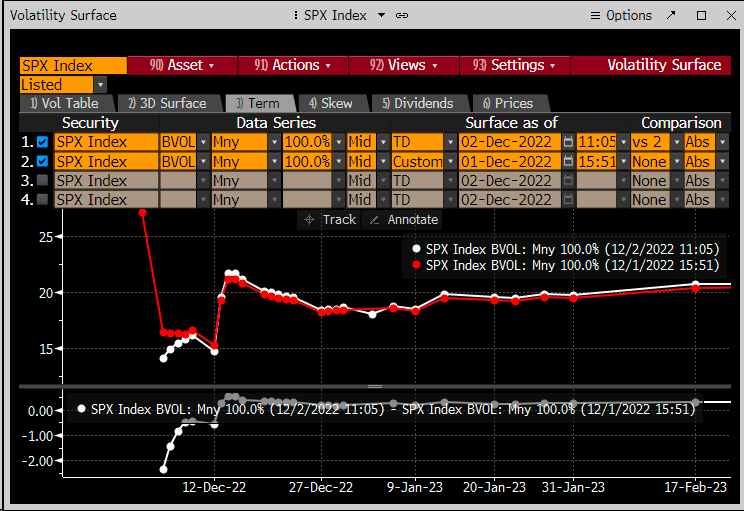
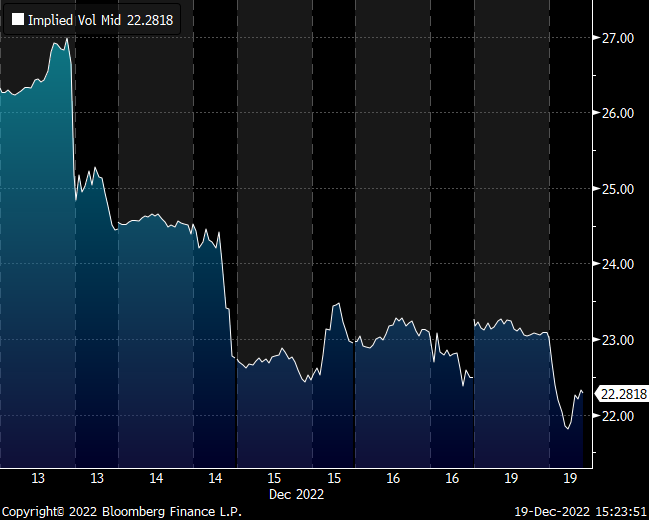
In spite of a down S&P 500 (INDEX: SPX), fixed-strike and top-line implied volatility (IVOL) measures such as the Cboe Volatility Index (INDEX: VIX), are on a downward trajectory. Let’s unpack.

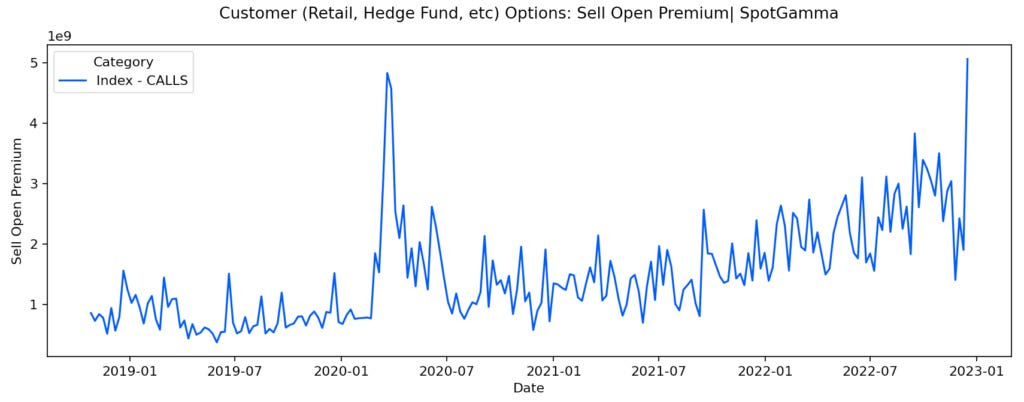
Heading into the December monthly options expiration (OPEX), traders were seeking to bet on and guard against large market movement. Traders’ demand for options, particularly those that are shorter-dated, bid IVOL markedly over the period running up to December OPEX.

Graphic: Retrieved from Bloomberg via Michael Kramer. “No reason for the Cboe Volatility Index (INDEX: VIX) to rise when OPEX every day allows precision hedging.”

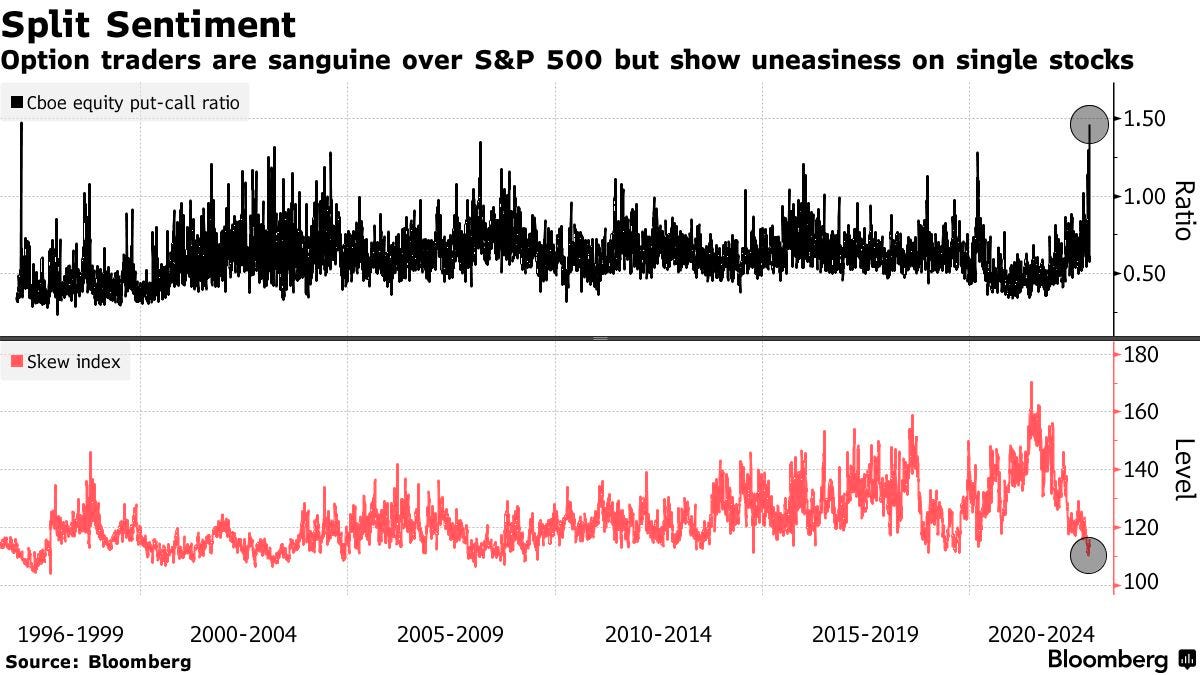
In fact, based on the pricing of options, the “consensus was a large right tail move in stocks,” SpotGamma explained in a recent note. Just look at the prices of options expiring December 15. There was a big premium in ultra-short-dated S&P 500 call options (left) versus puts (right).

Graphic: Retrieved by Physik Invest via the thinkorswim platform.

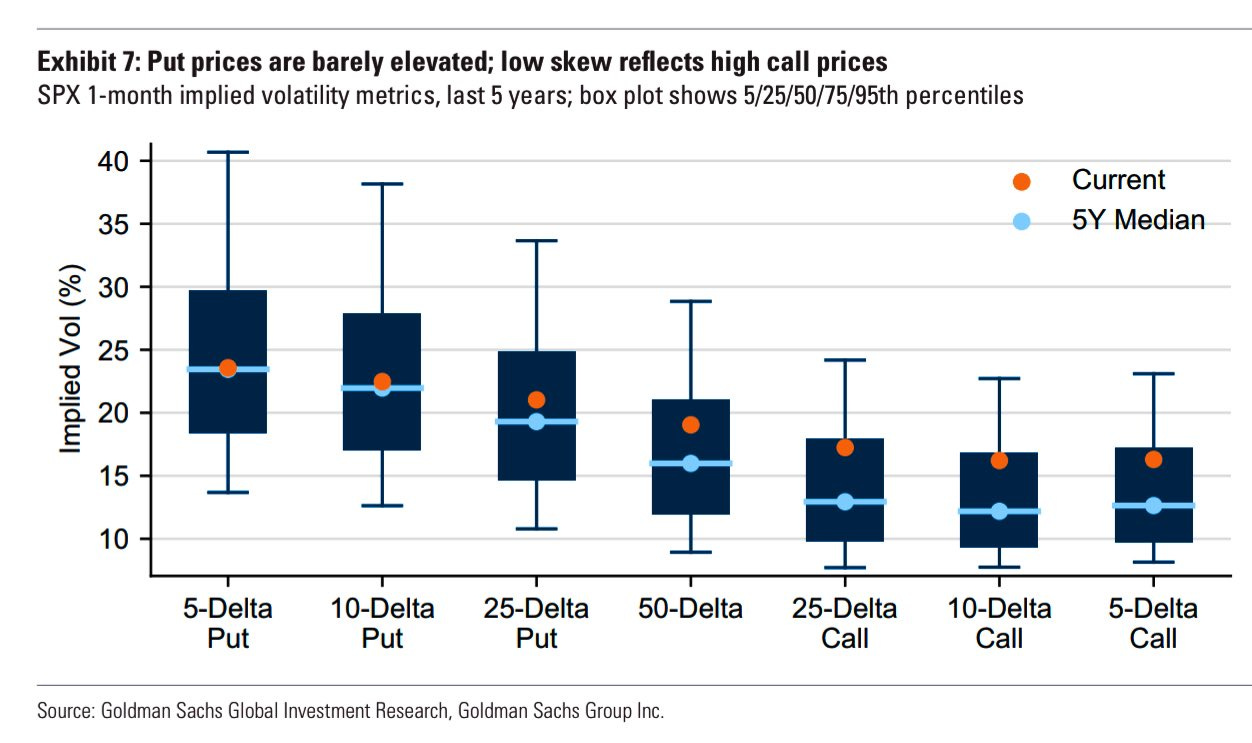
The same can be viewed via low volatility skew, in part the result of traders’ decreased interest in owning downside protection (as there is less reason to hold downside protection if you have sold your long stock and/or you have monetized existing protection during the 2022 decline).

Graphic: Retrieved from Goldman Sachs Group Inc (NYSE: GS).

Anyways, as a result, counterparties (i.e., those who supplied traders their positive exposure to movement) were left “short a massive amount of Gamma,” or negative exposure to movement, which often results in hedging that reduces market liquidity and fattens the tails of the potential distribution of returns (i.e., buying strength and selling weakness), Kai Volatility said in a letter; positioning boosted “crash risk” and the potential for “more melt-ups.”

A clear display of this was after the “CPI release on Tuesday … In a matter of hours, [the] market gapped up 4% [and] then gave it all back,” Kai Volatility said.

Graphic: Retrieved from Danny Kirsch of Piper Sandler Companies (NYSE: PIPR). S&P 500 (INDEX: SPX) January $4,100.00 call volatility down, while the market is up big, offsets rally.

To further explain, that is because short-dated options gain and lose value quickly given their increased sensitivity to changes in market movement (Gamma), as time passes. When the S&P 500 moved higher after CPI, call options gained a lot of value (Delta) very quickly. Those on the other side of that trade (i.e., counterparts), who had exposure to -Gamma or negative exposure to movement, went from having, for sake of brevity, very little -Delta to a lot of -Delta. Therefore, counterparts bought stock and futures (added +Delta) to hedge against an imbalance bolstering rapid up-market movement. When the short-dated exposure rolled off, these options risks were no longer there. Counterparts removed the +Delta they added (sold stock and futures back to the market) resulting in a move back down to where markets had started.

Moving on.

Following the events of last week, the absence of the unexpected (i.e., what traders sought to hedge and/or bet on), resulted in options selling (supply of protection), a pressure on options prices that remained through December’s large monthly OPEX.

Graphic: Retrieved from Goldman Sachs Group Inc (NYSE: GS) via Bloomberg. OPEX removed open interest that was demanded at higher levels of IVOL and skew over the past three years, per Kai Volatility’s Cem Karsan. The associated compression of IVOL (Vanna flow) and the passage of time (Charm flow) you would expect to see this December period (i.e., bullish seasonality), coupled with a dash-for-cash and tax-loss selling seen following the calendar flip, was front-run creating the context for this market down, IVOL down environment.

These pressures are expected to last through January 10, as it’s easy to sell high IVOL likely to expire worthless (knowing there are good odds that nothing happens through the holidays), and own IVOL on the back of that period which is cheap.

Graphic: Retrieved from Danny Kirsch of Piper Sandler Companies (NYSE: PIPR). S&P 500 (INDEX: SPX) January $3,800.00 put volatility down while the market is down.

As Karsan puts it, “you’ll have some moments of minor excitement but no crazy tails,” until the week of January 10 when we are more likely to “see a countertrend rally.”

Following this period, as far out as May, there is a seasonal effect in the volatility space that could set the stage for a sharp leg lower. More on this later.

Technical

As of 9:30 AM ET, Wednesday’s regular session (9:30 AM – 4:00 PM ET), in the S&P 500, is likely to open in the upper part of a positively skewed overnight inventory, outside of prior-range and -value, suggesting a potential for immediate directional opportunity.

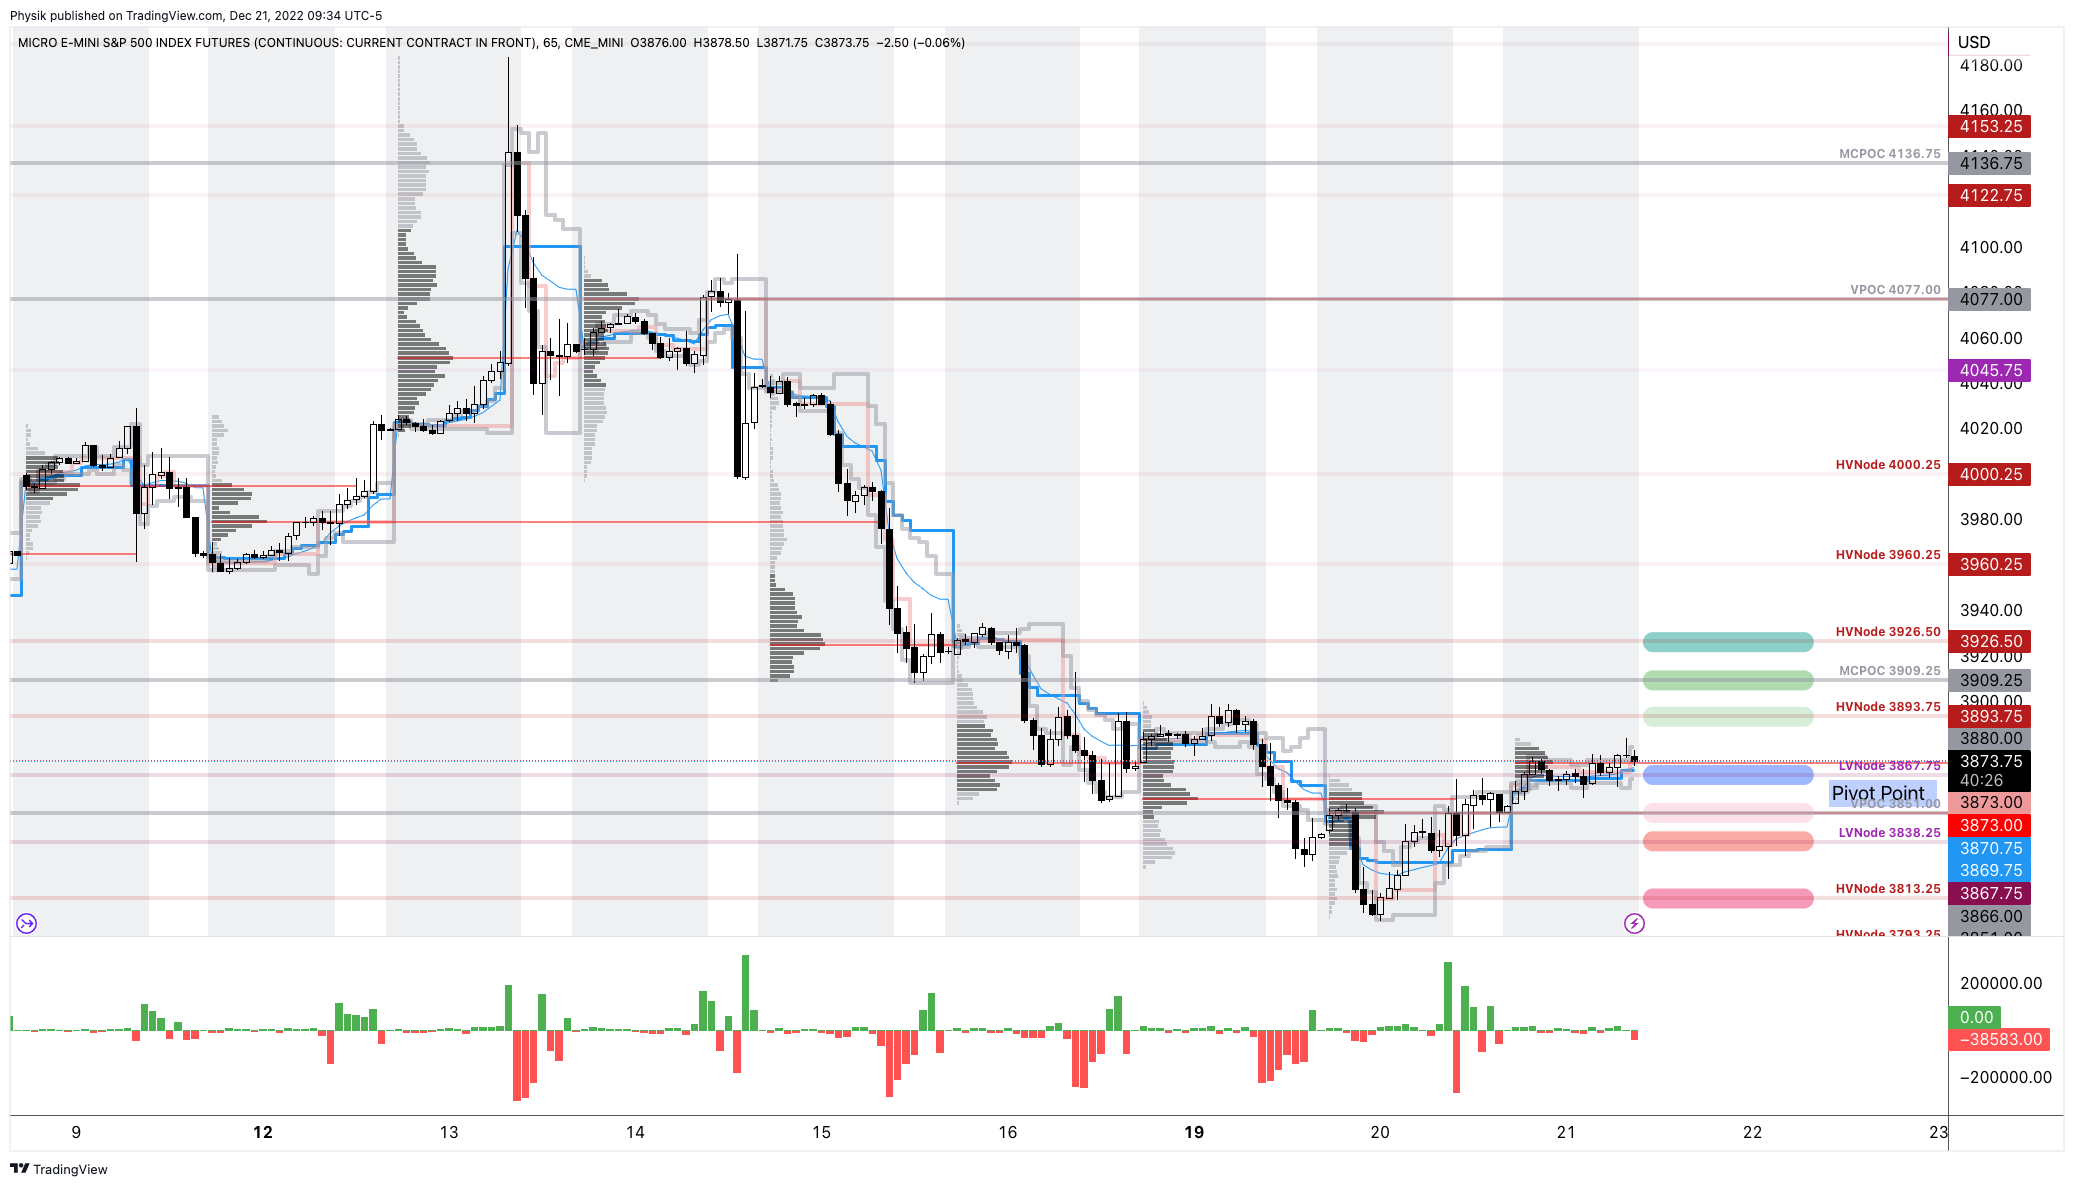
Our S&P 500 pivot for today is $3,867.75. 

Key levels to the upside include $3,893.75, $3,909.25, and $3,926.50. 

Key levels to the downside include $3,851.00, $3,838.25, and $3,813.25.

Click here to load today’s key levels into the web-based TradingView platform. All levels are derived using the 65-minute timeframe. New links are produced, daily.

Graphic: 65-minute profile chart of the Micro E-mini S&P 500 Futures.

Definitions

Volume Areas: Markets will build on areas of high-volume (HVNodes). Should the market trend for long periods of time, it will be identified by low-volume areas (LVNodes). LVNodes denote directional conviction and ought to offer support on any test.

If participants auction and find acceptance in an area of a prior LVNode, then future discovery ought to be volatile and quick as participants look to HVNodes for favorable entry or exit.

POCs: Denote areas where two-sided trade was most prevalent in a prior day session. Participants will respond to future tests of value as they offer favorable entry and exit.


About

In short, an economics graduate working in finance and journalism.

Capelj spends most of his time as the founder of Physik Invest through which he invests and publishes daily analyses to subscribers, some of whom represent well-known institutions.

Separately, Capelj is an equity options analyst at SpotGamma and an accredited journalist interviewing global leaders in business, government, and finance.

Past works include conversations with investor Kevin O’Leary, ARK Invest’s Catherine Wood, FTX’s Sam Bankman-Fried, Lithuania’s Minister of Economy and Innovation Aušrinė Armonaitė, former Cisco chairman and CEO John Chambers, and persons at the Clinton Global Initiative.

Contact

Direct queries to renato@physikinvest.com or Renato Capelj#8625 on Discord.

Calendar

You may view this letter’s content calendar at this link.

Disclaimer

Do not construe this newsletter as advice. All content is for informational purposes.
Categories
Commentary

Daily Brief For December 2, 2022

Physik Invest’s Daily Brief is read by thousands of subscribers. You, too, can join this community to learn about the fundamental and technical drivers of markets.

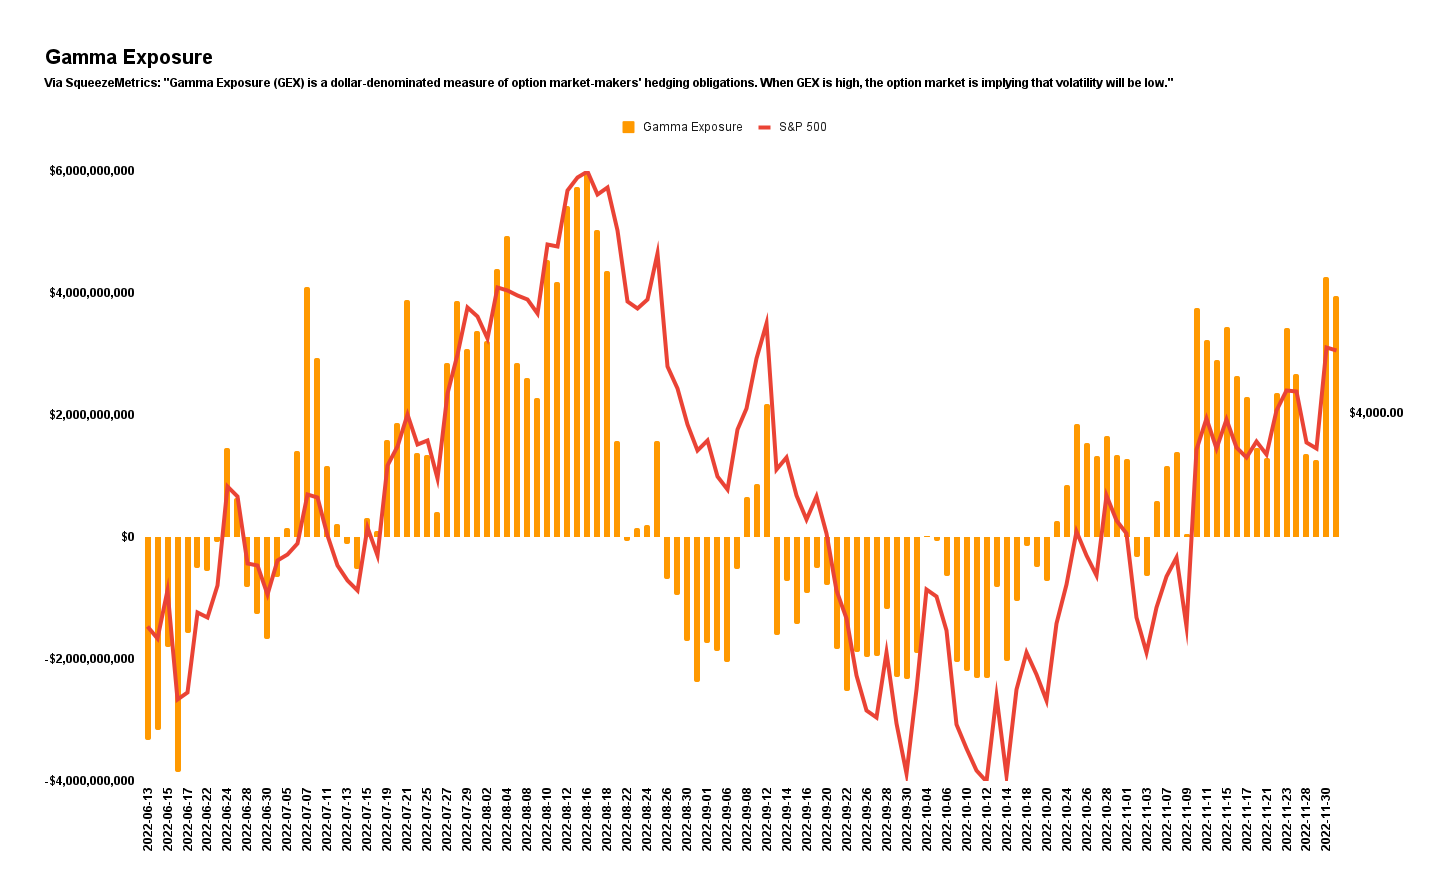
Graphic updated 7:45 AM ET. Sentiment Neutral if expected /ES open is inside of the prior day’s range. /ES levels are derived from the profile graphic at the bottom of this letter. Levels may have changed since initially quoted; click here for the latest levels. SqueezeMetrics Dark Pool Index (DIX) and Gamma (GEX) with the latter calculated based on where the prior day’s reading falls with respect to the MAX and MIN of all occurrences available. A higher DIX is bullish. At the same time, the lower the GEX, the more (expected) volatility. Click to learn the implications of volatility, direction, and moneyness. Breadth reflects a reading of the prior day’s NYSE Advance/Decline indicator. VIX reflects a current reading of the CBOE Volatility Index (INDEX: VIX) from 0-100.

Administrative

We will issue a content calendar revealing the dates letters are likely to be published and the content that may be covered.

Separately, due to the writer’s travel commitments, from 12/6 to 12/16 there will likely be little to no commentary. If any queries, or if you are local to New York City or Paris, ping renato@physikinvest.com or Renato Capelj#8625 on Discord.

Please check out the Daily Brief for November 29 and 30, as well as December 1.

On 11/29, we unpacked the context for a trade to take. On 11/30, we took that trade. On 12/1 we dissected the performance of that trade.

Given a time crunch, today’s letter will be lighter – really sorry!

Fundamental

Many headlines and increased alertness surround employment gauges, housing, and currency markets (e.g., yen sensitivity to U.S. Treasury yields; yen up and the dollar down after the Federal Reserve’s Jerome Powell suggested an easing in the pace of tightening). If interested, read Physik Invest’s letters on the yen and carry trades.

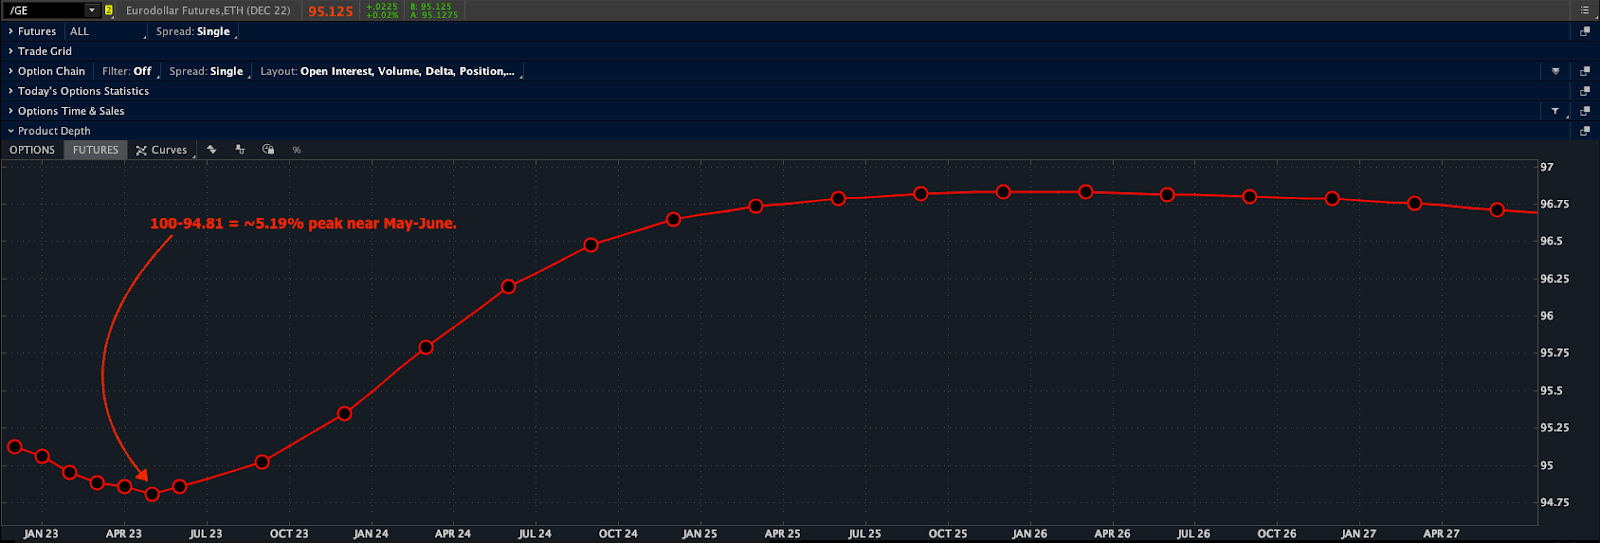
As an aside, an interesting quote comes from BlackRock Inc’s (NYSE: BLK) Gargi Chaudhuri, if yields were to hit “6.5% or 7%,” investors’ “fixed income will do so much of the hard work … that they don’t actually need as much of the equity exposure.” To add, however, the terminal rate sits around 5.2%.

Graphic: Updated December 1, 2022. Via Charles Schwab Corporation’s (NYSE: SCHW) TD Ameritrade thinkorswim. Observed is the Eurodollar, the interest offered on U.S. dollar-denominated deposits held at banks outside of the U.S. (i.e., participants’ outlook on interest rates).

Positioning

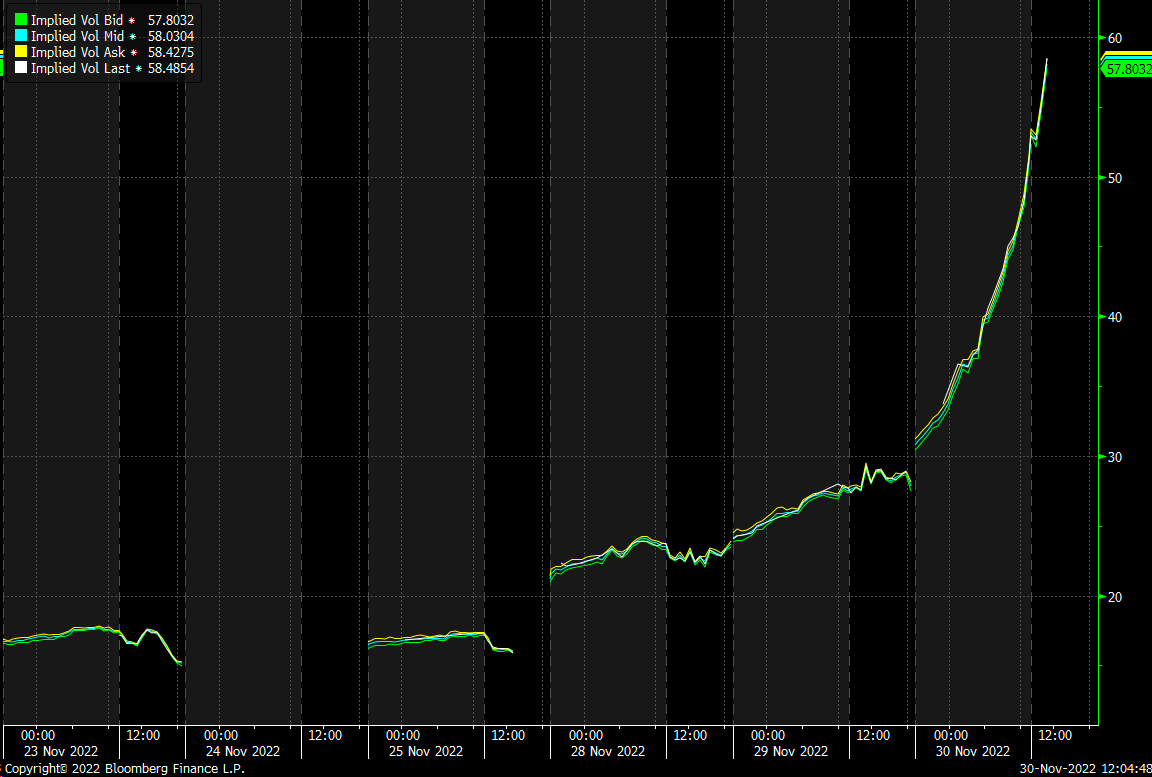
Per SpotGamma, recent action has been “dominated by very short-dated options”; on November 30, implied volatility (IVOL) measures for the same day’s expiry rose, pointing to demand for protection across options with the least time to expiry.

These options are highly sensitive and, if traded in a large enough size, can impact markets markedly (e.g., provide a big boost to bullish-type macro repositioning when the IVOL of soon-to-expire options finally compresses).

Graphic: Retrieved from Bloomberg via Michael J. Kramer.

That said, a trend is intact.

Traders’ fears continue to be assuaged, as evidenced by a general “supply of call options,” per SpotGamma, and further “implied volatility compression”; investors’ counterparts (i.e., liquidity providers) are recipient to increased positive exposure to movement (i.e., +Gamma), as evidenced by the below graphic. If movement is beneficial, and the counterparty is not interested in realizing that benefit, it may hedge in a manner that can eat away at realized volatility (RVOL), resulting in tighter ranges. SpotGamma adds that “barring big changes in positioning into 12/14 FOMC and 12/16 OPEX,” expected is more of the same (i.e., sideways to higher).

Graphic: Retrieved from Physik Invest.

Technical

As of 7:45 AM ET, Friday’s regular session (9:30 AM – 4:00 PM ET), in the S&P 500, is likely to open in the middle part of a balanced overnight inventory, inside of prior-range and -value, suggesting a limited potential for immediate directional opportunity.

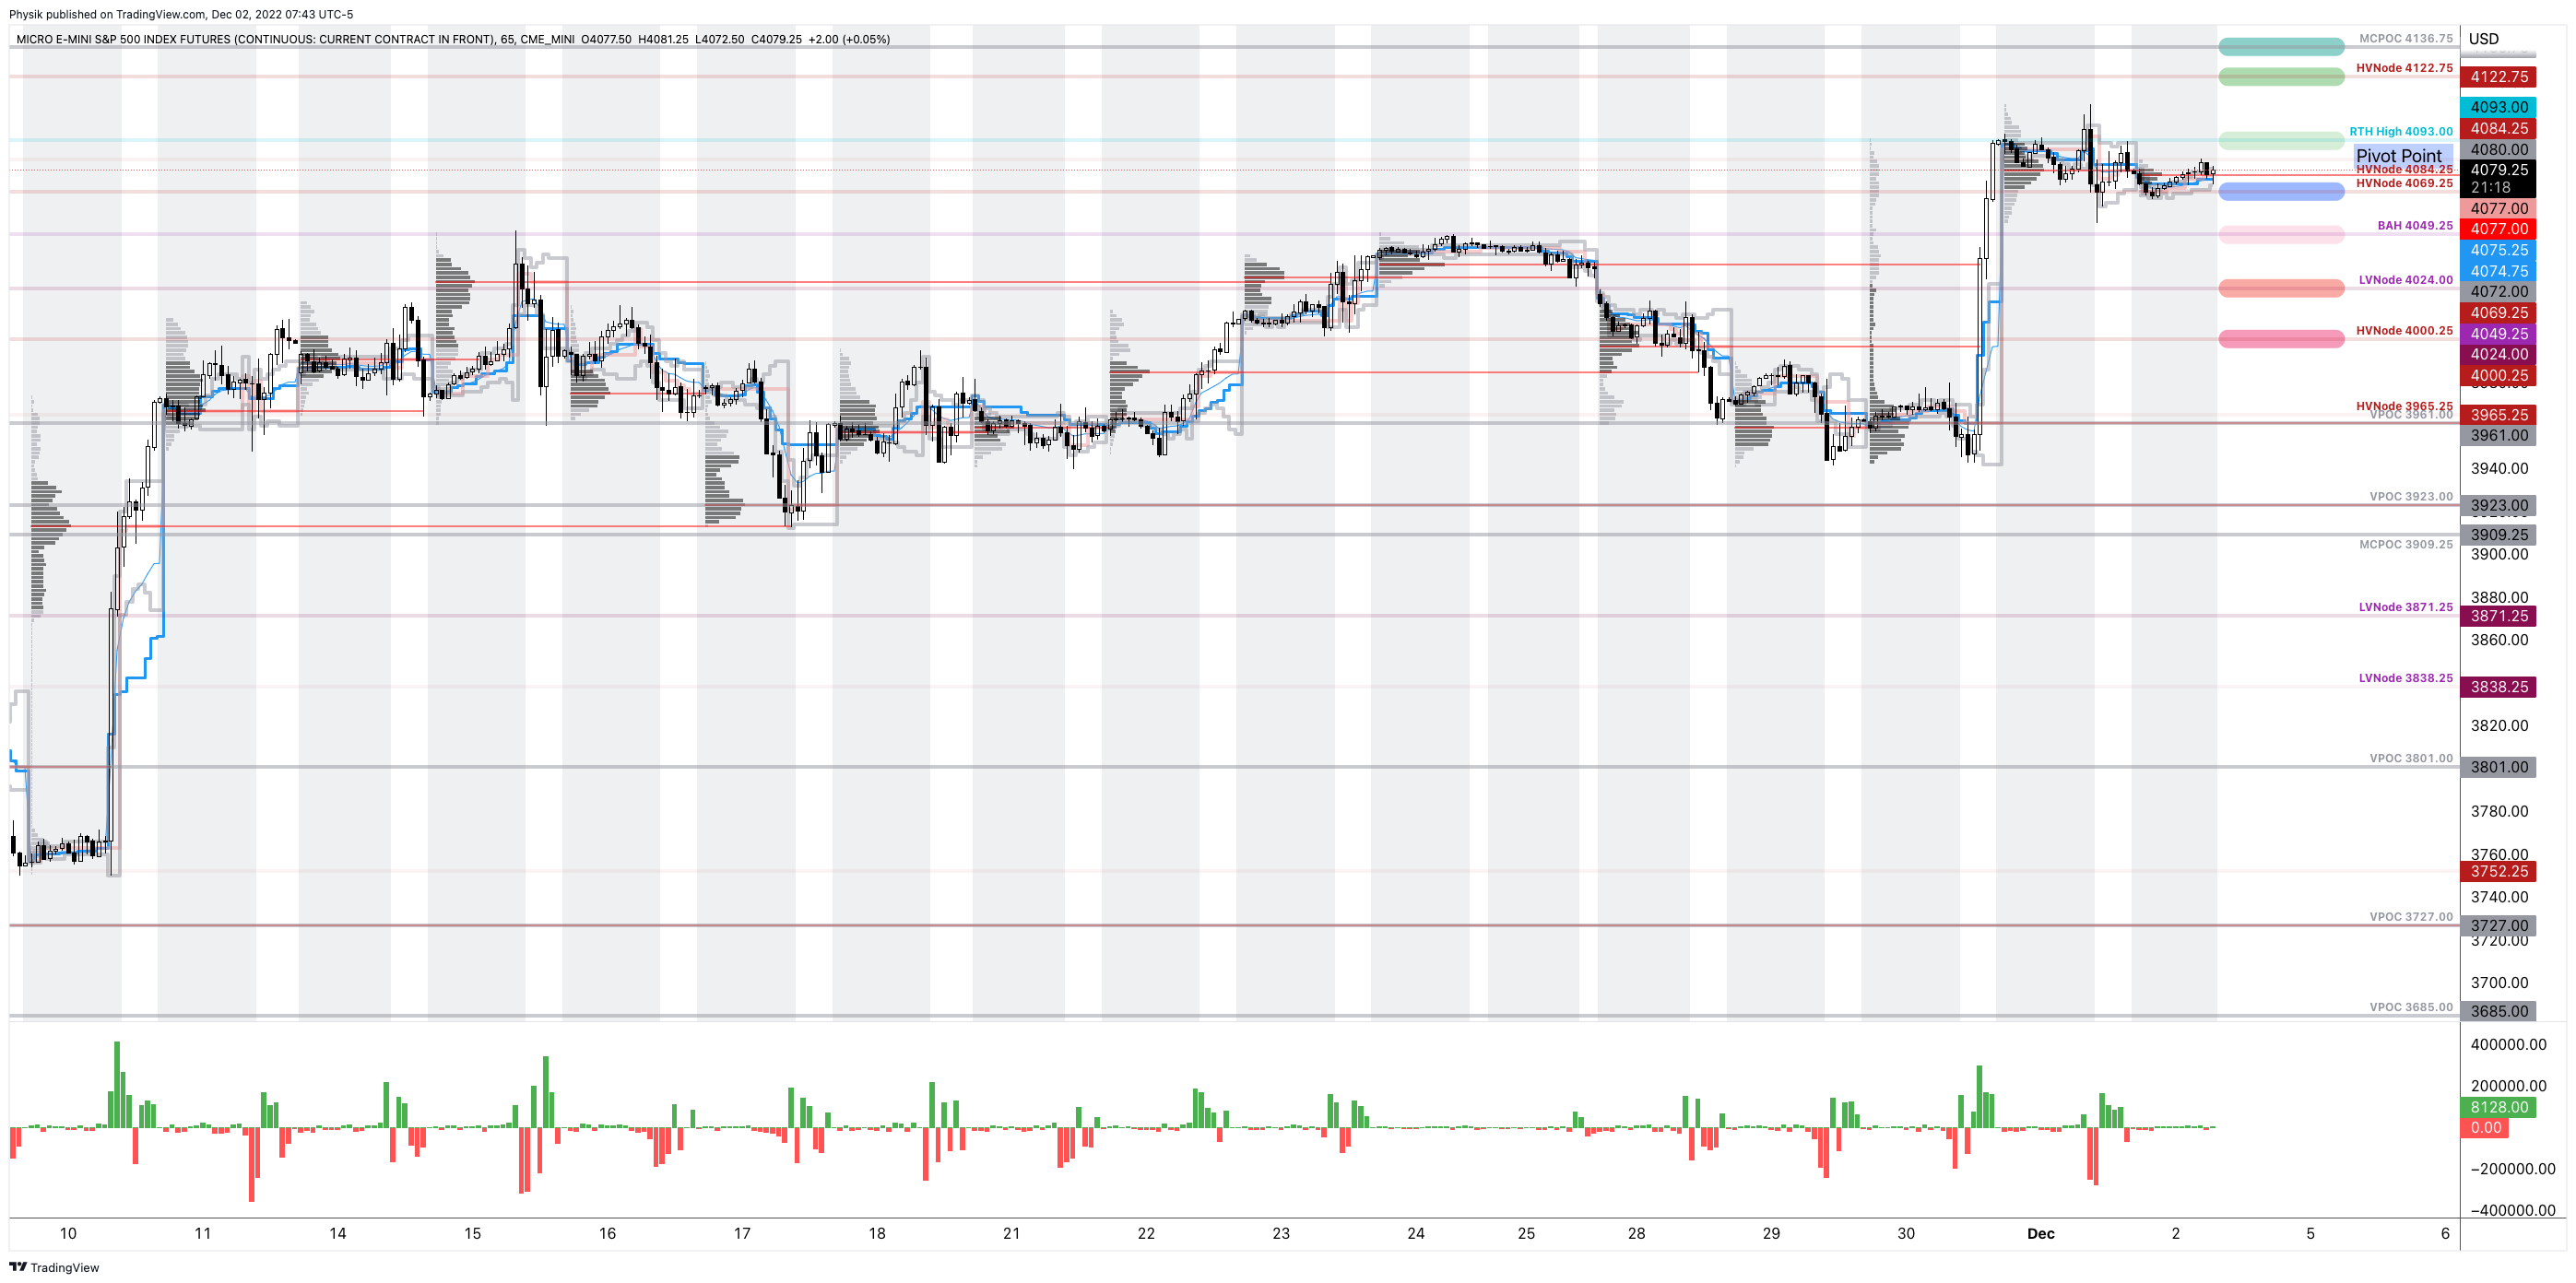
Our S&P 500 pivot for today is $4,069.25.

Key levels to the upside include $4,093.00, $4,122.75, and $4,136.75.

Key levels to the downside include $4,049.25, $4,024.00, and $4,000.25.

Click here to load today’s key levels into the web-based TradingView platform. All levels are derived using the 65-minute timeframe. New links are produced, daily.

Graphic: 65-minute profile chart of the Micro E-mini S&P 500 Futures.

Definitions

Volume Areas: Markets will build on areas of high-volume (HVNodes). Should the market trend for long periods of time, it will be identified by low-volume areas (LVNodes). LVNodes denote directional conviction and ought to offer support on any test.

If participants auction and find acceptance in an area of a prior LVNode, then future discovery ought to be volatile and quick as participants look to HVNodes for favorable entry or exit.

POCs: Denote areas where two-sided trade was most prevalent in a prior day session. Participants will respond to future tests of value as they offer favorable entry and exit.

MCPOCs: Denote areas where two-sided trade was most prevalent over numerous sessions. Participants will respond to future tests of value as they offer favorable entry and exit.

Volume-Weighted Average Prices (VWAPs): A metric highly regarded by chief investment officers, among other participants, for quality of trade. Additionally, liquidity algorithms are benchmarked and programmed to buy and sell around VWAPs.


About

In short, an economics graduate working in finance and journalism.

Capelj spends most of his time as the founder of Physik Invest through which he invests and publishes daily analyses to subscribers, some of whom represent well-known institutions.

Separately, Capelj is an equity options analyst at SpotGamma and an accredited journalist interviewing global leaders in business, government, and finance.

Past works include conversations with investor Kevin O’Leary, ARK Invest’s Catherine Wood, FTX’s Sam Bankman-Fried, Lithuania’s Minister of Economy and Innovation Aušrinė Armonaitė, former Cisco chairman and CEO John Chambers, and persons at the Clinton Global Initiative.

Contact

Direct queries to renato@physikinvest.com or Renato Capelj#8625 on Discord.

Disclaimer

Do not construe this newsletter as advice. All content is for informational purposes.
Categories
Commentary

Daily Brief For November 18, 2022

Physik Invest’s Daily Brief is read by over 1,200 people. To join this community and learn about the fundamental and technical drivers of markets, subscribe below.

Graphic updated 9:00 AM ET. Sentiment Risk-On if expected /ES open is above the prior day’s range. /ES levels are derived from the profile graphic at the bottom of this letter. Levels may have changed since initially quoted; click here for the latest levels. SqueezeMetrics Dark Pool Index (DIX) and Gamma (GEX) with the latter calculated based on where the prior day’s reading falls with respect to the MAX and MIN of all occurrences available. A higher DIX is bullish. At the same time, the lower the GEX, the more (expected) volatility. Click to learn the implications of volatility, direction, and moneyness. Breadth reflects a reading of the prior day’s NYSE Advance/Decline indicator. VIX reflects a current reading of the CBOE Volatility Index (INDEX: VIX) from 0-100.

Administrative

A short commentary today after Wednesday’s detailed letter. Take a look at that letter and, some of the below, for context on what we are likely to discuss next. If you are pressed for time, focus on the bolded statements. Have a good weekend!

Positioning

Keeping with the spirit of Wednesday’s ultra-detailed newsletter.

A key point in that letter was traders’ increased activity across short-term options and “anchoring to key areas such as $4,000.00 in the S&P 500.” This activity, in the face of a multi-week price rise, told us a lot about the state of the market. In short, the bigger participants, some of whom move by a committee and seldom respond to technical nuances, were probably waiting for more information before entering.

For that reason, our key S&P levels, quoted in recent letters, are holding.

Graphic: 65-minute profile chart of the Micro E-mini S&P 500 Futures.

That’s part of the big point we have attempted to get across, recently. Traders “have been flocking to short-dated contracts to cope with the market whiplash of late, an activity that has exerted outsize impact on the underlying equities,” per Bloomberg. Per data shown by SpotGamma, concentrations in these options have prompted pinning near key areas like $4,000.00 in the S&P, before its descent on Thursday.

You can go to Wednesday’s letter for the detailed explanation but, in short, the reach for positive exposure to the upside (+Delta) lent to recent market relief. Then, per the sales of volatility, just this last week, the sentiment changed to a wait-and-see stance.

Graphic: Retrieved from JPMorgan Chase & Co (NYSE: JPM).

As already stated, this wait-and-see stance was expressed through short-dated options that are highly sensitive to changes in direction (i.e., these options can go from having a lot of value or Delta to little, over a short window of time). This sensitivity is expressed via the higher Gamma of near-the-money options.

Graphic: Retrieved from Bloomberg.

For a quick check of how sticky these areas may be, one has to look at the level of +Gamma which has been on an uptrend.

As traders wait for more information and take bets against the market movement (i.e., volatility is sold or -Gamma) counterparties take on more +Gamma (i.e., their side of the bet does better when the market moves).

In hedging this +Gamma, counterparties reduce market movement (i.e., counterparty buy call and sell [buy] futures into price rise [dip]).

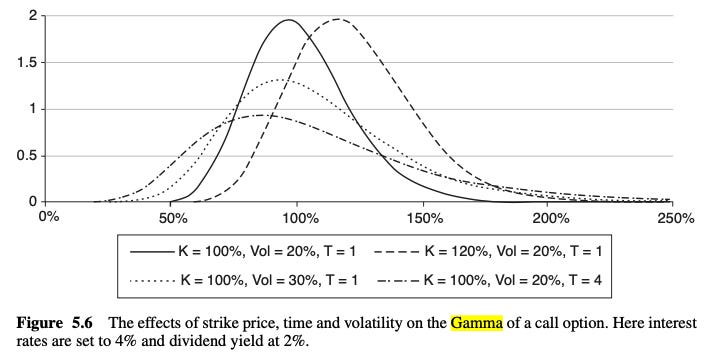
The shorter-dated the options, the more sensitive they are; options values (or Delta) can rise or fall quickly as Gamma increases when time passes. That may mean that the reaction results in movement reducing (further), and pinning near key areas.

Again, see Wednesday’s ultra-detailed newsletter for more detail.

Graphic: Taken from Exotic Options and Hybrids: A Guide to Structuring, Pricing and Trading. 

Another consequence, as picked up by individuals online including Darrin John, the S&P 500’s realized volatility (RVOL) “is so high” with “a basket of 500 of the ‘best’ stocks in the US [wildly] swing[ing] +5% in a single day,” while the S&P 500 is relatively mute, or your letter writer sees it.

That’s because of the following:

If there are forces that are pinning the S&P 500, all the while there are arbitrage constraints connecting its wilder components (in which traders are more uncertain and actively betting on direction and hedging), then correlation must suffer.

Graphic: Retrieved from Bloomberg.

In the face of brewing uncertainties, reflected in index put options activity that has translated “to an uptick in open interest at $3,900.00 and $3,950.00” in the S&P 500, per SpotGamma, -Gamma has increased.

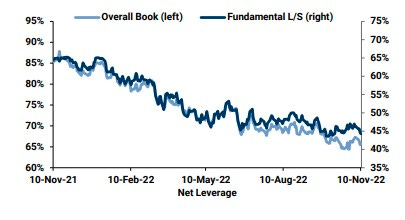
Graphic: Retrieved from Bloomberg. Via Goldman Sachs Group Inc (NYSE: GS). “Broadly, hedge funds’ net leverage, a gauge of risk appetite that measures the industry’s long versus short positions, sat in the 24th percentile of a one-year range, Goldman data show.”

If you take the statements about +Gamma above and reverse them, the opposite happens. With less +Gamma in the market, the result is less dislocation and index movement that is more in line with its wilder underlying components, hence the measured whipsaw, yesterday.

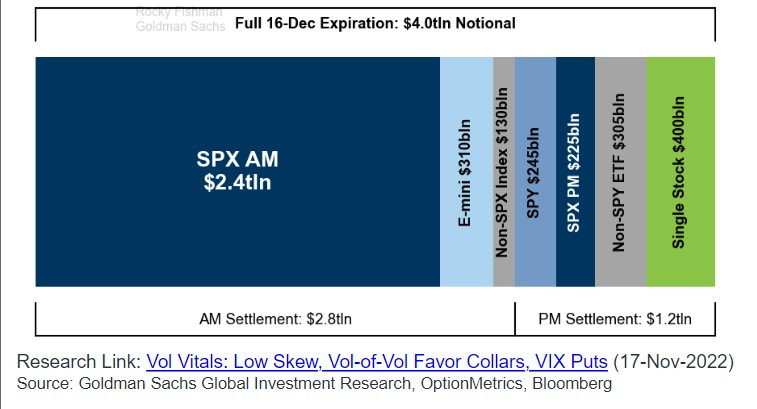
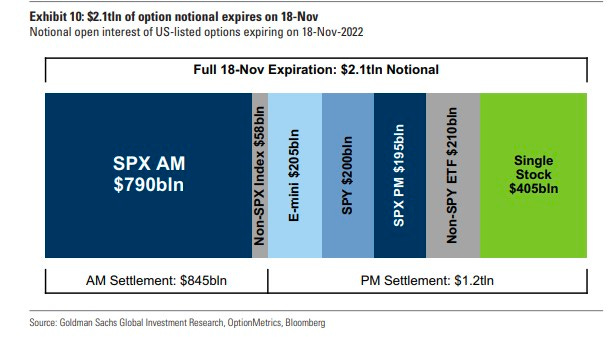
Anyways, today there’s a “$2.1 trillion options expiration” that will clear the deck of some of that sticky +Gamma we talked about earlier. Per SpotGamma, dealers are likely to react in a manner that “allows the market to move more.”

Graphic: Retrieved from Bloomberg. Via Goldman Sachs Group Inc (NYSE: GS).

One could construe that as bearish but it may pay more to not do so. The market is trading in a period during which there’s less liquidity. That may mean this hedging, for one, may result in continued support. The Holiday period pulls forward Delta buyback linked to options’ decay with respect to the passage of time (Charm). Therefore, per SpotGamma, weakness after expiration likely is contained.

“The potential for more violent downside (i.e., new YTD lows) increases into the end of the month and early December due to the large December options expiration.”

Graphic: Retrieved from SpotGamma.

For that reason, with “[l]​​ow skew and vol-of-vol,” entering trades that are convex and change non-linearly with respect to changes in underlying implied volatility (IVOL) and direction, are attractive.

That’s because of the following dynamics:

When you think there is to be an outsized move in the underlying, relative to what is priced, you buy options (+Gamma). When you think there is to be an outsized move in the implied volatility, relative to what is priced, you buy options (+Volga). If there is a large enough change in direction (RVOL) or IVOL, you may make money.

Graphic: Retrieved from Banco Santander SA (NYSE: SAN).

Technical

As of 9:00 AM ET, Friday’s regular session (9:30 AM – 4:00 PM ET), in the S&P 500, is likely to open in the upper part of a positively skewed overnight inventory, outside of prior-range and -value, suggesting a potential for immediate directional opportunity.

Our S&P 500 pivot for today is $4,000.25. 

Key levels to the upside include $4,027.00, $4,069.25, and $4,136.75. 

Key levels to the downside include $3,965.25, $3,923.00, and $3,871.25.

Click here to load today’s key levels into the web-based TradingView platform. All levels are derived using the 65-minute timeframe. New links are produced, daily.

Graphic: 65-minute profile chart of the Micro E-mini S&P 500 Futures.

Definitions

Volume Areas: A structurally sound market will build on areas of high volume (HVNodes). Should the market trend for long periods of time, it will lack sound structure, identified as low volume areas (LVNodes). LVNodes denote directional conviction and ought to offer support on any test. 

If participants were to auction and find acceptance into areas of prior low volume (LVNodes), then future discovery ought to be volatile and quick as participants look to HVNodes for favorable entry or exit.

POCs: POCs are valuable as they denote areas where two-sided trade was most prevalent in a prior day session. Participants will respond to future tests of value as they offer favorable entry and exit.

MCPOCs: POCs are valuable as they denote areas where two-sided trade was most prevalent over numerous day sessions. Participants will respond to future tests of value as they offer favorable entry and exit.
About

After years of self-education, strategy development, mentorship, and trial-and-error, Renato Leonard Capelj began trading full-time and founded Physik Invest to detail his methods, research, and performance in the markets. 
Capelj also writes options market analyses at SpotGamma and is a Benzinga journalist. 

His past works include private discussions with ARK Invest’s Catherine Wood, investors Kevin O’Leary and John Chambers, the infamous Sam Bankman-Fried of FTX, former Bridgewater Associate Andy Constan, Kai Volatility’s Cem Karsan, The Ambrus Group’s Kris Sidial, the Lithuanian Delegation’s Aušrinė Armonaitė, among many others.

Contact

Direct queries to renato@physikinvest.com or Renato Capelj#8625 on Discord.

Disclaimer

Do not construe this newsletter as advice. All content is for informational purposes.