What Happened
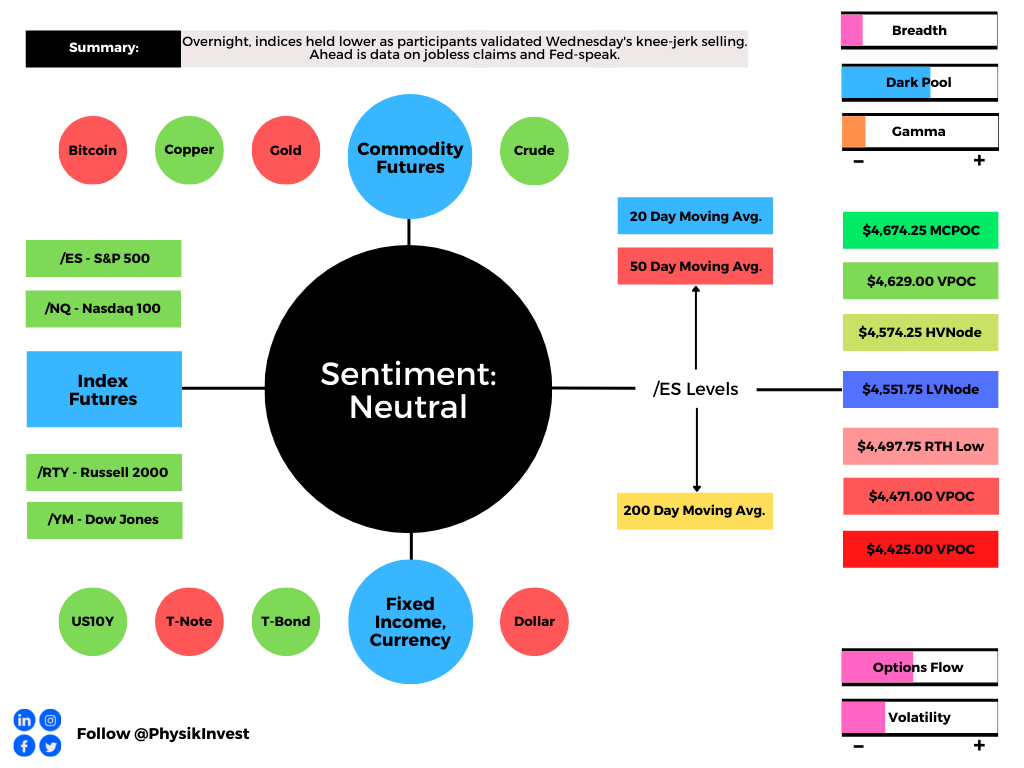
Overnight, equity index futures steadied at the prior day’s lows.
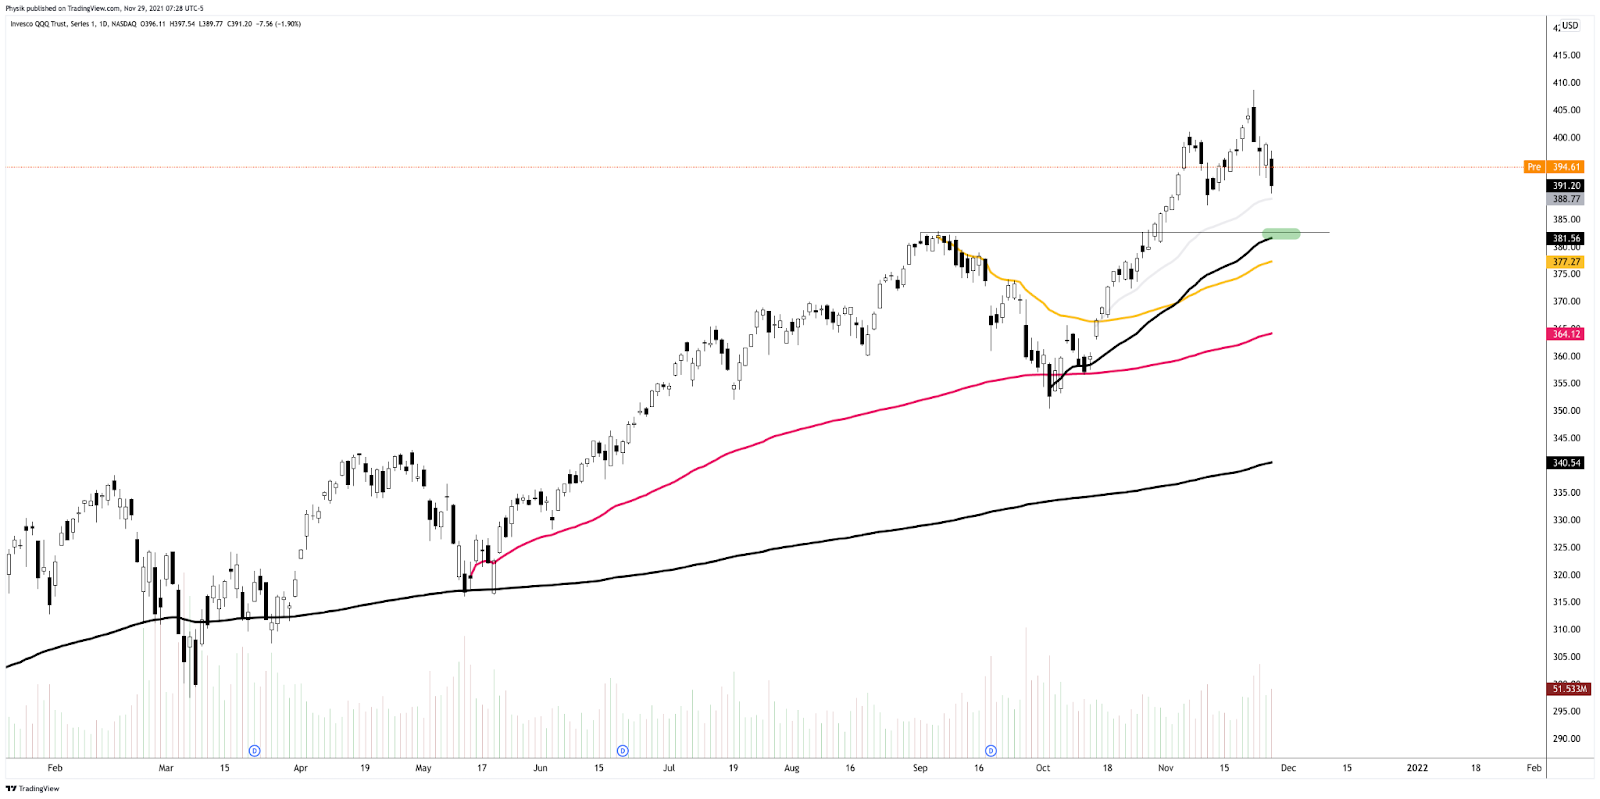
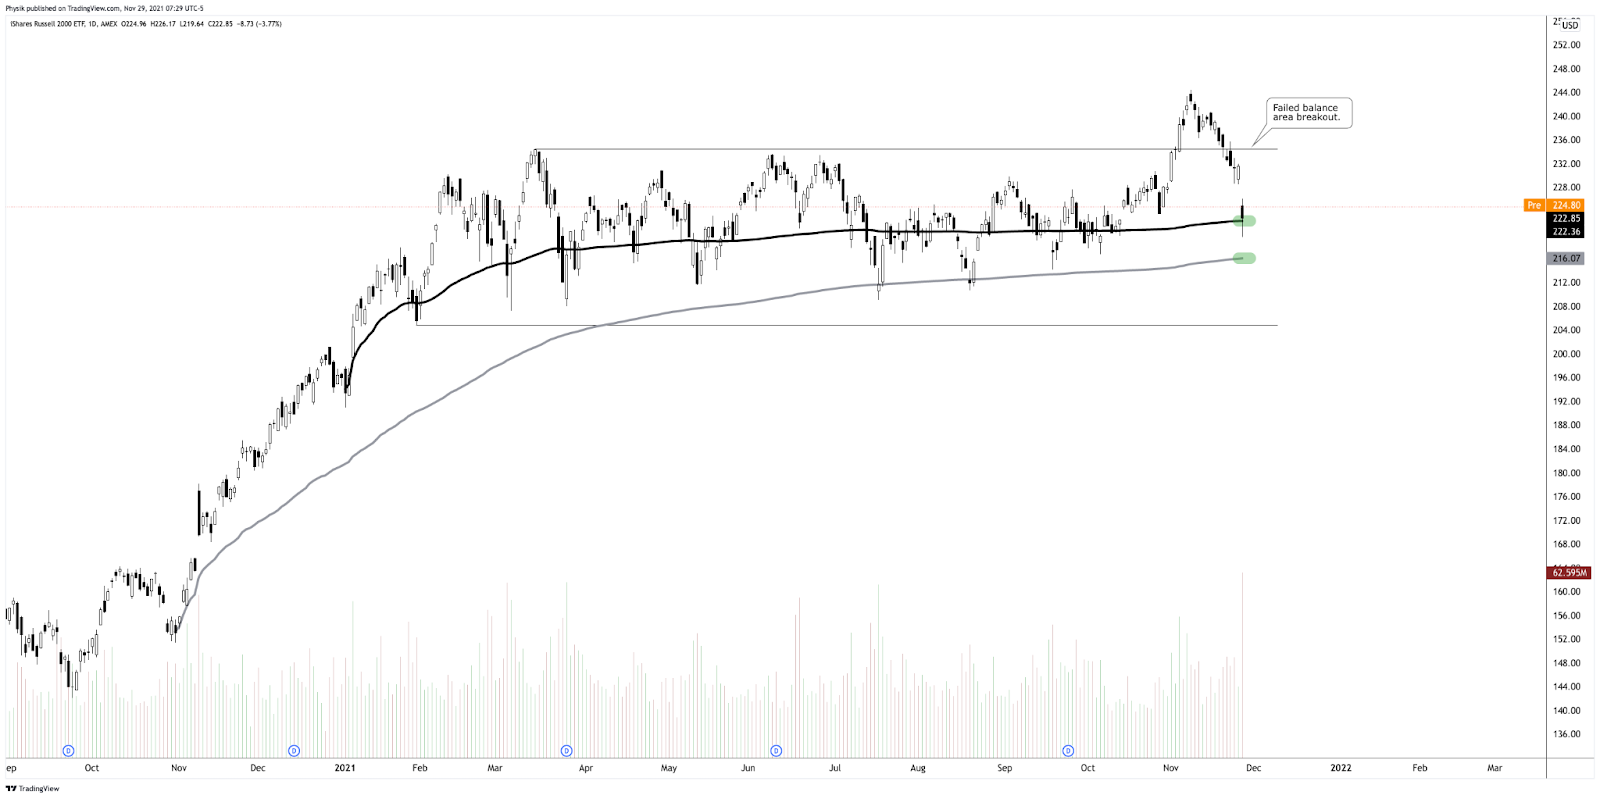
There were signs of a shift in relative strength as the Russell 2000’s extended-day recovery outpaced that of the S&P 500 and (now) weaker Nasdaq 100.
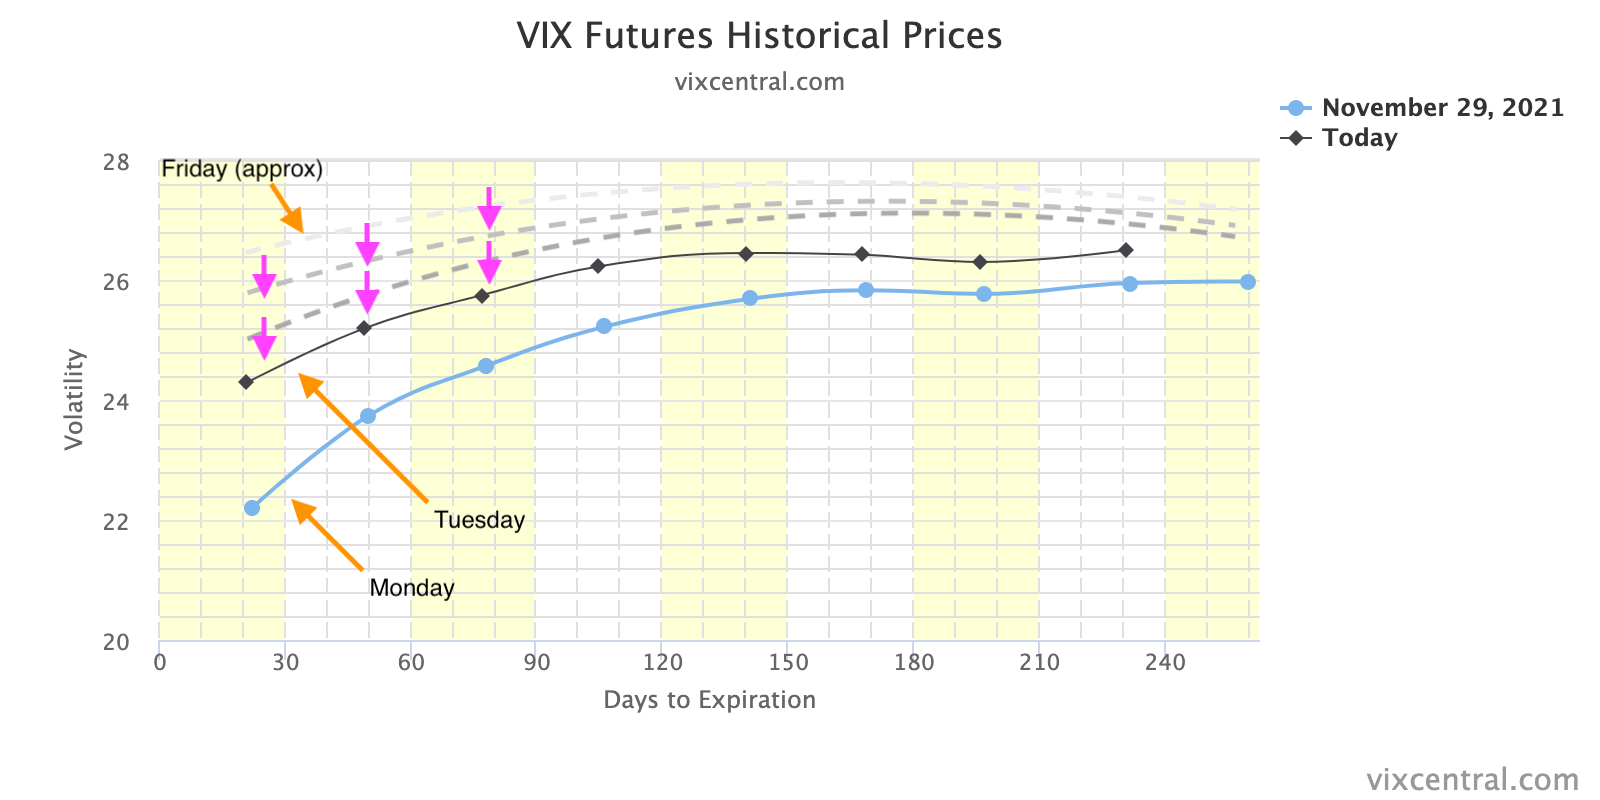
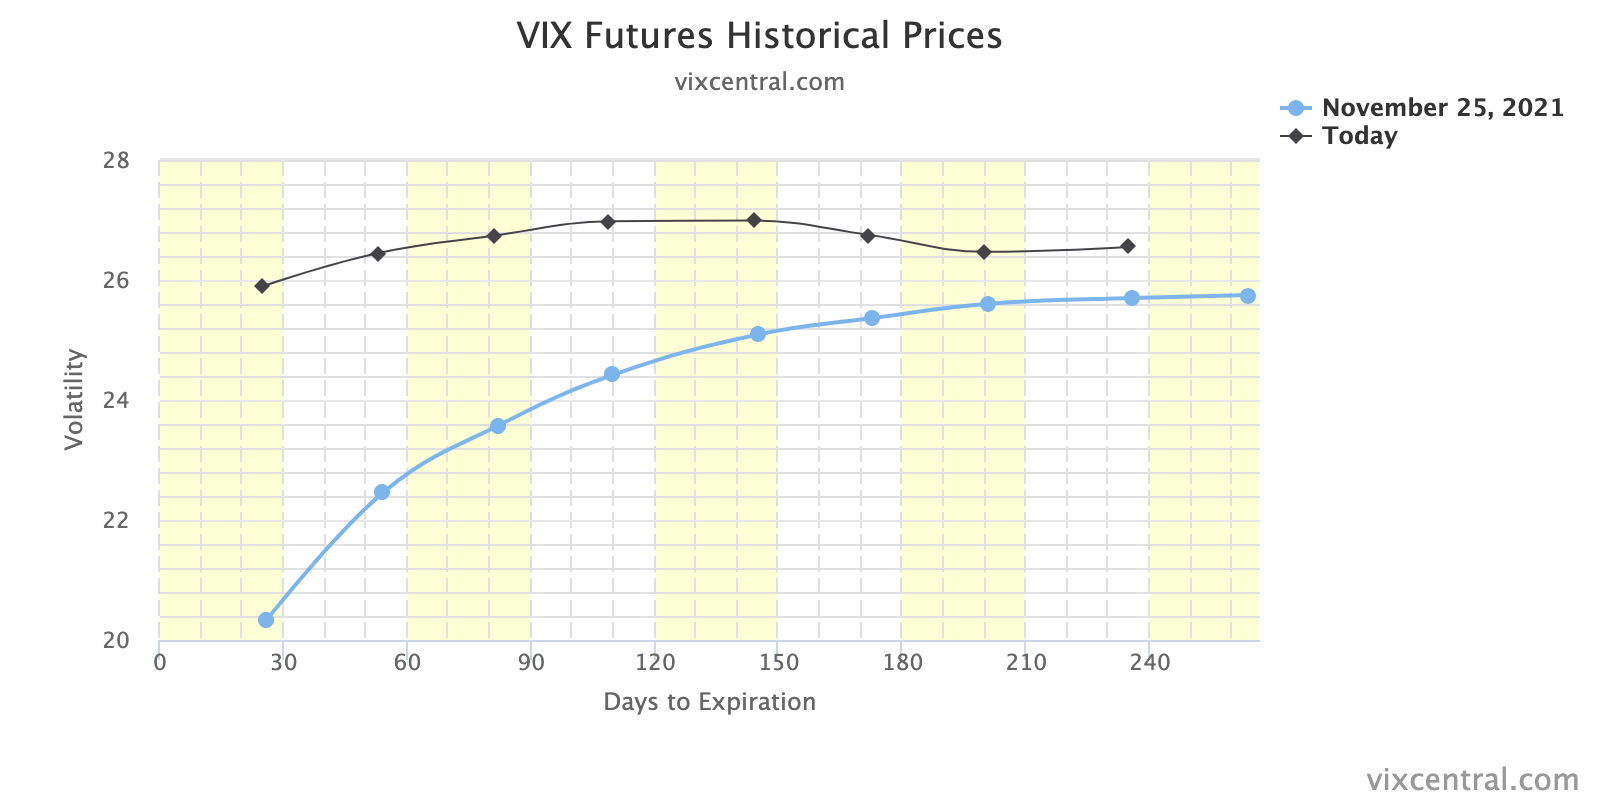
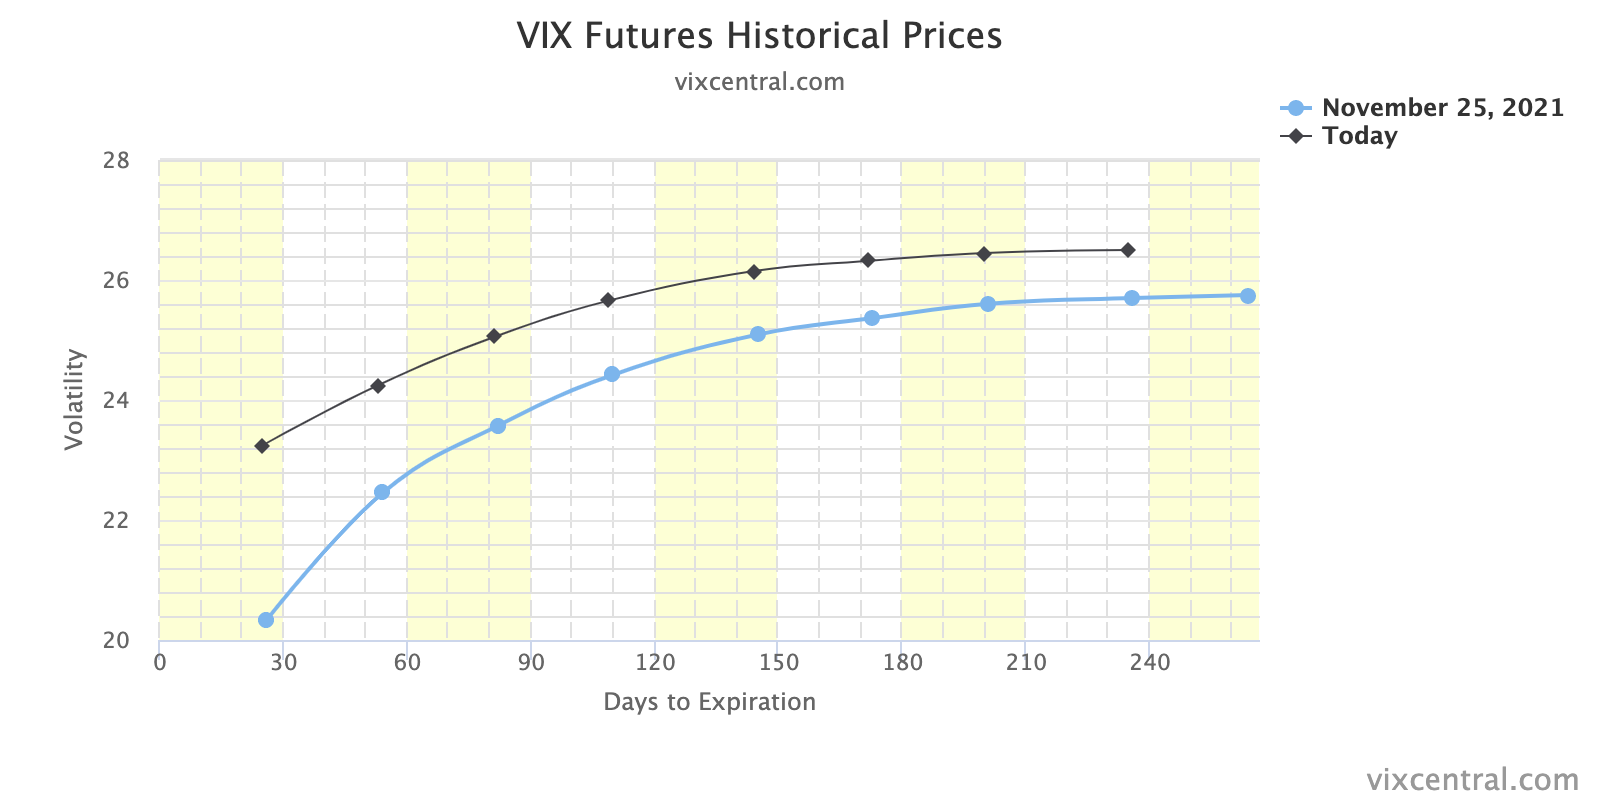
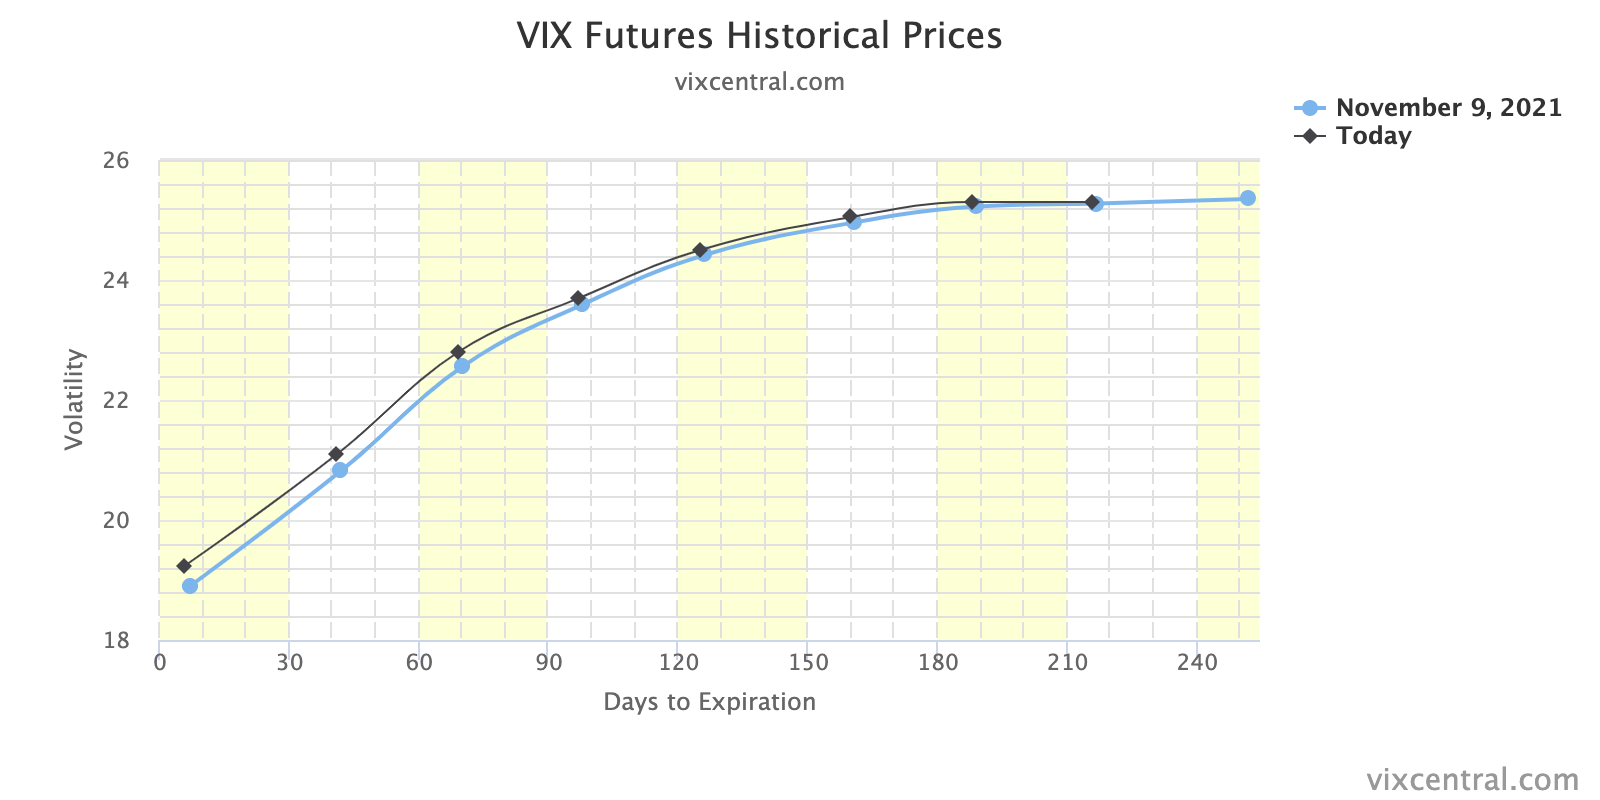
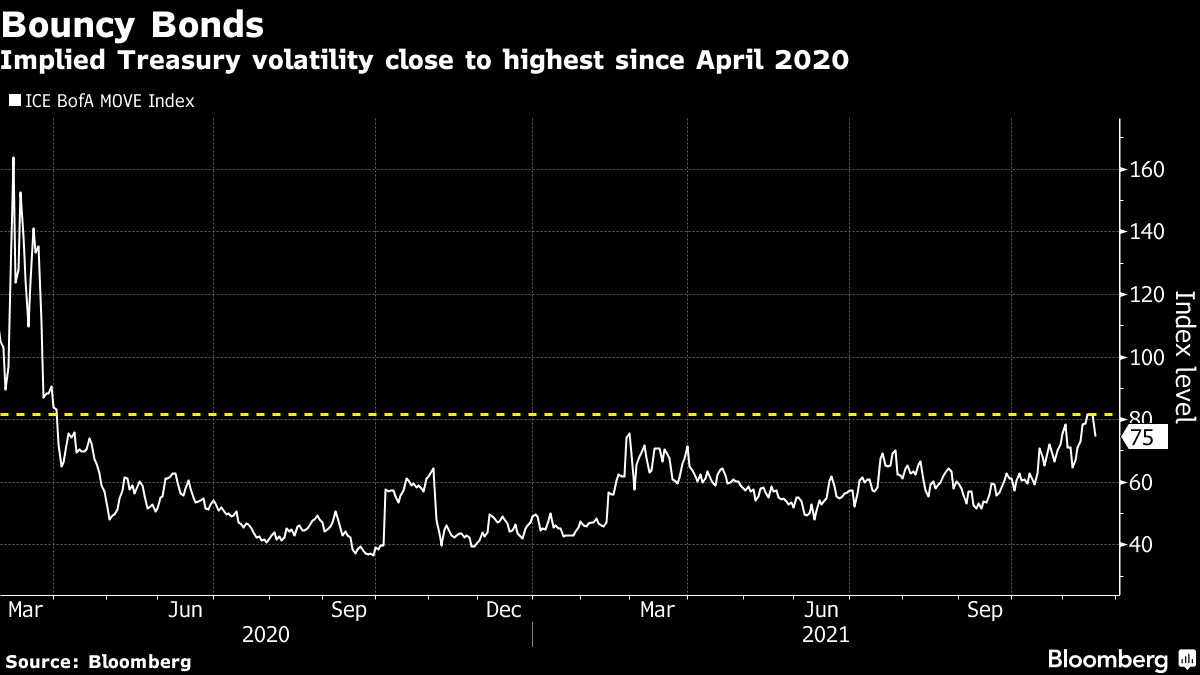
At the same time, yields on the ten-year rose while volatility came in. Still, the VIX futures term structure remained higher, a clear indication of stress, in the face of demand for protection.
Ahead is data on jobless claims (8:30 AM ET) with Fed-speak scattered throughout the day.
What To Expect
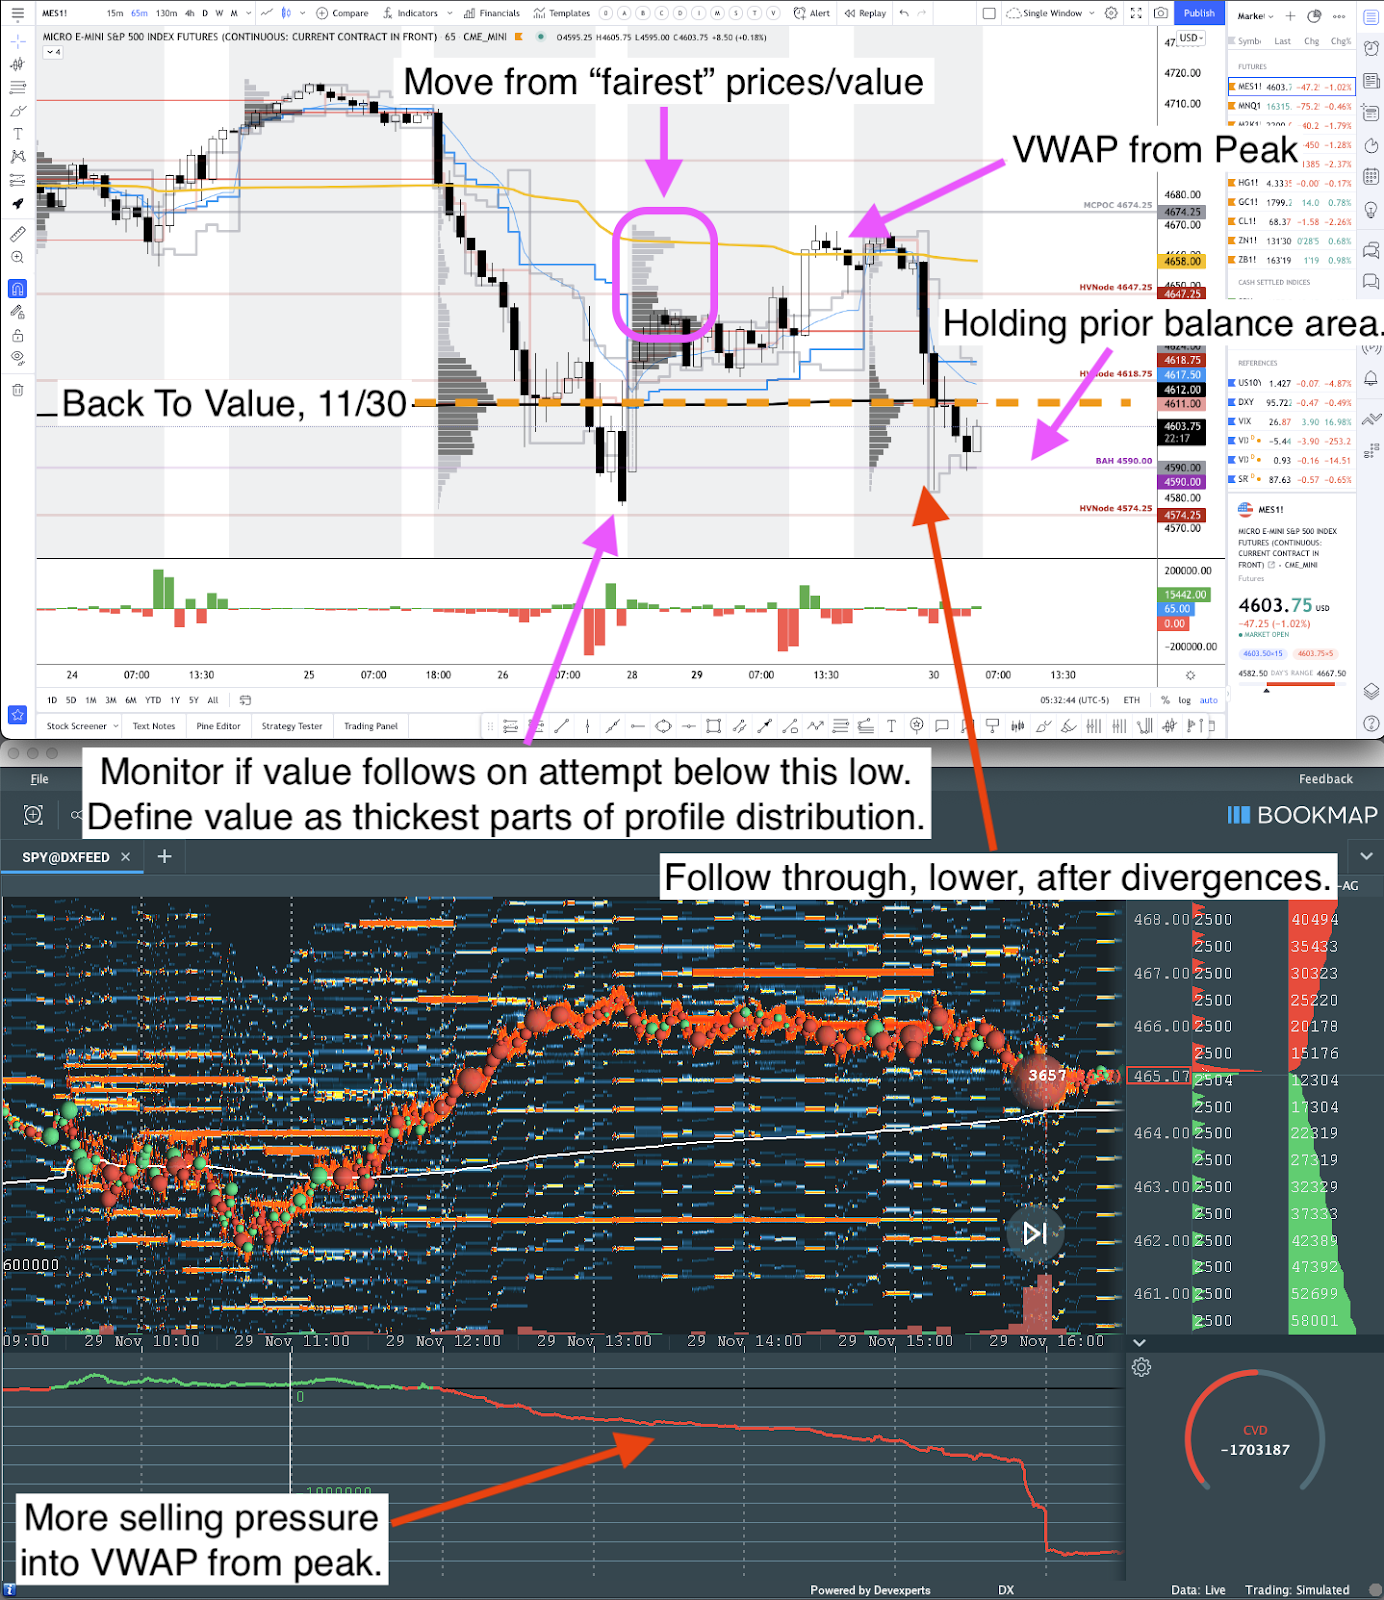
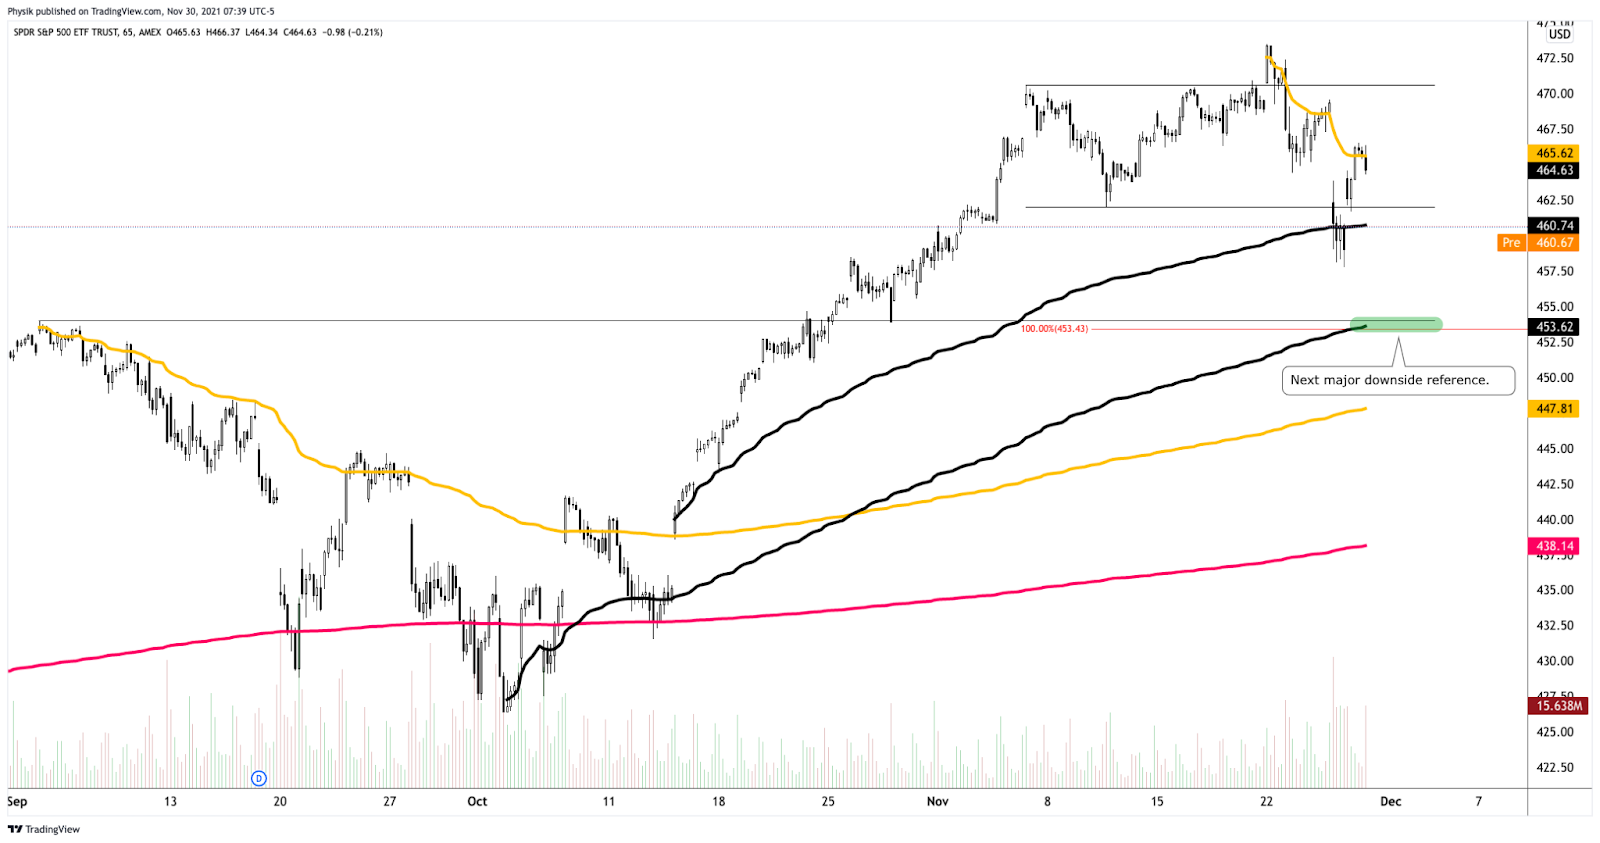
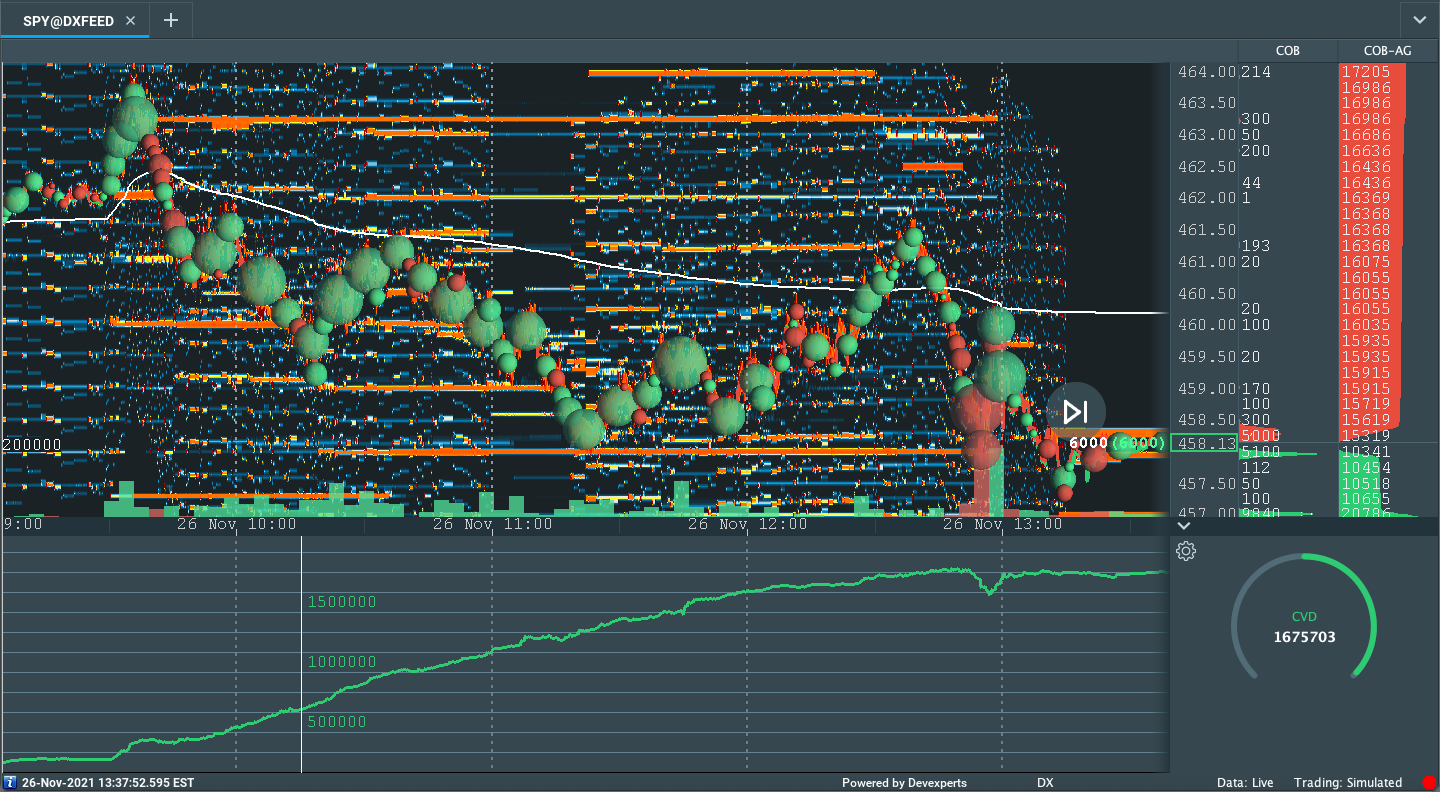
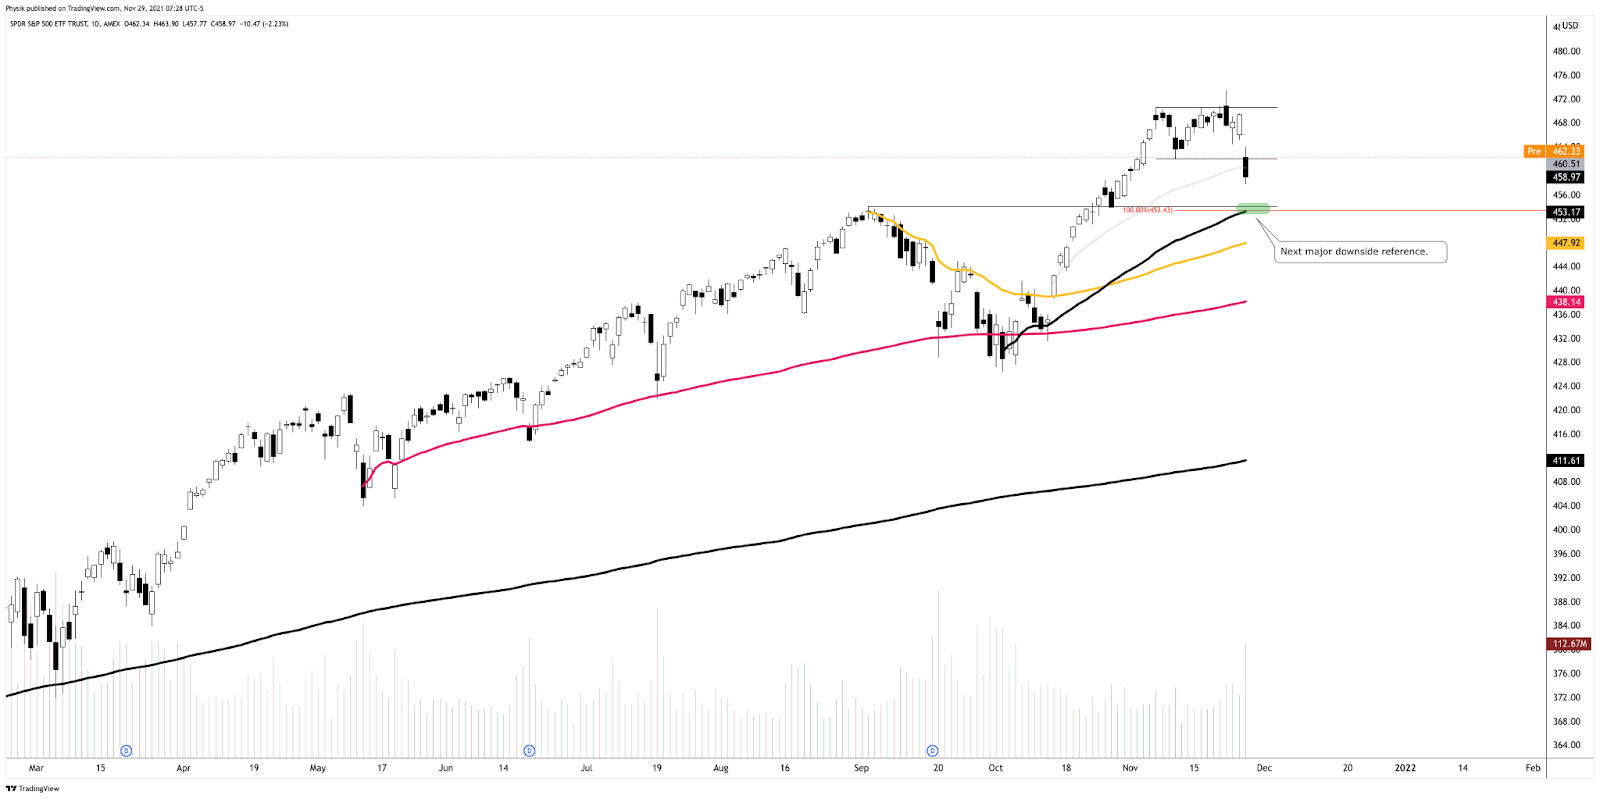
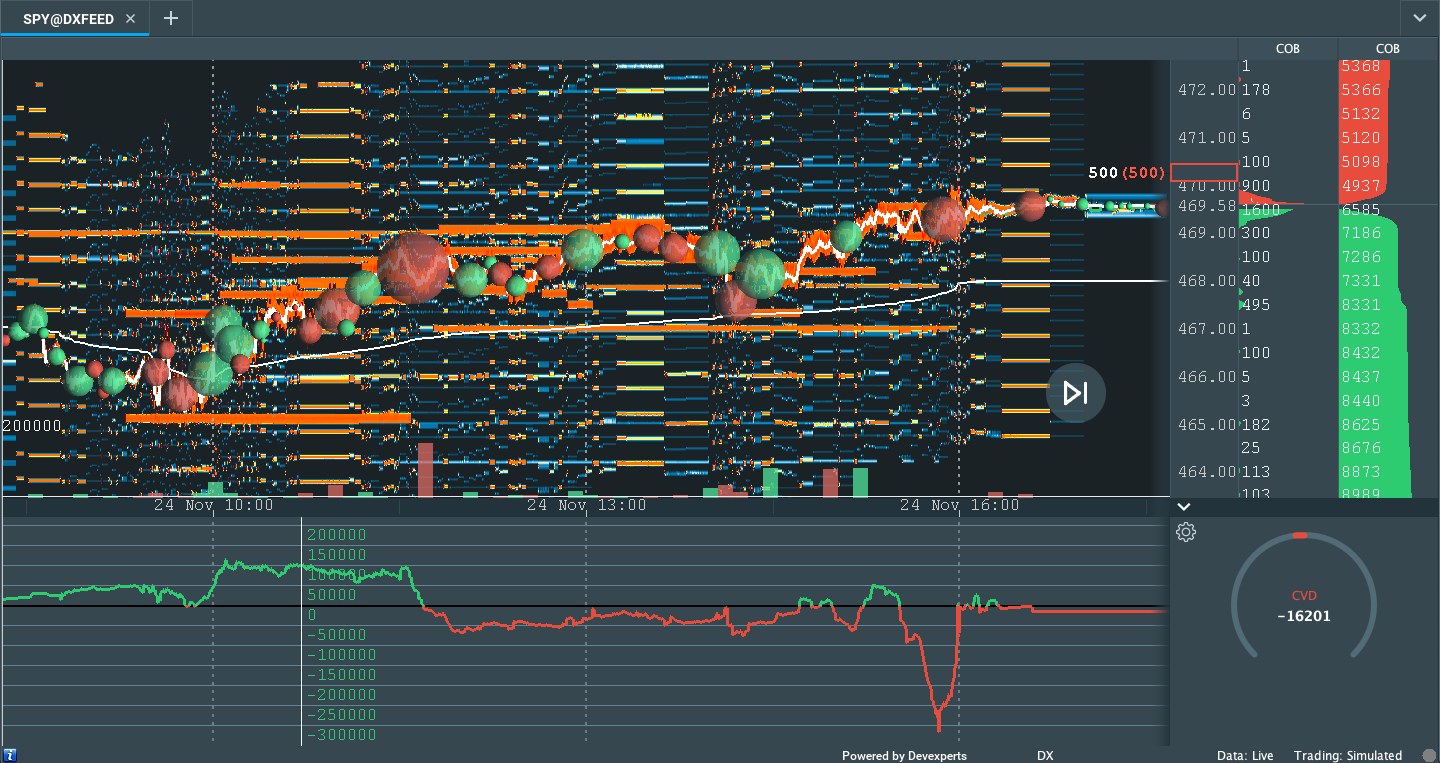
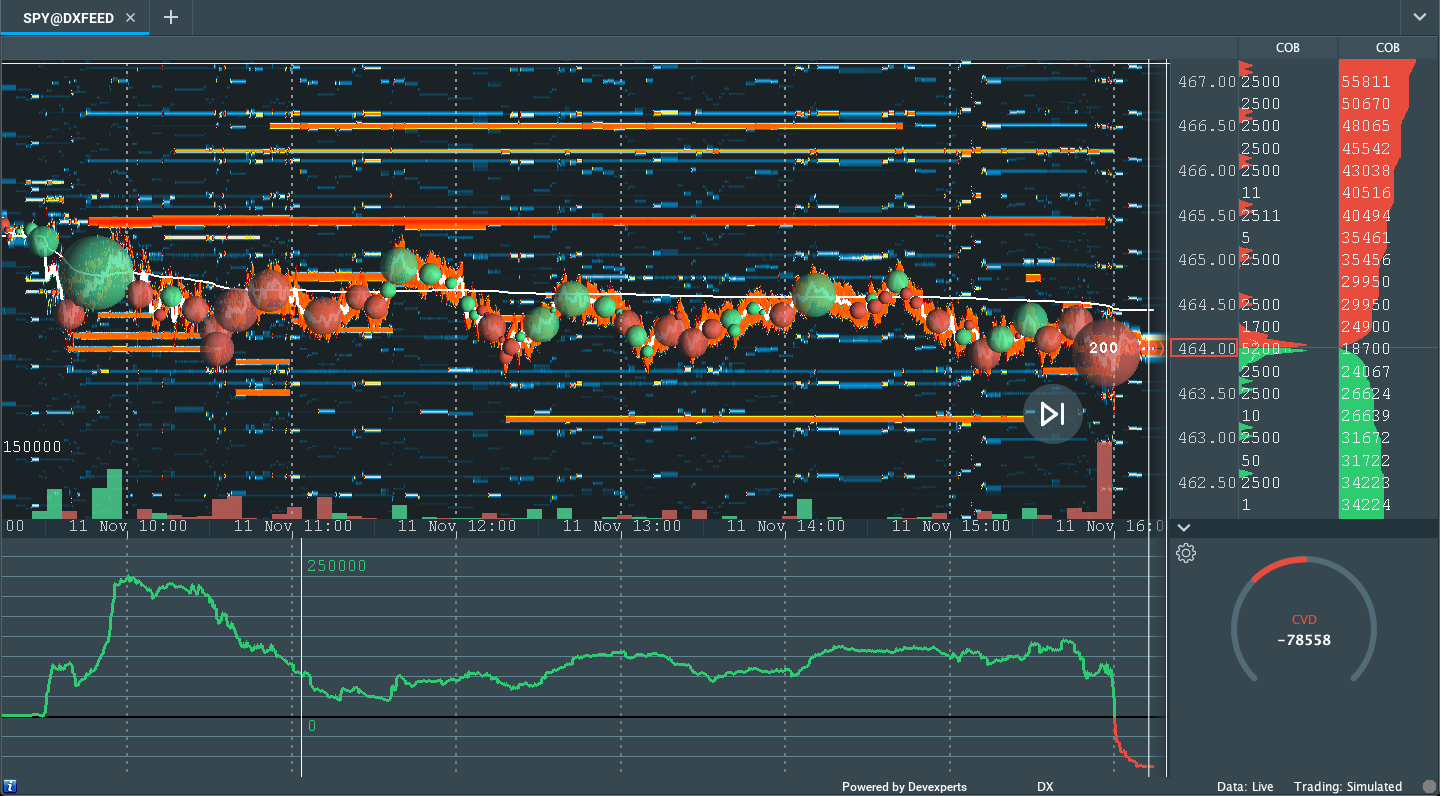
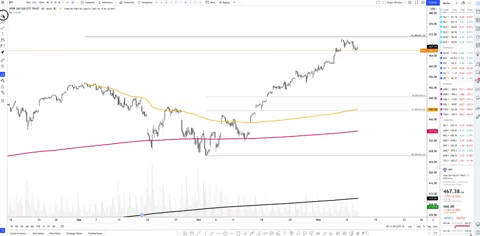
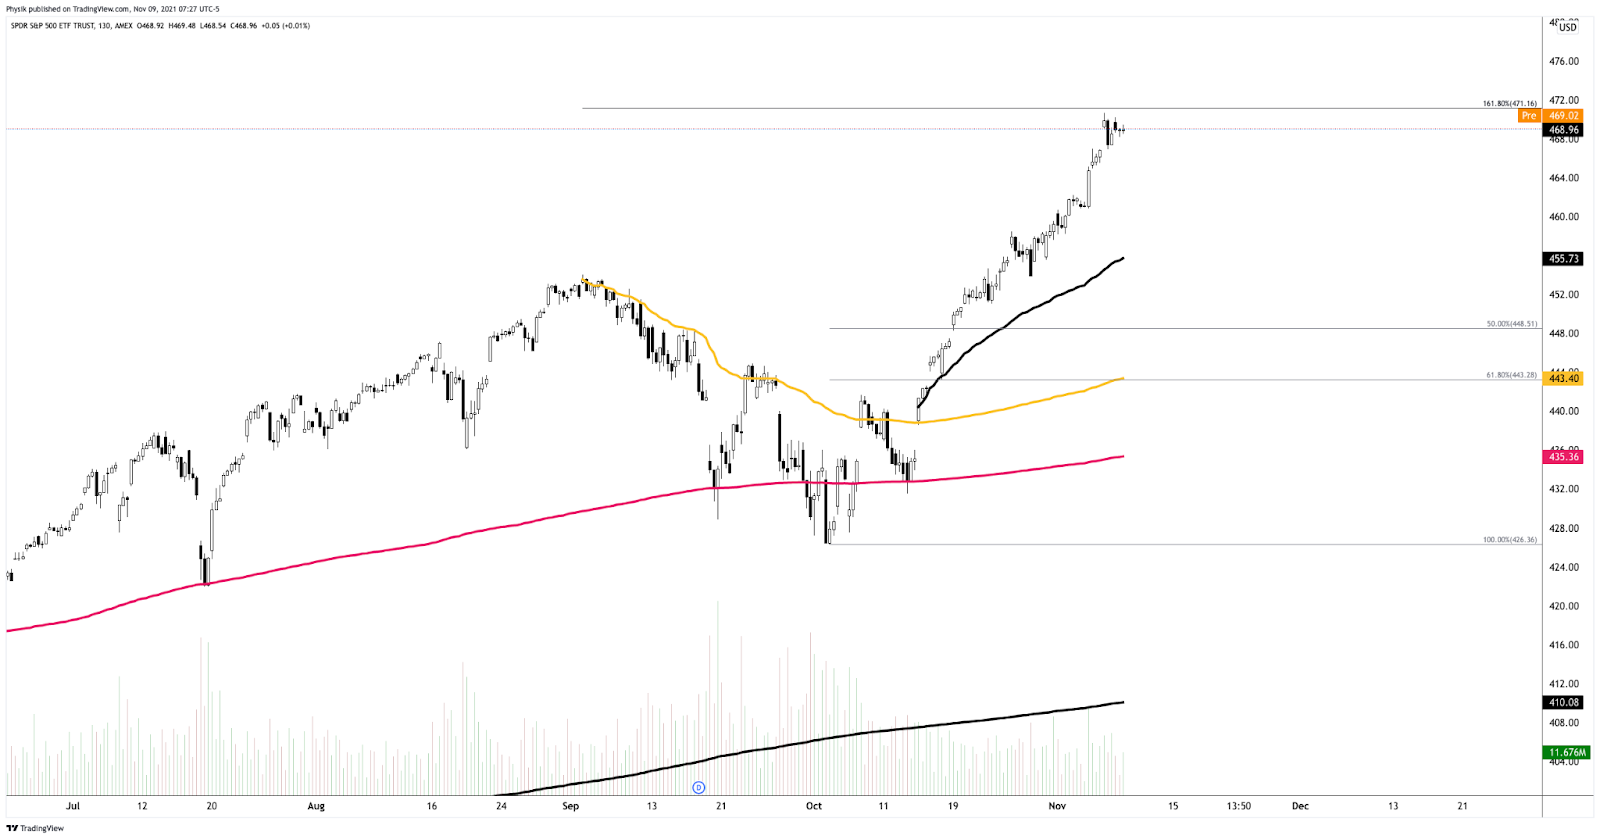
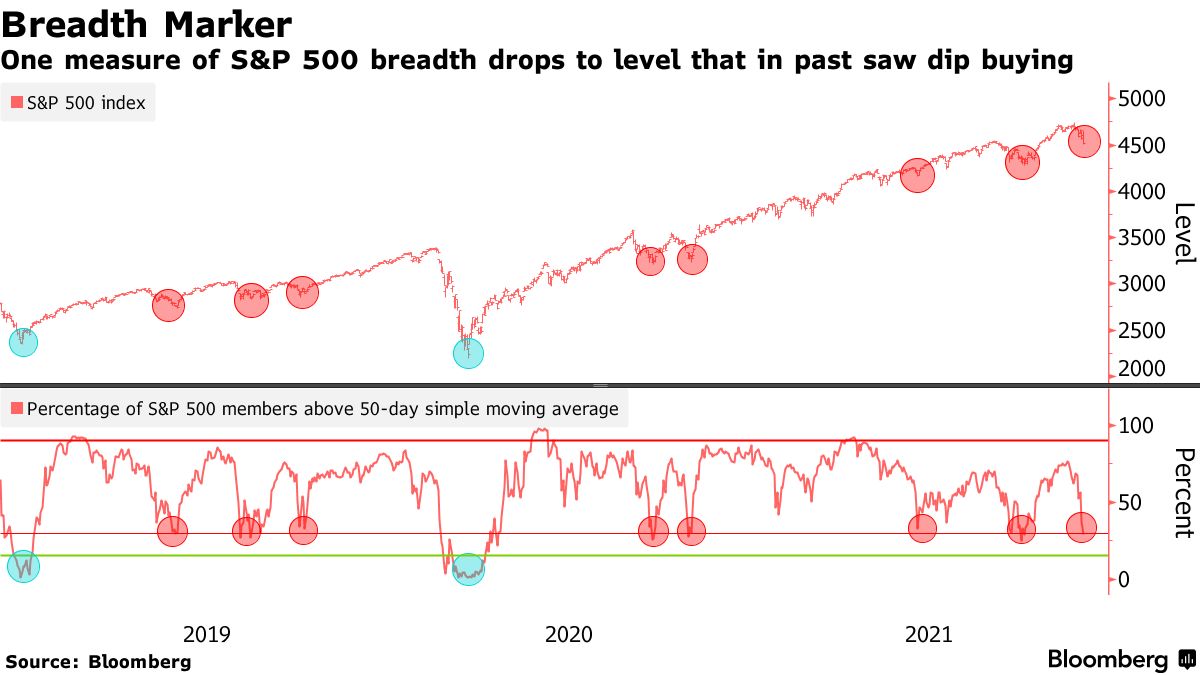
On nonparticipatory breadth and weak market liquidity metrics, the worst-case outcome occurred, evidenced by the S&P 500’s spike away from the value (i.e., the prices at which 70% of the day’s volume occurred).
The knee-jerk selling, which coincided with news that a COVID-19 variant was spotted in the U.S., broke the S&P 500 out of a short-term consolidation (i.e., balance) area.
The developing balance was a result of participants looking for new information to base a directional move. With new information, participants chose downside price exploration.
Adding, the knee-jerk selling and associated price action left behind poor structure (i.e., participants will look to validate [or invalidate] the move, spending time below [or above] the ~$4,574.25 spike base). Caution is warranted on overnight validation of the spike.
Context: A resurgence in COVID-19, a change in tone with respect to monetary policy, and last-minute tax-selling, in the face of seasonally-bullish buybacks and new month inflows.
The implications of these themes on price are contradictory.
As stated, yesterday, the Federal Reserve’s Jerome Powell unexpectedly changed his tone around inflation, becoming more open to a faster taper in bond-buying and rate hikes.
This is as policymakers look to tame price readings without inhibiting economic growth; fears of the aforementioned change in tone were clearly spotted by the bond market’s pricing of risk, so to speak, diverging from that of the equity market, weeks before current volatility.
Rising rates, among other factors, have the potential to decrease the present value of future earnings, thereby making stocks, especially those that are high growth, less attractive to own.
As the market is a forward-looking mechanism, the implications of this are staggering.
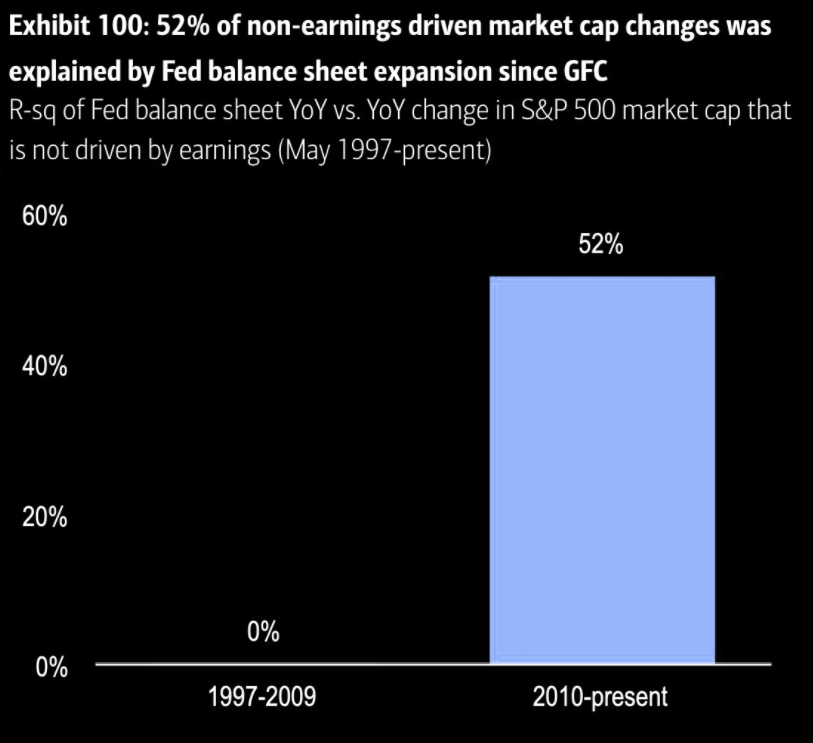
Prevailing monetary frameworks and max liquidity promoted a large divergence in price from fundamentals. The growth of passive investing – the effect of increased moneyness among nonmonetary assets – and derivatives trading imply a lot of left-tail risks.
As Kai Volatility’s Cem Karsan once told me: “There’s this constant structural positioning that naturally drives markets higher as long as volatility is compressed,” or there is supply.
“At the end of the day, though, the higher you go, the further off the ground you are and the more tail risk.”
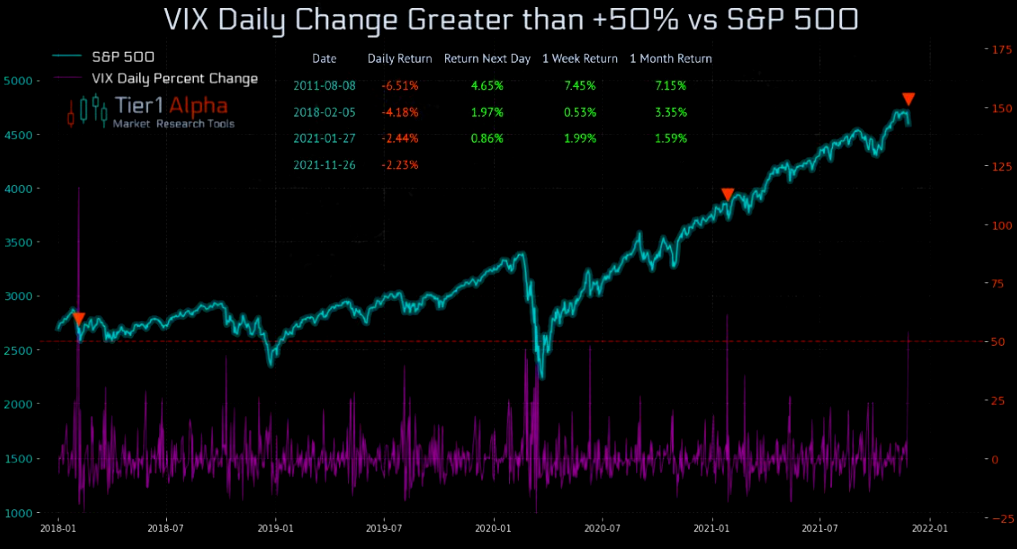
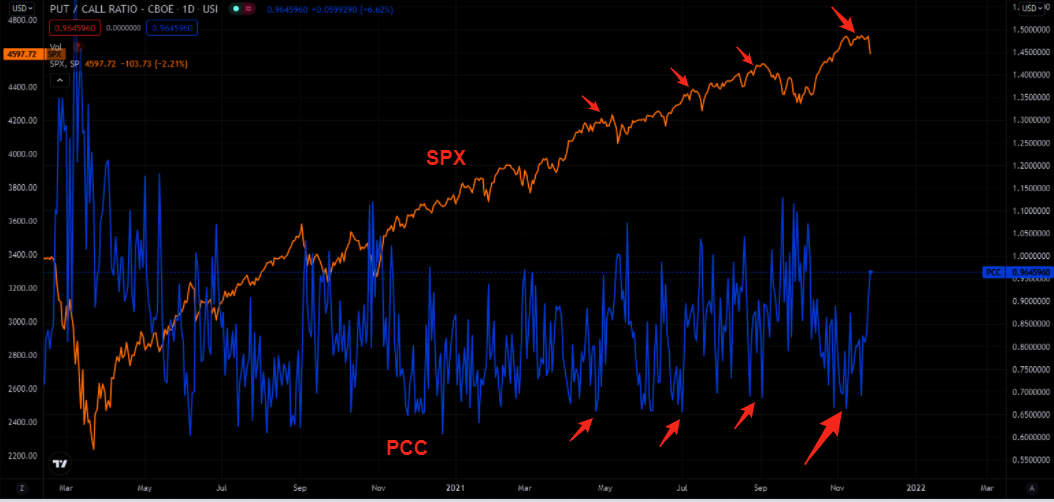
Eventually, the fear on the part of bond market participants fed into equity market positioning; breadth weakened for weeks into November’s large monthly options expiration, after which the absence of sticky and supportive hedging flows finally freed the market for directional resolve.
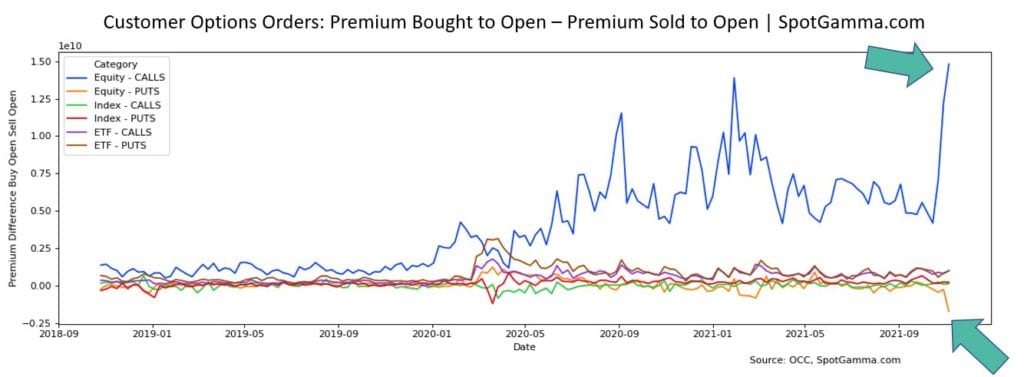
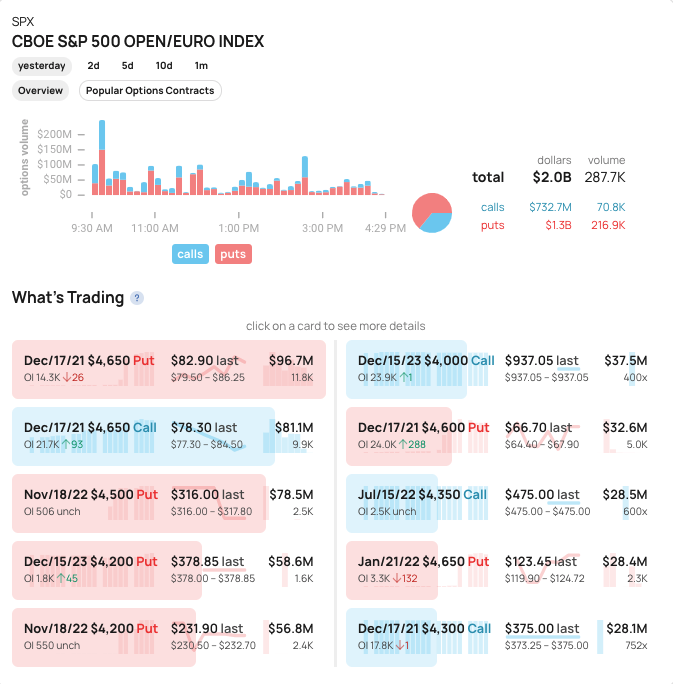
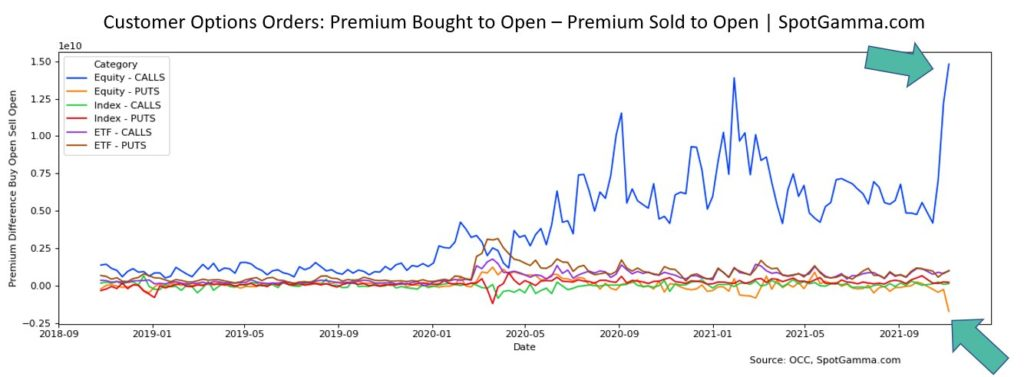
Couple that with participants being “underexposed to downside put protection,” according to SpotGamma, there was an expectation that there could be a rough re-pricing of tail risk as participants, en masse, sought after highly “convex” downside options which had the counterparties to those trades exacerbating underlying price movement.
Per the VIX term structure graphic below, there is tons of movement in the front-end, a sign that participants are concentrating activity in shorter-dated tenors where the sensitivity of options to direction is higher.
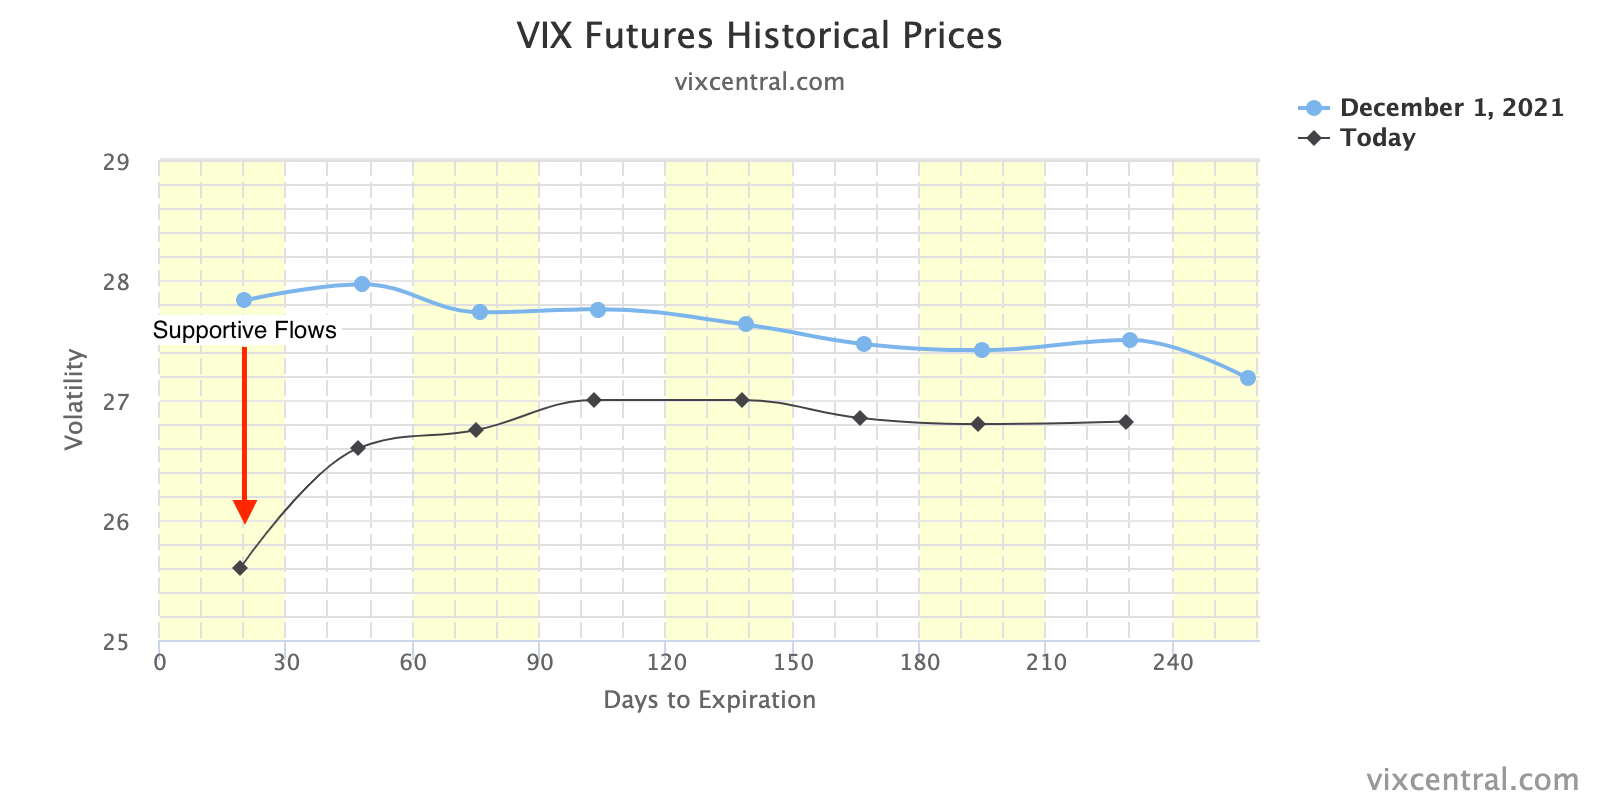
So long as this dynamic remains, participants can expect instability.
In assuaging fears, however, Moody’s Corporation (NYSE: MCO) put out research that found “information about the variant and the policy actions taken to date do not yet support a material shift” in forecasts.
This is as S&P Global Inc (NYSE: SPGI), despite lowering growth forecasts a touch, expects GDP to reach a 37-year high in 2021. With odds that it will likely take the next few weeks to find out more with respect to the severity of new COVID-19 variants, attention moves to “cyclicals, commodities, and reopening themes,” according to JPMorgan Chase & Co’s (NYSE: JPM) Marko Kolanovic.
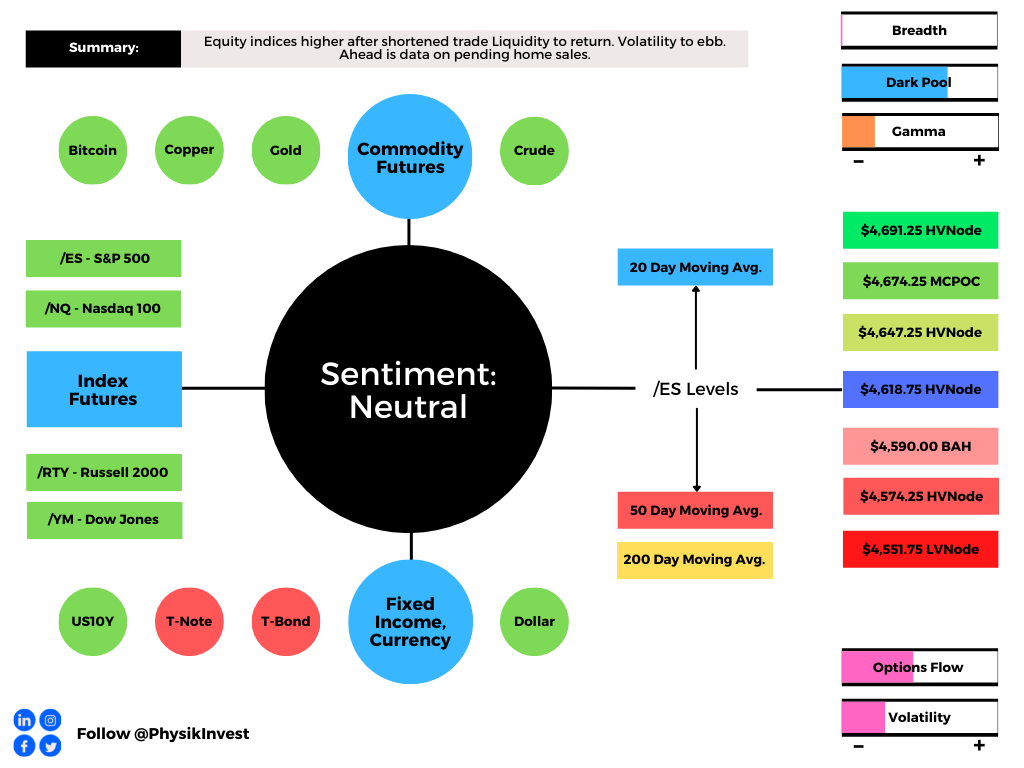
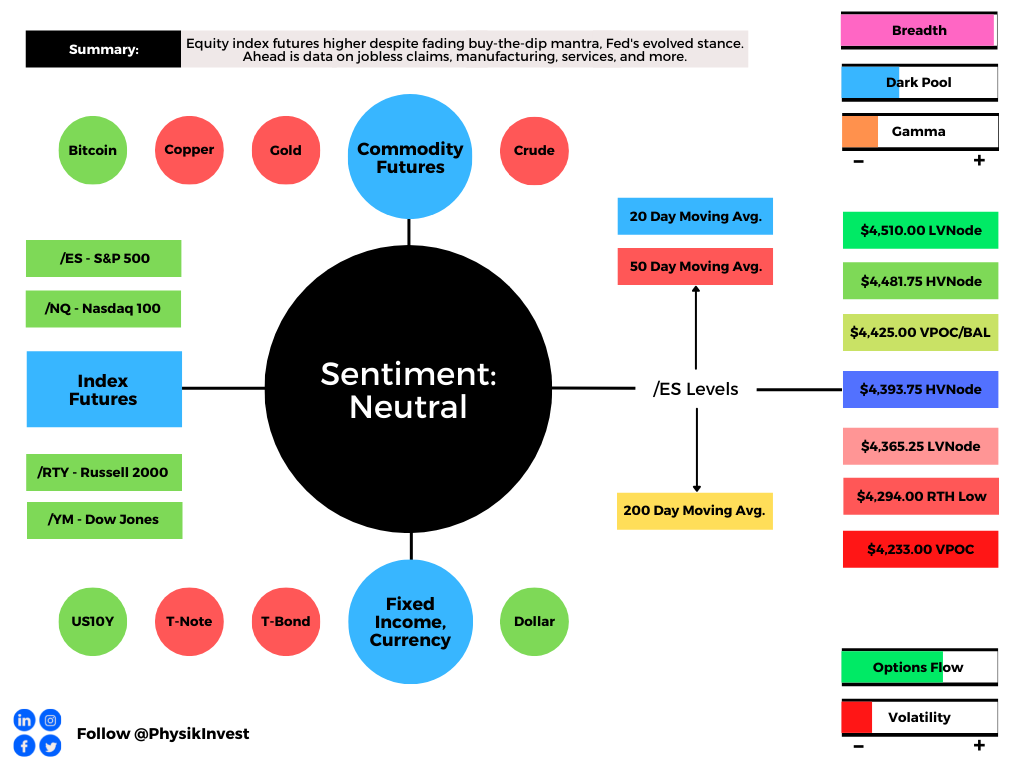
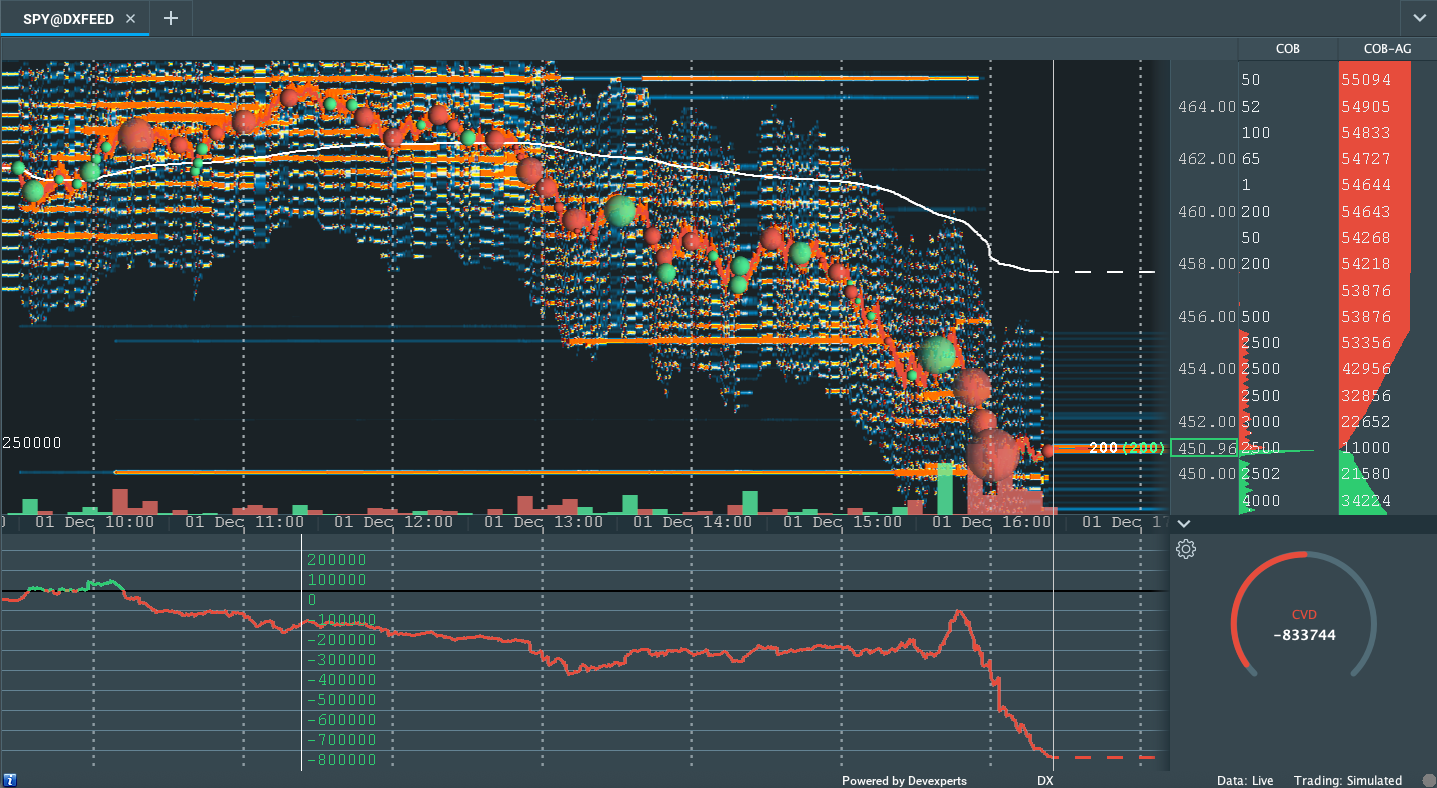
Expectations: As of 6:40 AM ET, Thursday’s regular session (9:30 AM – 4:00 PM ET), in the S&P 500, will likely open in the lower part of a positively skewed overnight inventory, inside of prior-range and -value, suggesting a limited potential for immediate directional opportunity.
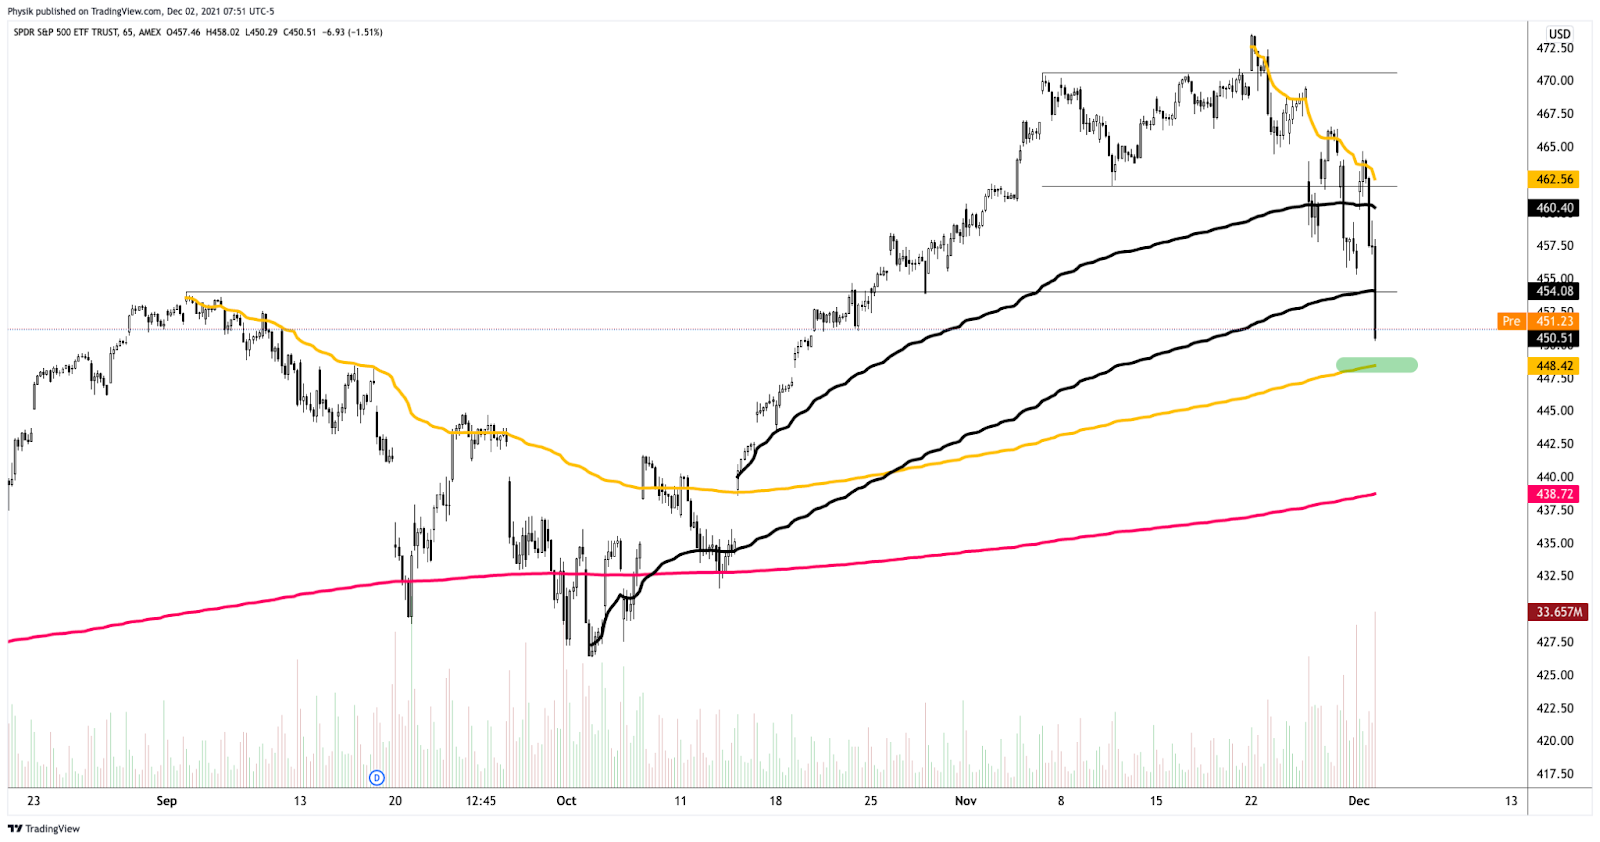
Spike Rules In Play: Spike’s mark the beginning of a break from value. Spikes higher (lower) are validated by trade at or above (below) the spike base (i.e., the origin of the spike).
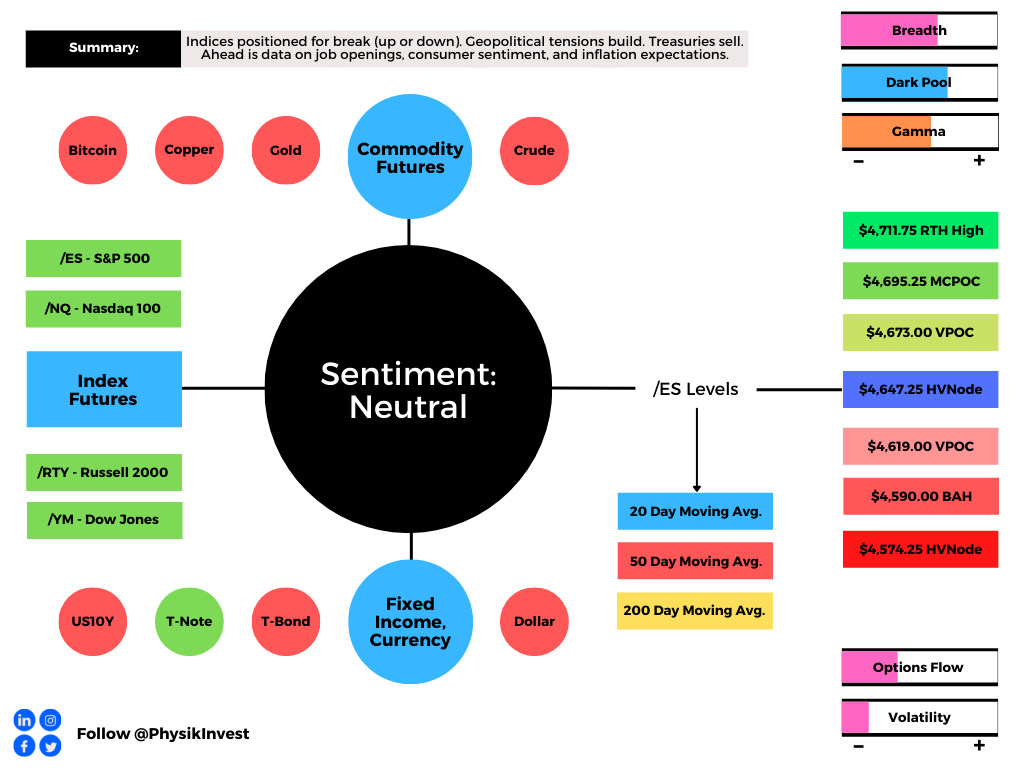
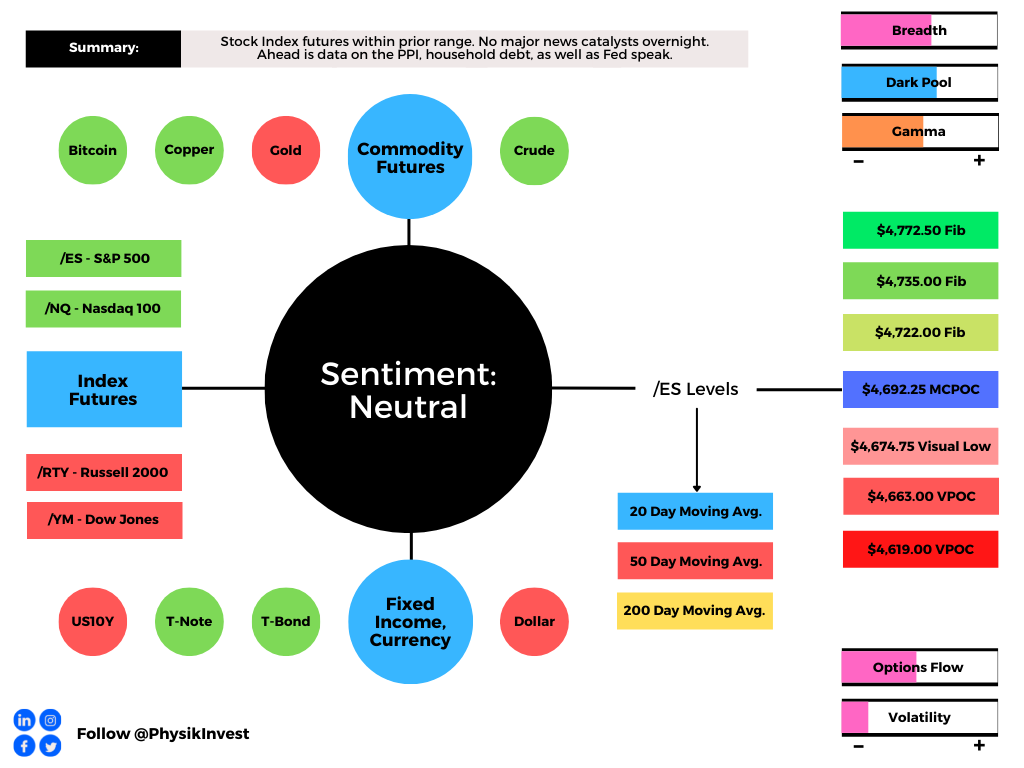
In the best case, the S&P 500 trades sideways or higher; activity above the $4,551.75 low volume area (LVNode) puts in play the $4,574.25 high volume area (HVNode). Initiative trade beyond the HVNode could reach as high as the $4,629.00 untested point of control (VPOC) and $4,674.25 micro composite point of control (MCPOC), or higher.
In the worst case, the S&P 500 trades lower; activity below the $4,551.75 low volume area (LNVode) puts in play the $4,497.75 regular-trade low (RTH Low). Initiative trade beyond the RTH Low could reach as low as the $4,471.00 and $4,425.00 VPOC, or lower.
Click here to load today’s updated key levels into the web-based TradingView charting platform. Note that all levels are derived using the 65-minute timeframe. New links are produced, daily.

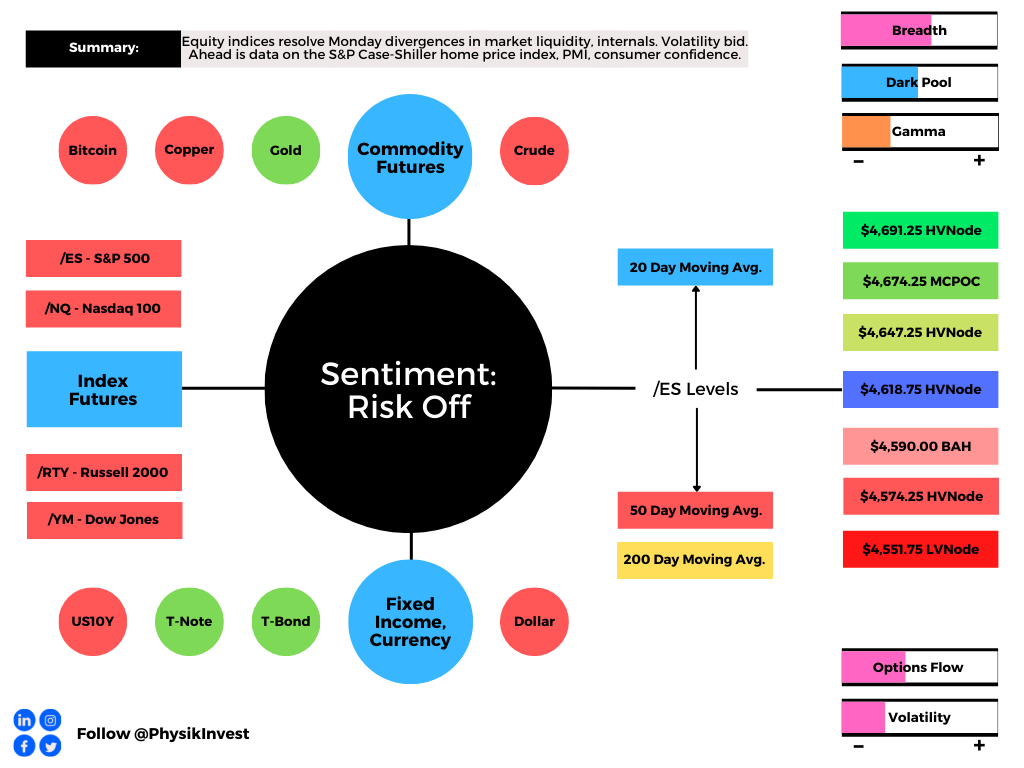
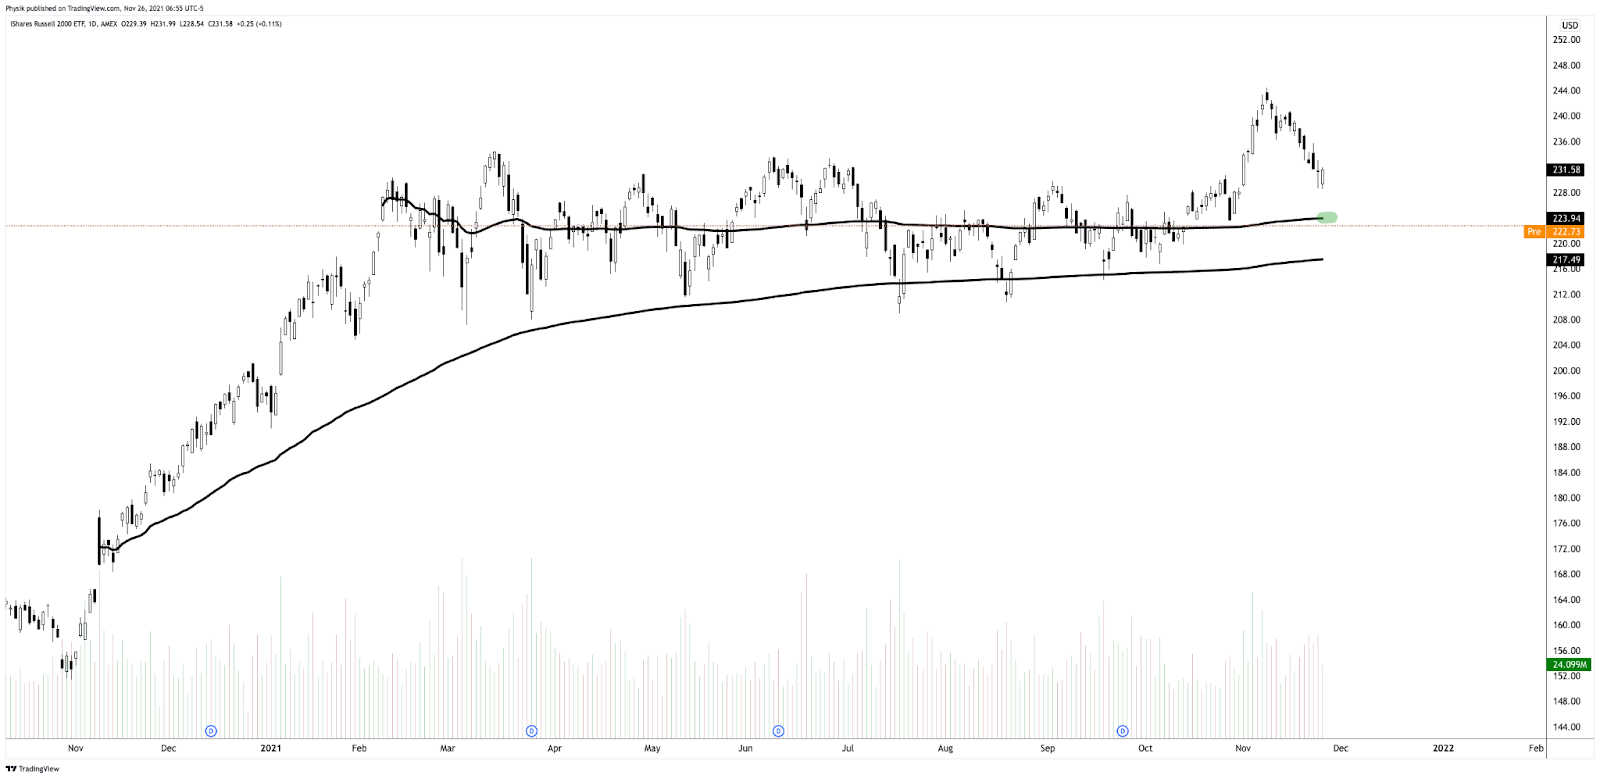
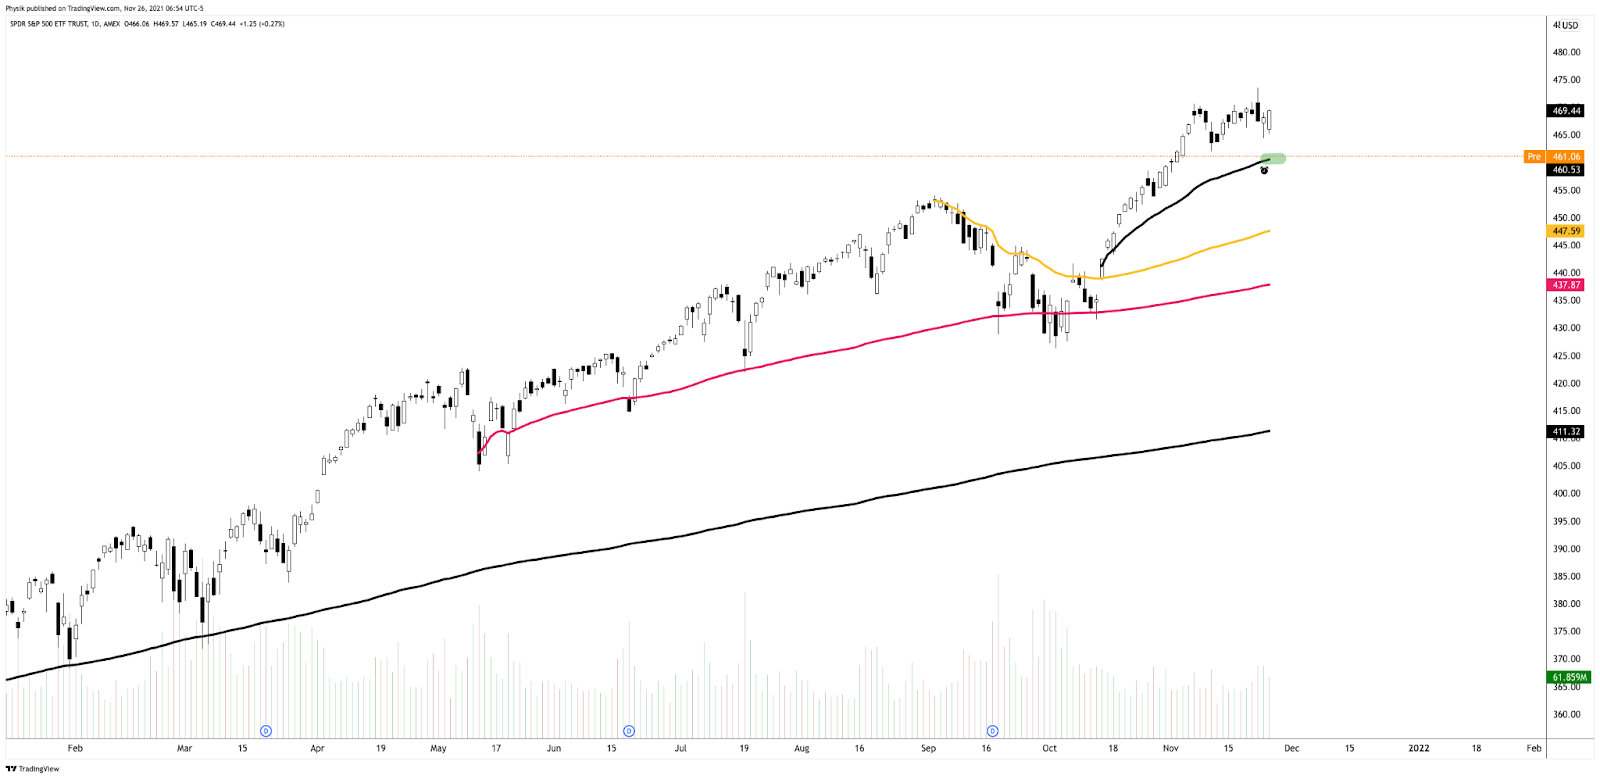
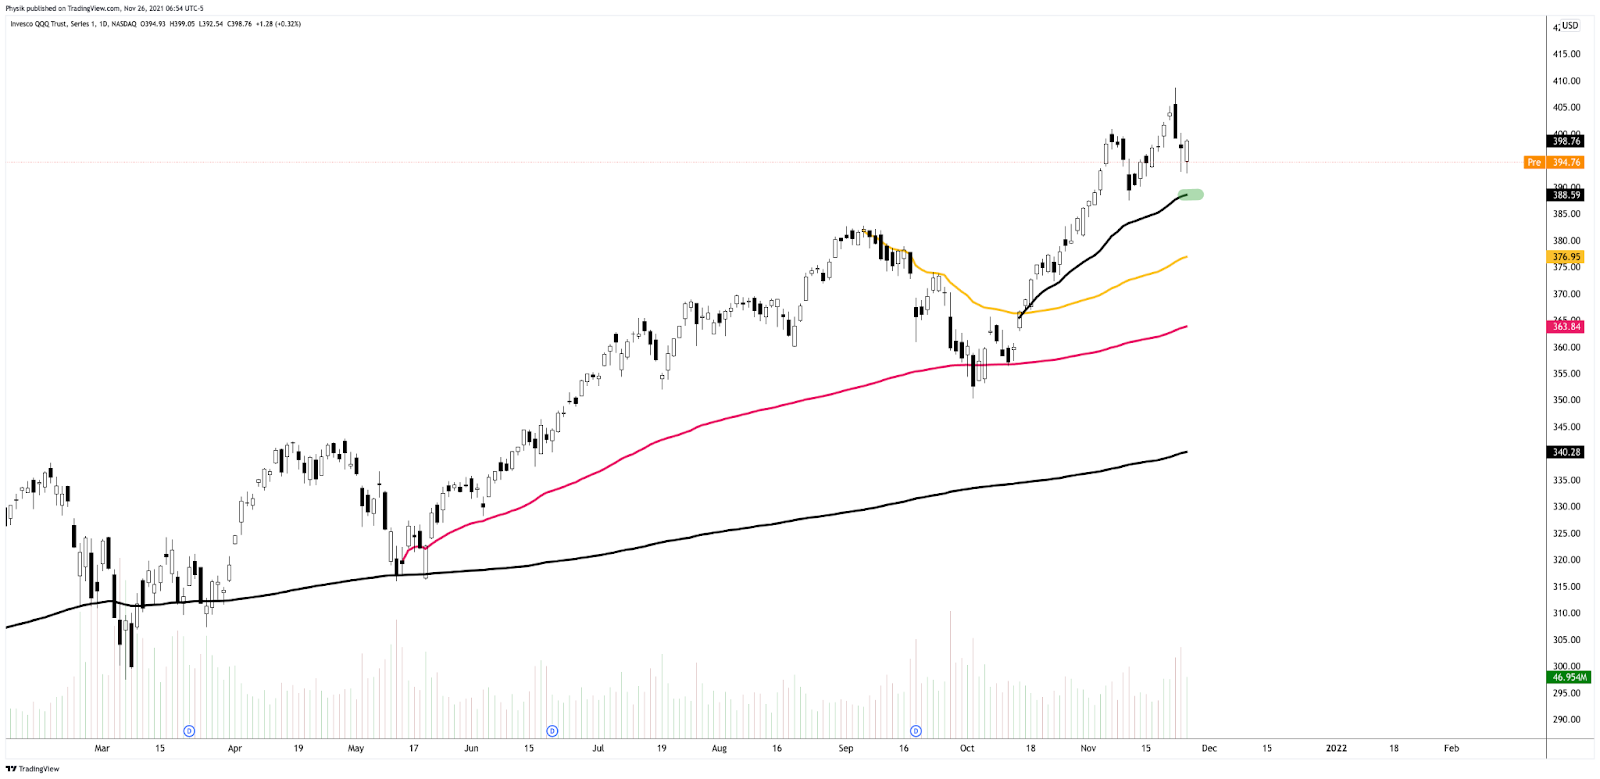
Charts To Watch
Definitions
Volume Areas: A structurally sound market will build on areas of high volume (HVNodes). Should the market trend for long periods of time, it will lack sound structure, identified as low volume areas (LVNodes). LVNodes denote directional conviction and ought to offer support on any test.
If participants were to auction and find acceptance into areas of prior low volume (LVNodes), then future discovery ought to be volatile and quick as participants look to HVNodes for favorable entry or exit.
POCs: POCs are valuable as they denote areas where two-sided trade was most prevalent in a prior day session. Participants will respond to future tests of value as they offer favorable entry and exit.
MCPOCs: POCs are valuable as they denote areas where two-sided trade was most prevalent over numerous day sessions. Participants will respond to future tests of value as they offer favorable entry and exit.
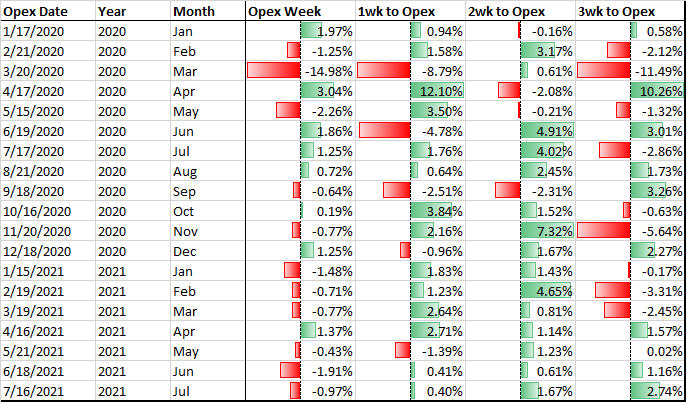
Options Expiration (OPEX): Traditionally, option expiries mark an end to pinning (i.e, the theory that market makers and institutions short options move stocks to the point where the greatest dollar value of contracts will expire) and the reduction dealer gamma exposure.
Price Discovery (One-Timeframe Or Trend): Elongation and range expansion denotes a market seeking new prices to establish value, or acceptance (i.e., more than 30-minutes of trade at a particular price level).
Balance (Two-Timeframe Or Bracket): Rotational trade that denotes current prices offer favorable entry and exit. Balance-areas make it easy to spot a change in the market (i.e., the transition from two-time frame trade, or balance, to one-time frame trade, or trend).
Modus operandi is responsive trade (i.e., fade the edges), rather than initiative trade (i.e., play the break).
Value-Area Placement: Perception of value unchanged if value overlapping (i.e., inside day). Perception of value has changed if value not overlapping (i.e., outside day). Delay trade in the former case.
About
After years of self-education, strategy development, and trial-and-error, Renato Leonard Capelj began trading full-time and founded Physik Invest to detail his methods, research, and performance in the markets.
Additionally, Capelj is a Benzinga finance and technology reporter interviewing the likes of Shark Tank’s Kevin O’Leary, JC2 Ventures’ John Chambers, and ARK Invest’s Catherine Wood, as well as a SpotGamma contributor, developing insights around impactful options market dynamics.
Disclaimer
At this time, Physik Invest does not manage outside capital and is not licensed. In no way should the materials herein be construed as advice. Derivatives carry a substantial risk of loss. All content is for informational purposes only.