What Happened
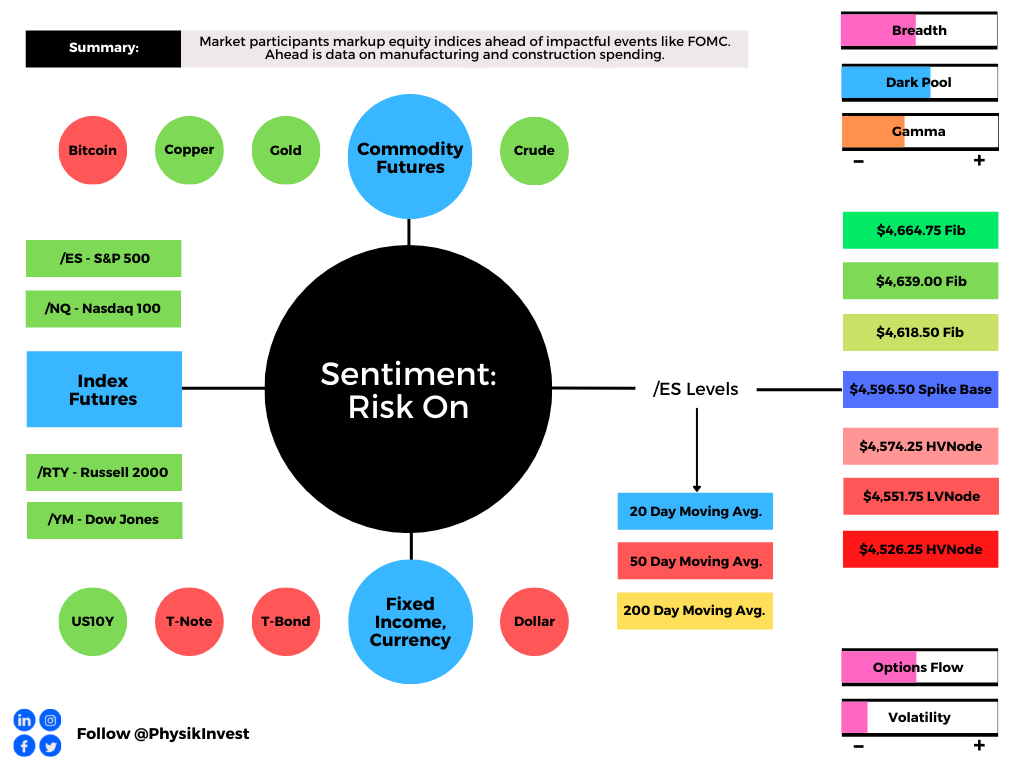
Overnight, equity index futures were divergent.
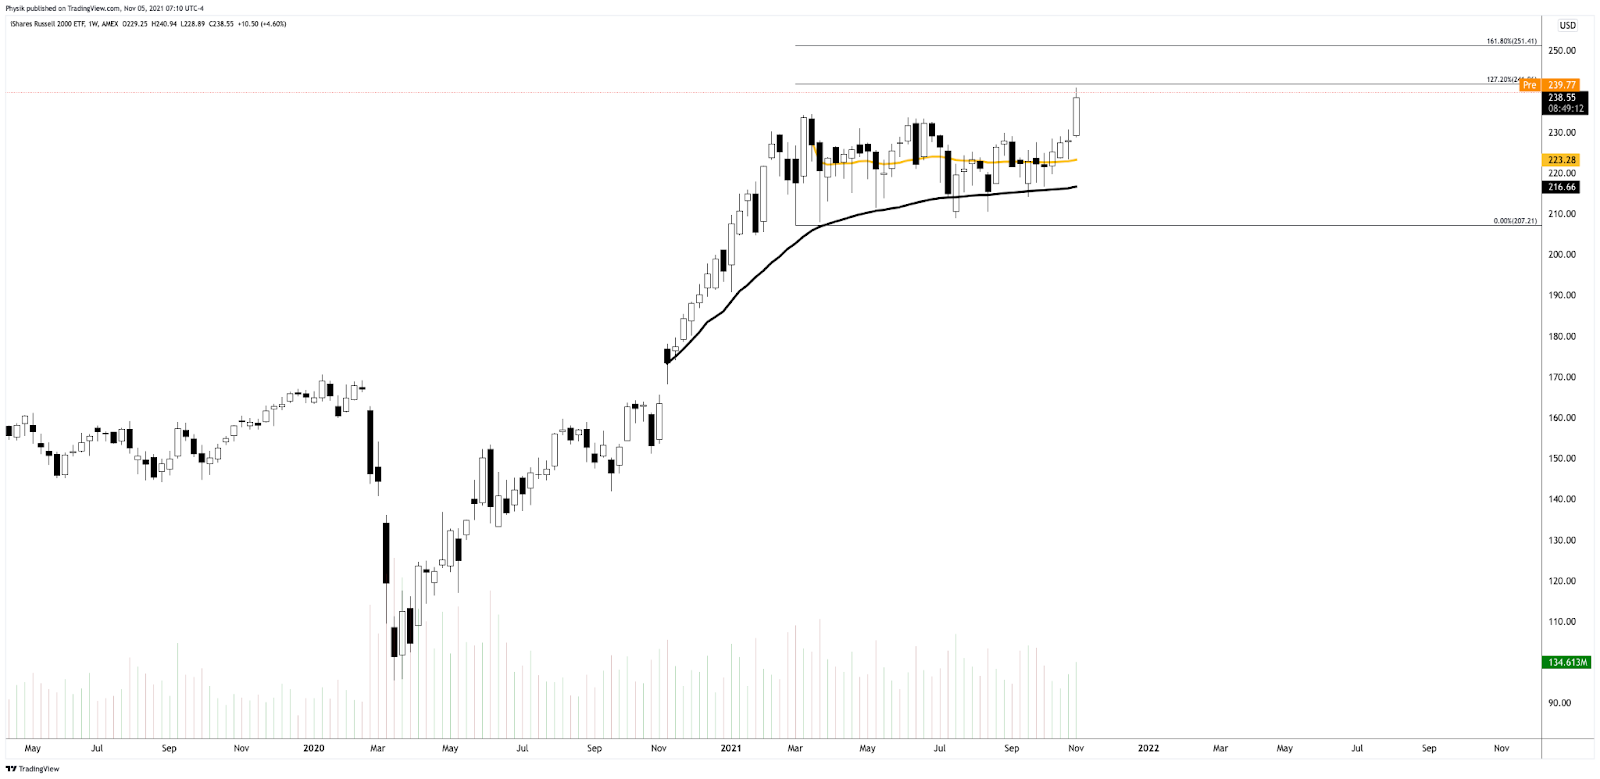
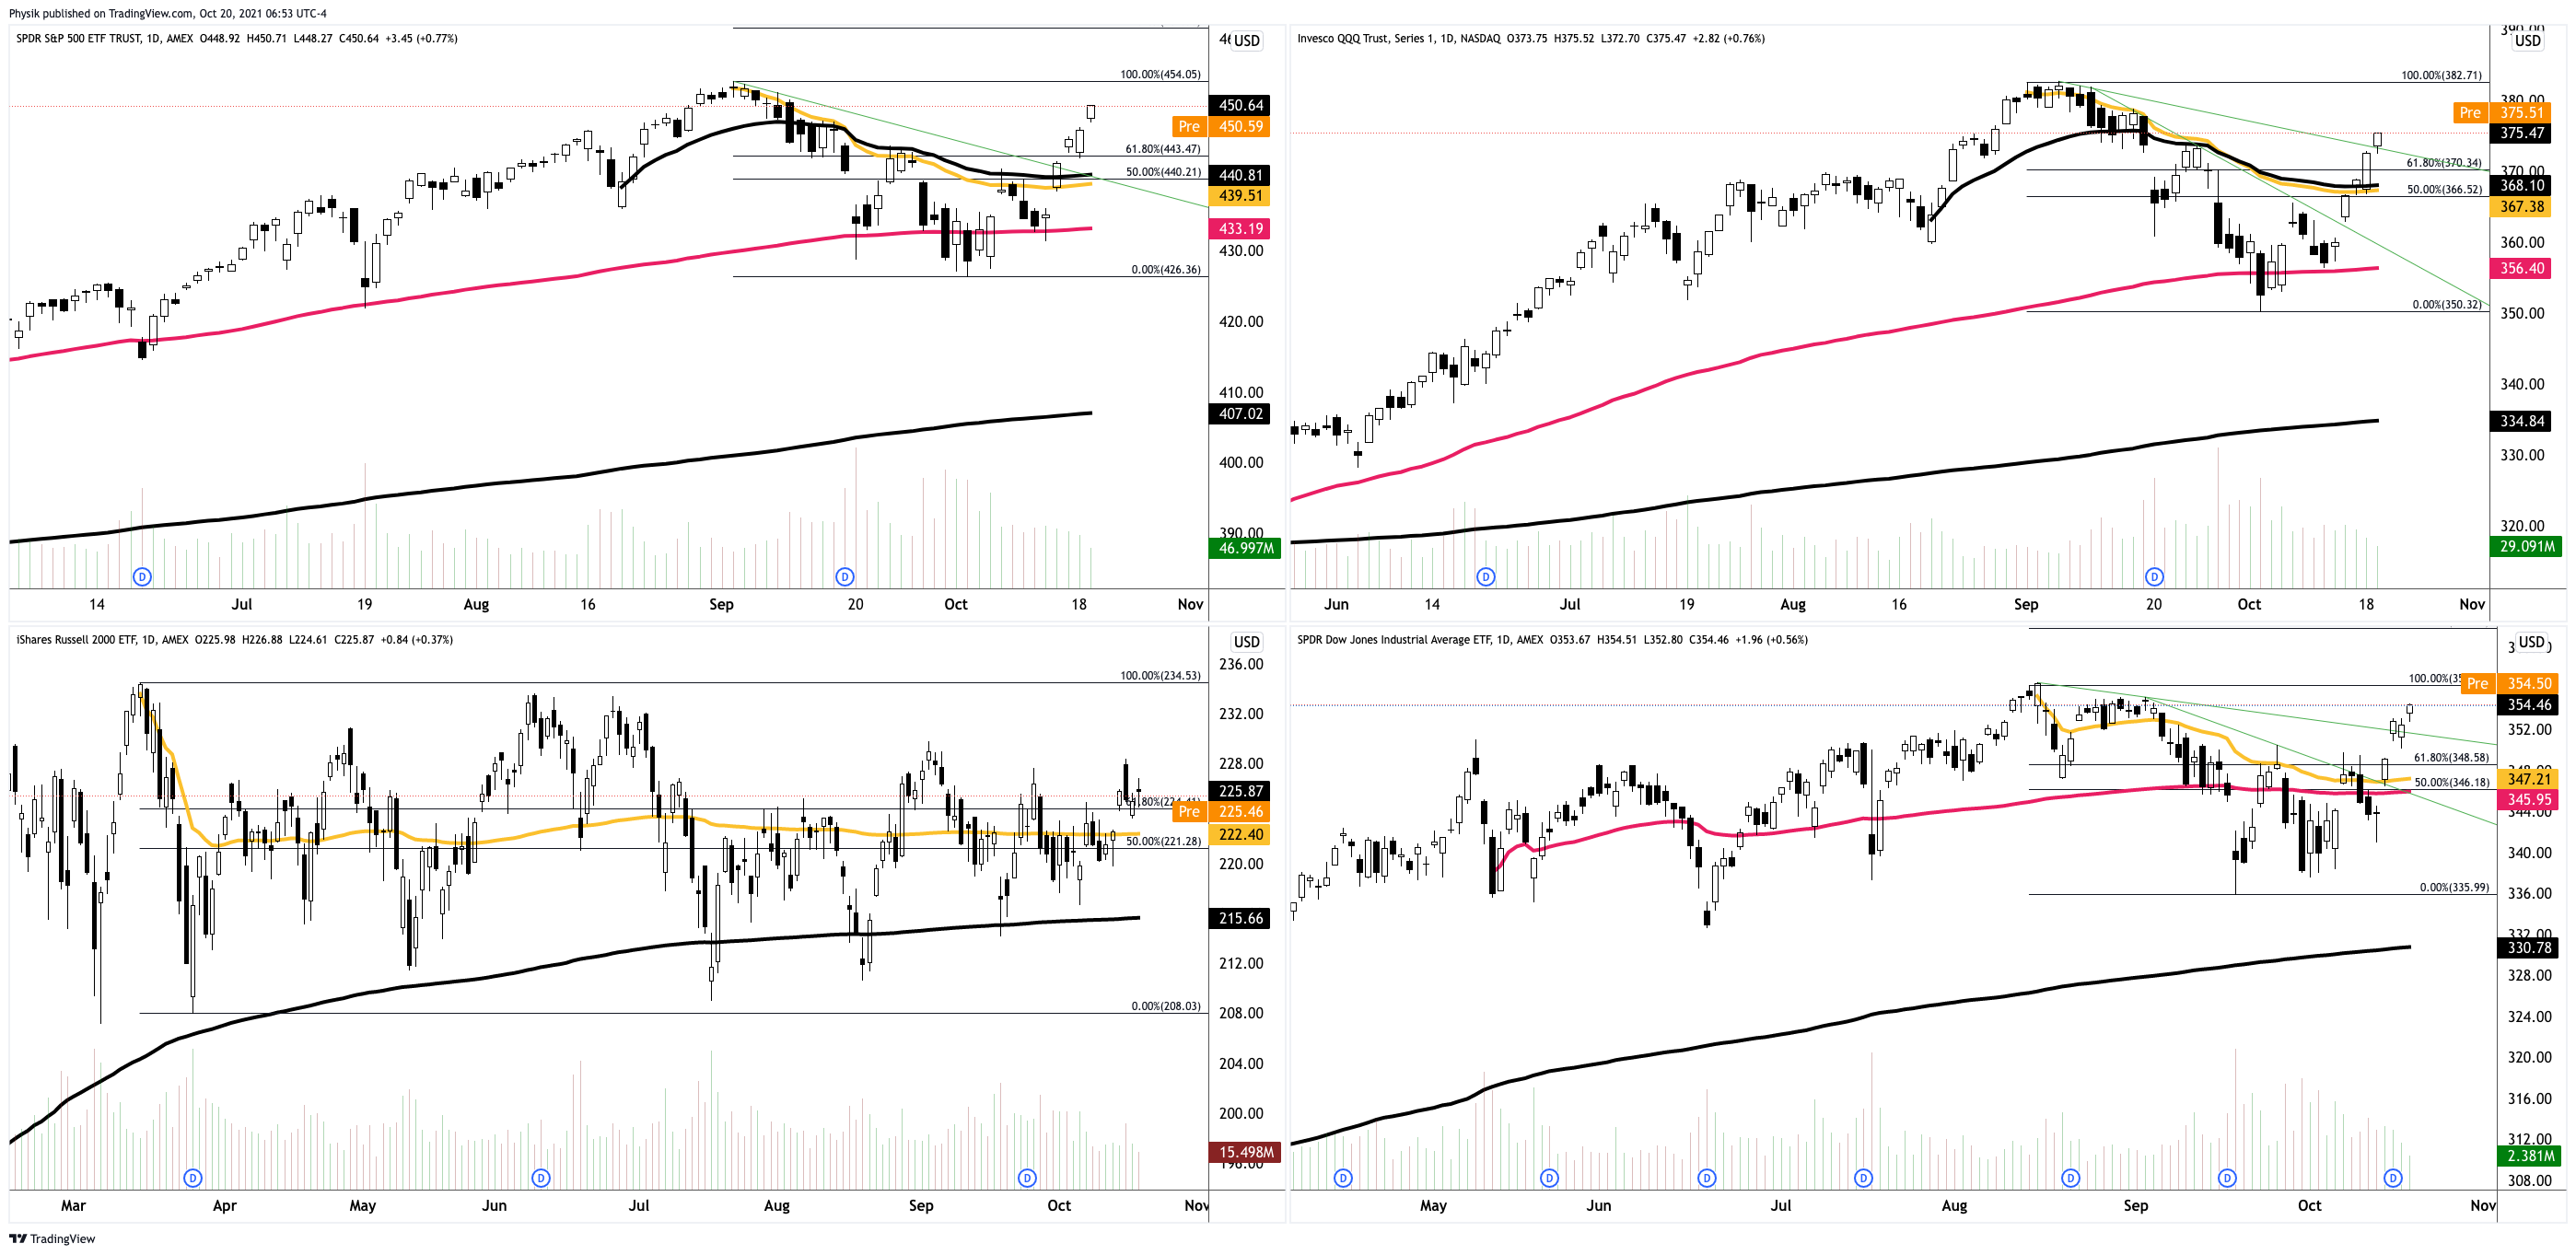
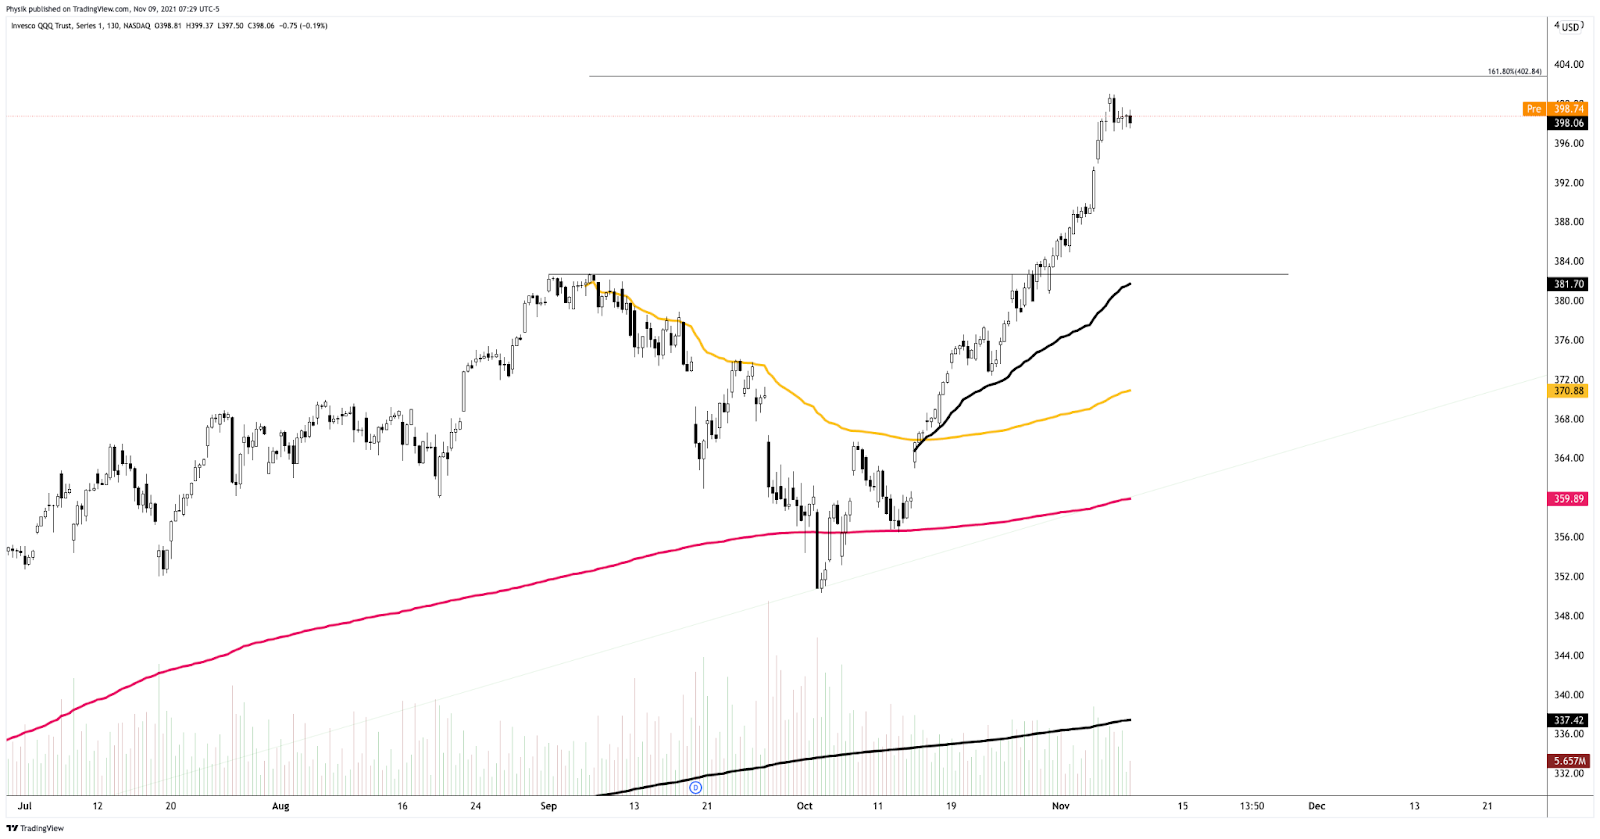
The Nasdaq-100 led while the Russell 2000, which broke out of massive range, recently, slowed its pace of price discovery, trading relatively weak.
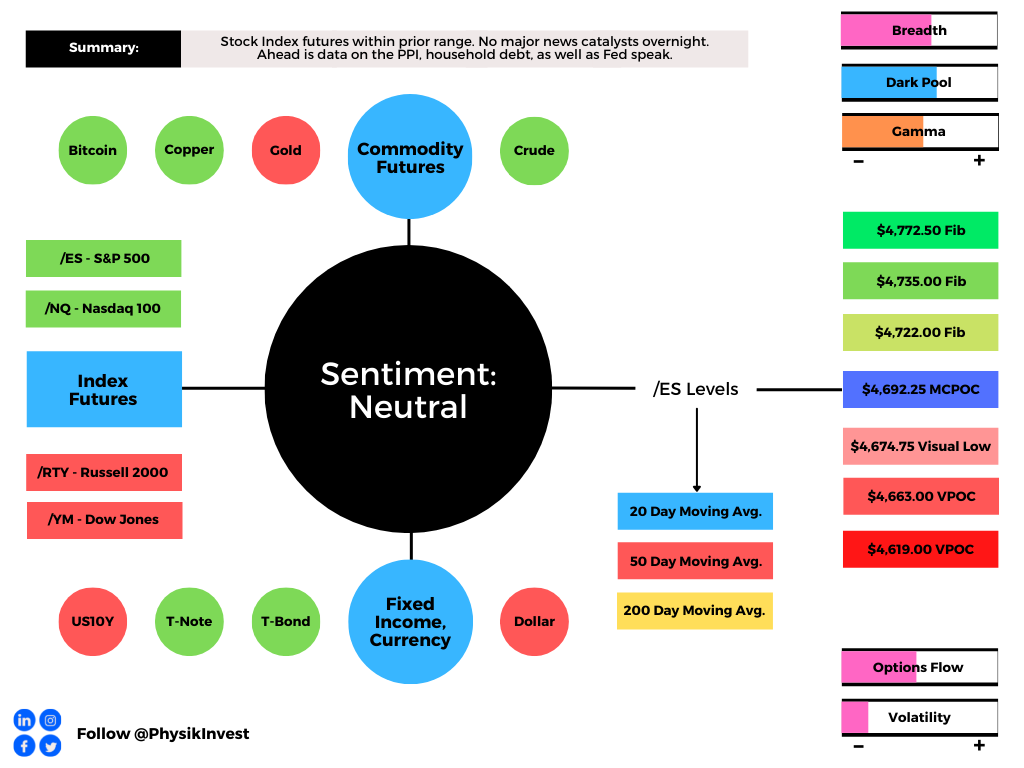
Ahead is data on the PPI (8:30 AM ET) and real household debt (11:00 AM ET).
What To Expect
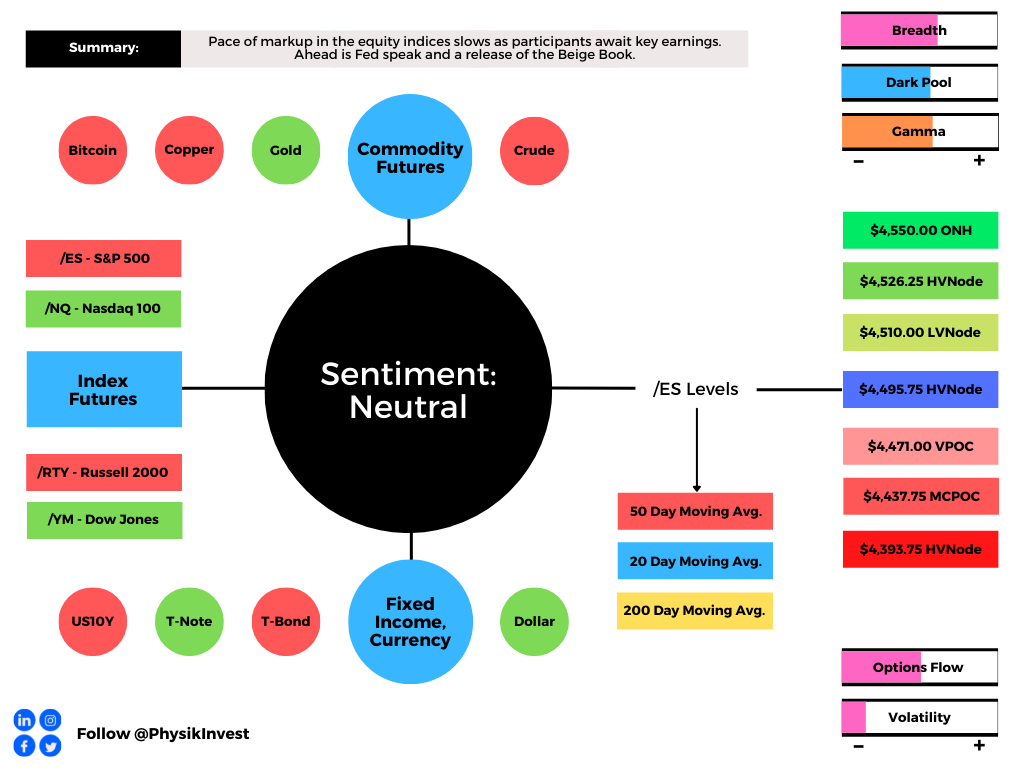
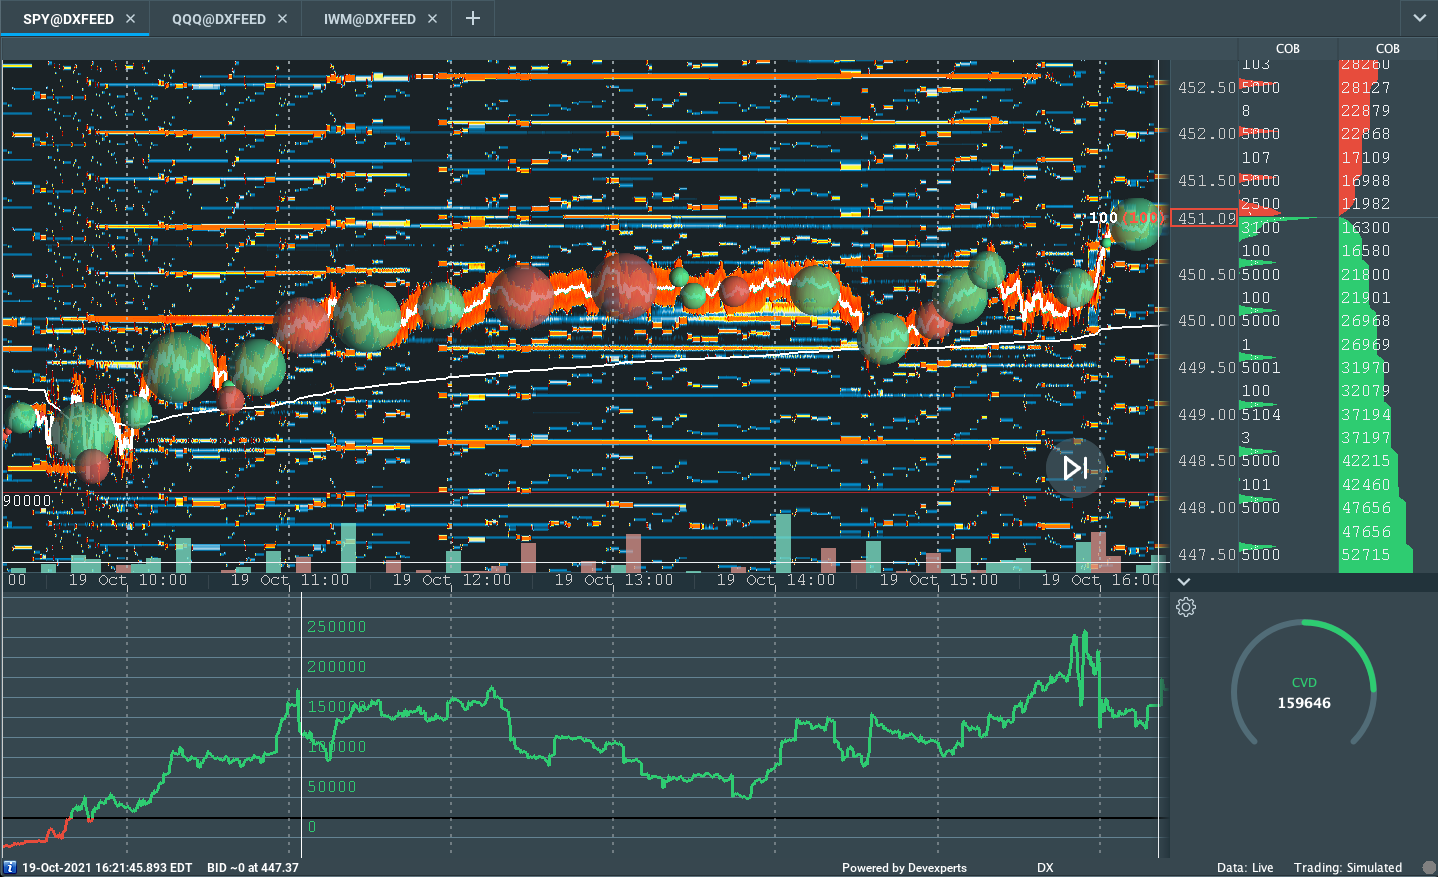
On lackluster intraday breadth and supportive market liquidity metrics, the best case outcome occurred, evidenced by the balance and overlap of value areas (i.e., where 70% of the prior day’s trade occurred, or +/- 1 standard deviation), at the current S&P 500 prices.
This activity, which marks a potential willingness to continue balance as participants seek new information to resolve on, is built on poor structure, a dynamic that adds to technical instability.
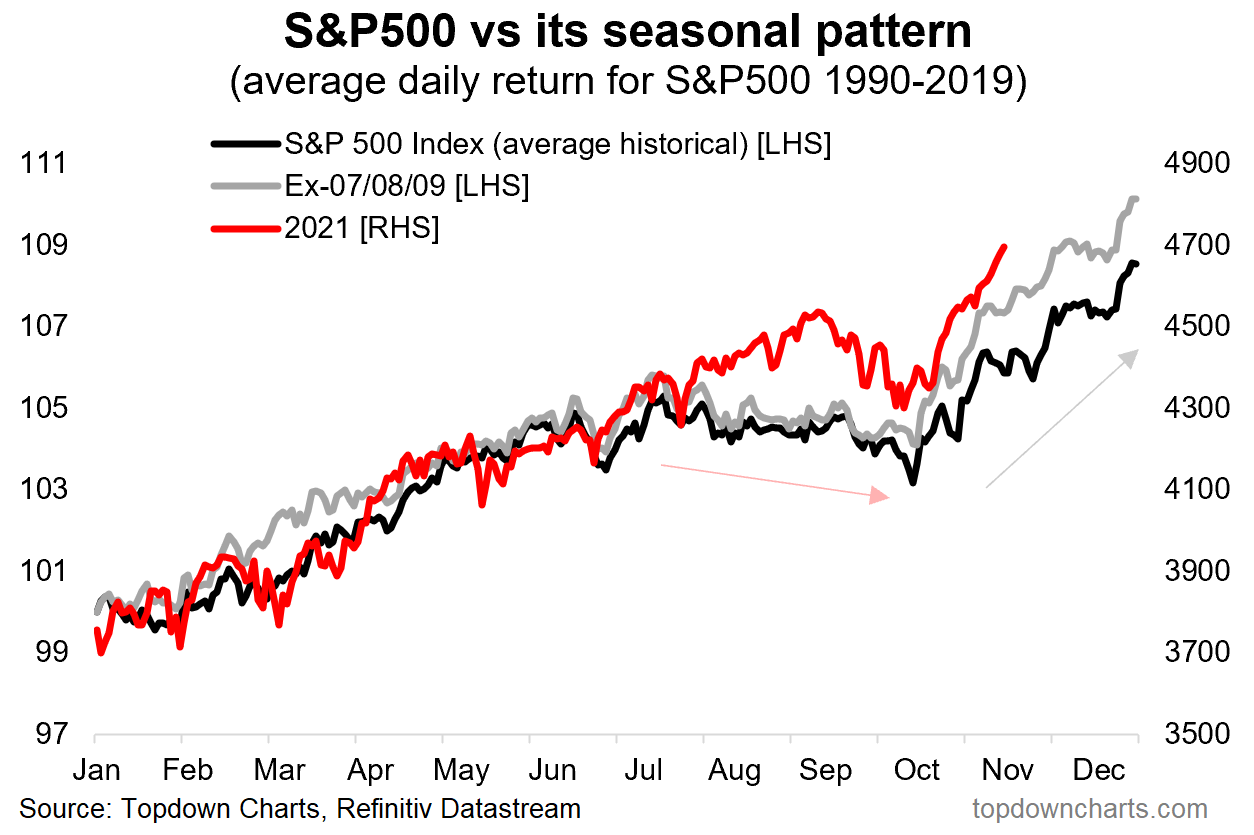
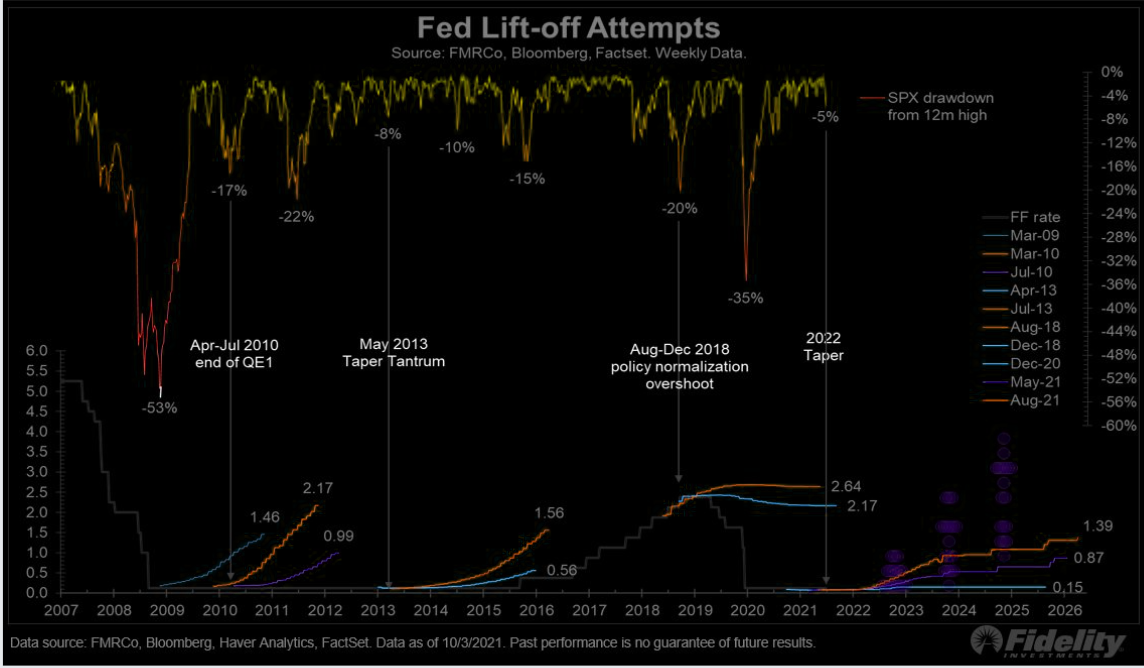
Context: The aforementioned trade is happening in the context of a lot of big-picture dynamics such as the growth of derivatives exposure and tail risk, the heightened moneyness of nonmonetary assets, trends in seasonality, buybacks, earnings surprises, and more.
The implications of these themes on price are contradictory.
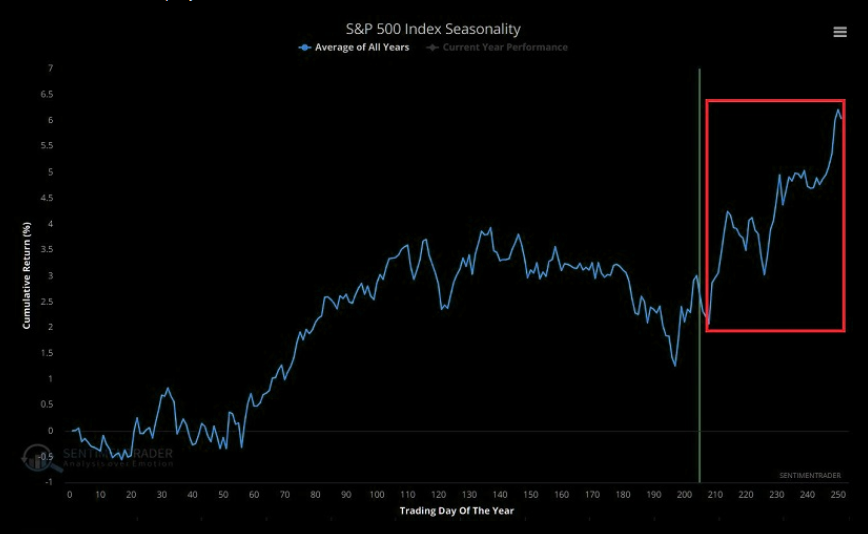
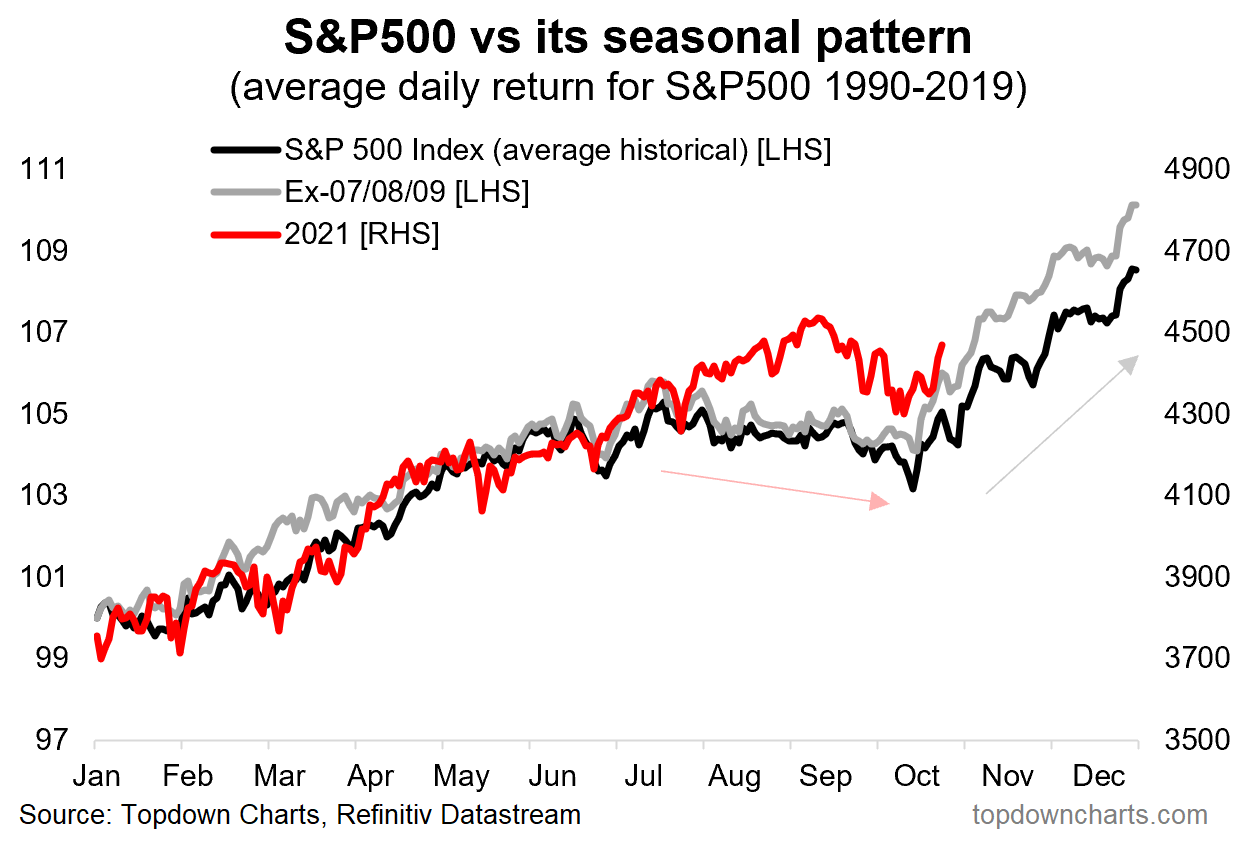
To elaborate, on one hand, seasonality, buybacks, and earnings surprises have bolstered (and will continue to bolster) the most recent price rise, since early October.
Similarly, participants are seeing a trend of outperformance in the extended day, due in part to the front-running of increasingly impactful vanna and charm flows (both of which are tied to the hedging of options exposure), as a result of increased options activity (which, at least at this juncture, exposes customers to high leverage and risk).
I say “high leverage and risk” as a result of short-term speculators’ record call buying and put selling over the past weeks.
As stated in a SpotGamma note, yesterday, “Should there be an adverse move, those short-term speculators are likely to cover (sell) their short put (long call) positions as they lack the wherewithal (capital) to maintain exposure.”
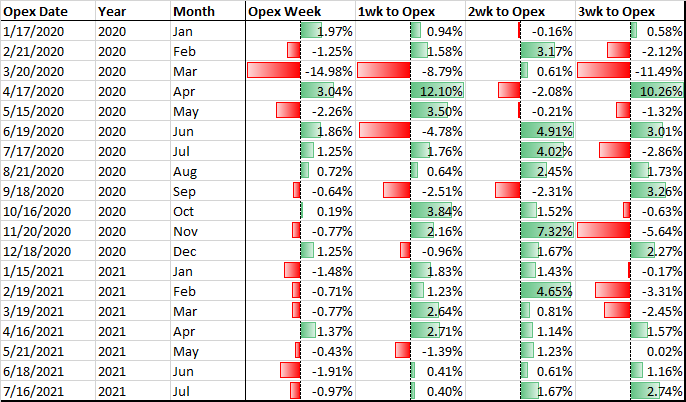
With exposure concentrated in shorter-dated expiries, the November 19 monthly options expiration (OPEX) is somewhat of a concern for us.
The reason being?
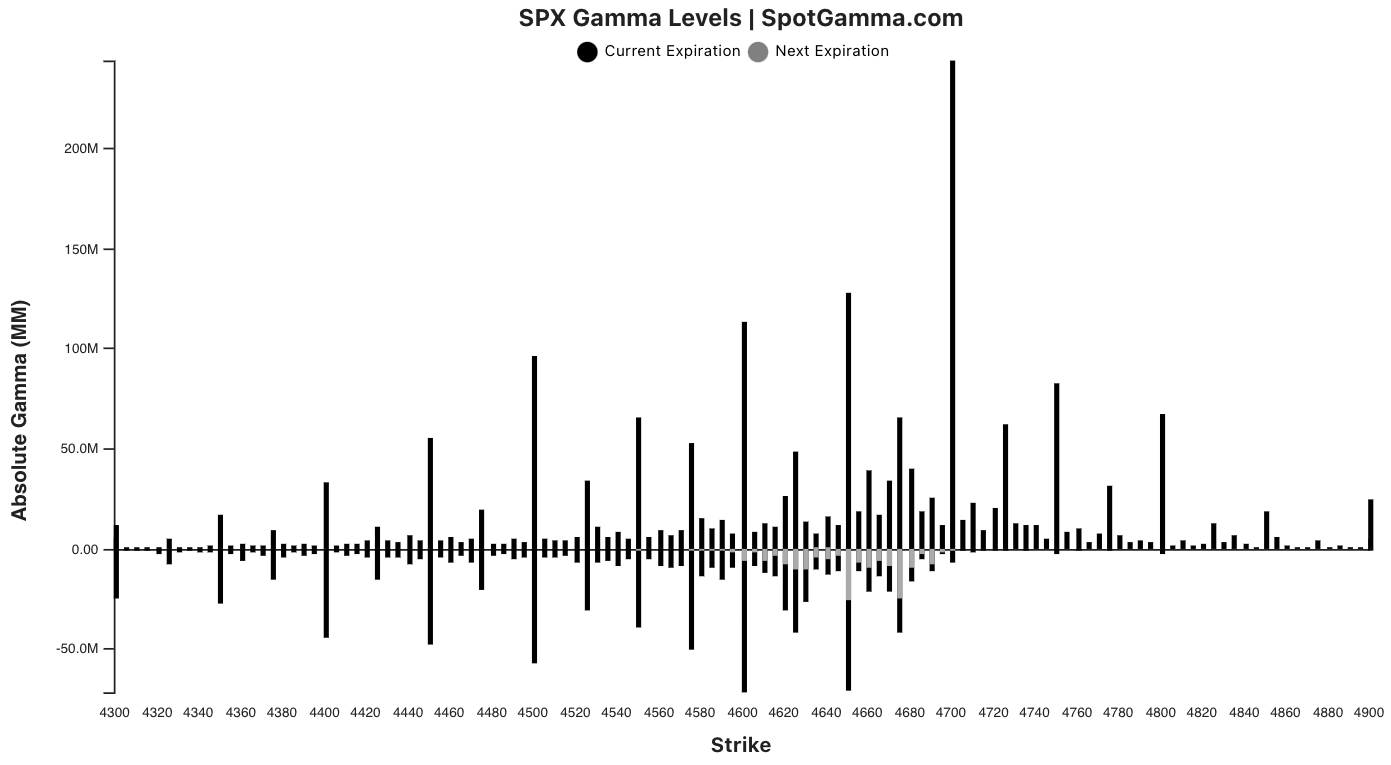
Presently, the S&P 500 is pinned near options strikes at which positive options gamma – delta sensitivity to underlying price – is highest.
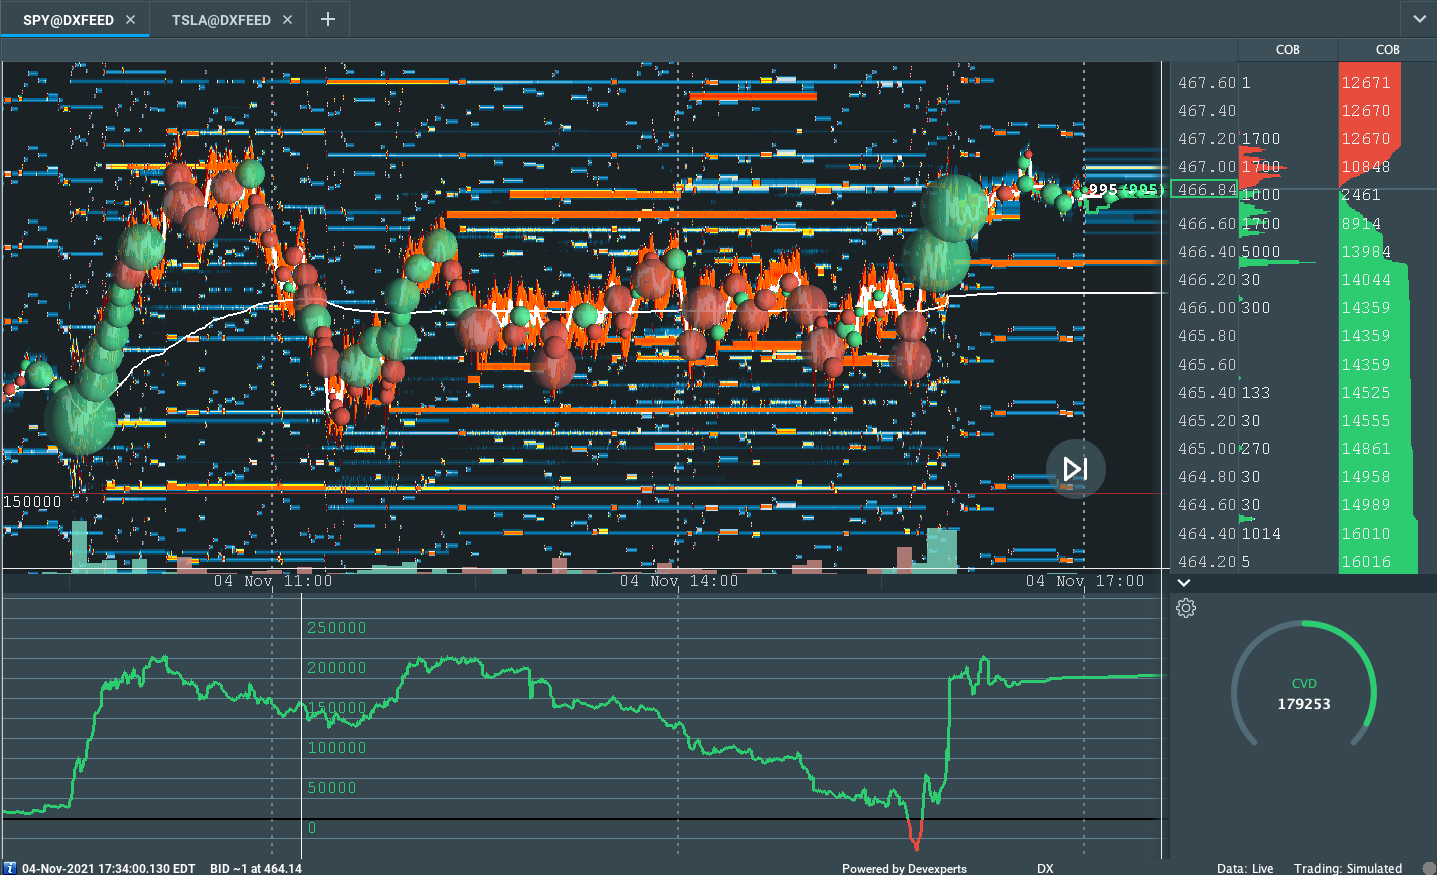
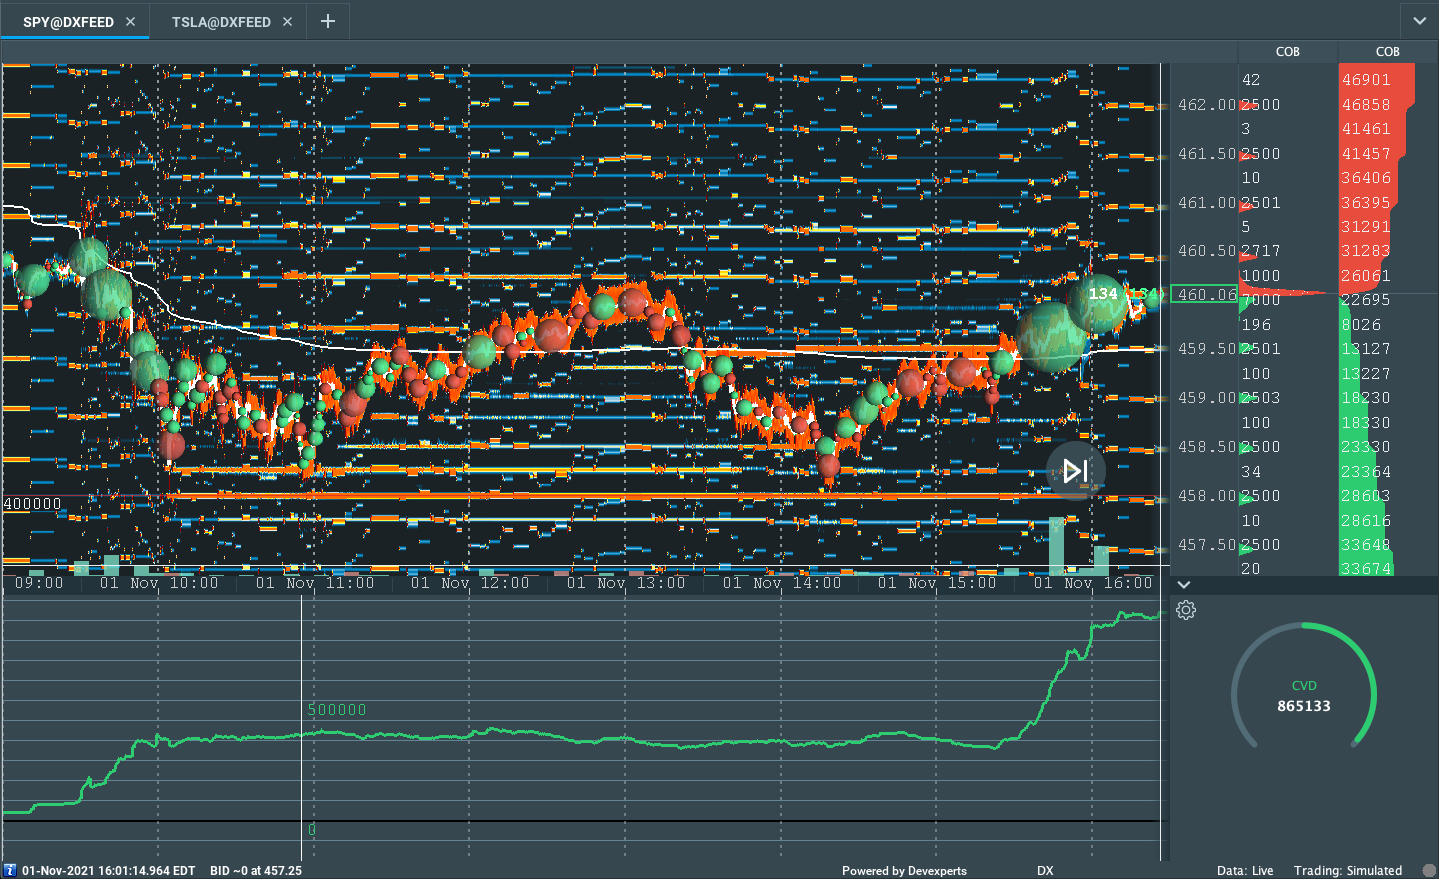
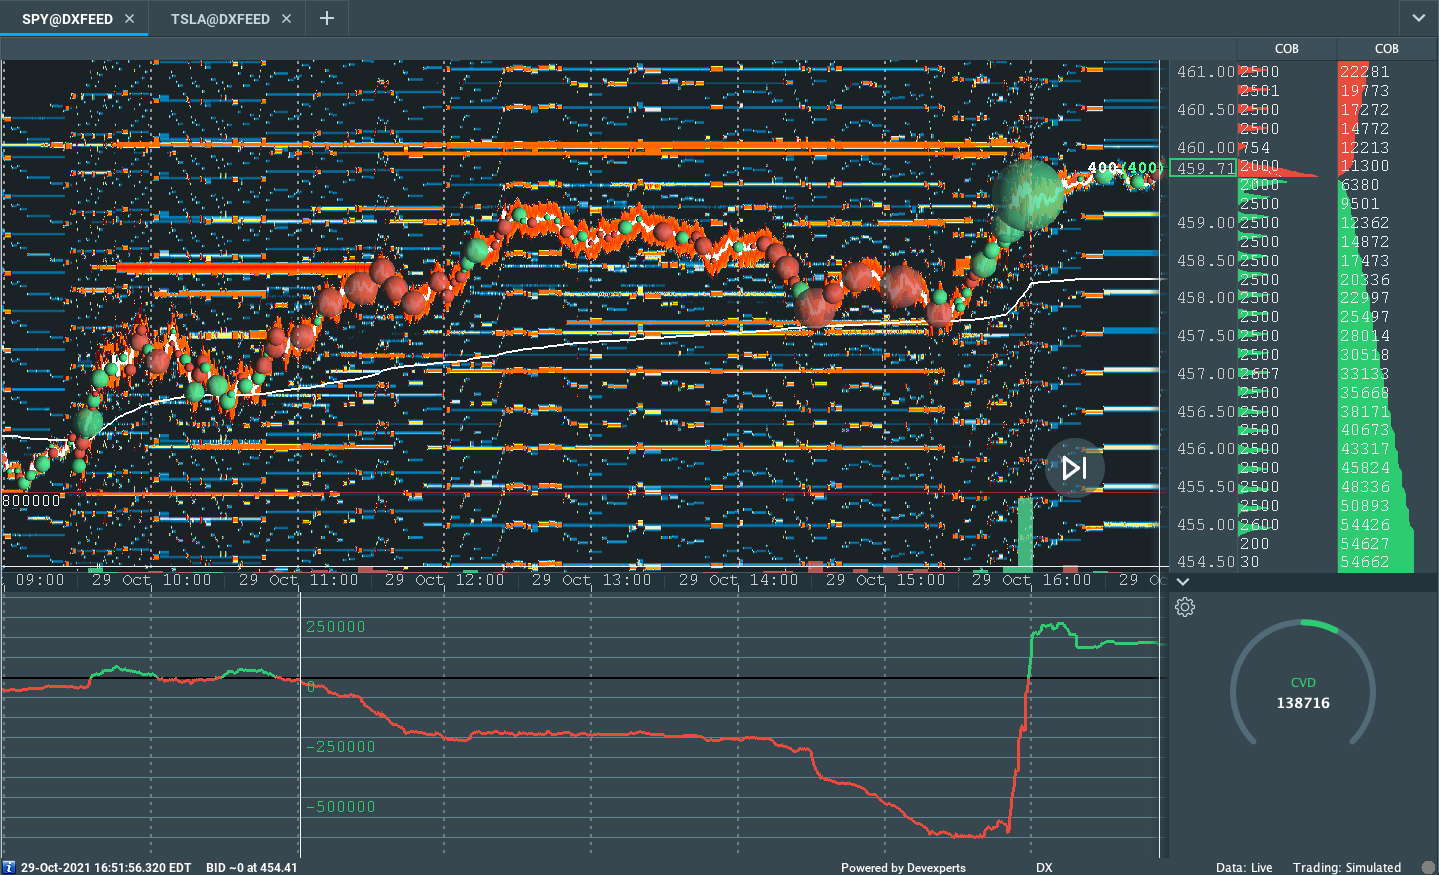
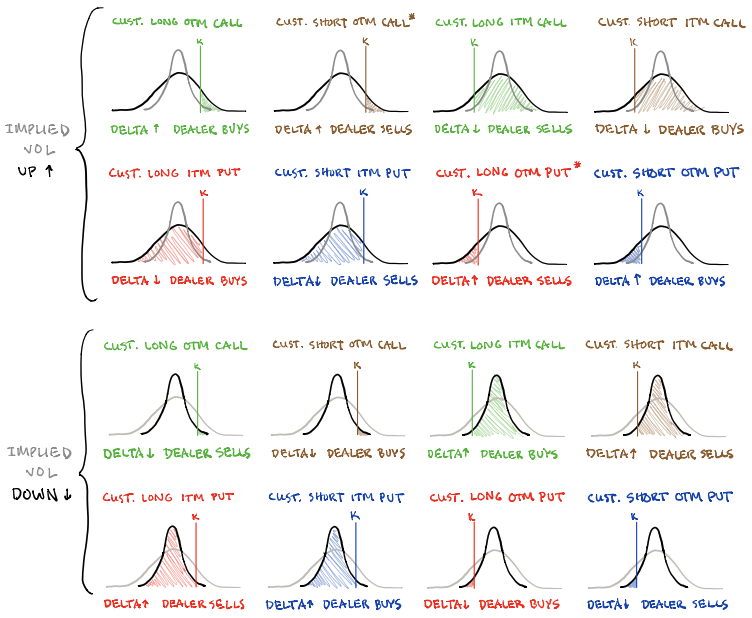
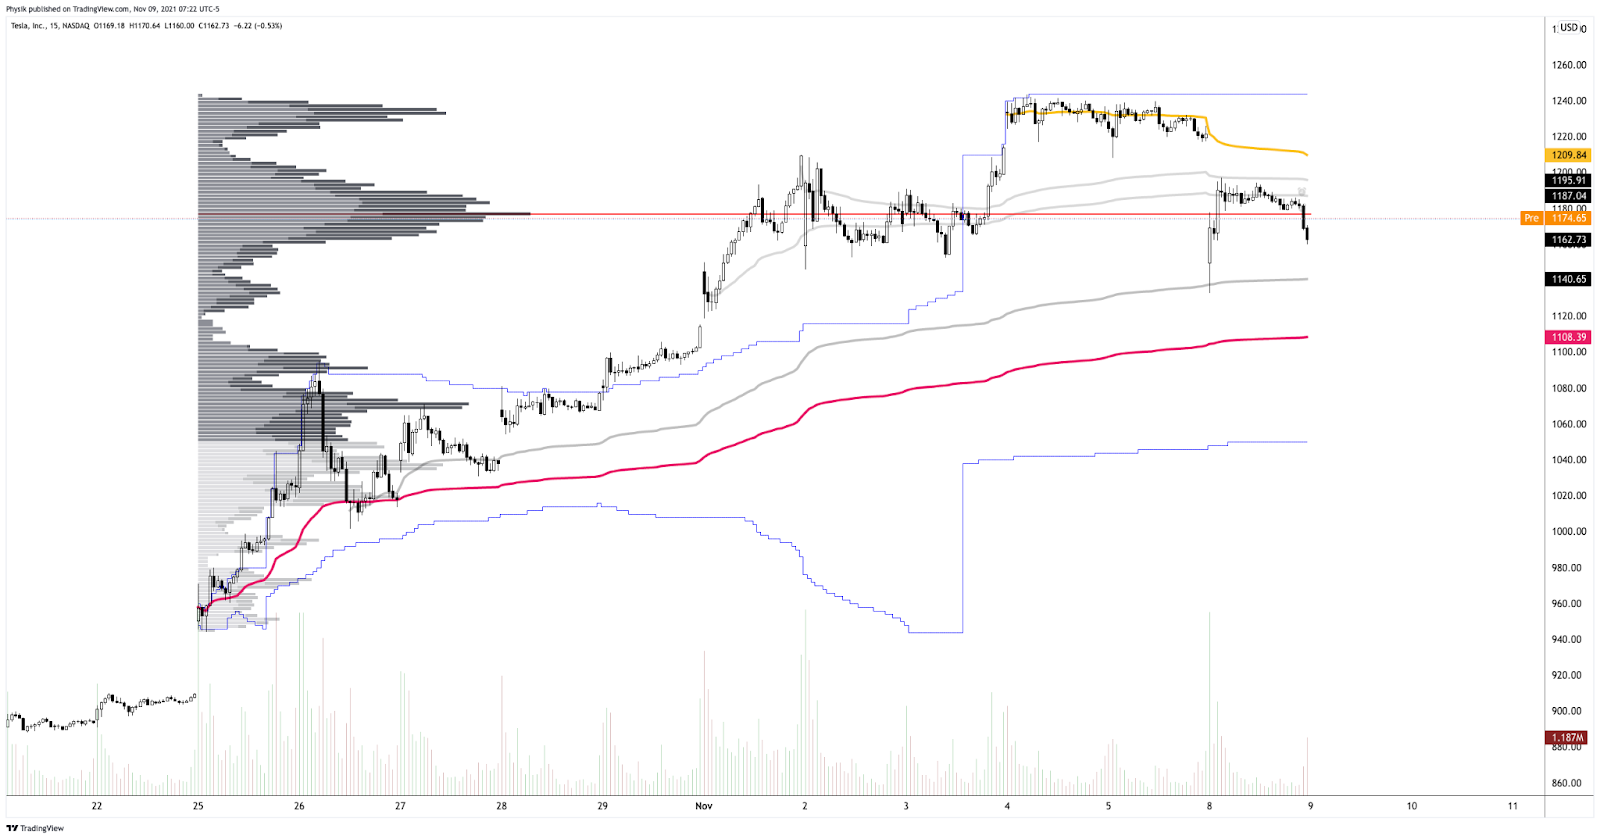
I note those participants that take the other side of options trades will hedge their exposure to risk by buying and selling the underlying.

When dealers are short-gamma (e.g., Tesla), they buy into strength and sell into weakness, exacerbating volatility.

When long-gamma, counterparties buy into weakness and sell into strength, calming volatility.
Coming into OPEX, the forces that promote pinning turn stronger; counterparties supply more liquidity as their long gamma becomes longer (i.e., rises), so to speak.
As OPEX is essentially a reset (or reduction) in dealer gamma exposure, participants ought to see an increase in realized volatility as a lot of the exposure that warranted dealers’ supply of liquidity comes off the table, thus necessitating less liquidity.
Less liquidity means more movement.

More liquidity means less movement.

Get it?
With short-term speculators taking on the risks that we’re seeing them take on, and the prospects of a front-running of post-OPEX volatility – given that, according to Pat Hennessy, “OPEX week returns peaked in 2016 and have trended lower since” – there is a potential that adverse moves force those that are off-sides cover (sell) their short put (long call) positions, thereby exacerbating near-term volatility.
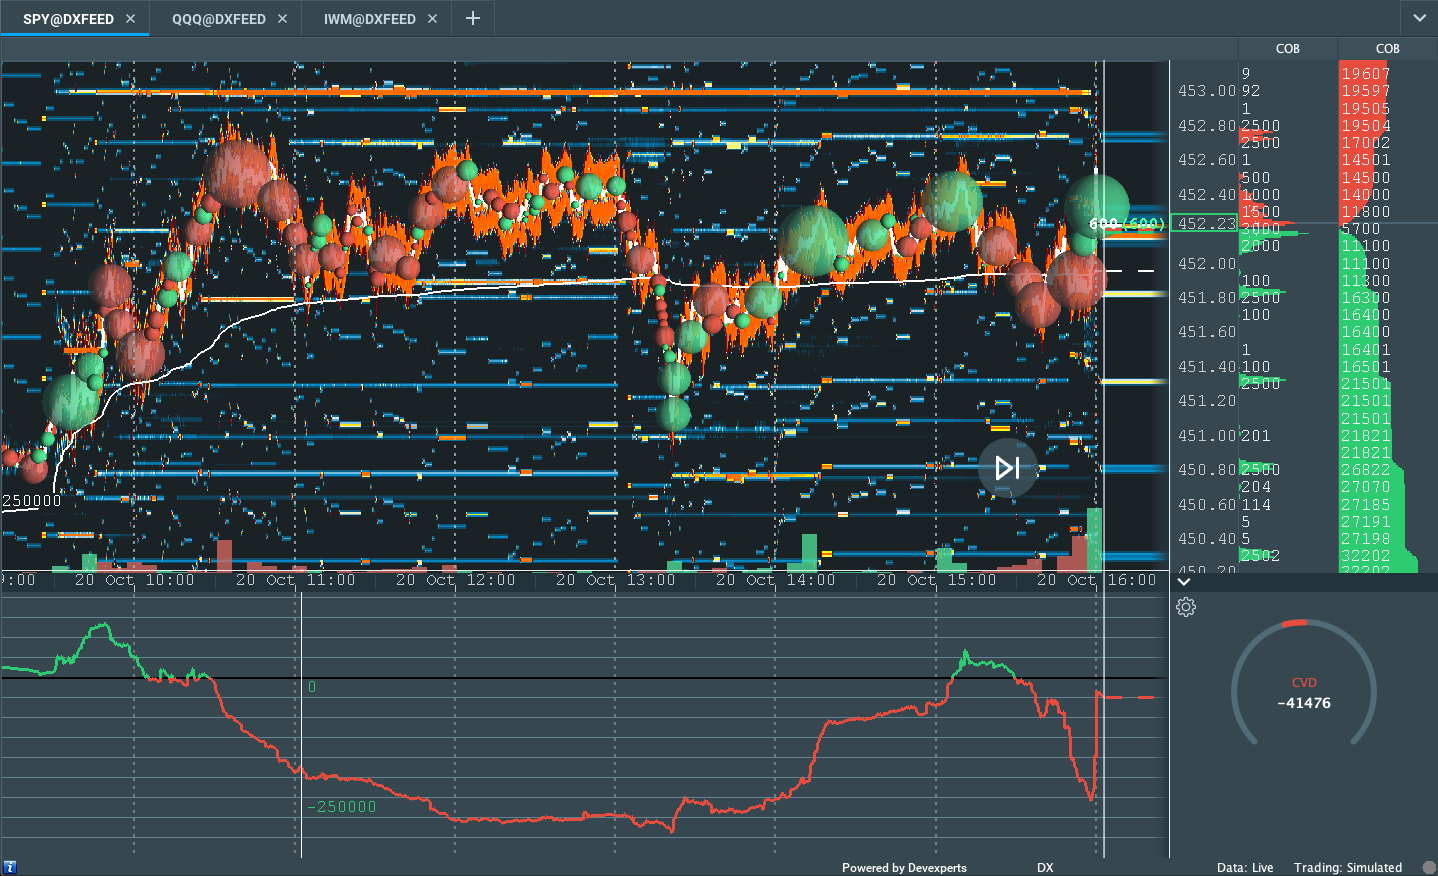
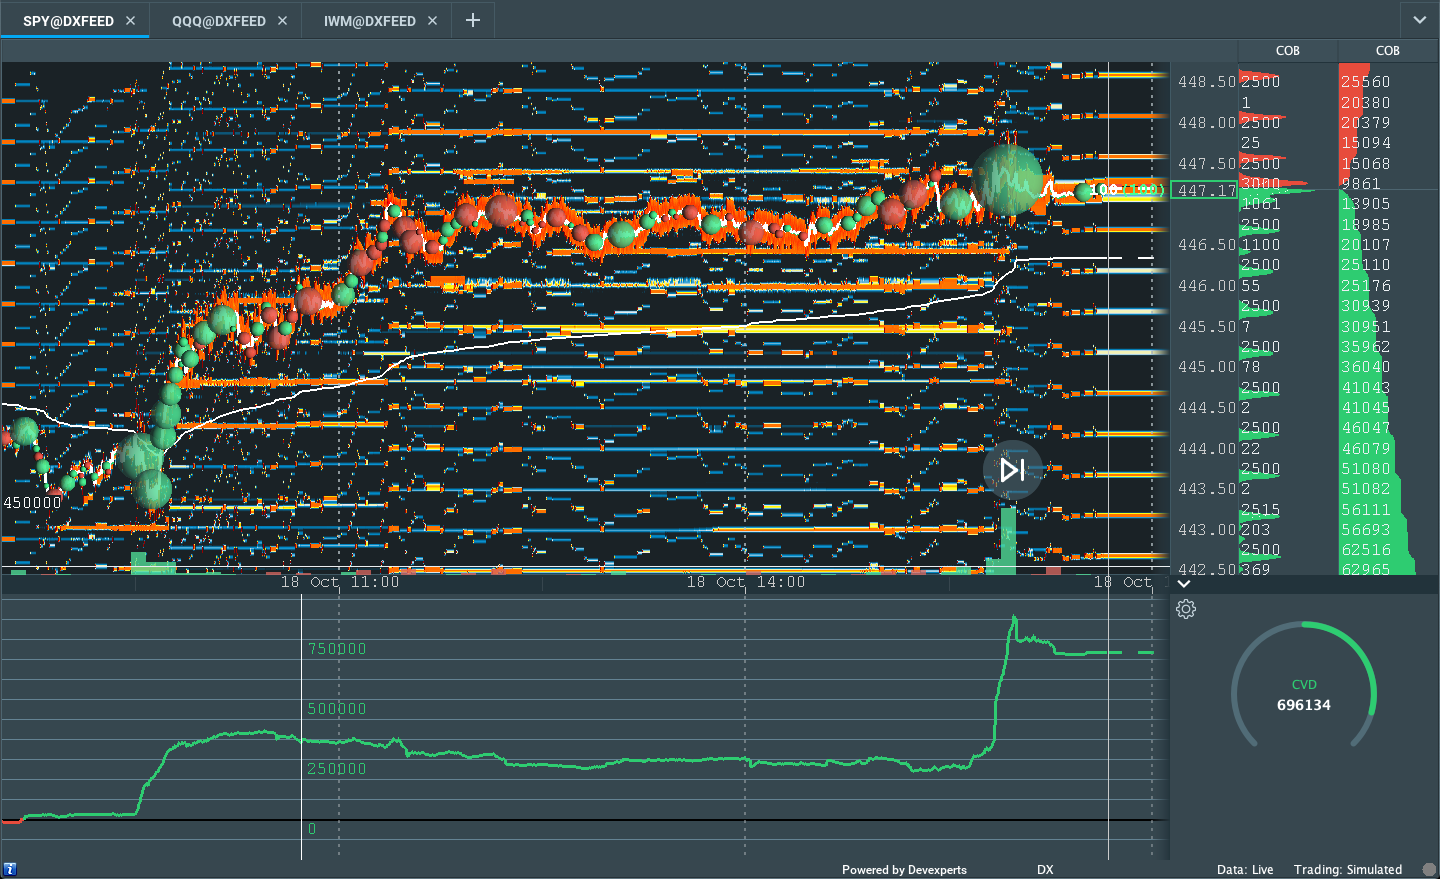
We see recent options activity reflected in a sideways to higher CBOE Volatility Index (INDEX: VIX) and shift up in the VIX futures term structure; both suggest a demand for hedges and a reduction in the flows (e.g., vanna) that support sideways to higher trade.
“The moves have been large and the demand for upside in single stock land insatiable,” said Danny Kirsch of Cornerstone Macro LLC. “Single stock vols clearly feeding into the index.”
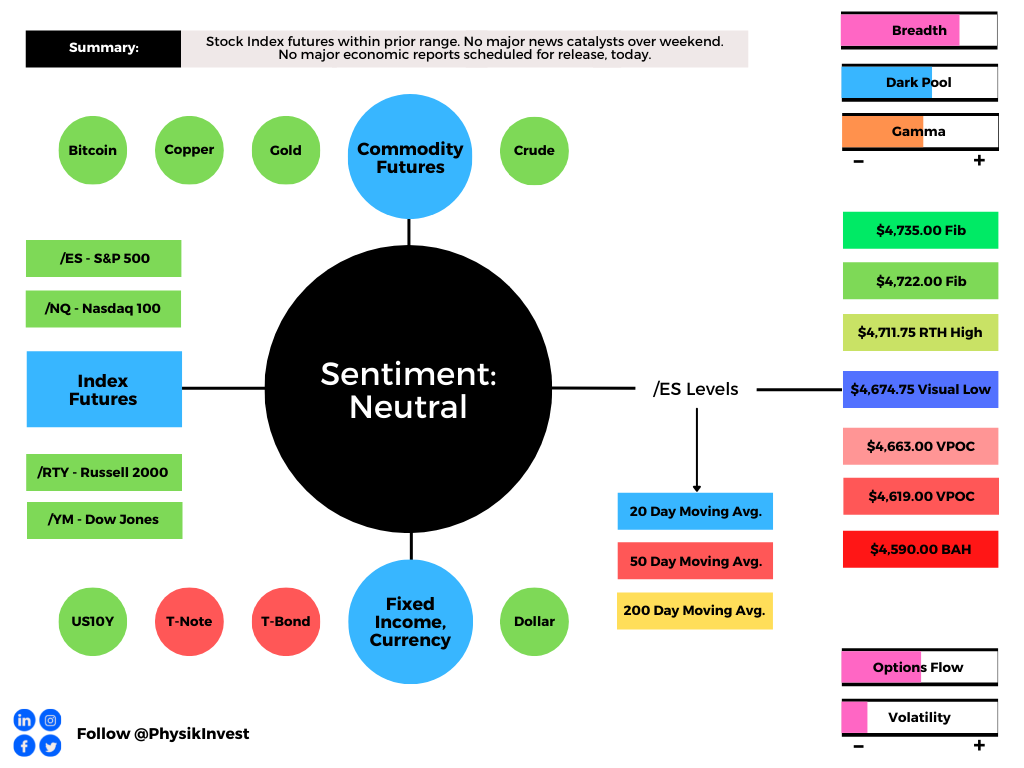
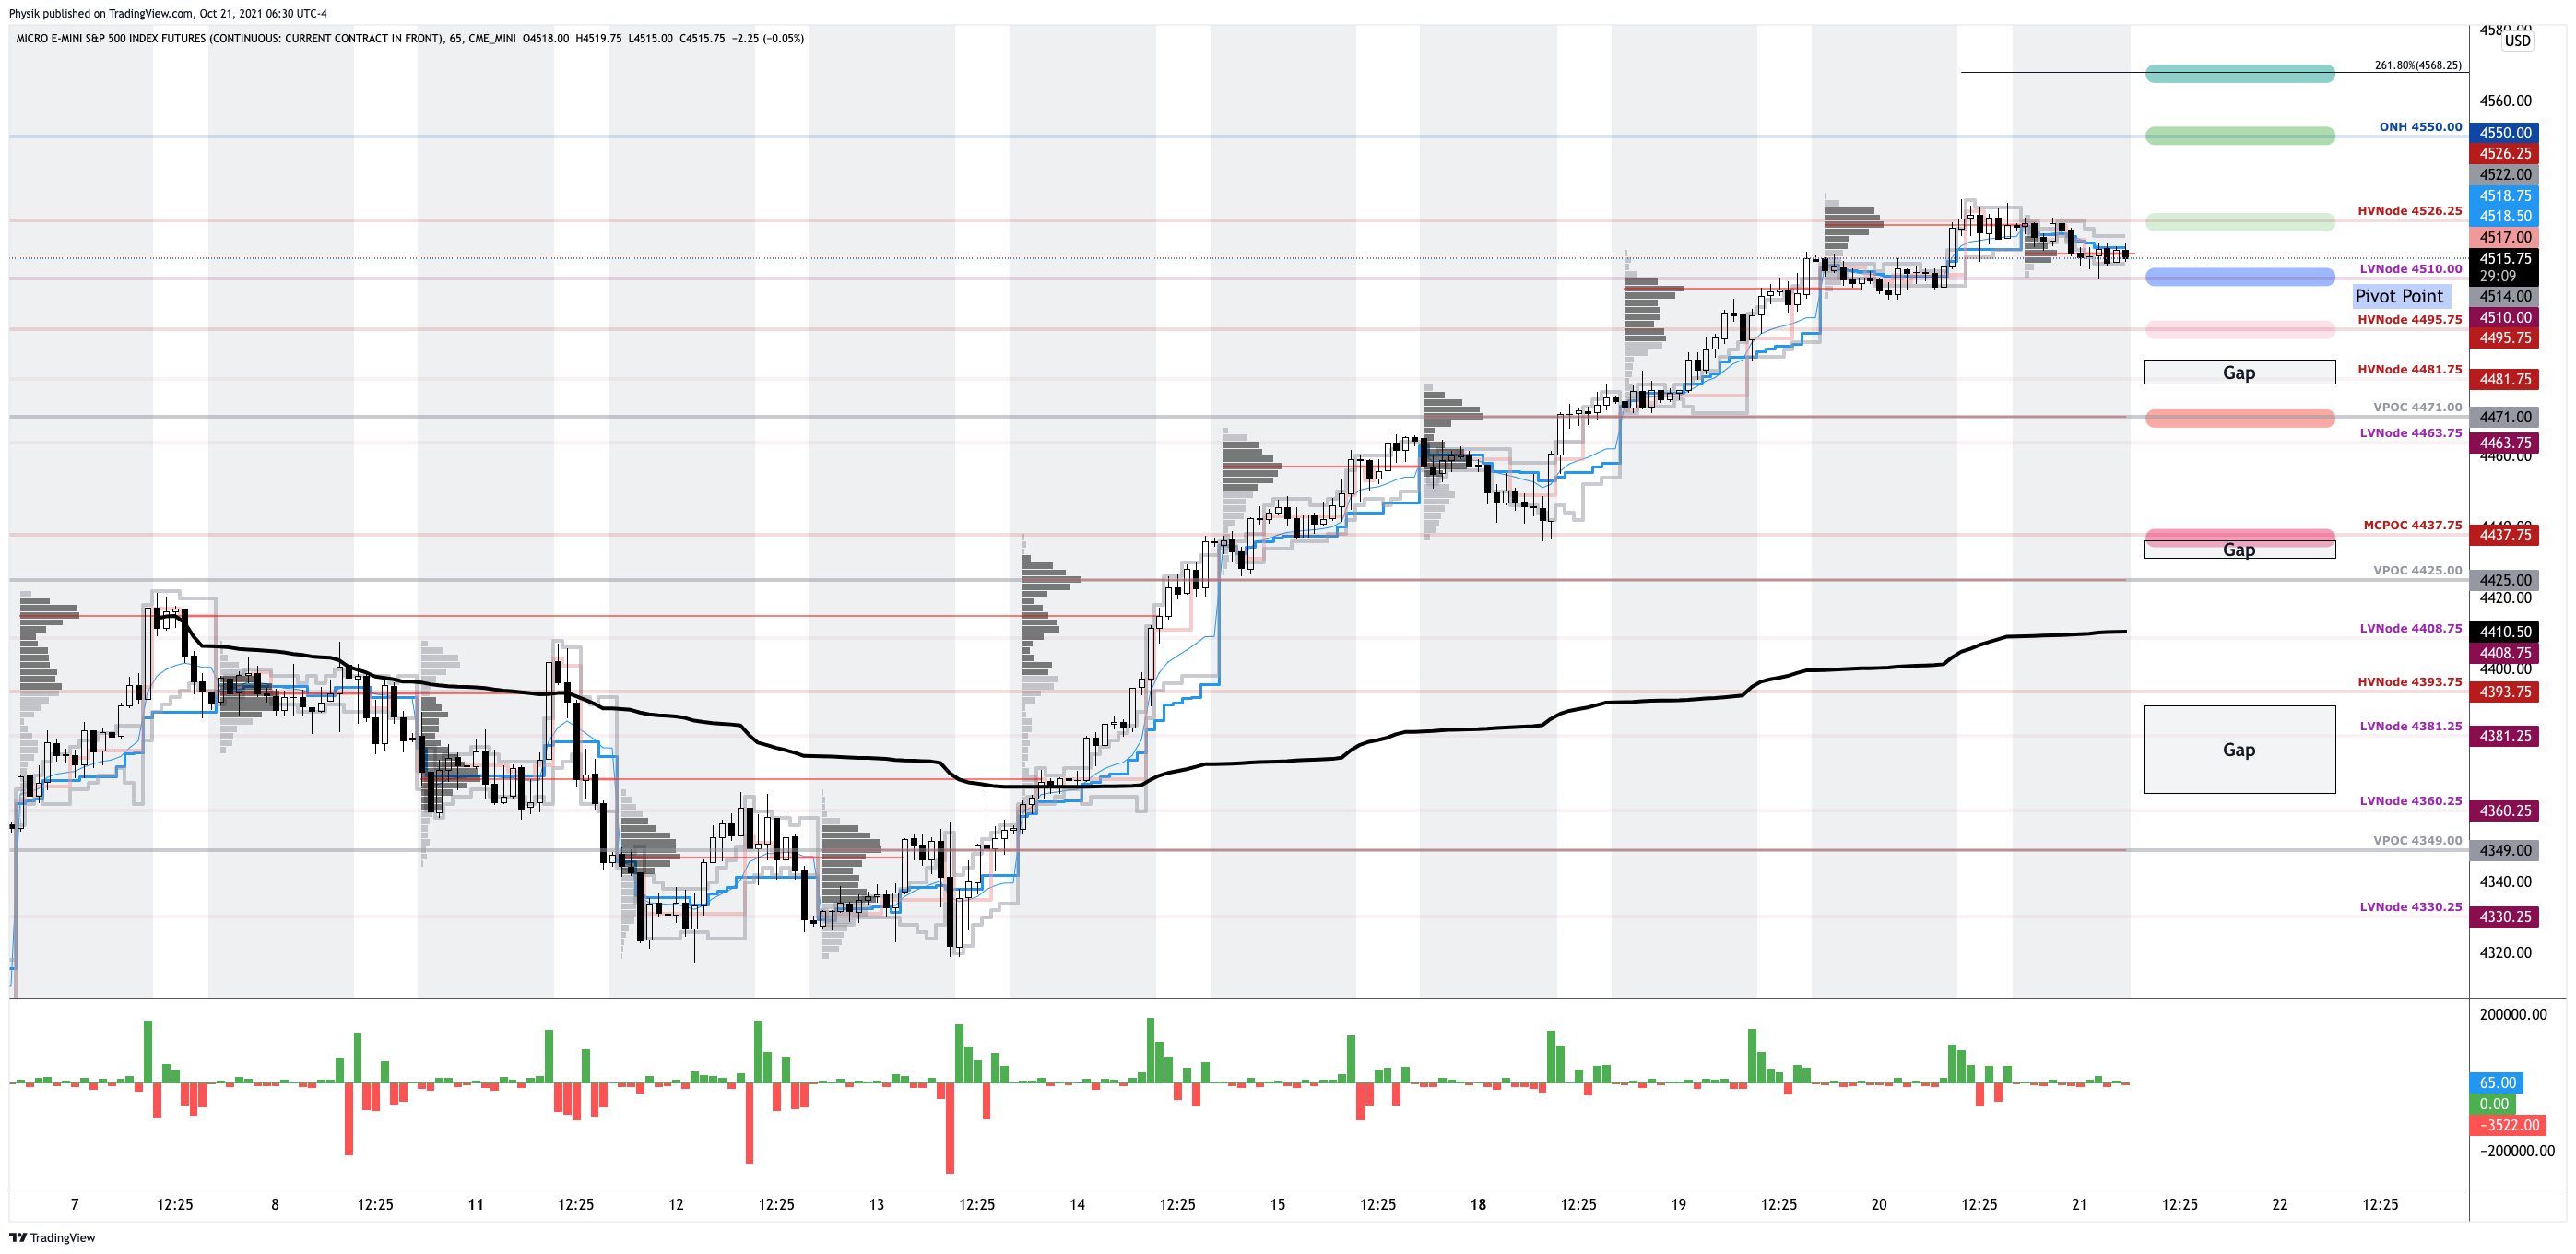
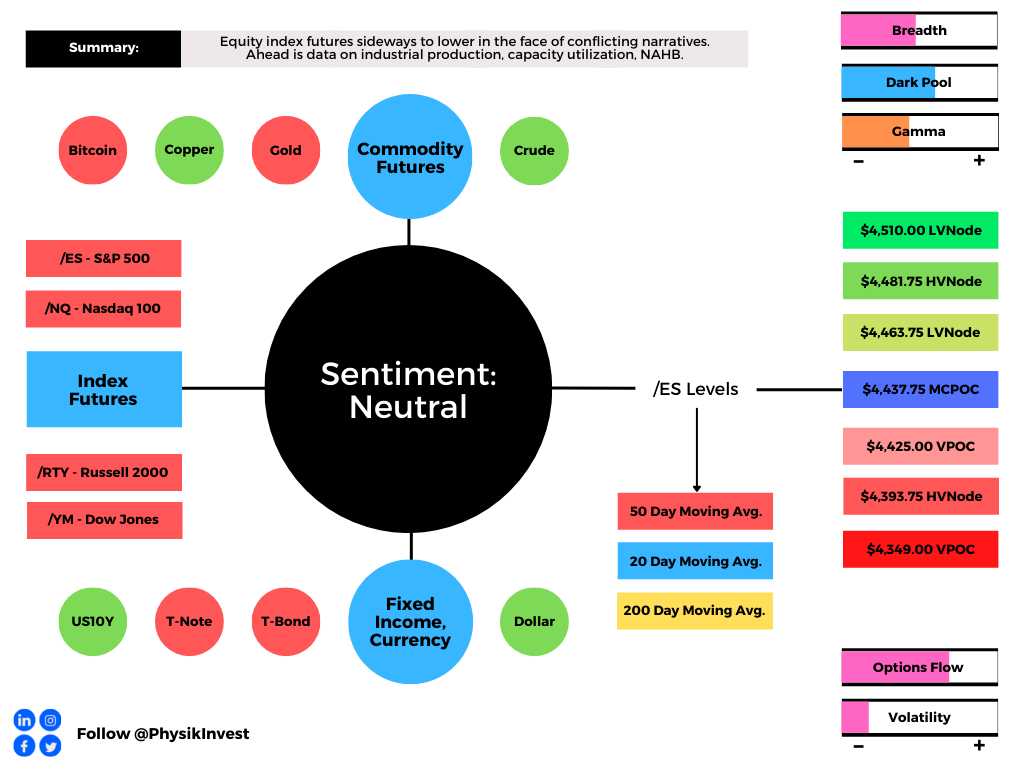
Expectations: As of 6:20 AM ET, Tuesday’s regular session (9:30 AM – 4:00 PM ET), in the S&P 500, will likely open in the upper part of a balanced overnight inventory, inside of prior-range and -value, suggesting a limited potential for immediate directional opportunity.
Market Is In Balance: Current prices offer favorable entry and exit. Modus operandi is responsive trade (i.e., fade the edges), rather than initiative trade (i.e., play the break).
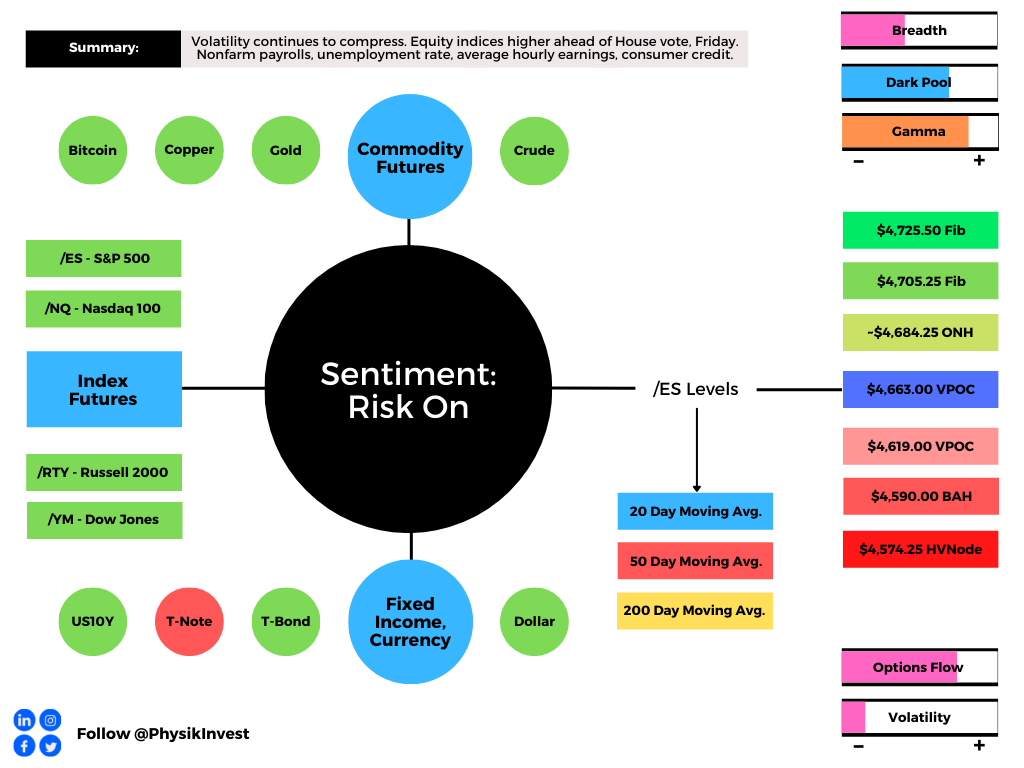
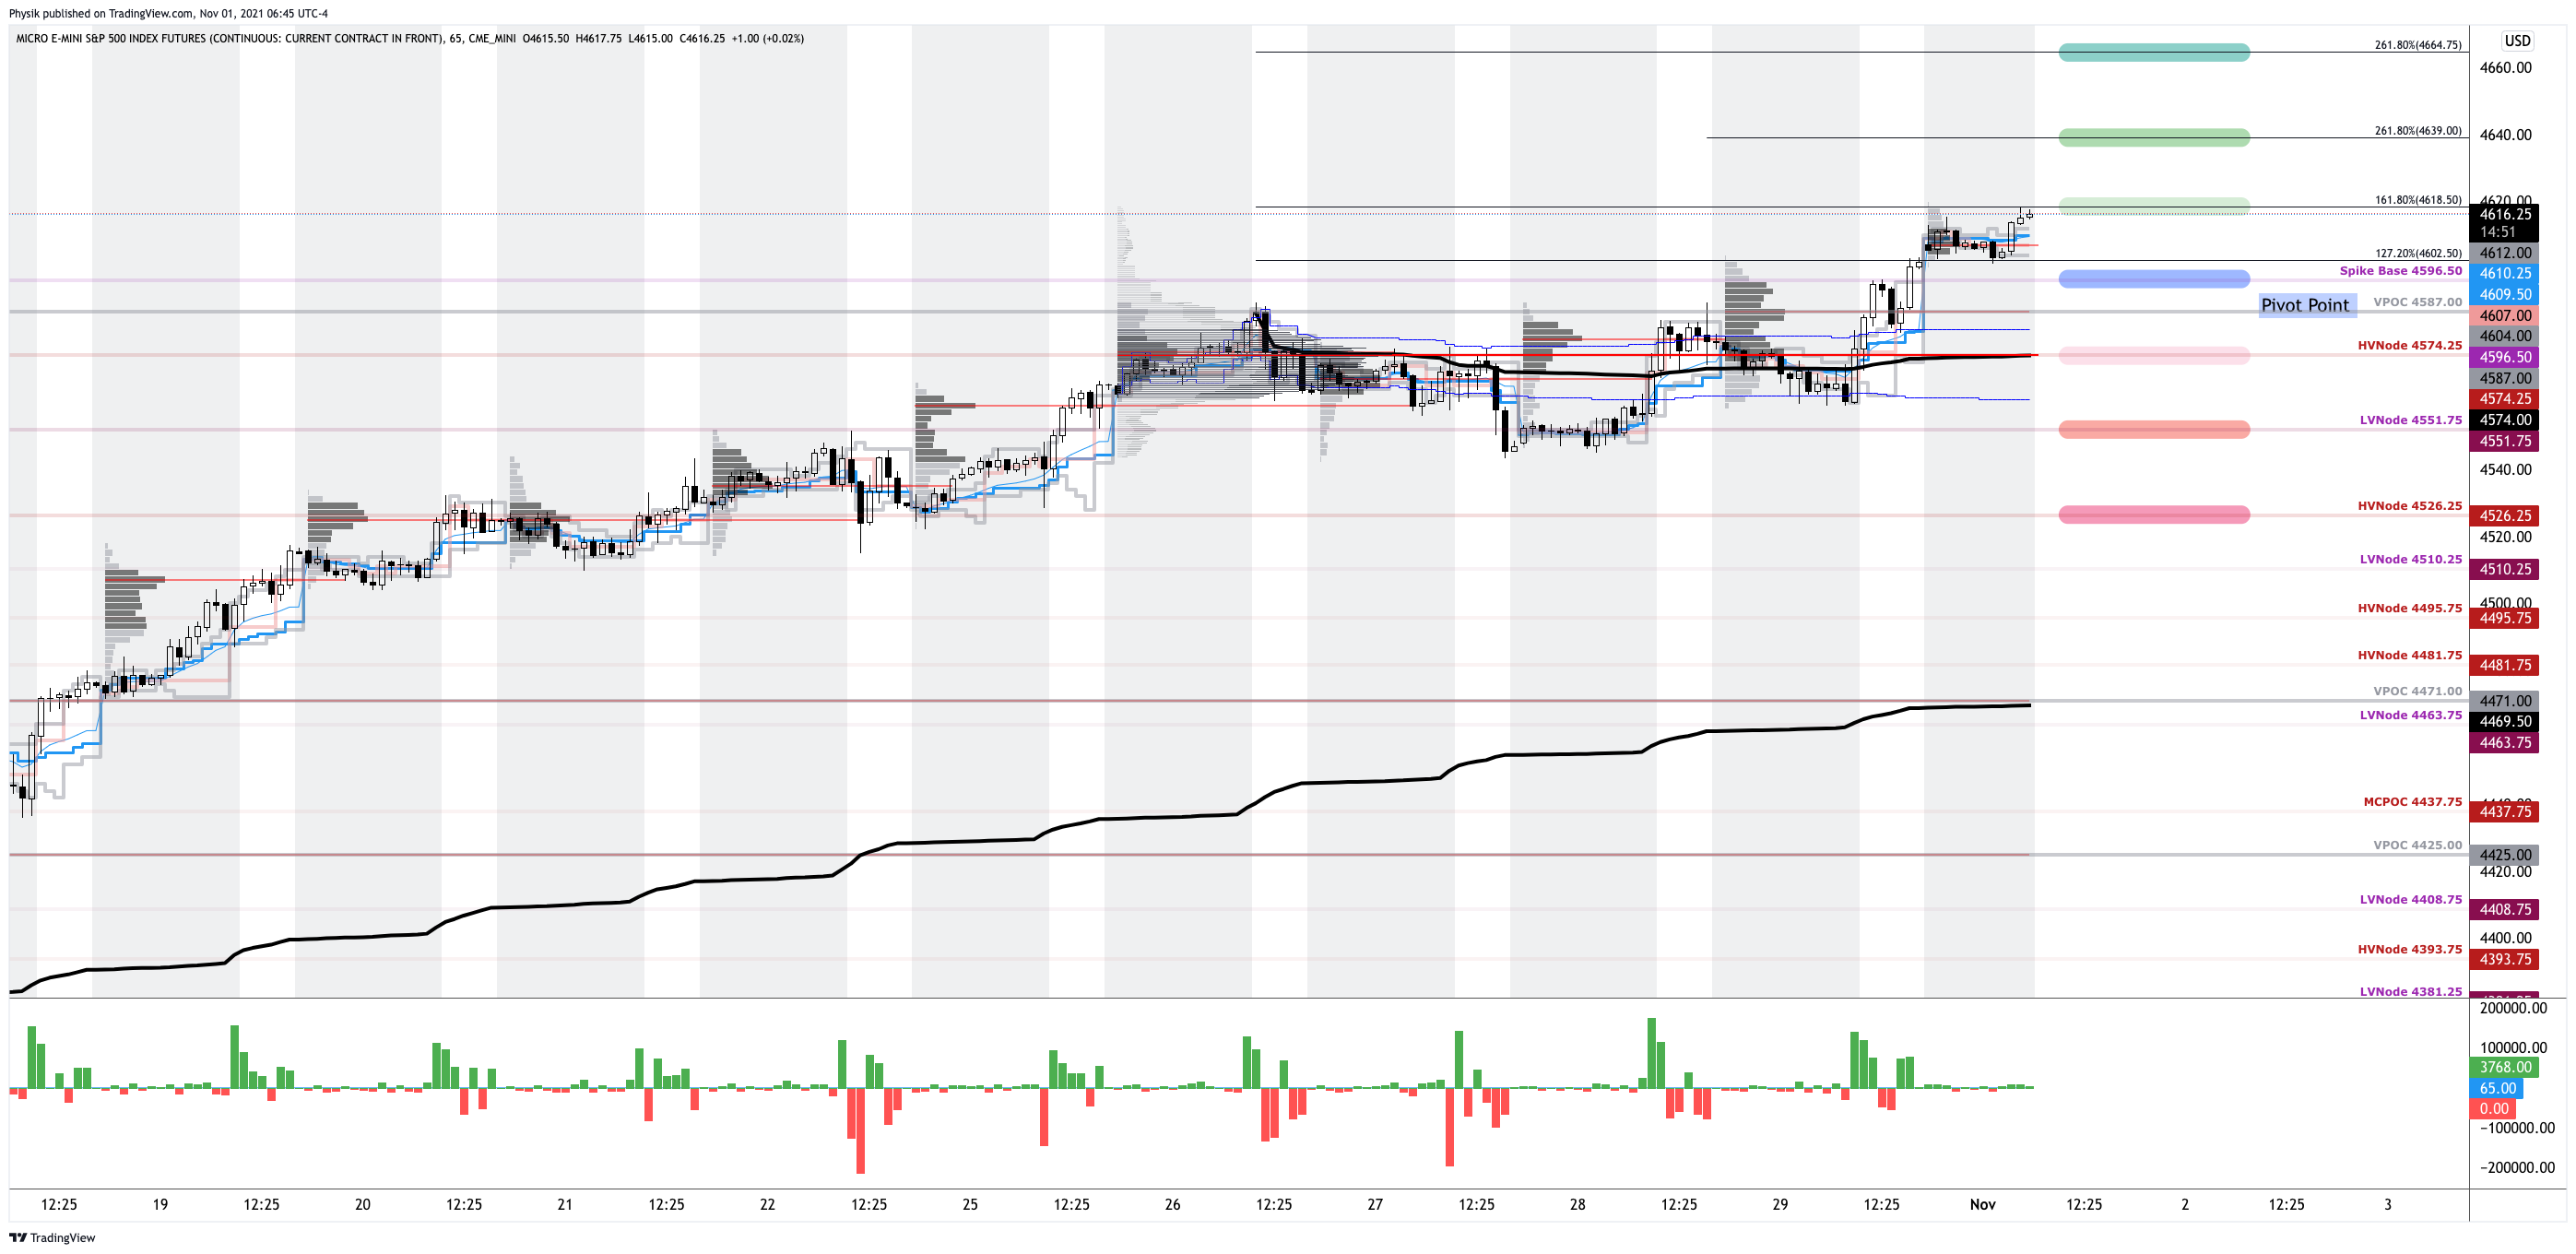
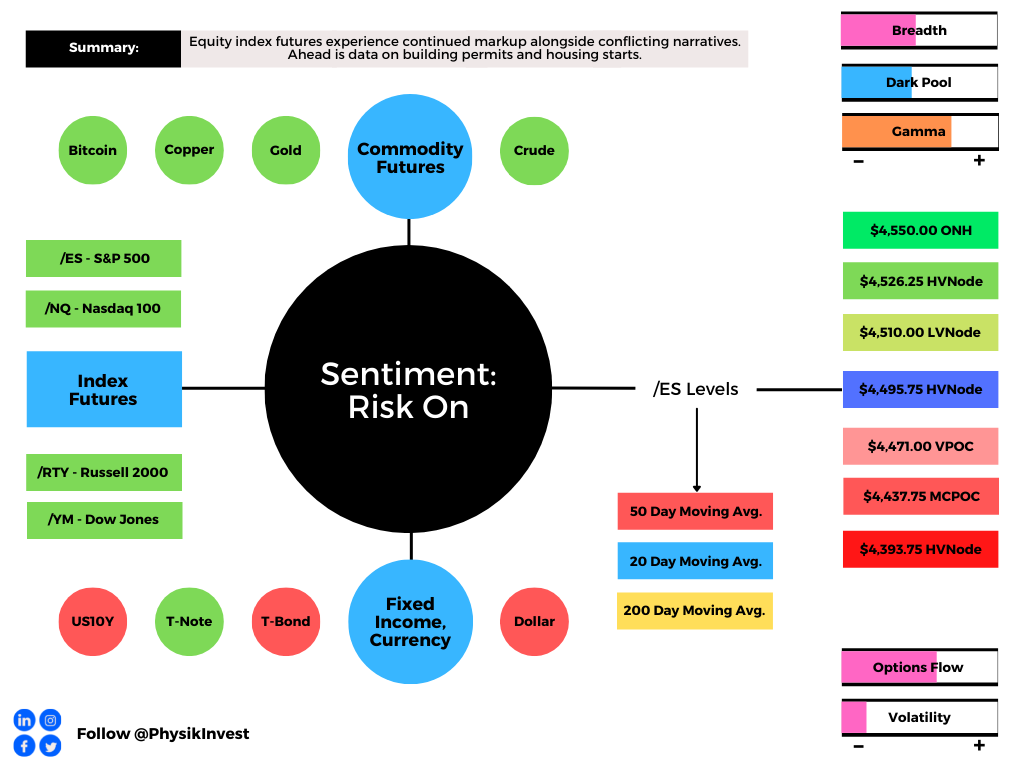
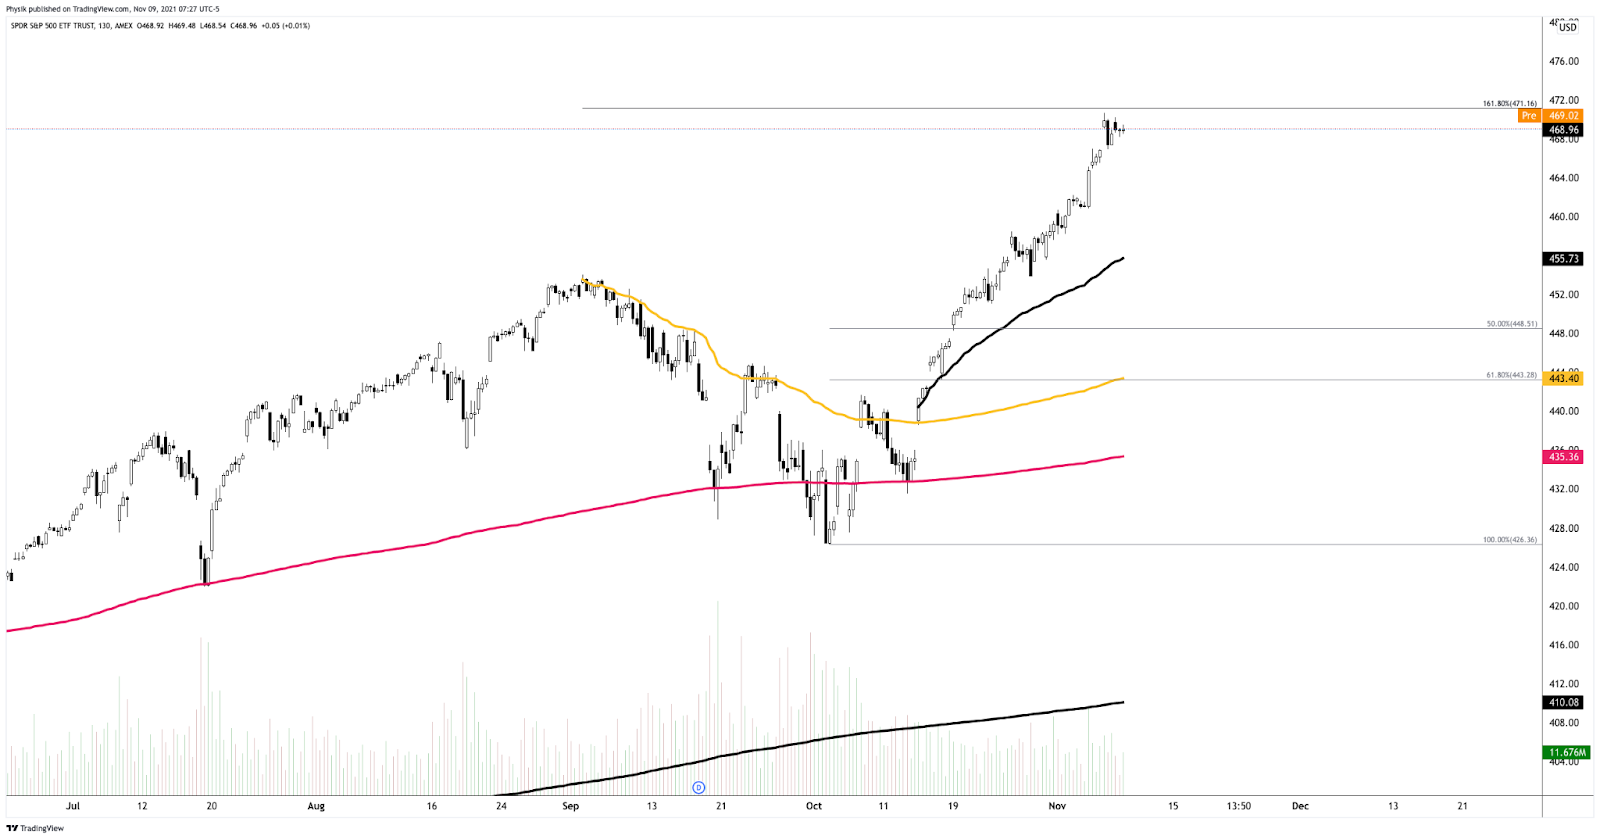
In the best case, the S&P 500 trades sideways or higher; activity above the $4,692.25 micro composite point of control (MCPOC) puts in play the $4,722.00 Fibonacci. Initiative trade beyond $4,722.00 could reach as high as the $4,735.00 and $4,772.50 Fibonacci, or higher.
In the worst case, the S&P 500 trades lower; activity below the $4,692.25 MCPOC puts in play the $4,674.75 visual low. Initiative trade beyond the visual low (likely paid attention to by short-term, technically driven market participants who seldom defend retests) could reach as low as the $4,663.00 untested point of control (VPOC) and $4,619.00 VPOC, or lower.
Click here to load today’s updated key levels into the web-based TradingView charting platform. Note that all levels are derived using the 65-minute timeframe. New links are produced, daily.

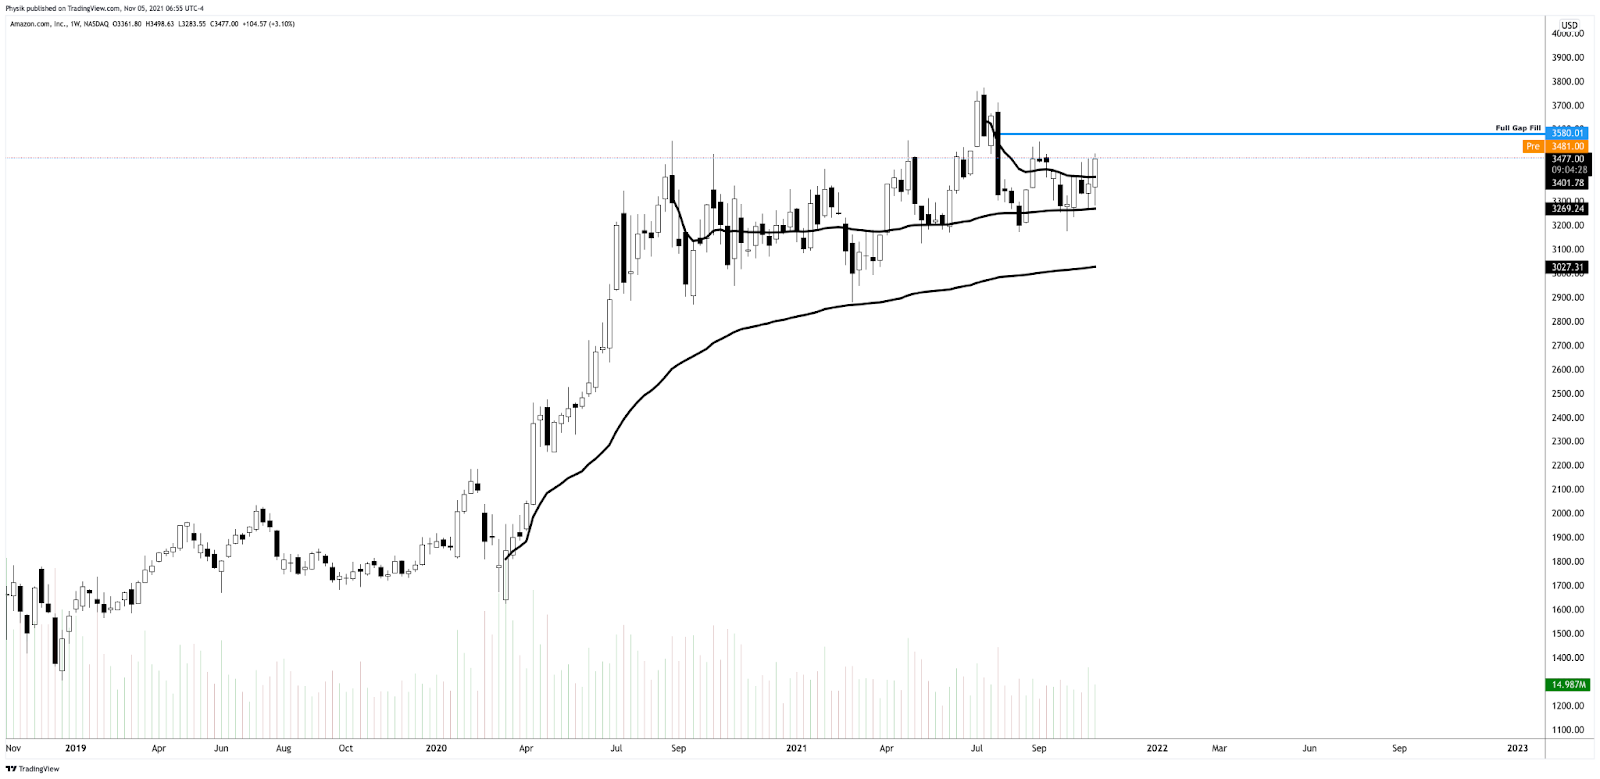
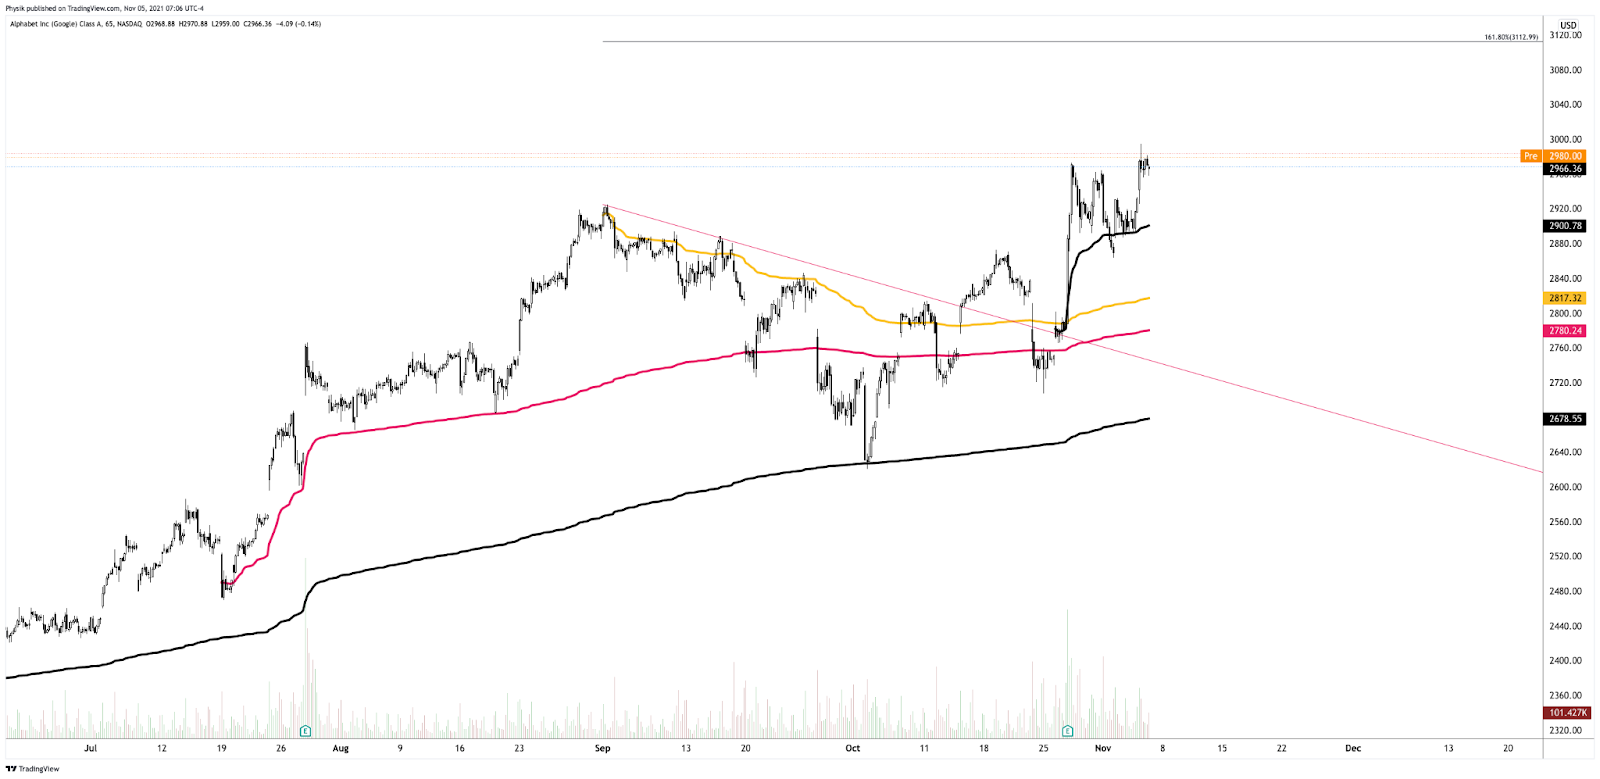
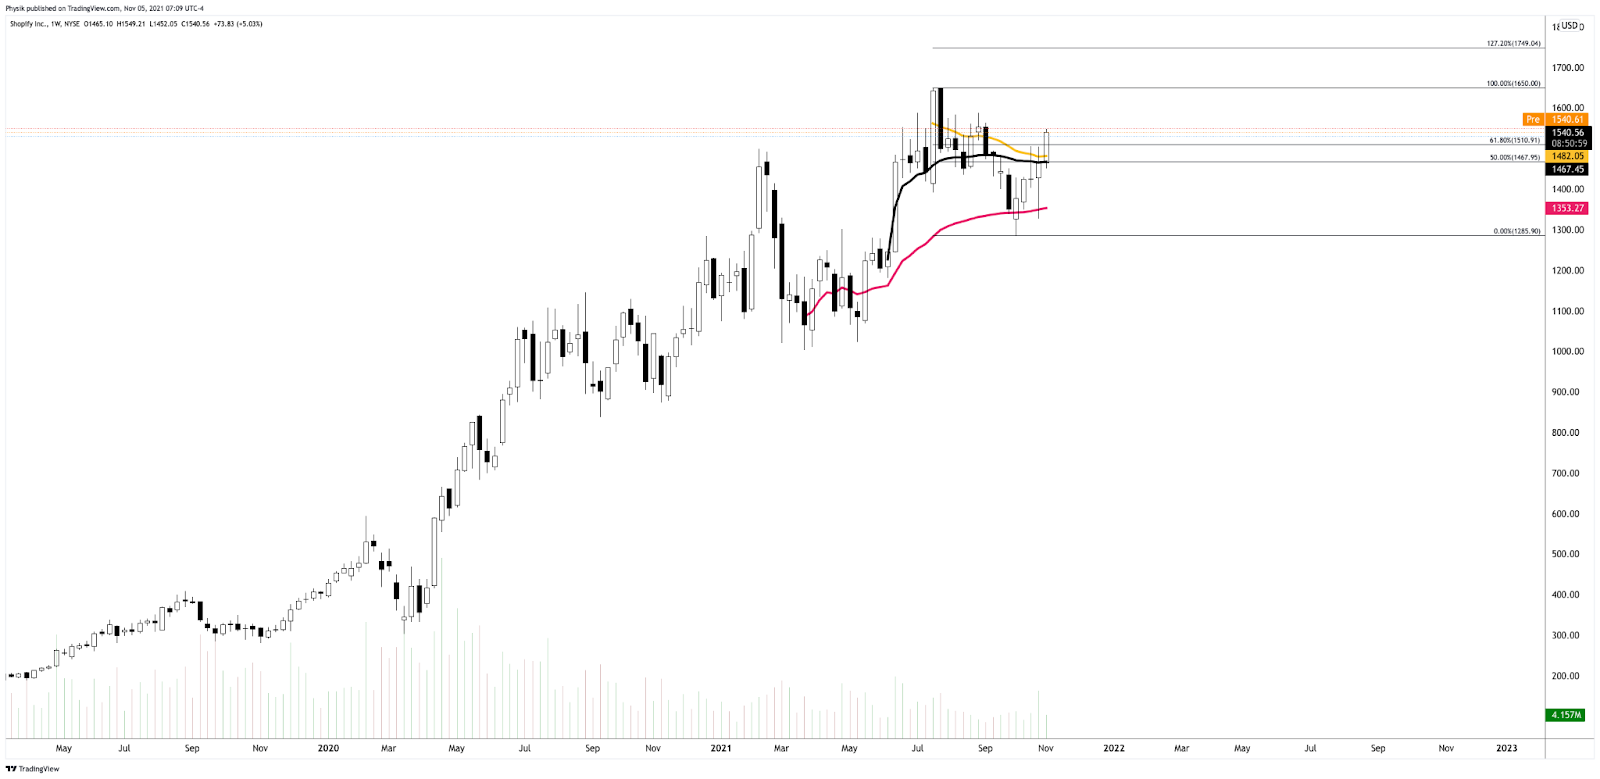
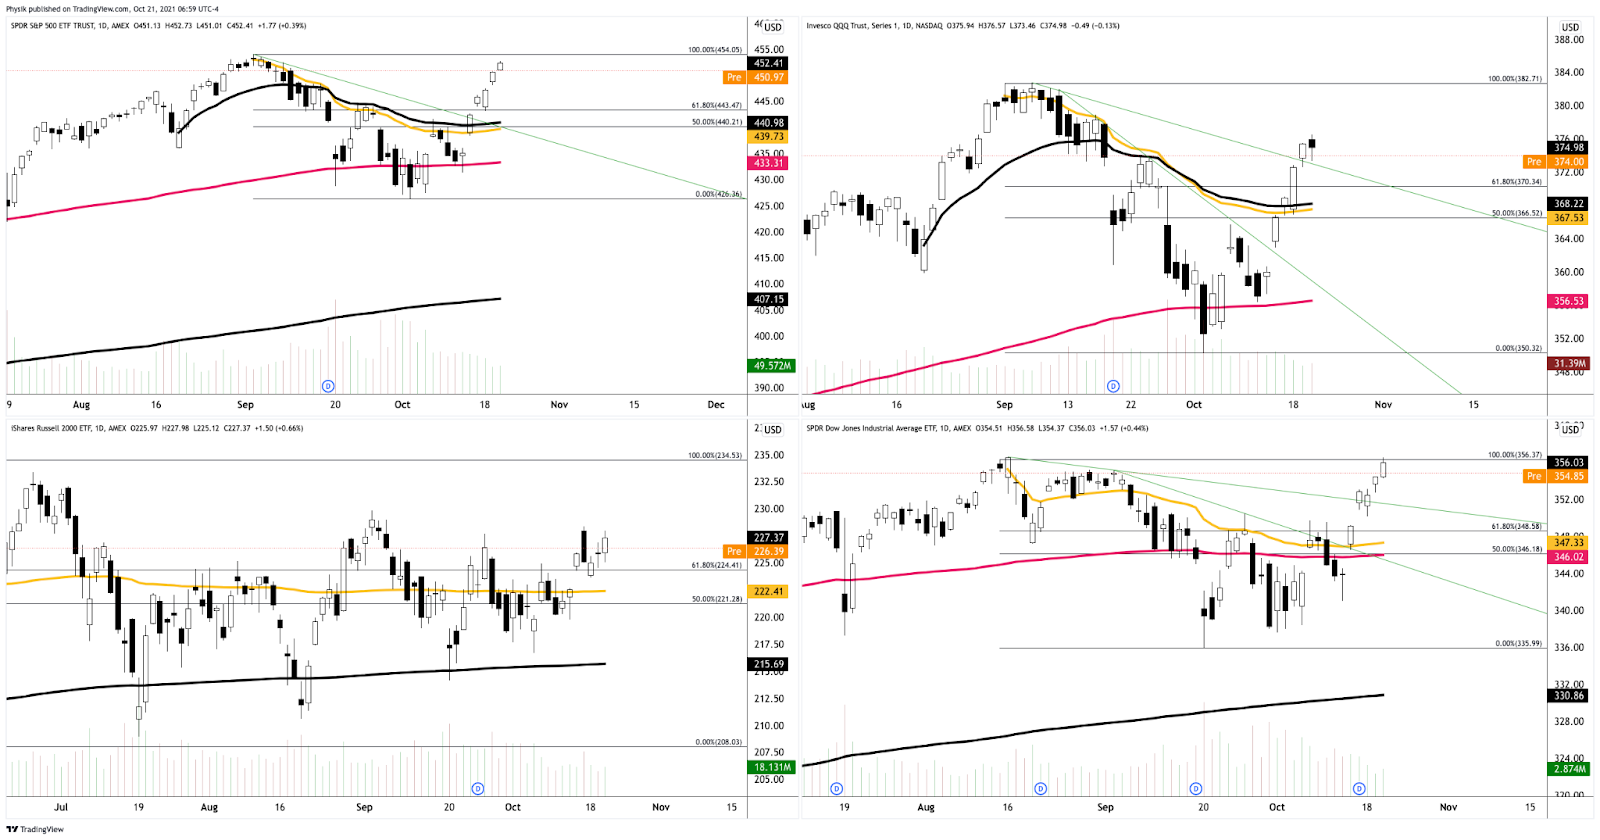
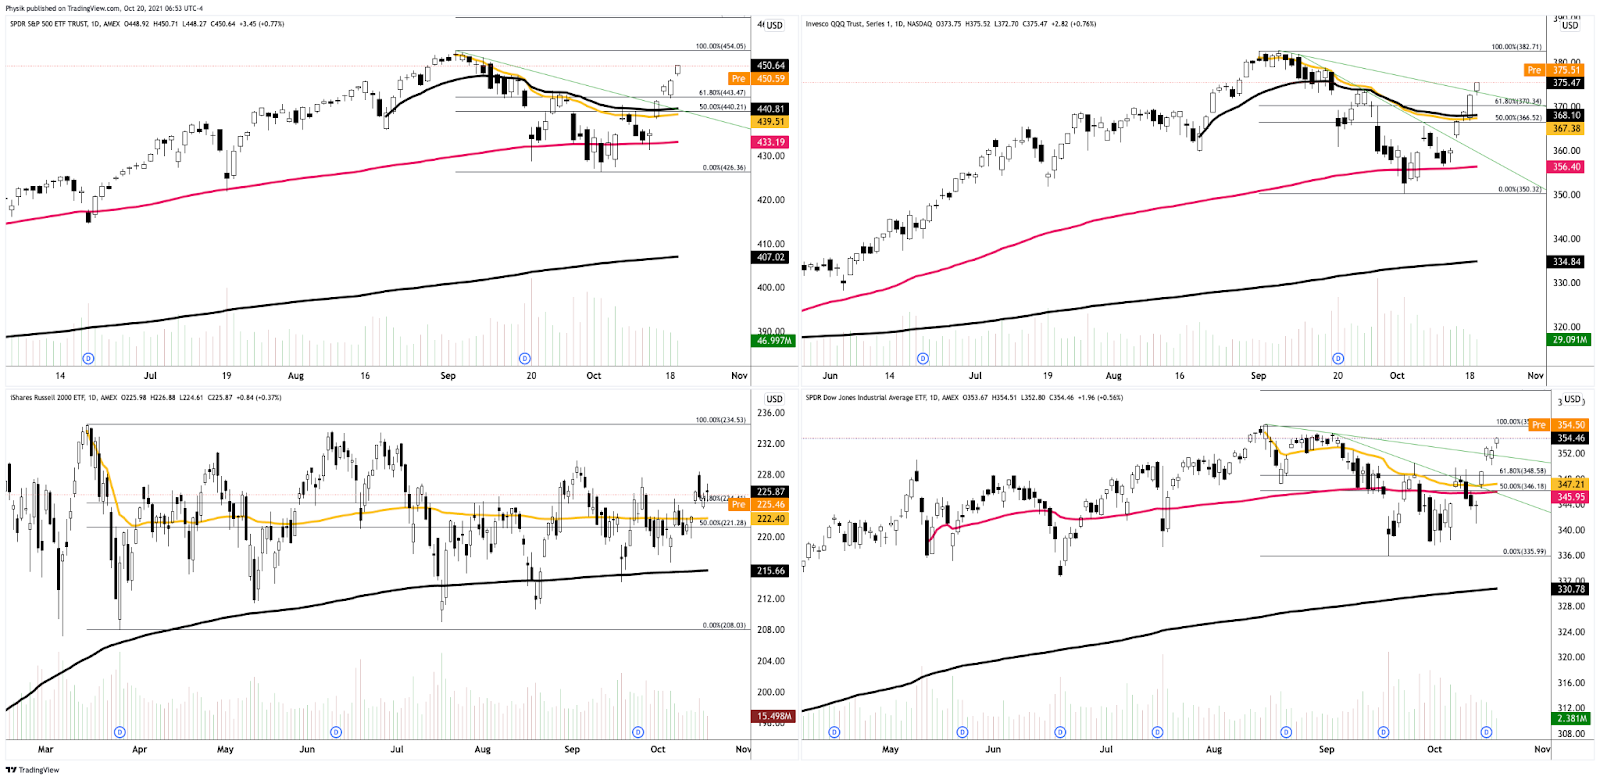
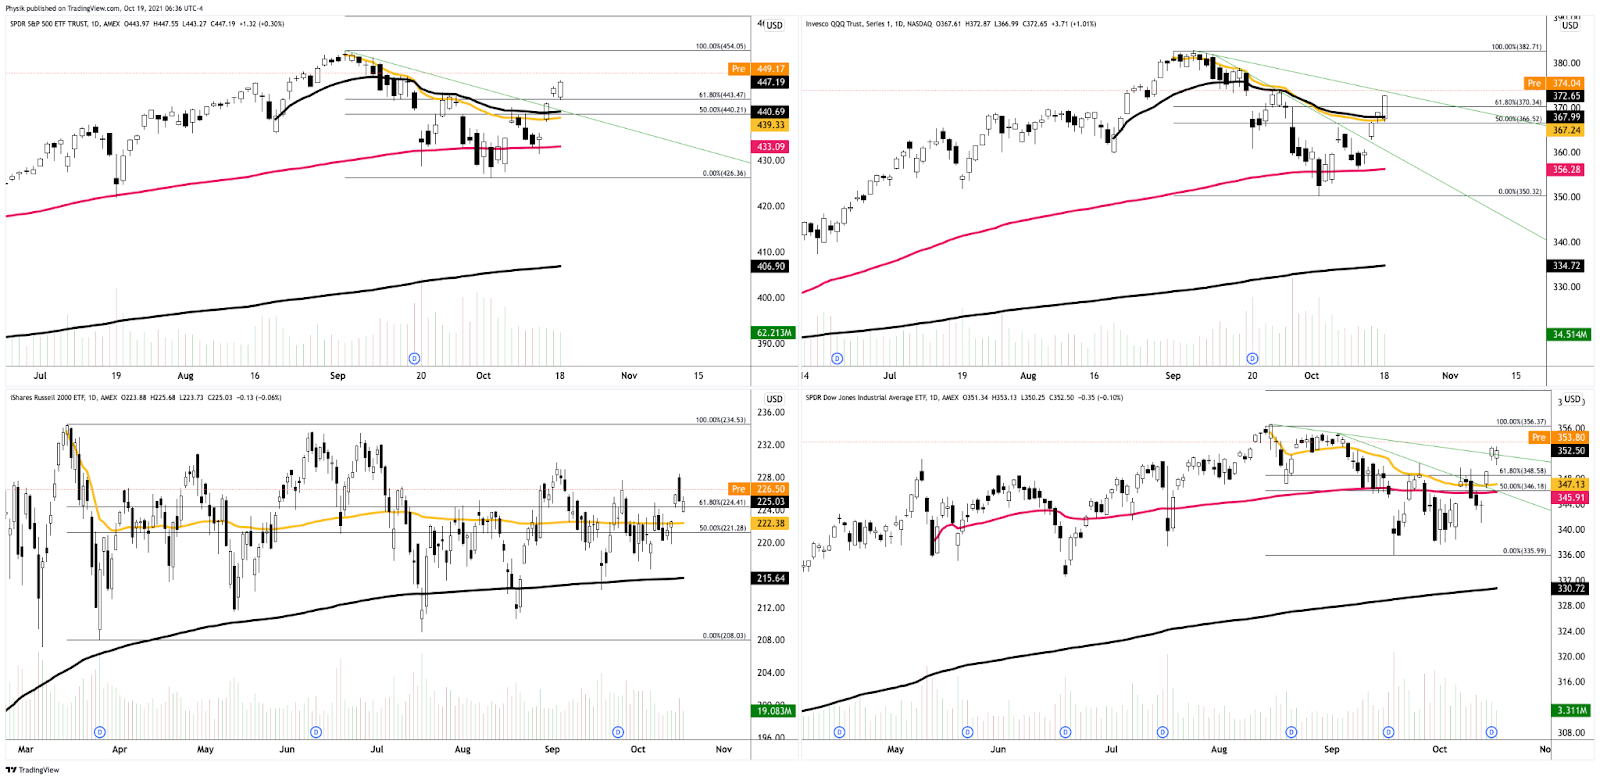
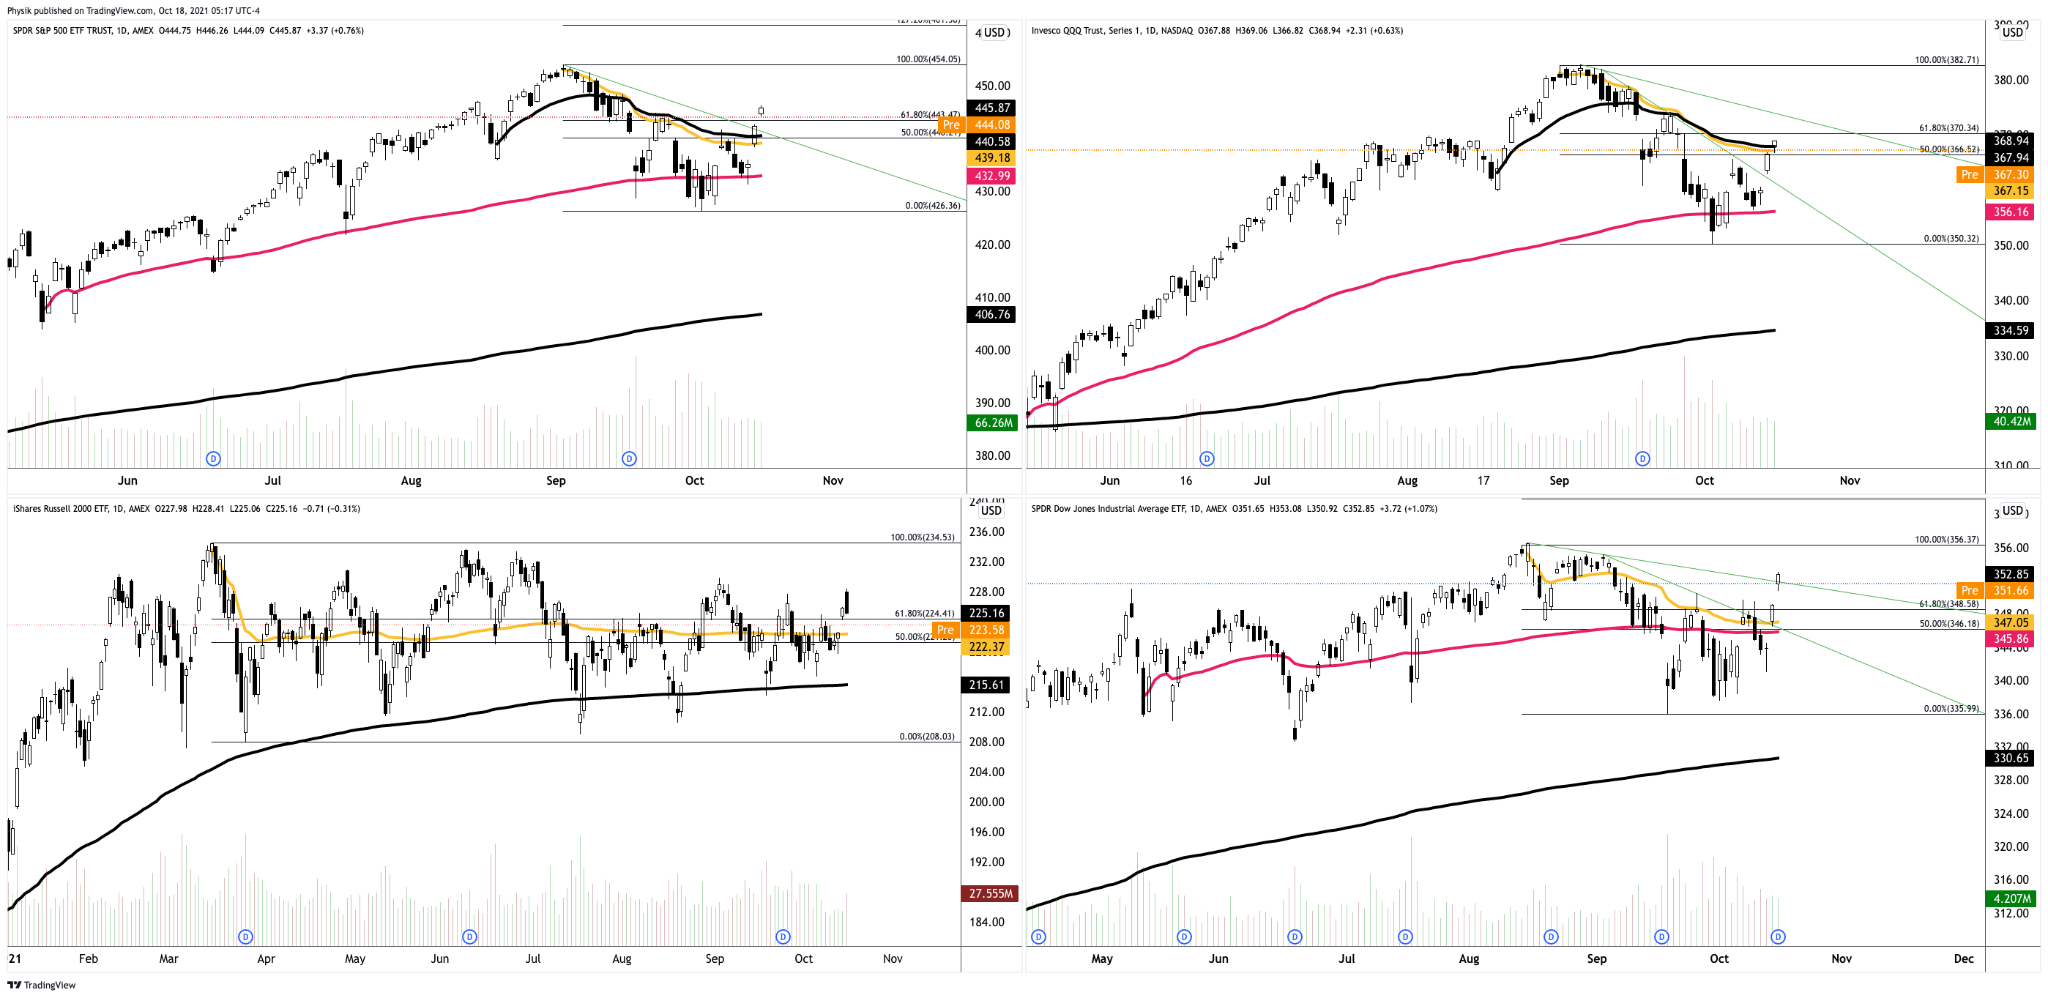
Charts To Watch
What People Are Saying
Definitions
Vanna: The rate at which the delta of an option changes with respect to volatility.
Charm: The rate at which the delta of an option changes with respect to time.
POCs: POCs are valuable as they denote areas where two-sided trade was most prevalent in a prior day session. Participants will respond to future tests of value as they offer favorable entry and exit.
MCPOCs: POCs are valuable as they denote areas where two-sided trade was most prevalent over numerous day sessions. Participants will respond to future tests of value as they offer favorable entry and exit.
About
After years of self-education, strategy development, and trial-and-error, Renato Leonard Capelj began trading full-time and founded Physik Invest to detail his methods, research, and performance in the markets.
Additionally, Capelj is a Benzinga finance and technology reporter interviewing the likes of Shark Tank’s Kevin O’Leary, JC2 Ventures’ John Chambers, and ARK Invest’s Catherine Wood, as well as a SpotGamma contributor, developing insights around impactful options market dynamics.
Disclaimer
At this time, Physik Invest does not manage outside capital and is not licensed. In no way should the materials herein be construed as advice. Derivatives carry a substantial risk of loss. All content is for informational purposes only.