Physik Invest’s Daily Brief is read free by thousands of subscribers. Join this community to learn about the fundamental and technical drivers of markets.
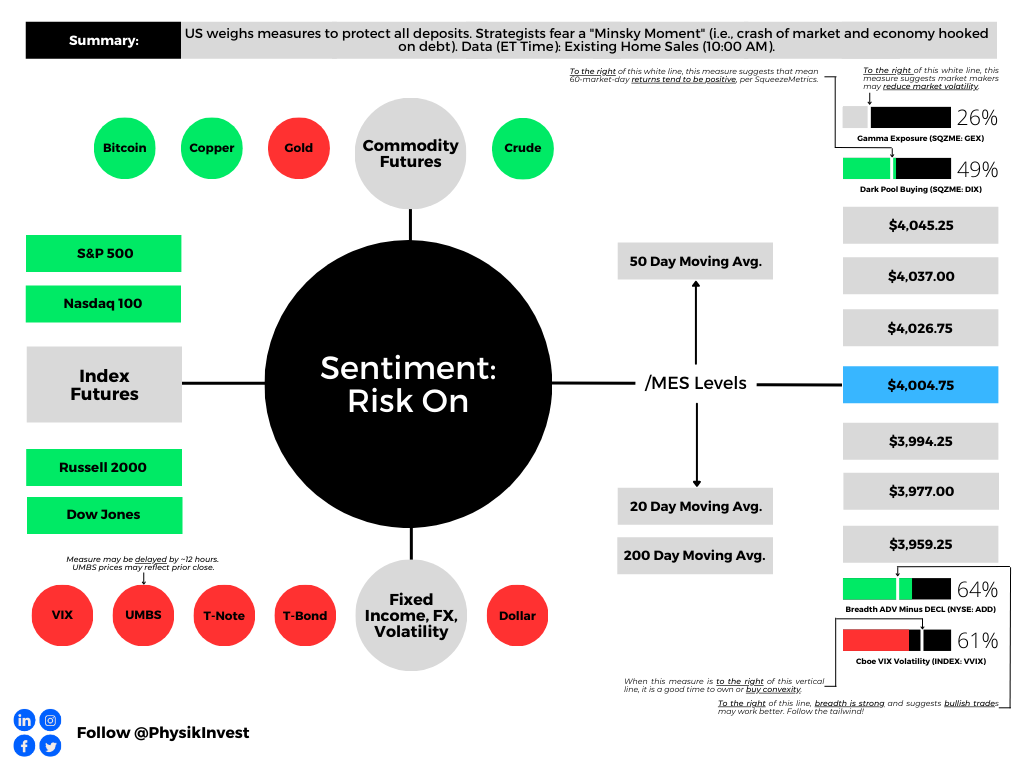
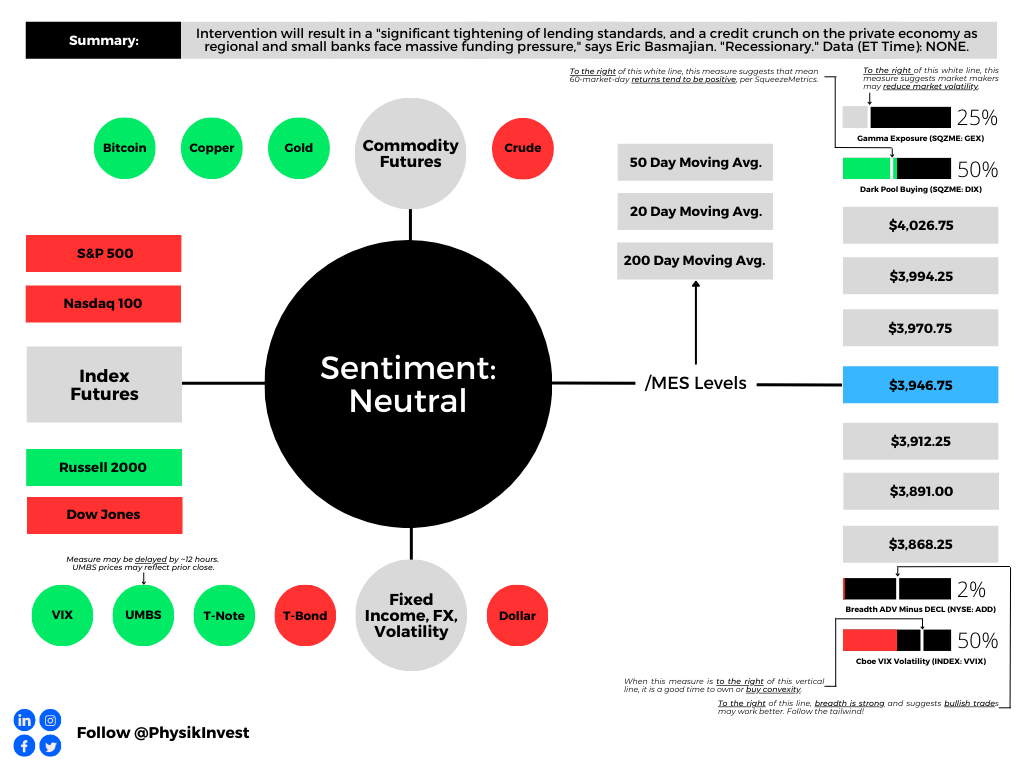
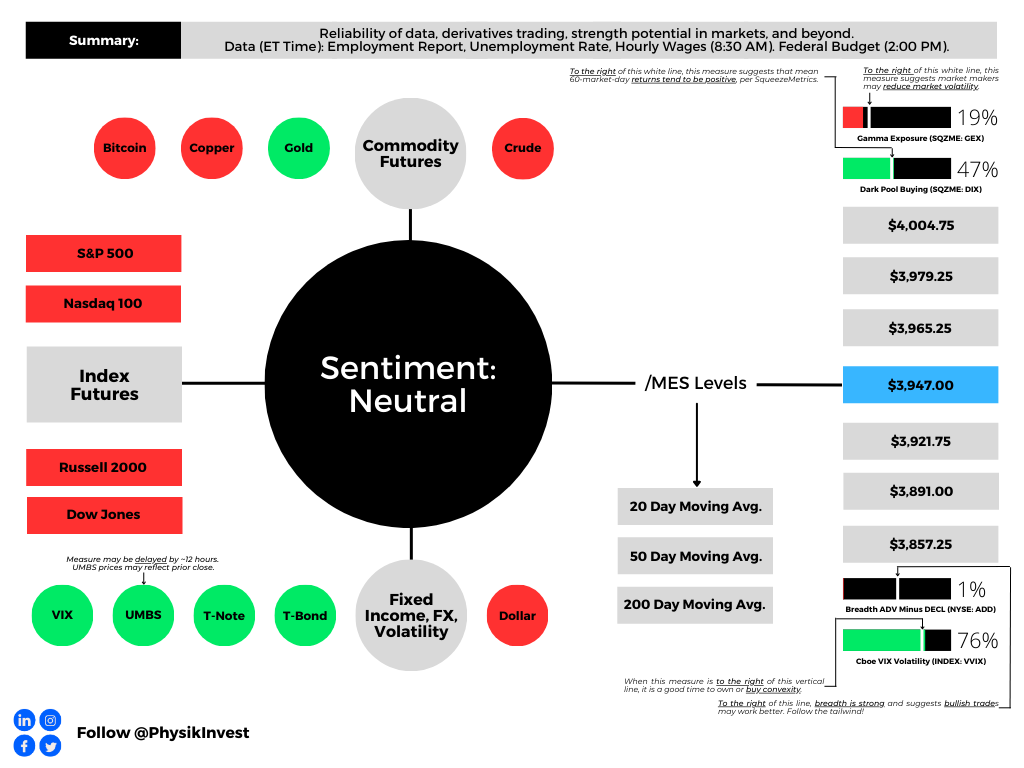
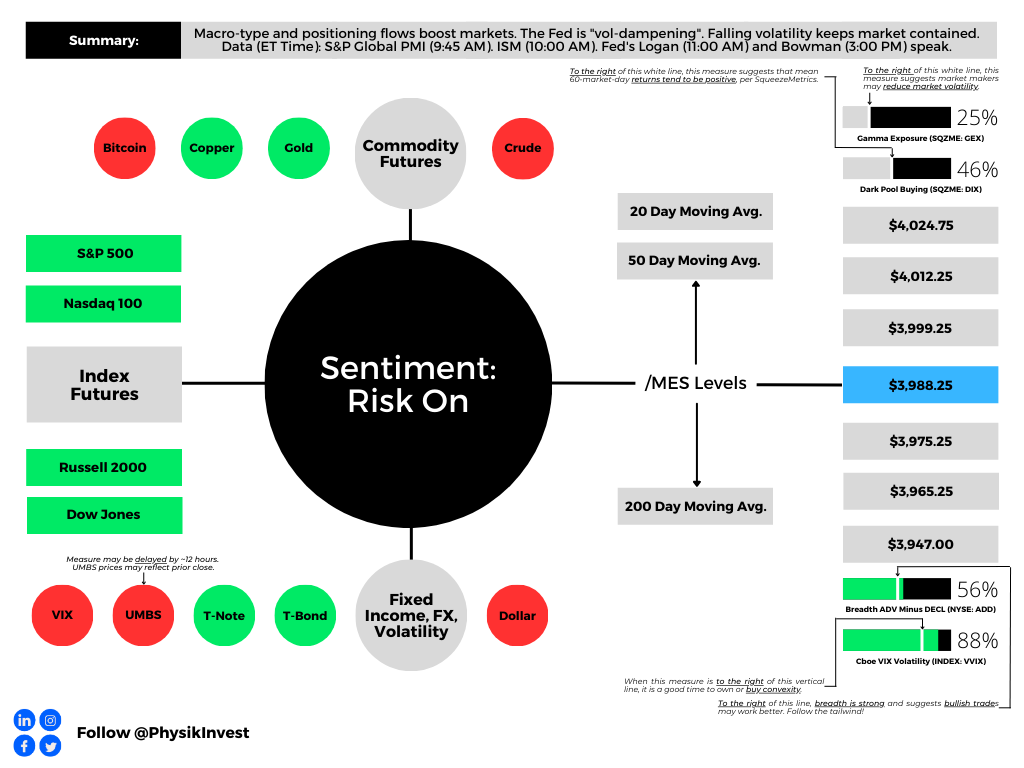
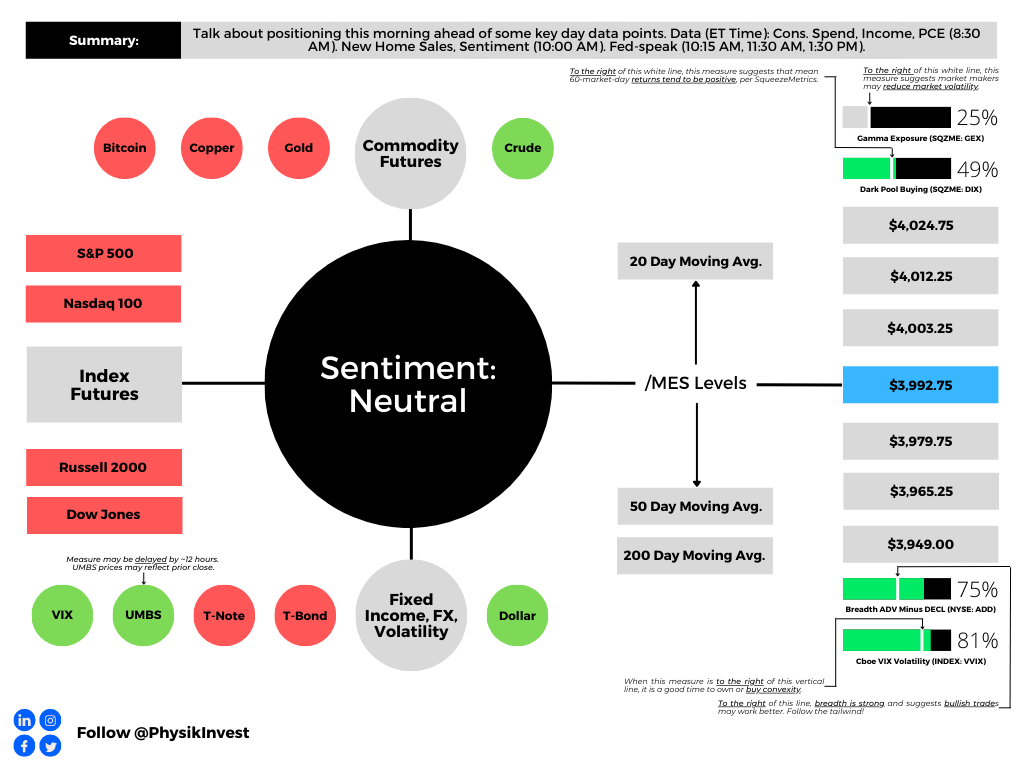
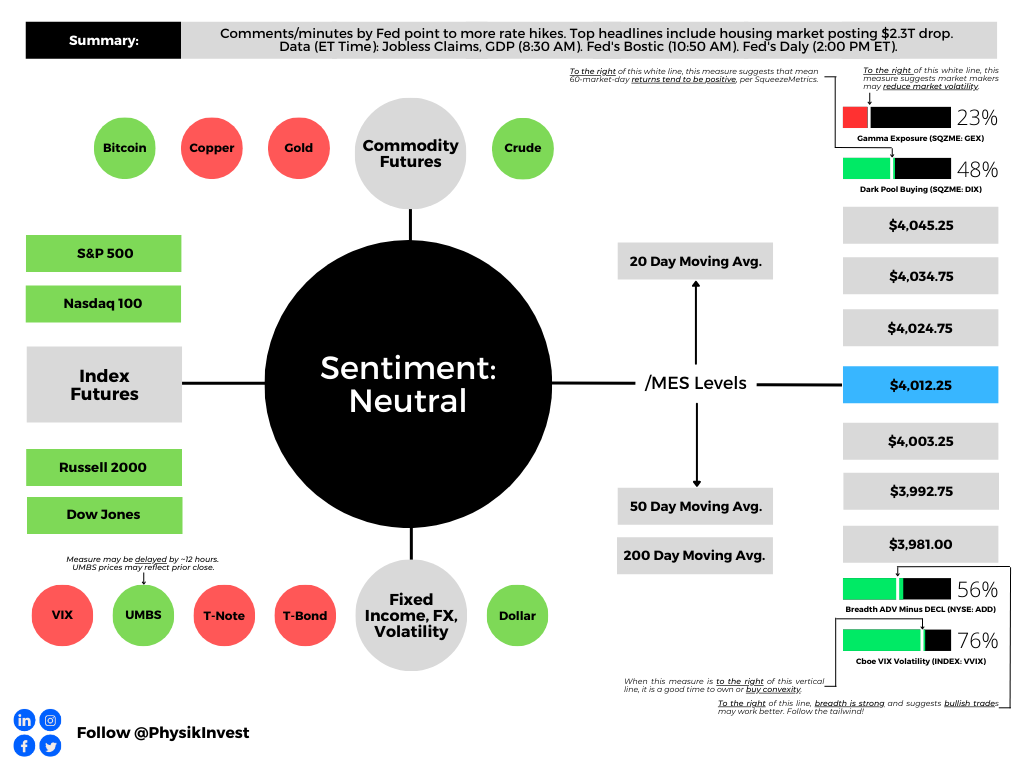
Graphic updated TIME AM ET. Sentiment Neutral if expected /MES open is inside of the prior day’s range. Sentiment Risk-On if expected /MES open is above the prior day’s range. Sentiment Risk-Off if expected /MES open is below the prior day’s range. /MES levels are derived from the profile graphic at the bottom of this letter. Click here for the latest levels. SqueezeMetrics Dark Pool Index (DIX) and Gamma (GEX) with the latter calculated based on where the prior day’s reading falls with respect to the MAX and MIN of all occurrences available. A higher DIX is bullish. The lower the GEX, the more (expected) volatility. Click to learn the implications of volatility, direction, and moneyness. Breadth reflects a reading of the prior day’s NYSE Advance/Decline indicator. The CBOE VIX Volatility Index (INDEX: VVIX) reflects the attractiveness of owning volatility. UMBS prices via MND. Click here for the economic calendar.
Administrative
A shorter letter today, so there may be some holes we patch later. Take care!
Fundamental
The Federal Reserve (Fed) bumped its target rate up 25 basis points to 4.75-5.00% and opened the door to more hikes, barring market-induced financial tightening, as this letter put forward yesterday morning.
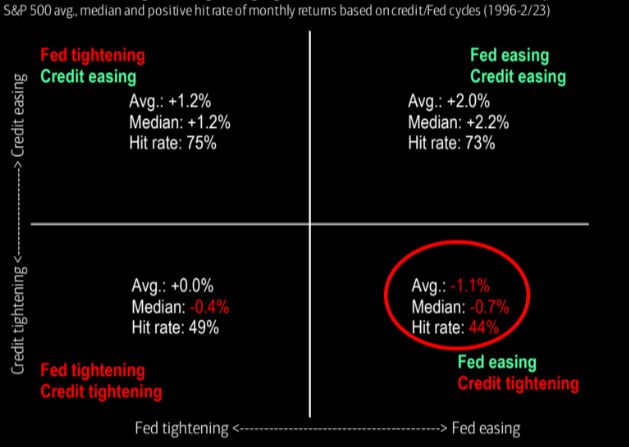
“The events in the banking system over the past two weeks are likely to result in tighter credit conditions for households and businesses, which would, in turn, affect economic outcomes,” Fed chair Jerome Powell commented, adding that credit tightening significantly means monetary policy “may have less work to do.”
Further, before the recent collapses of a few financial institutions, including SVB Financial Group, the market was pricing a 50 basis point hike.
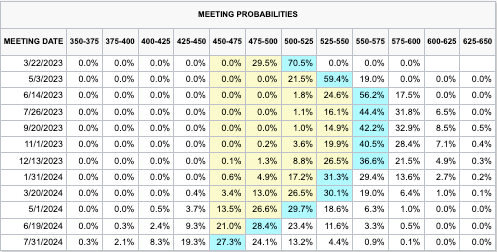
The below CME Group Inc’s (NASDAQ: CME) FedWatch Tool shows the market’s expectations on March 8. Note the 5.50-5.75% terminal (peak) rate.
Graphic: Retrieved from CME Group Inc’s (NASDAQ: CME) FedWatch Tool via The Daily Brief for March 8, 2023.
“Absent SVB, the Fed would have likely raised 50 basis points,” TS Lombard’s Steve Blitz said. “SVB did happen, however, and so this FOMC, ever anxious about facing a recession (rising unemployment), is more than happy to let ‘tighter credit conditions for households and businesses … weigh on economic activity, hiring, and inflation.’ As for financial instability, they believe they have the tools to keep a few poorly managed banks from imploding the whole sector.”
Global layoff tally has moved up to nearly 500k since beginning of October per @Bloomberg … Tech & Consumer Discretionary sectors have led; and for nearly 800 companies that have cut jobs, median layoff has left company workforce 10% smaller pic.twitter.com/d6vlsPgQwj
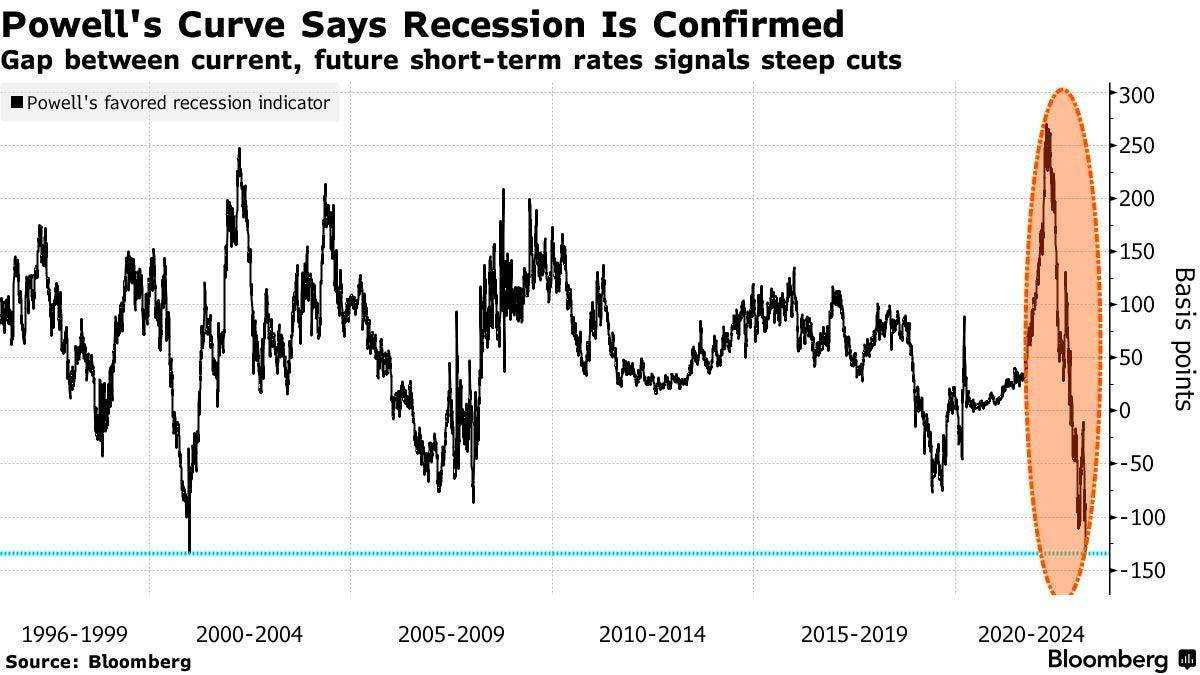
This is far higher than what the markets are pricing. Powell’s go-to measure for spotting economic troubles suggests steep cuts are also coming sooner than later.
Graphic: Retrieved from Bloomberg. “Frankly, there’s good research by staff in the Federal Reserve system that really says to look at the short — the first 18 months — of the yield curve. That’s really what has 100% of the explanatory power of the yield curve. It makes sense. Because if it’s inverted, that means the Fed’s going to cut, which means the economy is weak.” — Fed Chair Powell on March 21, 2022.
Anyways, given that what was expected happened, markets responded positively. If interested in why that is the case following important events as of late, see the Daily Brief for 2/1 and 2/2.
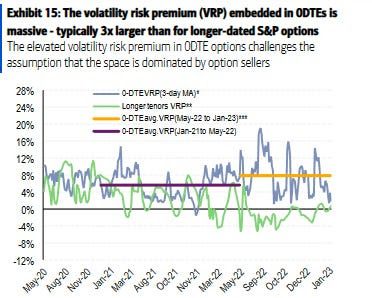
Graphic: Retrieved from Bank of America Corporation (NYSE: BAC) via Bloomberg. “Viewed through the lens of implied volatility — or expectations of how much an underlying asset will swing in the future — zero-day options aren’t particularly cheap in reality. The gap over the S&P 500’s realized volatility, something in derivatives parlance known as volatility risk premium, is typically three times higher than longer-dated contracts, according to BofA.” The compression of “will naturally lead to a buyback” that supports the market, Kai Volatility’s Cem Karsan says.
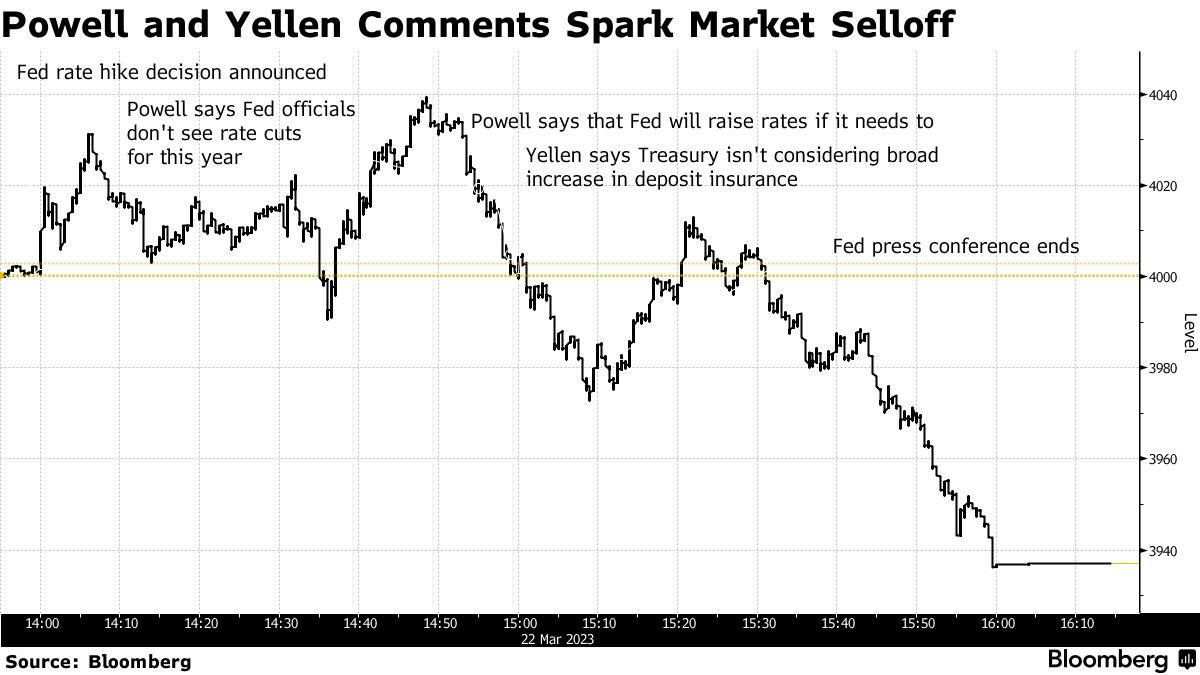
It was Treasury secretary Janet Yellen who took the market lower. Yellen said she has “not considered or discussed anything having to do with blanket insurance of guarantees of deposits,” and markets did not like that.
The likes of Pershing Square’s Bill Ackman responded he “would be surprised if deposit outflows don’t accelerate.” Adding, Federated Hermes’ Steve Chiavarone thought it was “astounding” Yellen and Powell would give contradictory messages.
“Powell essentially said that all deposits are safe; Yellen said, ‘Hold my beer.’ You would have thought that they would have coordinated,” responded Federated Hermes’ Steve Chiavarone.
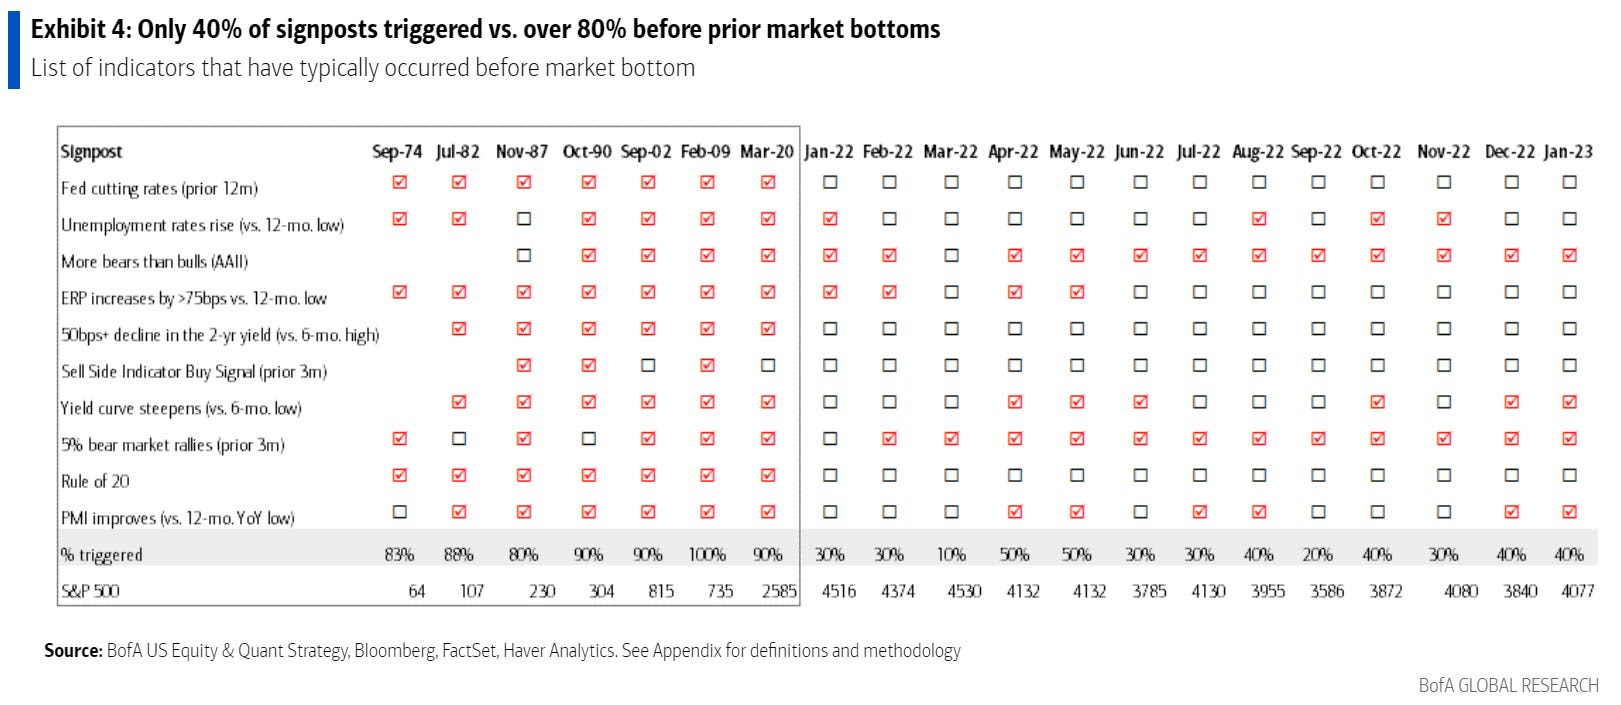
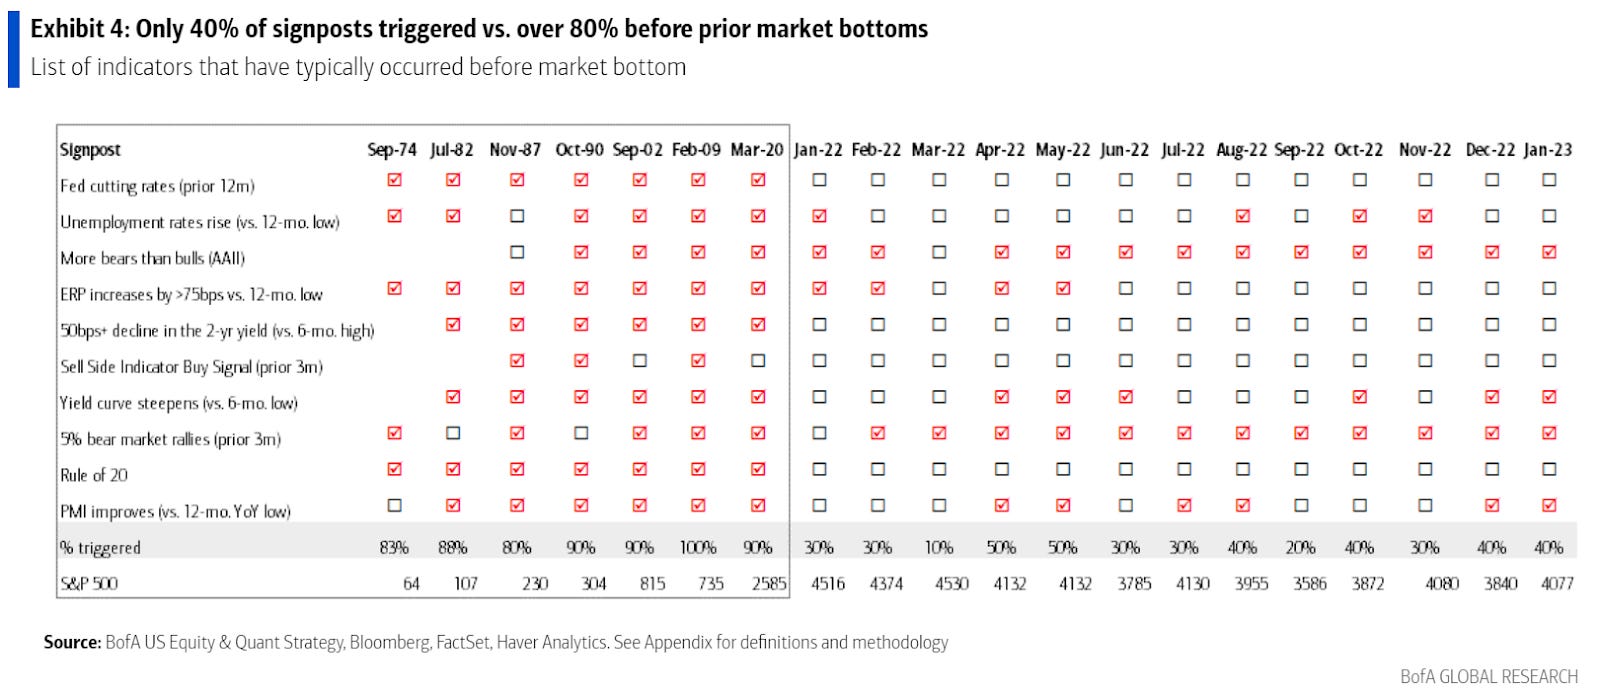
To keep it brief, we’ll end with references to letters for 3/20 and 3/21, noting that the conditions for weak equity markets are present. The S&P 500 forward earnings are declining, the yield curve is inverted, unemployment is below average, manufacturing PMIs are below 50, and 40% of banks are tightening lending, Morgan Stanley (NYSE: MS) strategists explain.
Technical
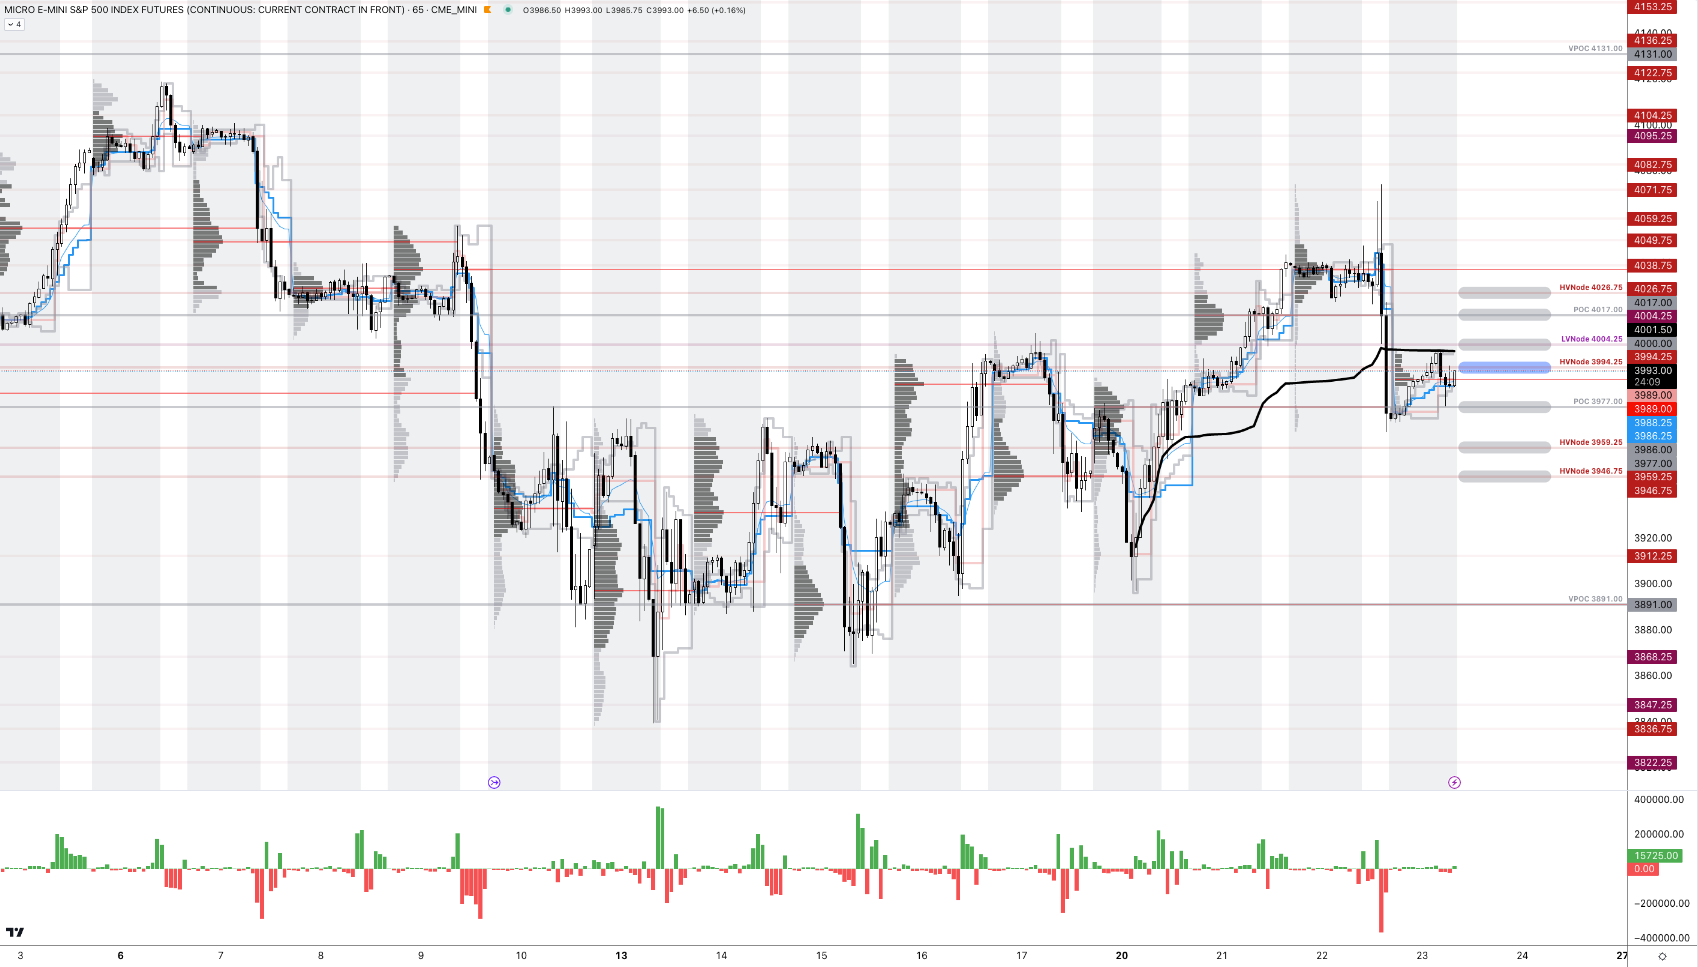
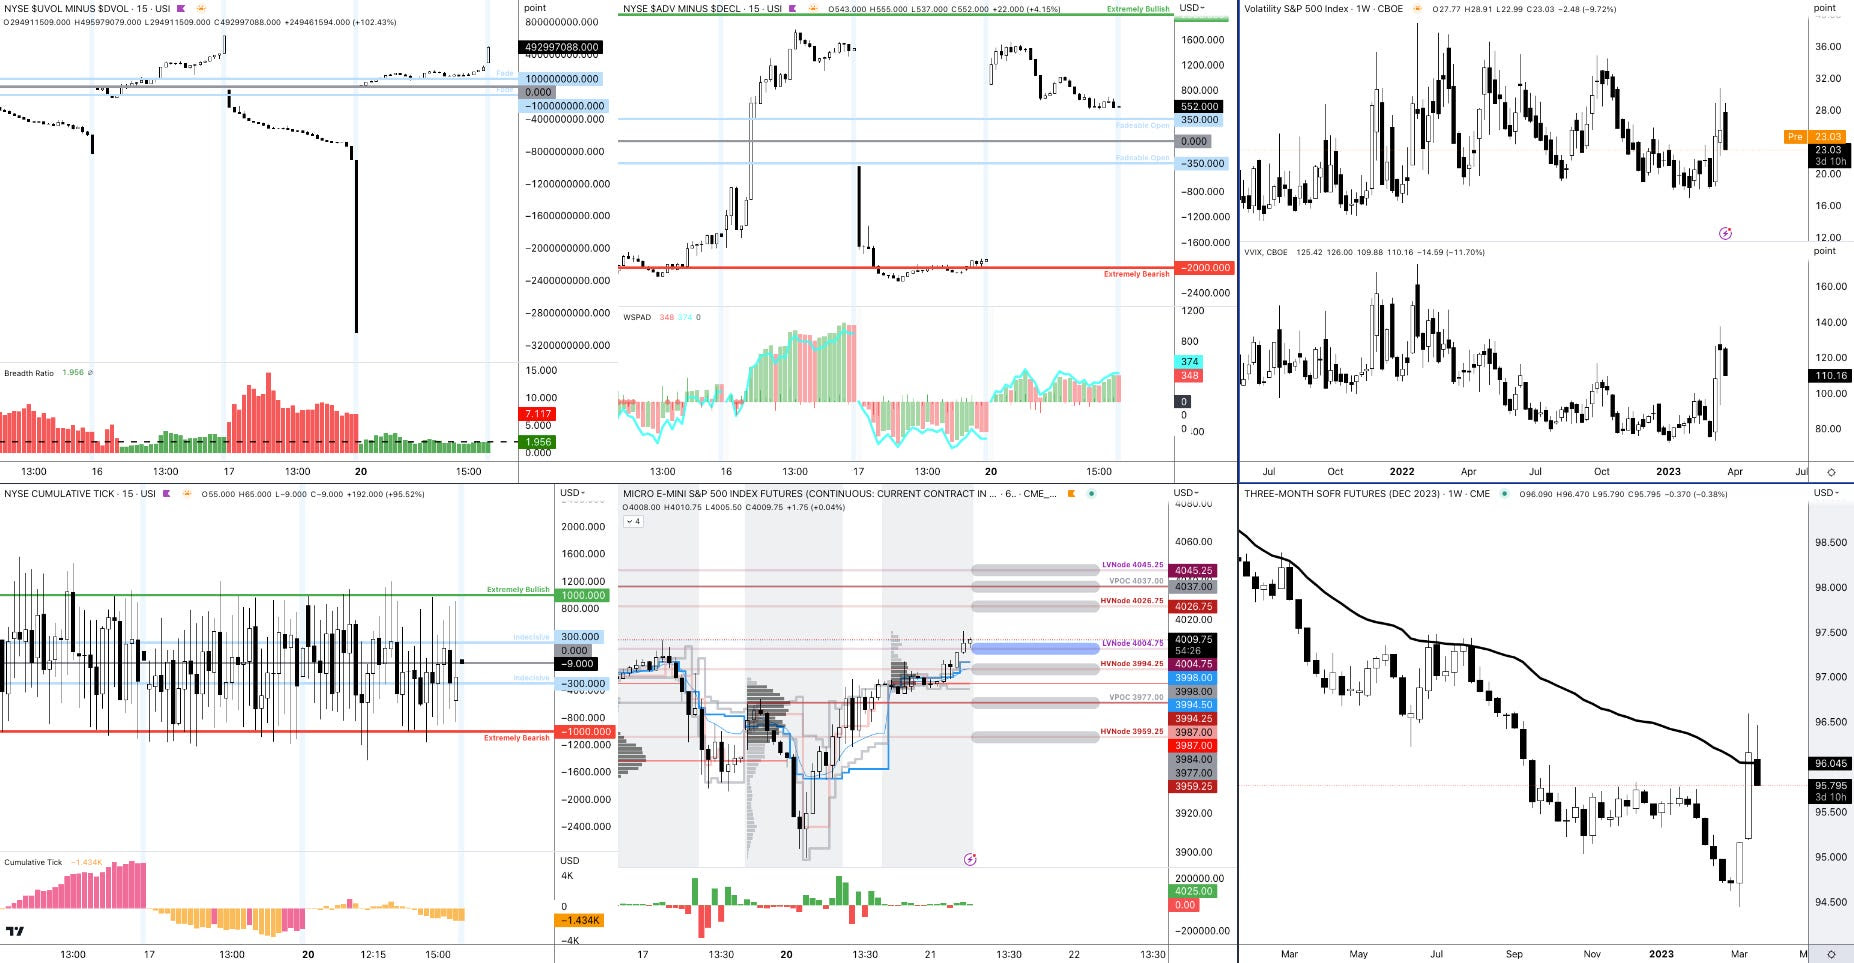
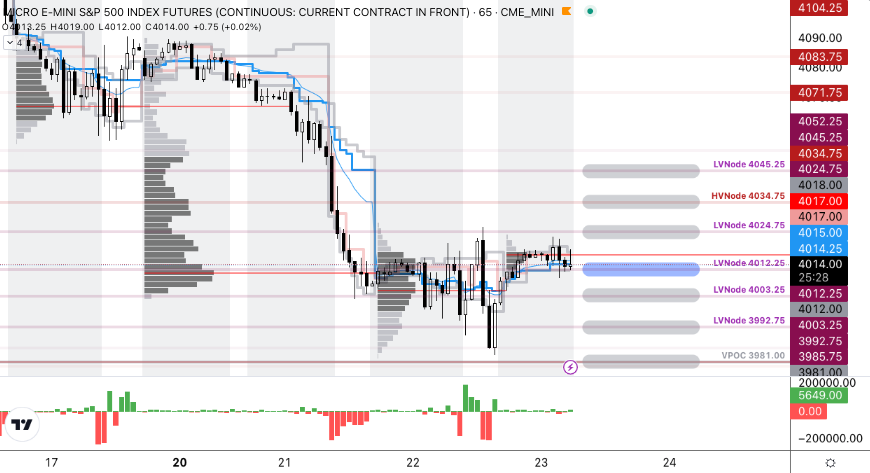
As of 8:55 AM ET, Thursday’s regular session (9:30 AM – 4:00 PM ET) in the S&P 500 will likely open in the middle part of a positively skewed overnight inventory inside the prior day’s range, suggesting a limited potential for immediate directional opportunity.
The S&P 500 pivot for today is $3,994.25.
Key levels to the upside include $4,004.25, $4,017.00, and $4,026.75.
Key levels to the downside include $3,977.00, $3,959.25, and $3,946.75.
Disclaimer: Click here to load the updated key levels via the web-based TradingView platform. New links are produced daily. Quoted levels likely hold, barring an exogenous development.
Graphic: 65-minute profile chart of the Micro E-mini S&P 500 Futures.
Definitions
Volume Areas: Markets will build on areas of high-volume (HVNodes). Should the market trend for some time, this will be identified by a low-volume area (LVNodes). The LVNodes denote directional conviction and ought to offer support on any test.
If participants auction and find acceptance in an area of a prior LVNode, then future discovery ought to be volatile and quick as participants look to the nearest HVNodes for more favorable entry or exit.
POCs: Areas where two-sided trade was most prevalent in a prior day session. Participants will respond to future value tests as they offer favorable entry and exit.
About
The author, Renato Leonard Capelj, spends the bulk of his time at Physik Invest, an entity through which he invests and publishes free daily analyses to thousands of subscribers. The analyses offer him and his subscribers a way to stay on the right side of the market.
You may view this letter’s content calendar at this link.
Disclaimer
Do not construe this newsletter as advice. All content is for informational purposes. Capelj and Physik Invest manage their own capital and will not solicit others for it.
Physik Invest’s Daily Brief is read free by thousands of subscribers. Join this community to learn about the fundamental and technical drivers of markets.
Graphic updated 7:00 AM ET. Sentiment Risk-On if expected /MES open is above the prior day’s range. /MES levels are derived from the profile graphic at the bottom of this letter. Click here for the latest levels. SqueezeMetrics Dark Pool Index (DIX) and Gamma (GEX) with the latter calculated based on where the prior day’s reading falls with respect to the MAX and MIN of all occurrences available. A higher DIX is bullish. The lower the GEX, the more (expected) volatility. Click to learn the implications of volatility, direction, and moneyness. Breadth reflects a reading of the prior day’s NYSE Advance/Decline indicator. The CBOE VIX Volatility Index (INDEX: VVIX) reflects the attractiveness of owning volatility. UMBS prices via MND. Click here for the economic calendar.
Administrative
Not all doom and gloom. Make sure to read to the end!
Fundamental
In the Daily Brief for 3/20, we summarized the financial industry and policymaker responses that would turn asset fire sales into managed, orderly asset sales.
The net result of the intervention would be a reduction in credit creation, a tightening of financial conditions, as well as a slowing of the economy and inflation while, potentially, setting “a dangerous precedent that simply encourage[s] future irresponsible behavior” (e.g., risky lending/borrowing), the House Freedom Caucus put eloquently. Basically, the fear is in policymakers underwriting the losses of prevailing carry-type strategies and setting the stage for an even bigger unwind or so-called “Minsky moment,” the “sudden crash of markets and economies that are hooked on debt,” Bloomberg reports.
"Regional banks relied on a business model that relied on uninsured deposits," says @Lazard's @porszag. "The government needs to make explicit what a lot of people are assuming: that for the foreseeable future, uninsured deposits don't exist. Everything is insured." pic.twitter.com/GgZ9ZF2f7r
A systemic credit event is among strategists’ biggest fear, indeed. A Bank of America Corporation (NYSE: BAC) survey shows a credit event happening on the heels of a US shadow banking, corporate debt, and developed-market real-estate collapse. Recall this letter writer’s conversation with Simplify Asset Management’s Michael Green who said he sees “cracks in bubbles like commercial real estate” already appearing, too.
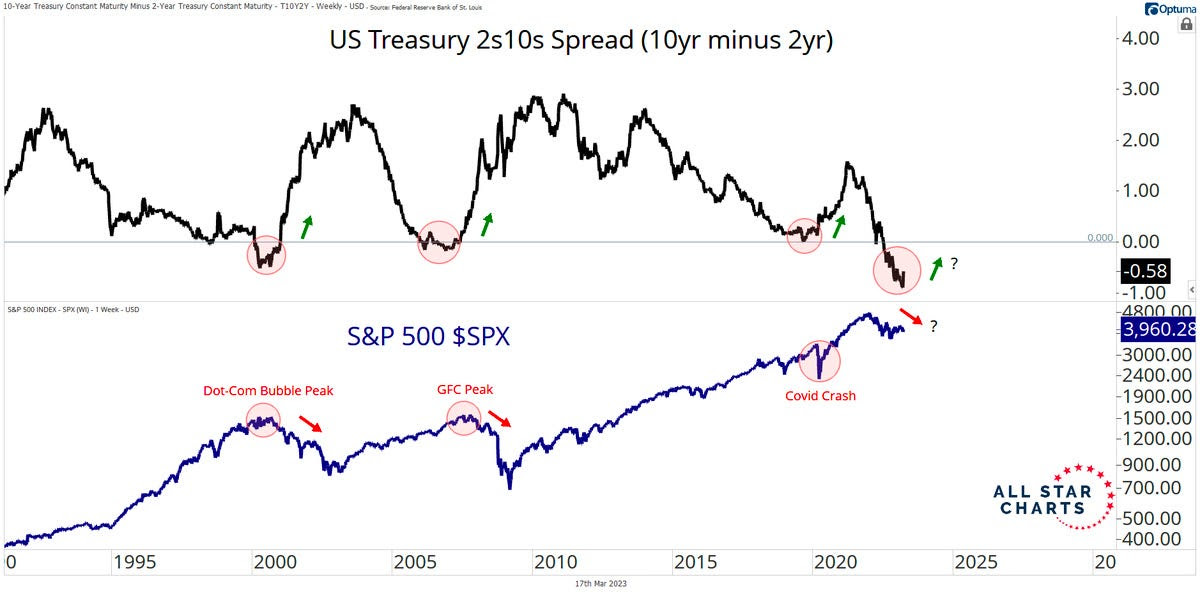
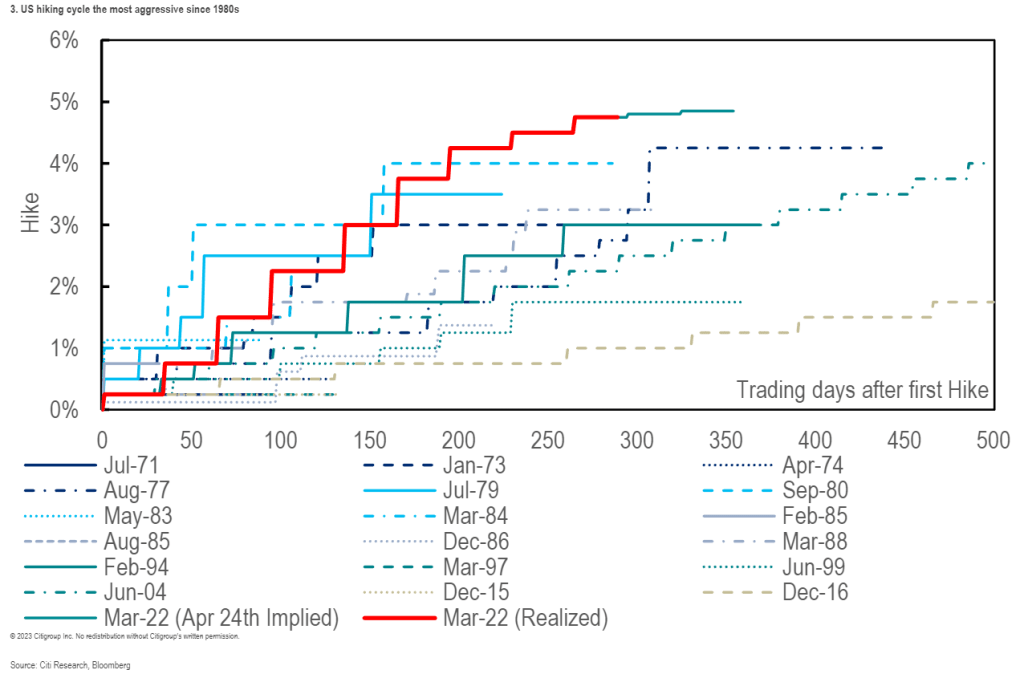
Bloomberg adds that JPMorgan Chase & Co (NYSE: JPM) strategists think the inverted yield curve signals recession and the stocks are likely nearing their high point.
Graphic: Retrieved from Callum Thomas’ Weekly S&P 500 ChartStorm.
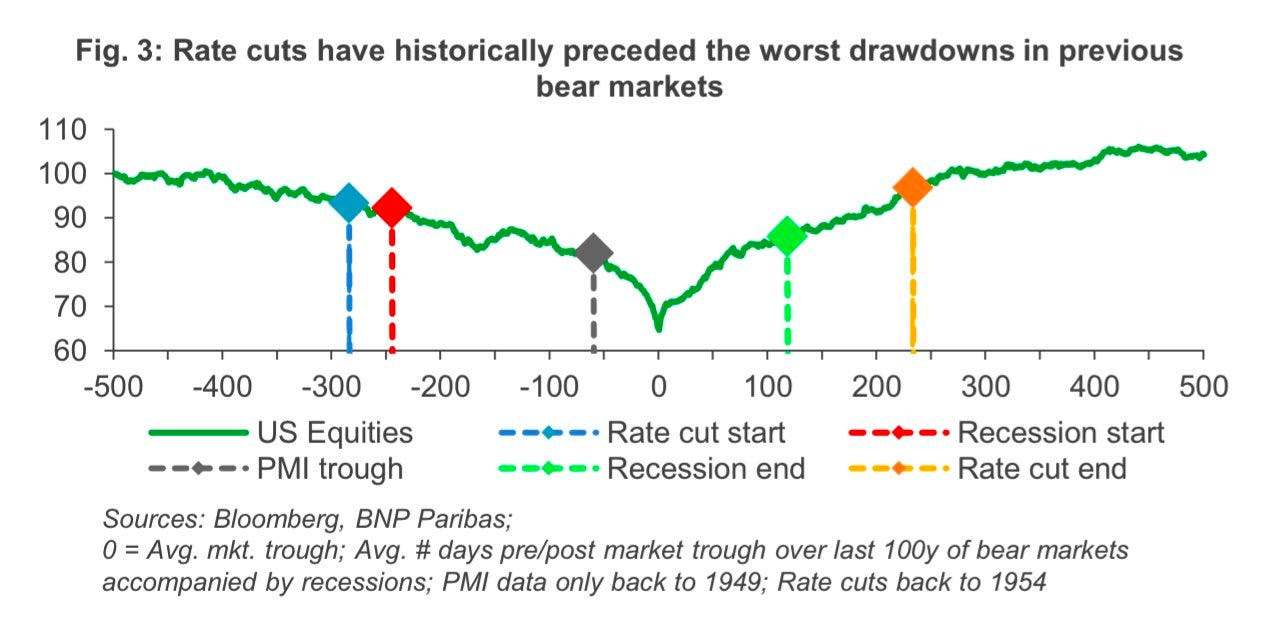
JPM adds that market lows won’t occur until interest rate cuts ensue.
Graphic: Retrieved from BNP Paribas ADR (OTC: BNPQY).
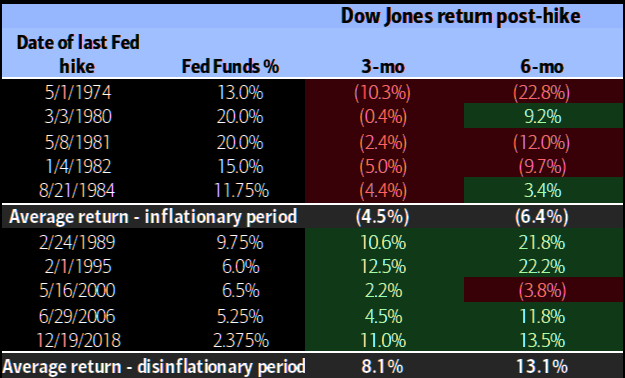
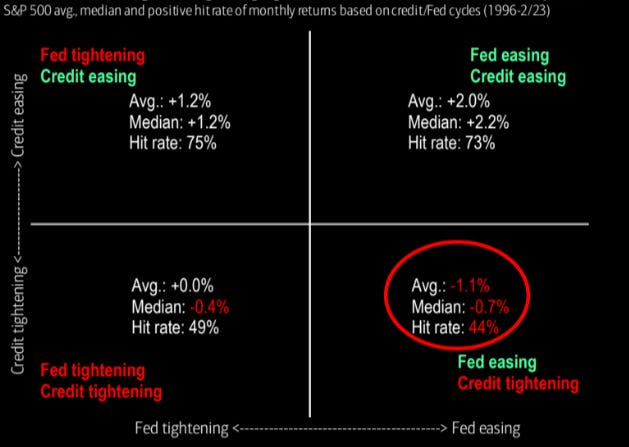
Recall 3/20’s letter citing BAC research that finds selling markets on the last Fed rate hike is a good strategy. The “Minsky moment” comment/fear has others at JPM adding that investors should sell into relief bounces.
Graphic: Retrieved from Bank of American Corporation (NYSE: BAC) via The Market Ear.
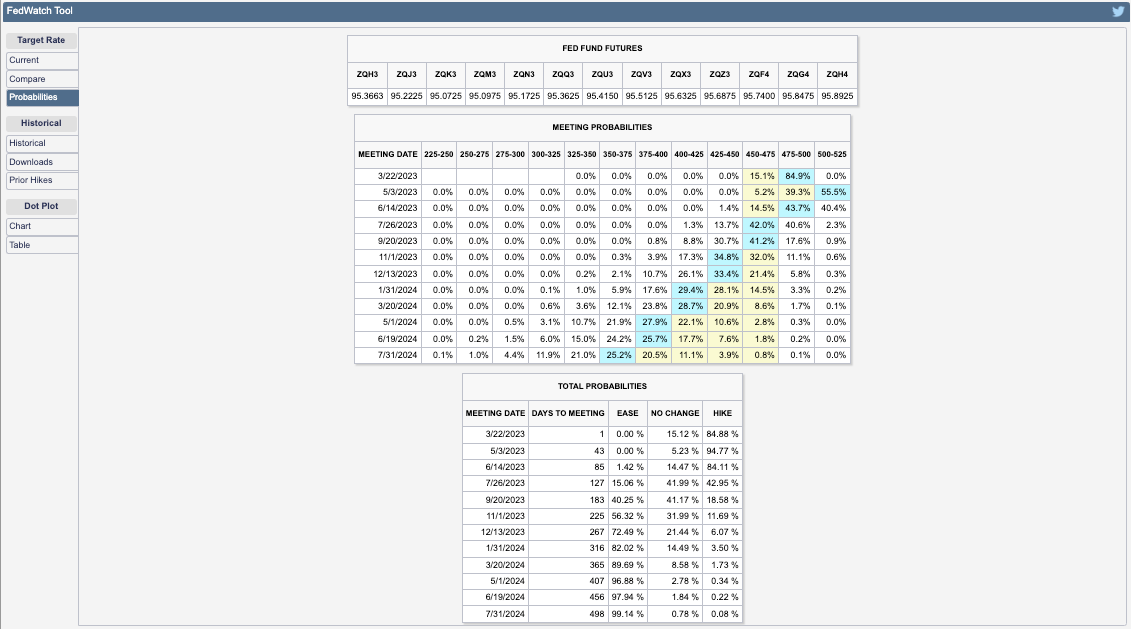
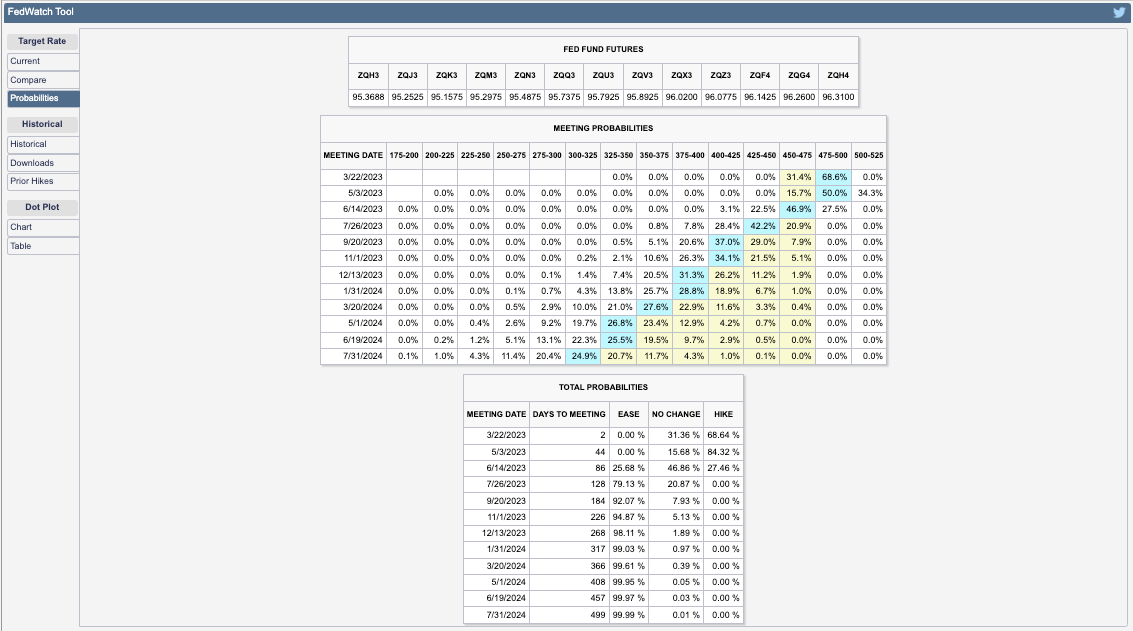
Most participants foresee rates continuing to rise by at least 25 basis points, per the CME Group Inc’s (NASDAQ: CME) FedWatch Tool. Following Wednesday’s (expected) hike, the path forward appears uncertain. Yesterday, the terminal/peak rate was at 4.75-5.00%. Today, the peak has shifted higher to 5.00-5.25%.
Graphic: Retrieved from CME Group Inc (NASDAQ: CME).
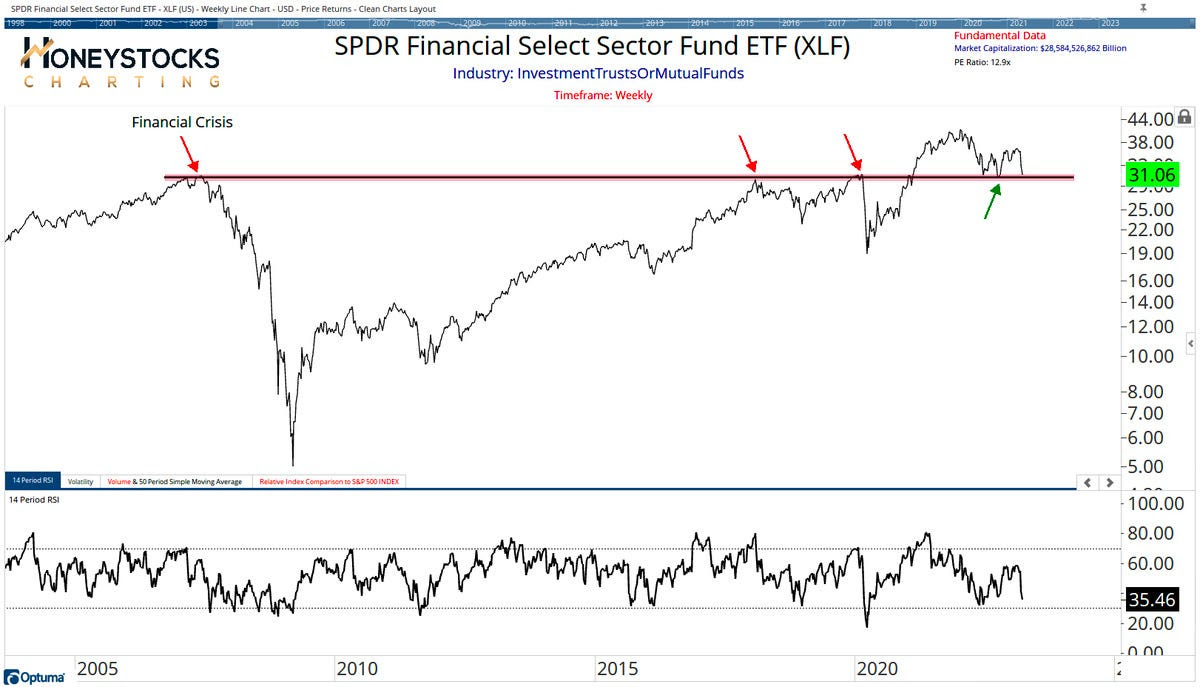
Financials look ready to fall off a cliff, to add. If they do, the whole market likely goes.
Graphic: Retrieved from Callum Thomas’ Weekly S&P 500 ChartStorm.
Positioning
We keep referring back to our Daily Briefs published last week (e.g., 3/13 and 3/14). In those letters, we talked about the growing concern about markets enduring some exogenous shocks.
We opted to take the less extreme side since policymakers’ response was likely to stem (or push into the future) turmoil. Additionally, with participants easing up on their long-equity exposure, equity markets were likely to stay contained, relative to bond markets where the lack of liquidity is an issue, some believe. Anyways, following important events including inflation updates (i.e., CPI) and derivatives expiries, short bursts of strength (particularly in some of the previously depressed products such as the Nasdaq 100 or NDX, as explained 3/17) were likely to ensue heading into the end of this month and next month. Additionally, certain rates trades via options we set forth on 3/14 were ripe for monetization, too.
Rotating into a money market or T-bill fund or box spreads, while allocating some remaining cash to leverage potential by way of some call options structures, appeared attractive. While the T-bill or box spread exposures did not budge much, call options structures as proposed on 3/14 worked (and are likely to continue to work) rather well. The monetization of the rate structures discussed on 3/14 was timely, also.
The potential for coming events including the Federal Reserve’s (Fed) interest rate decision on Wednesday 3/22 to assuage participants’ fears of slowing may, accordingly, prompt fears of missing out on the upside, Bloomberg reports. A response may be FOMO-type demand for call options exposures, coupled with CTAs further “raising their equity exposure” on trend signals and lower volatility, boosting markets into a “more combustible” state as explained on 2/17. This fear of missing out is visible in options volatility skew; traders are hedging those tail outcomes.
Technical
As of 7:00 AM ET, Tuesday’s regular session (9:30 AM – 4:00 PM ET), in the S&P 500, is likely to open in the upper part of a positively skewed overnight inventory, outside of the prior day’s range, suggesting a potential for immediate directional opportunity.
The S&P 500 pivot for today is $4,004.75.
Key levels to the upside include $4,026.75, $4,037.00, and $4,045.25.
Key levels to the downside include $3,994.25, $3,977.00, and $3,959.25.
Disclaimer: Click here to load the updated key levels via the web-based TradingView platform. New links are produced daily. Quoted levels likely hold barring an exogenous development.
Graphic: 65-minute profile chart of the Micro E-mini S&P 500 Futures.
Definitions
Volume Areas: Markets will build on areas of high-volume (HVNodes). Should the market trend for a period of time, this will be identified by a low-volume area (LVNodes). The LVNodes denote directional conviction and ought to offer support on any test.
If participants auction and find acceptance in an area of a prior LVNode, then future discovery ought to be volatile and quick as participants look to the nearest HVNodes for more favorable entry or exit.
POCs: Areas where two-sided trade was most prevalent in a prior day session. Participants will respond to future tests of value as they offer favorable entry and exit.
Options Expiration (OPEX): Reduction in dealer Gamma exposure. There may be an increase in volatility after the removal of large options positions and associated hedging.
Volume-Weighted Average Prices (VWAPs): A metric highly regarded by chief investment officers, among other participants, for quality of trade. Additionally, liquidity algorithms are benchmarked and programmed to buy and sell around VWAPs.
About
The author, Renato Leonard Capelj, spends the bulk of his time at Physik Invest, an entity through which he invests and publishes free daily analyses to thousands of subscribers. The analyses offer him and his subscribers a way to stay on the right side of the market.
You may view this letter’s content calendar at this link.
Disclaimer
Do not construe this newsletter as advice. All content is for informational purposes. Capelj and Physik Invest manage their own capital and will not solicit others for it.
Physik Invest’s Daily Brief is read free by thousands of subscribers. Join this community to learn about the fundamental and technical drivers of markets.
Graphic updated 8:10 AM ET. Sentiment Neutral if expected /MES open is inside of the prior day’s range. /MES levels are derived from the profile graphic at the bottom of this letter. Click here for the latest levels. SqueezeMetrics Dark Pool Index (DIX) and Gamma (GEX) with the latter calculated based on where the prior day’s reading falls with respect to the MAX and MIN of all occurrences available. A higher DIX is bullish. The lower the GEX, the more (expected) volatility. Click to learn the implications of volatility, direction, and moneyness. Breadth reflects a reading of the prior day’s NYSE Advance/Decline indicator. The CBOE VIX Volatility Index (INDEX: VVIX) reflects the attractiveness of owning volatility. UMBS prices via MND. Click here for the economic calendar.
Fundamental
As well summarized by Eric Basmajian, inflation, and growth are on a downward trajectory. Most leading indicators “suggest recessionary pressure will be ongoing.” The banking crisis and response, which will ultimately “cause a tightening of lending to the private economy,” likely exacerbates the ongoing recessionary pressures.
Most strategists including the Damped Spring’s Andy Constan agree. In a recent video, Constan detailed the implications of policymakers’ intervention. In short, an asset fire sale was turned into a managed sale, and a reduction in credit creation will tighten financial conditions, slowing the economy and inflation.
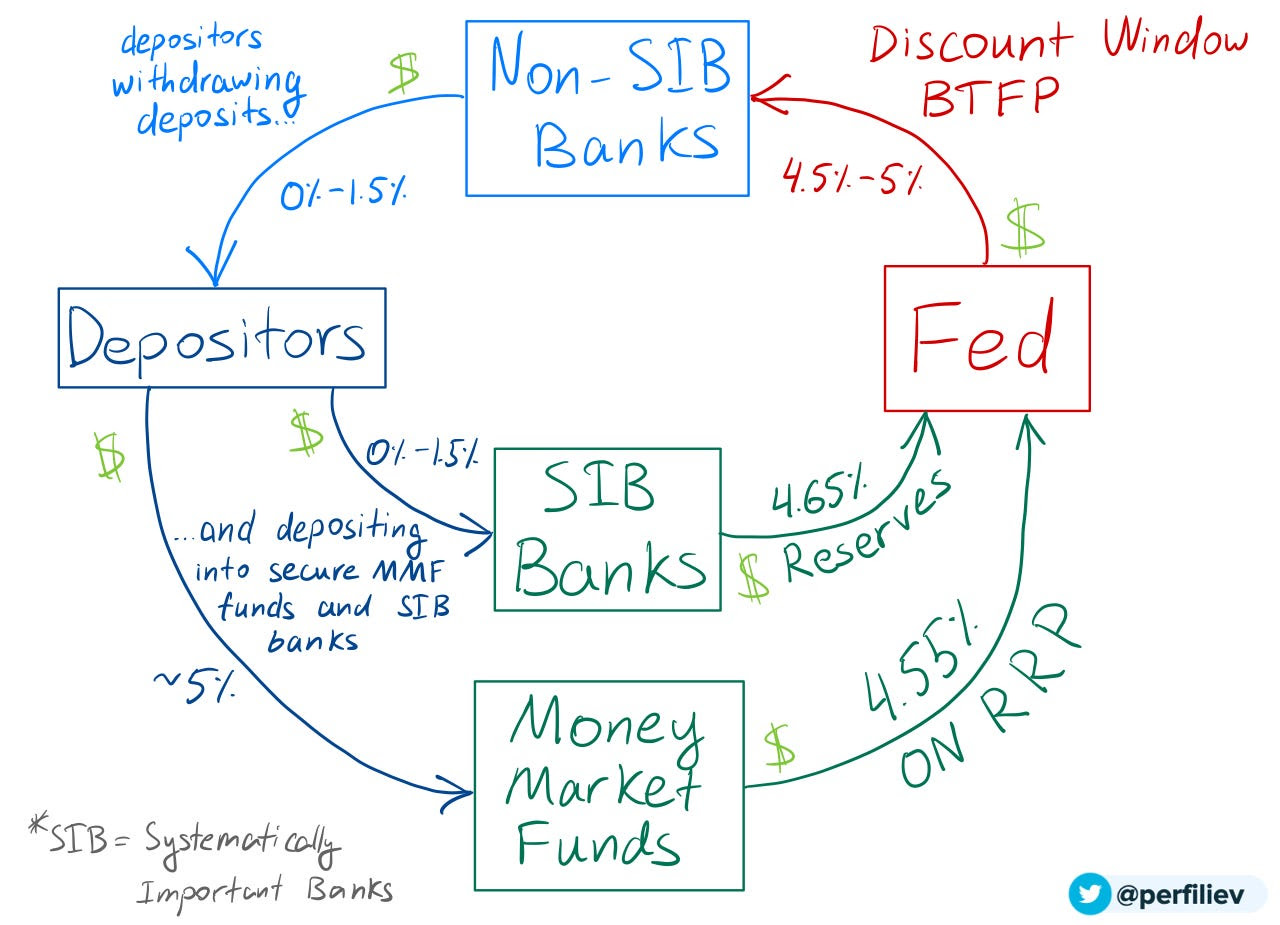
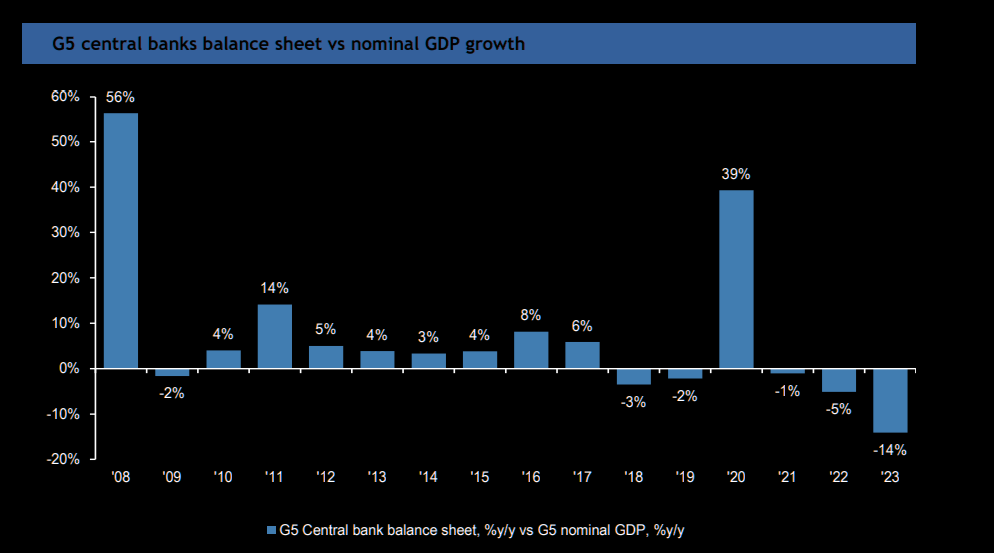
“Small banks that are facing deposit outflows will see earnings and margins collapse as their cost of funds surges from 1% or 2% on deposits to 4% or 5% at the Fed funding facility,” Basmajian summarizes, noting that the increase in the Federal Reserve (Fed) balance sheet came from the discount window, new bank funding facilities, and spillover from the FDIC insurance backstop, all of which are not to be confused with quantitative easing or QE (i.e., monetary stimulus and a flow of capital into capital markets).
Graphic: Retrieved from Bank of American Corporation (NYSE: BAC) via The Market Ear.
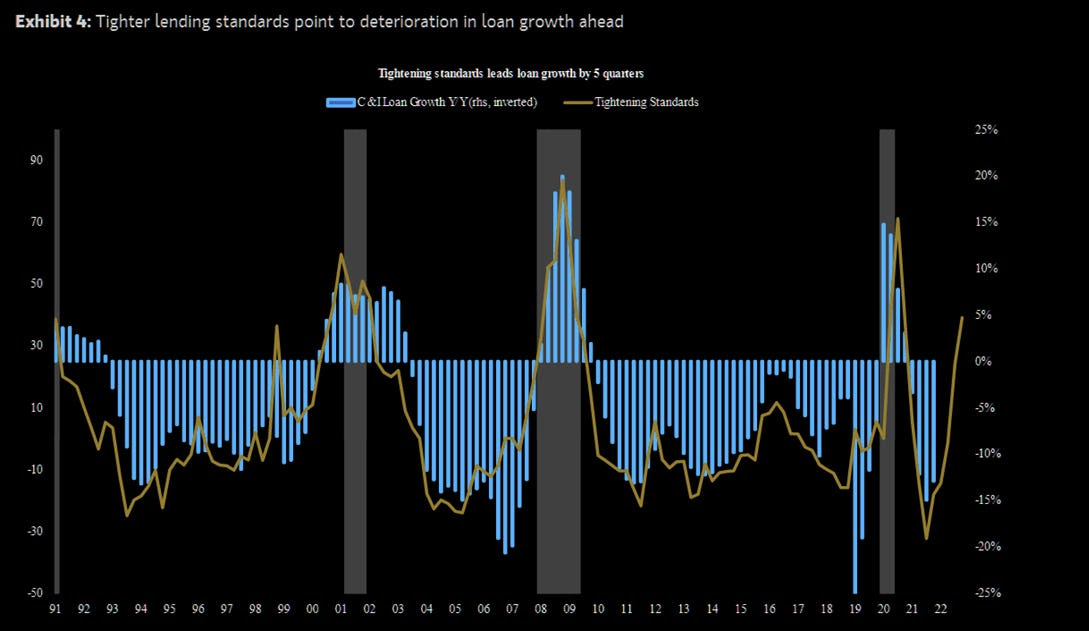
“As deposits leave regional and smaller banks for more yield and safety, they will flow into bigger banks that do less lending or into money market funds that don’t drive credit creation.” Consequently, there will be “a significant tightening of lending standards, and a credit crunch on the private economy as regional and smaller banks face massive funding pressure.”
Graphic: Retrieved from Morgan Stanley (NYSE: MS) via The Market Ear. “MS models show that a permanent +10pt tightening in lending standards for C&I loans leads to a 35bps rise in the unemployment rate over the next two years. Historically, recessions have arrived more than half a year after jobless claims begin a sustained rise.”
Traders are conflicted about the Fed’s coming interest rate decision. Many were expecting a couple more hikes of at least 25 basis points in size. However, following the recent bank turmoil in the US and abroad, it appears that traders think it will be one additional 25 basis point hike before rate cuts ensue in mid-2023.
Graphic: Retrieved from CME Group Inc’s (NASDAQ: CME) FedWatch Tool.
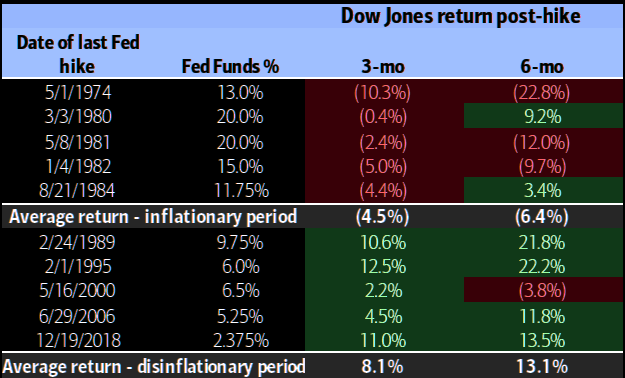
Historically, selling markets on the last Fed rate hike is a good strategy, Bank of America found.
Graphic: Retrieved from Bank of American Corporation (NYSE: BAC) via The Market Ear.
Positioning
Top-line measures of implied volatility or IVOL including the Cboe Volatility Index or VIX are higher heading into Monday’s trade.
Macro uncertainties have some frightened, hence “equity volatility present[ing] itself in a much stronger way,” said The Ambrus Group’s Kris Sidial. For this equity volatility (i.e., implied volatility or IVOL) to continue performing well, realized volatility or RVOL (i.e., the movement that actually happens and is not implied by traders’ supply and demand of options) must shift and stay higher as well (note: in many ways RVOL and IVOL reinforce the other during extreme greed or fear events.
Though big options expiries (OpEx) “may help unpin the market” and manifest market downside and follow-through in RVOL needed to keep IVOL performing, the window for this to happen may be closing.
The monetization of profitable options structures, as well as volatility compression and options decay, may result in counterparties buying back their short stock and/or futures hedges (to the short put positions they have on), thus boosting the market (particularly the depressed and rate-sensitive Nasdaq 100).
If the market rallies, that has the potential to “make things hotter” in the economy, explained Kai Volatility’s Cem Karsan, which emboldens policymakers to make and keep policy tighter. So, barring follow-through to the downside, any equity market upside that arises is likely limited, as a disclaimer, some think.
Apologies for rushing this section, today. More on positioning in the coming letters.
Technical
As of 8:10 AM ET, Monday’s regular session (9:30 AM – 4:00 PM ET), in the S&P 500, is likely to open in the middle part of a negatively skewed overnight inventory, inside of the prior day’s range, suggesting a limited potential for immediate directional opportunity.
The S&P 500 pivot for today is $3,946.75.
Key levels to the upside include $3,970.75, $3,994.25, and $4,026.75.
Key levels to the downside include $3,912.25, $3,891.00, and $3,868.25.
Disclaimer: Click here to load the updated key levels via the web-based TradingView platform. New links are produced daily. Quoted levels likely hold barring an exogenous development.
Graphic: 65-minute profile chart of the Micro E-mini S&P 500 (FUTURE: /MES) bottom-middle.
Definitions
Volume Areas: Markets will build on areas of high-volume (HVNodes). Should the market trend for a period of time, this will be identified by a low-volume area (LVNodes). The LVNodes denote directional conviction and ought to offer support on any test.
If participants auction and find acceptance in an area of a prior LVNode, then future discovery ought to be volatile and quick as participants look to the nearest HVNodes for more favorable entry or exit.
POCs: Areas where two-sided trade was most prevalent in a prior day session. Participants will respond to future tests of value as they offer favorable entry and exit.
About
The author, Renato Leonard Capelj, spends the bulk of his time at Physik Invest, an entity through which he invests and publishes free daily analyses to thousands of subscribers. The analyses offer him and his subscribers a way to stay on the right side of the market.
You may view this letter’s content calendar at this link.
Disclaimer
Do not construe this newsletter as advice. All content is for informational purposes. Capelj and Physik Invest manage their own capital and will not solicit others for it.
Physik Invest’s Daily Brief is read free by thousands of subscribers. Join this community to learn about the fundamental and technical drivers of markets.
Graphic updated 7:15 AM ET. Sentiment Risk-Off if expected /MES open is below the prior day’s range. /MES levels are derived from the profile graphic at the bottom of this letter. Click here for the latest levels. SqueezeMetrics Dark Pool Index (DIX) and Gamma (GEX) with the latter calculated based on where the prior day’s reading falls with respect to the MAX and MIN of all occurrences available. A higher DIX is bullish. The lower the GEX, the more (expected) volatility. Click to learn the implications of volatility, direction, and moneyness. Breadth reflects a reading of the prior day’s NYSE Advance/Decline indicator. The CBOE VIX Volatility Index (INDEX: VVIX) reflects the attractiveness of owning volatility. UMBS prices via MND. Click here for the economic calendar.
Administrative
Yesterday’s newsletter put forth the writer’s discussion with Simplify’s Mike Green, fresh after he spoke at Exchange Miami. The letter covered a lot, albeit in a messy way, given some unforeseen obligations. Today, we clarify those narratives for you. Hopefully, you enjoy it, and take care!
Fundamental
In summary, Simplify’s Michael Green trades 60/40-looking portfolios on macroeconomic signals while using derivative exposures to reduce volatility and amplify profit potential (e.g., responding to economic data in real-time by trading options on the CME Group Inc’s [NASDAQ: CME] Eurodollar [FUTURE: /GE], a tool to express views on future interest rates).
His conversation with your letter writer covered a variety of topics including the reliability of data and what that means for his active management, derivatives trading, strength potential in markets, as well as what he’s optimistic about. Here’s what you need to know.
1 – Green explains that his preferred macro guides for decision-making are unclear. He explains that traditional adjustments “ranging from seasonality to the birth-death models used in smoothing employment reports” are in question, and he jokes that developed market data sets are approaching emerging market data sets in terms of quality.
2 – Green reflects on 2022 noting options, colloquially referred to as volatility, were a big underperformer. “One-year variance swaps or implied volatility on an at-the-money S&P 500 put option would trade somewhere in the neighborhood of 25 to 30%,” he explains. “That implies a level of daily price movement that is difficult to achieve.”
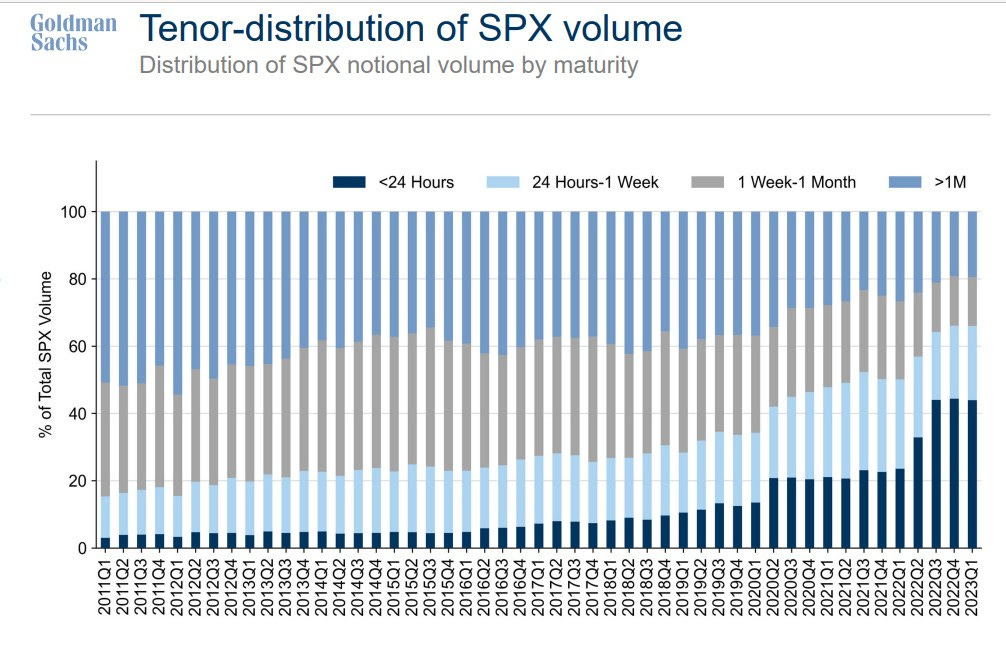
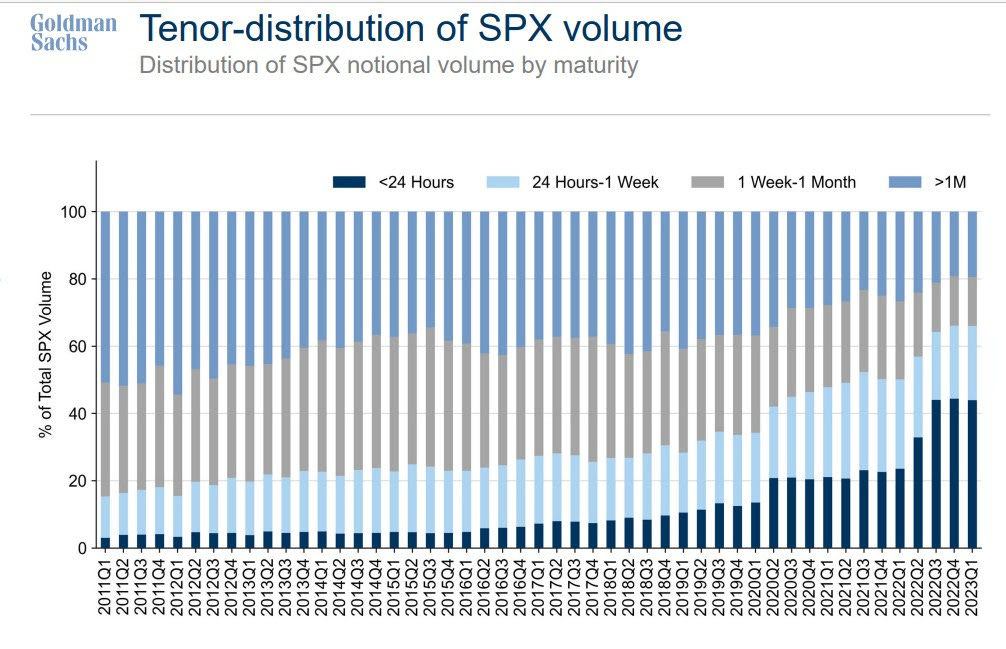
Having learned their lesson, in 2023 investors swapped long-dated volatility exposures for ones with bounded risk (e.g., Bear Put Spread) and less time to expiry (e.g., 0 DTE).
Graphic: Retrieved from Goldman Sachs Group Inc (NYSE: GS).
Though both may leave counterparties with less risk, if news shocks the market far one way, market movements may become exaggerated when investors, and counterparties accordingly, scramble to adjust their risk.
Major Wall Street players and clearing houses have, too, just announced an investigation into the risks such activity poses as well.
One options trader is making a monster bet on market volatility exploding into the summer months.
Up until now, however, the activity has manifested a push-and-pull, mean-reverting-type action; investors lean short volatility in the morning and long volatility in the afternoon which, combined, tends to mute price action.
Graphic: Retrieved from Bank of America Corporation (NYSE: BAC).
Say one morning an “investor sells call options and a dealer receives them,” Green puts forth as an example. “The dealer will hedge their long call position by selling futures which will pressure the market and result in the options prices collapsing in value.”
To re-hedge falling options prices, “dealers have to buy back their futures exposure and this pushes the markets upward. This is the pattern that’s been playing out over and over again. It’s weakness in the morning followed by strength in the afternoon.”
Though this is a very smart exposure to have, Green says volatility that’s longer-dated is cheap and, when an eventual shock occurs, its payout may more than justify its cost, particularly as the outlook for equities, bonds, and commodities further blurs.
Graphic: Retrieved from Goldman Sachs Group Inc (NYSE: GS) via The Market Ear.
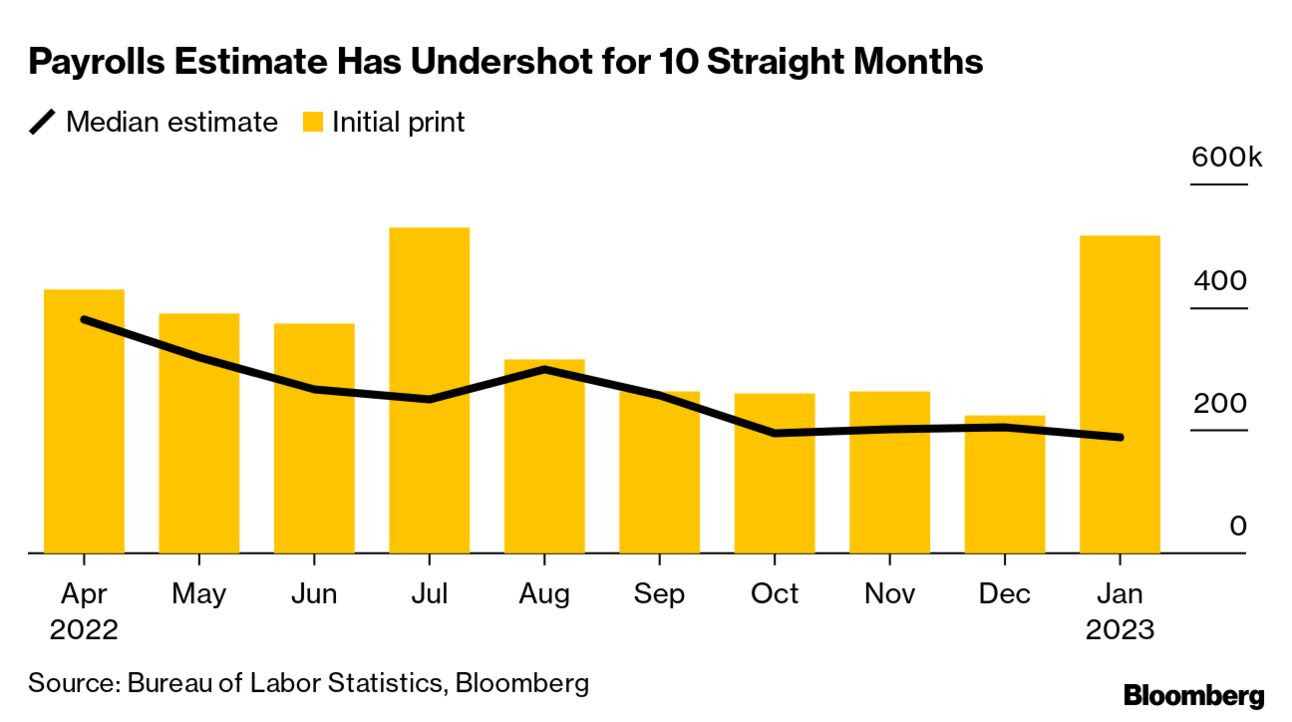
3 – Despite still-robust appearing economic data, Green sees clear signs the economy is starting to deteriorate.
Graphic: Retrieved from Bloomberg. “If the unemployment data this week is very strong then you’ve got 50 basis points back on the table,” explained Bob Michele, the chief investment officer of JPMorgan Asset Management. “But that is a pretty high hurdle to get to once you’ve down-shifted to 25 basis points.”
“We’re seeing cracks in bubbles like commercial real estate” and risk assets including crypto, presently maintained by a lack of inventory or supply that’s tied up in the bankruptcy proceedings of FTX (CRYPT0: FTT) and Voyager Digital Ltd (ex-OTC: VYGVF), of all things.
Graphic: Retrieved from JPMorgan Chase & Co (NYSE: JPM) via The Market Ear. “Excess liquidity is being withdrawn at an accelerating pace.”
“The question is whether higher interest rates ultimately drive a fraction of the market into distress with forced transactions,” Green wonders, pointing to the likes of Blackstone Inc (NYSE: BX) and Brookfield Corp (NYSE: BN) handing in keys to properties. “It takes one person being in distress to set a new clearing price which, in turn, changes valuations for everybody, and makes it more difficult to qualify for things like mortgages.”
So $SVIB has $200b in assets, of which $116 are securities. About $80b of that are high quality liquid assets that could be sold or repo'd for cash. Looks good until.. pic.twitter.com/SmX1JqLg9E
4 – Looking forward, over the short-term at least, Green says inflation is likely to trend higher for longer, particularly with monetary policy inspiring fiscal action and sparking off geopolitics.
“The world’s growing materially slower and manufacturing capacity, which is spreading around the world, requires labor and investment, which could be inflationary in the short-run,” Green puts forth. Traditionally, “lower rates and costs enable added capacity and a predictable rebound in consumption. However, we’re driving a stake through the vampire’s heart, now, and … there’s the multiplier effect driving fiscal policy, too.”
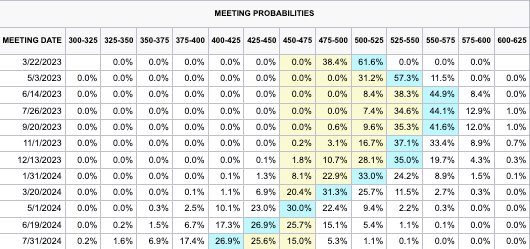
Graphic: Retrieved from CME Group Inc’s (NASDAQ: CME) FedWatch Tool. The terminal (peak) rate sits at 5.50-5.75%.
5 – In response to uncertainty, investors can park cash in Treasury bonds, as well as allocate some capital to volatility “to introduce a degree of convexity,” risking only the premium paid. Alternatively, investors can take a more optimistic long view and position in innovations like artificial intelligence or next-generation energy production.
Graphic: Retrieved from Goldman Sachs Group Inc (NYSE: GS) via The Market Ear. Investors are not concerned with tail risk.
“I’m optimistic about human innovation and the rise of AI, … as well as higher energy prices creating the impetus for tremendous innovations in energy generation that have the potential to lift us out of this period of perceived scarcity if we allow ourselves to embrace it.”
Technical
As of 8:00 AM ET, Friday’s regular session (9:30 AM – 4:00 PM ET), in the S&P 500, is likely to open in the upper part of a negatively skewed overnight inventory, outside of the prior day’s range, suggesting a potential for immediate directional opportunity.
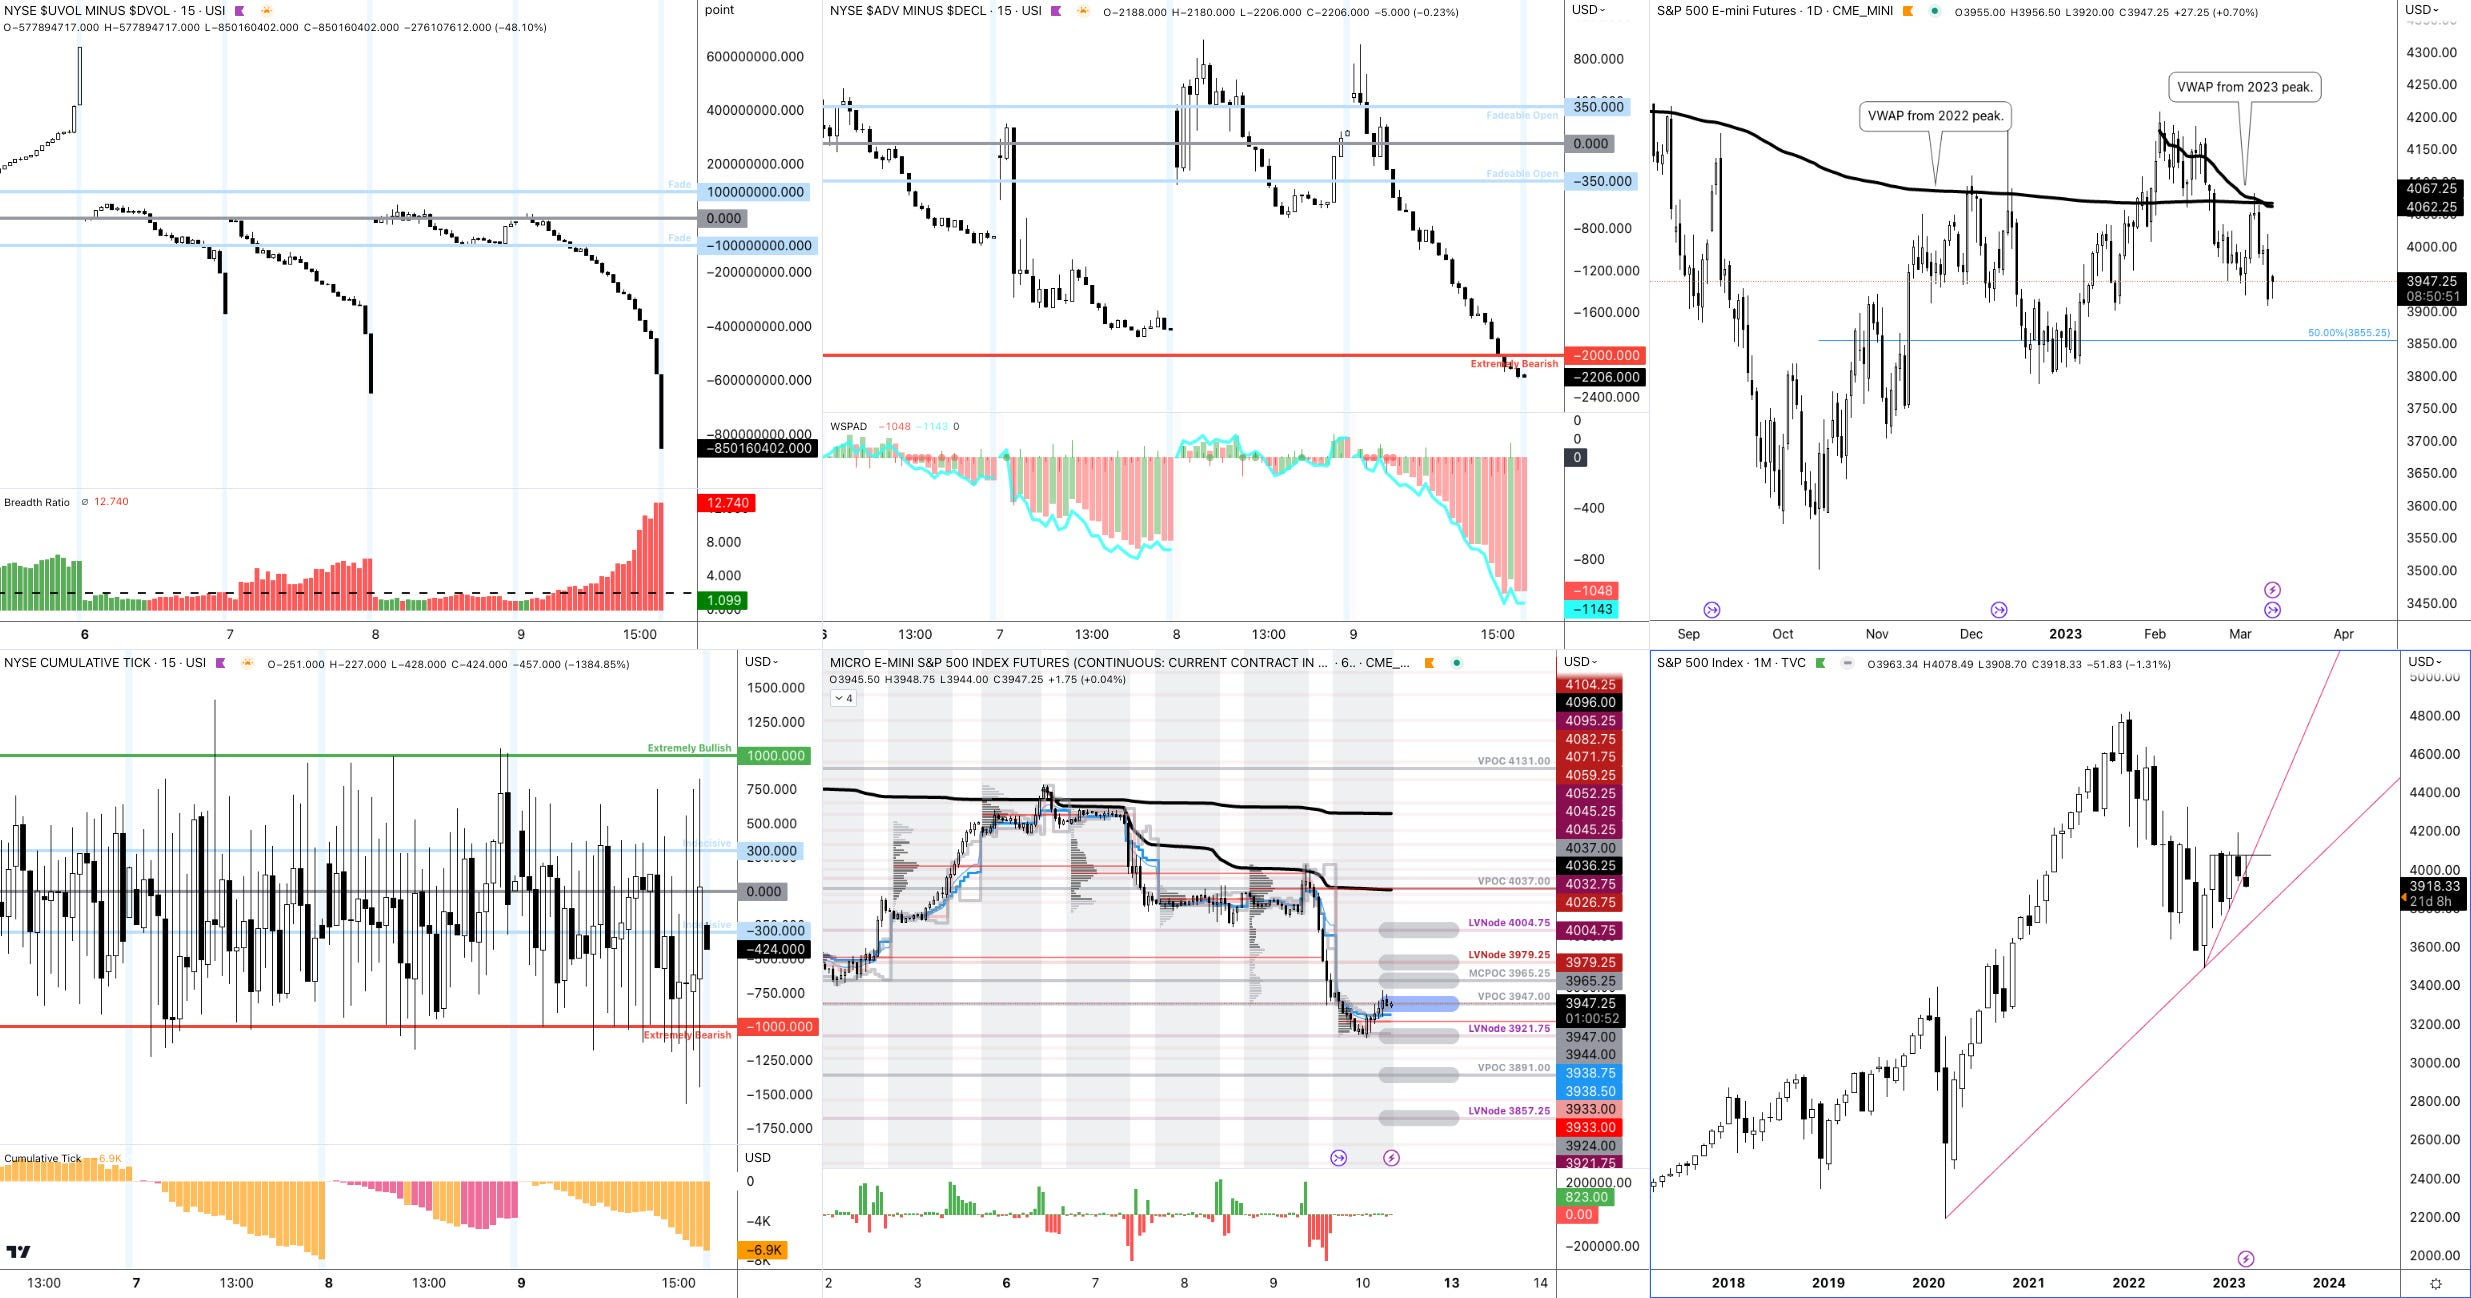
The S&P 500 pivot for today is $3,947.00.
Key levels to the upside include $3,965.25, $3,979.25, and $4,004.75.
Key levels to the downside include $3,921.75, $3,891.00, and $3,857.25.
Disclaimer: Click here to load the updated key levels via the web-based TradingView platform. New links are produced daily. Quoted levels likely hold barring an exogenous development.
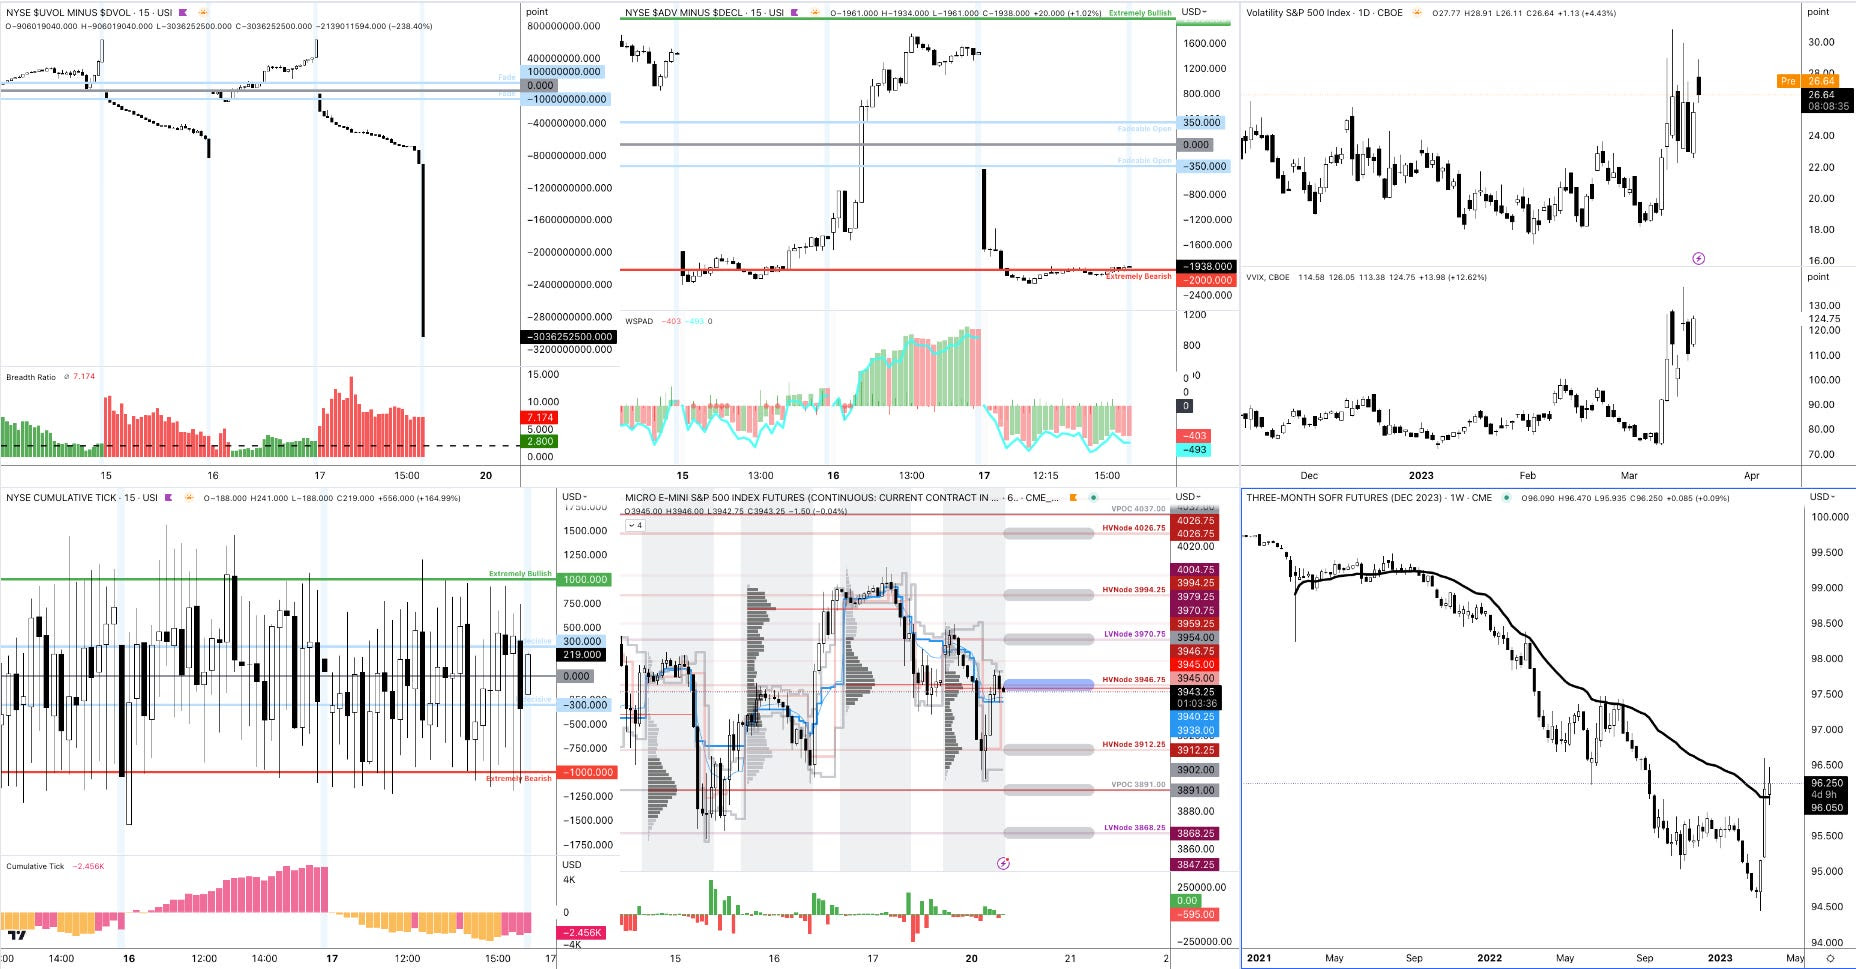
Graphic: 65-minute profile chart of the Micro E-mini S&P 500 Futures (bottom middle) and market internals as taught by Peter Reznicek.
Definitions
Volume Areas: Markets will build on areas of high-volume (HVNodes). Should the market trend for a period of time, this will be identified by a low-volume area (LVNodes). The LVNodes denote directional conviction and ought to offer support on any test.
If participants auction and find acceptance in an area of a prior LVNode, then future discovery ought to be volatile and quick as participants look to the nearest HVNodes for more favorable entry or exit.
POCs: Areas where two-sided trade was most prevalent in a prior day session. Participants will respond to future tests of value as they offer favorable entry and exit.
MCPOCs: Denote areas where two-sided trade was most prevalent over numerous sessions. Participants will respond to future tests of value as they offer favorable entry and exit.
About
The author, Renato Leonard Capelj, spends the bulk of his time at Physik Invest, an entity through which he invests and publishes free daily analyses to thousands of subscribers. The analyses offer him and his subscribers a way to stay on the right side of the market.
You may view this letter’s content calendar at this link.
Disclaimer
Do not construe this newsletter as advice. All content is for informational purposes. Capelj and Physik Invest manage their own capital and will not solicit others for it.
Physik Invest’s Daily Brief is read free by thousands of subscribers. Join this community to learn about the fundamental and technical drivers of markets.
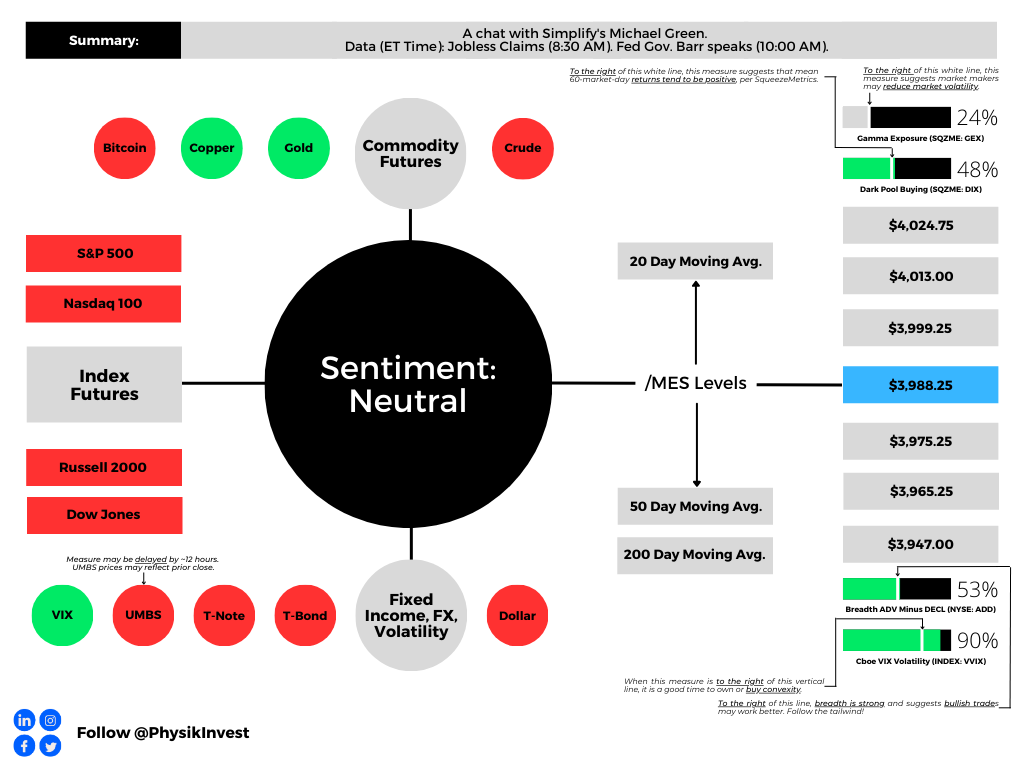
Graphic updated 8:30 AM ET. Sentiment Neutral if expected /MES open is inside of the prior day’s range. /MES levels are derived from the profile graphic at the bottom of this letter. Click here for the latest levels. SqueezeMetrics Dark Pool Index (DIX) and Gamma (GEX) with the latter calculated based on where the prior day’s reading falls with respect to the MAX and MIN of all occurrences available. A higher DIX is bullish. The lower the GEX, the more (expected) volatility. Click to learn the implications of volatility, direction, and moneyness. Breadth reflects a reading of the prior day’s NYSE Advance/Decline indicator. The CBOE VIX Volatility Index (INDEX: VVIX) reflects the attractiveness of owning volatility. UMBS prices via MND. Click here for the economic calendar.
Fundamental
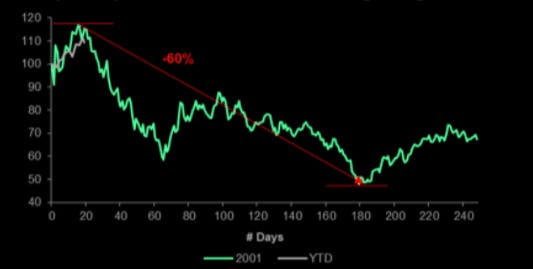
Last year, Simplify Asset Management’s Michael Green, an active manager focused on creating portfolios mimicking traditional constructions like 60/40, albeit with less realized volatility (RVOL), thought a dot-com-type collapse was unfolding under the surface of the indexes.
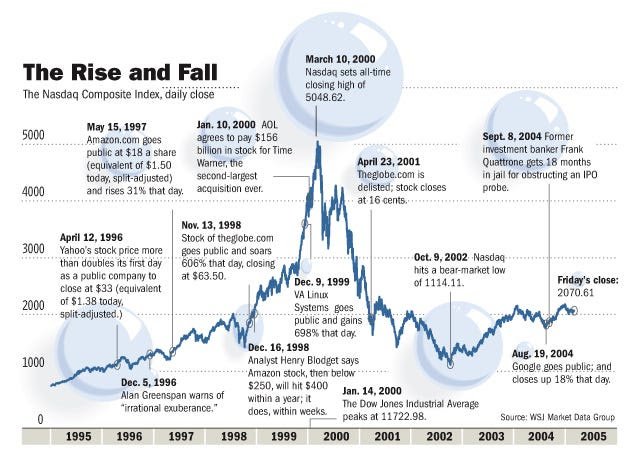
In an interview for an upcoming Benzinga article, Green explained to your letter writer that he maintains today’s action is similar to the early 2000s.
Prior to 1999, “many of the early winners in the dot-com cycle had already started to falter and, as we came into the market peak for the Nasdaq (INDEX: NDX) in March of 2000, the Nasdaq was much higher and the market was much more narrow,” Green says. “This is 2021 into 2022.” Green adds that the S&P 500 (INDEX: SPX) correction didn’t begin until late-2000, and the homebuilder- and energy-type stocks were the ones that outperformed, as we saw in 2022.
Ultimately, a recession hit in 2001, and credit deteriorated, Green explains, revealing fraud among many high-flyers of the dot-com boom. Many were unprepared, Green adds, drawing parallels to 2022 events concerning the likes of FTX.
Graphic: Retrieved from WSJ Market Data Group.
In 2023 and beyond, Green thinks the economy and markets are set for a bumpy ride. He projects that rising interest rates cause pain for businesses that received a stay of execution in 2020 through PPP loans and subsidized borrowing.
“Many of them put in two- or three-year paper as a stopgap,” he explains. Now, due to the higher rate environment, “companies can’t refinance, so we’re seeing Blackstone Inc (NYSE: BX) and Brookfield Corp (NYSE: BN) hand in keys.”
As put in yesterday’s letter, the deterioration in markets has, in part, been “offset by a lack of inventory,” as well as the hesitancy to sell (i.e., lack of supply). However, the marginal impact of one new person “in distress … [may] set a new clearing price” that changes valuations for everybody. Green says that investors know supply will cause markets to weaken, and that is why products like Bitcoin (CRYPTO: BTC) are intact.
“If we tie up stuff in bankruptcy courts for the next three or four years, nothing will get done,” Green elaborates. “That’s part of what we’re seeing in the crypto space where part of the strength for Bitcoin is simply the absence of sellers as we navigate our way through bankruptcy on many of these entities.”
As an example, Voyager Digital Ltd (ex-OTC: VYGVF) claimants “desperately [sought] to submit a bid to prevent Bitcoin from having to be sold” because these sales would pressure prices and “increase the damage across the entire crypto universe.”
Graphic: Retrieved from Bank of America (NYSE: BAC) via Bloomberg.
Green went on to add his firm objection to Federal Reserve’s (Fed) policy choices noting that deterioration is threatening the “commercial real estate bubble … and residential real estate” currently afloat on a “lack of inventory.”
The “multiplier effect” will be a serious challenge for markets; monetary policy drives fiscal policy and this has an impact elsewhere on geopolitics, manufacturing, and so on (e.g., the cost of interest rates offset by credits to households, the relocation and addition of manufacturing at home and outside of China), which only serves to boost inflation over the short term and further complicate things for the Fed.
Positioning
With data very unreliable and markets fearful of a 2020-like decline, 2022 was a far more orderly year than expected.
“I think people were extremely well-hedged,” he explains. “There was a tremendous amount of exposure that had been purchased for deep out-of-the-money, relatively long-dated [put options], and that created conditions under which the volatility surface, beyond six months, was extremely elevated heading into 2022.”
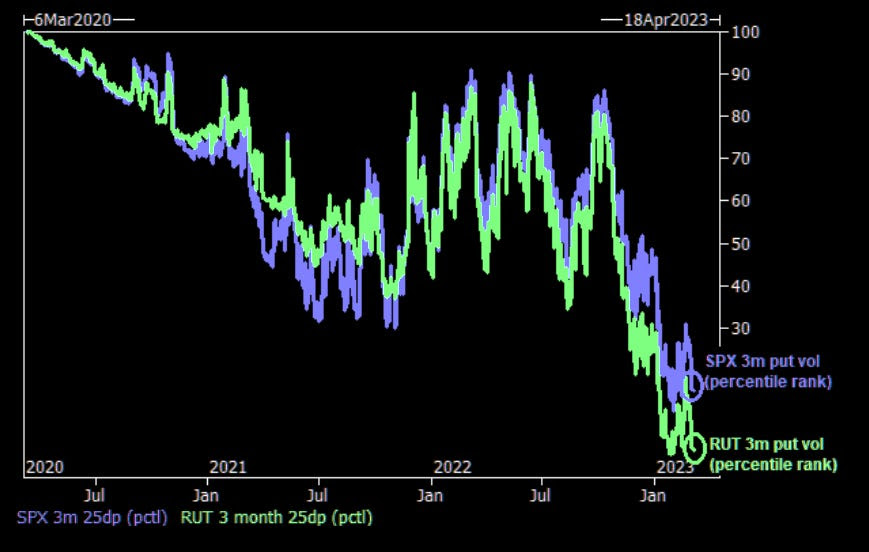
Green says one-year variance swaps and implied volatility (IVOL) on at-the-money S&P 500 puts was “in the neighborhood of 25-30%, … which is very expensive … [and this] implies a level of daily price movement that is difficult to achieve.”
Consequently, investors’ hedges did not work. Green adds that “having learned their lesson from 2022, people have by and large abandoned those types of hedges and have instead moved, even as skew moves to near-record cheapness, … to spreads” and shorter-dated options (e.g., 0 DTE).
Graphic: Retrieved from Goldman Sachs Group Inc (NYSE: GS) via Bloomberg.
With a vast majority of these shorter-dated options exposures held short by investors, this creates conditions of suppressed volatility that can last; dealers own volatility and in hedging that, they promote mean reversion-type activity (i.e., instead of institutions writing calls against long exposure out one-month, they are writing calls against long exposure out one-day, and this supply of options has dealers pressuring the market on their initial hedging and supporting the market on later re-hedging) over the very short-term. In other words, when investors sell those calls, the dealer receives them and sells futures to hedge. This “pressures the market lower which causes … the delta of that option or replicating exposure to decline and, now, the dealers have to buy back that exposure and push the markets upward,” later, because the risk they are exposed to by that exposure has declined (i.e., lower delta). See the image below.
Graphic: Retrieved from Bank of America Corporation (NYSE: BAC).
This options activity may become problematic. If there is a gap, investors’ “scramble to hedge those positions” may lead to even larger movement, given that the market “is not prepared to provide liquidity,” generally speaking.
One options trader is making a monster bet on market volatility exploding into the summer months.
Green suggests that investors can side-step a lot of the turmoil by allocating some or all of their portfolio to bonds. Any cash remaining could be used to amplify portfolio returns in a fixed-risk manner (e.g., buy bond and SPX options and options spreads).
DEFINED OUTCOME INVESTING
-Worried about the prospects of the 60/40 portfolio? -Looking for a strategy that takes advantage of higher interest rates? -Tired of market timing?
A 🧵on how to use exchange-traded options + U.S. Treasurys to define your risk today, for tomorrow.
More detail to come in the next sessions. Hope you enjoyed this (rushed) letter.
Technical
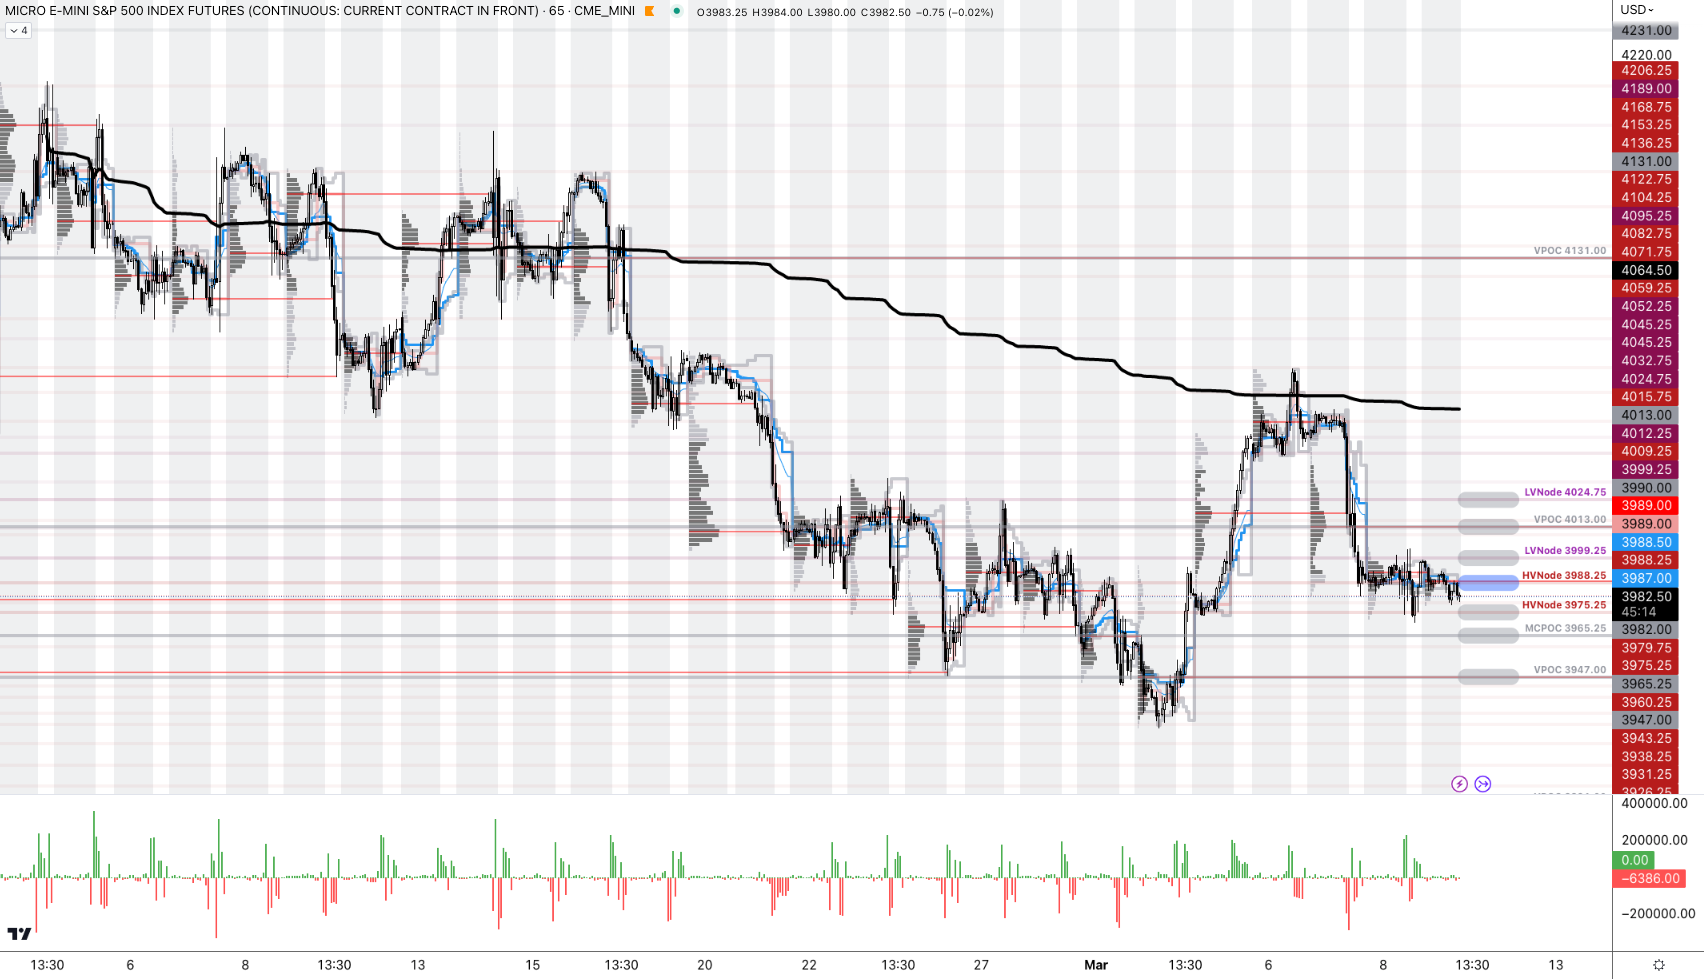
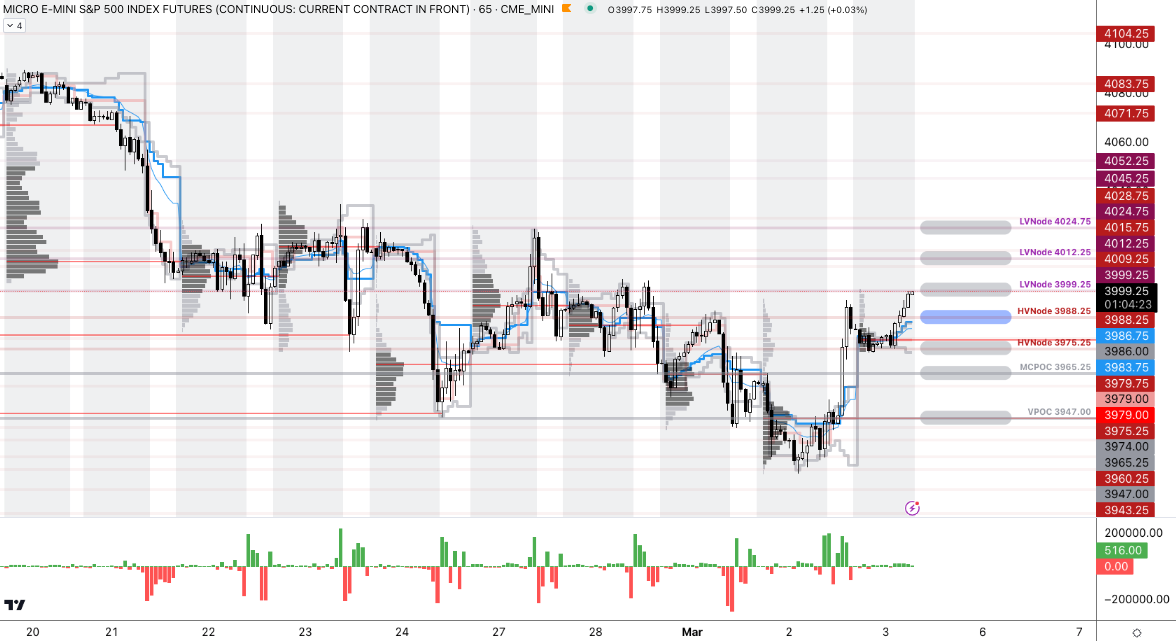
As of 8:30 AM ET, Thursday’s regular session (9:30 AM – 4:00 PM ET), in the S&P 500, is likely to open in the lower part of a negatively skewed overnight inventory, inside of the prior day’s range, suggesting a limited potential for immediate directional opportunity.
The S&P 500 pivot for today is $3,988.25.
Key levels to the upside include $3,999.25, $4,013.00, and $4,024.75.
Key levels to the downside include $3,975.25, $3,965.25, and $3,947.00.
Disclaimer: Click here to load the updated key levels via the web-based TradingView platform. New links are produced daily. Quoted levels likely hold barring an exogenous development.
Graphic: 65-minute profile chart of the Micro E-mini S&P 500 Futures.
About
The author, Renato Leonard Capelj, spends the bulk of his time at Physik Invest, an entity through which he invests and publishes free daily analyses to thousands of subscribers. The analyses offer him and his subscribers a way to stay on the right side of the market.
You may view this letter’s content calendar at this link.
Disclaimer
Do not construe this newsletter as advice. All content is for informational purposes. Capelj and Physik Invest manage their own capital and will not solicit others for it.
Physik Invest’s Daily Brief is read free by thousands of subscribers. Join this community to learn about the fundamental and technical drivers of markets.
Graphic updated 7:00 AM ET. Sentiment Risk-On if expected /MES open is above the prior day’s range. /MES levels are derived from the profile graphic at the bottom of this letter. Click here for the latest levels. SqueezeMetrics Dark Pool Index (DIX) and Gamma (GEX) with the latter calculated based on where the prior day’s reading falls with respect to the MAX and MIN of all occurrences available. A higher DIX is bullish. The lower the GEX, the more (expected) volatility. Click to learn the implications of volatility, direction, and moneyness. Breadth reflects a reading of the prior day’s NYSE Advance/Decline indicator. The CBOE VIX Volatility Index (INDEX: VVIX) reflects the attractiveness of owning volatility. UMBS prices via MND. Click here for the economic calendar.
Administrative
Lots of content today but a bit rushed at the desk. If anything is unclear, we will clarify it in the coming sessions. Have a great weekend! – Renato
Fundamental
Physik Invest’s Daily Brief for March 2 talked about balancing the implications of still-hot inflation and an economy on solid footing. Basically, the probability the economy is in a recession is lower than it was at the end of ‘22. For the probabilities to change markedly, there would have to be a big increase in unemployment, for one.
According to a blog by Unlimited’s Bruce McNevin, if the unemployment rate rises by about 1%, recession odds go up by 29%. If the non-farm payroll employment falls by about 2% or 3 million jobs, recession odds increase by about 74%. After a year or so of tightening, unemployment measures are finally beginning to pick up.
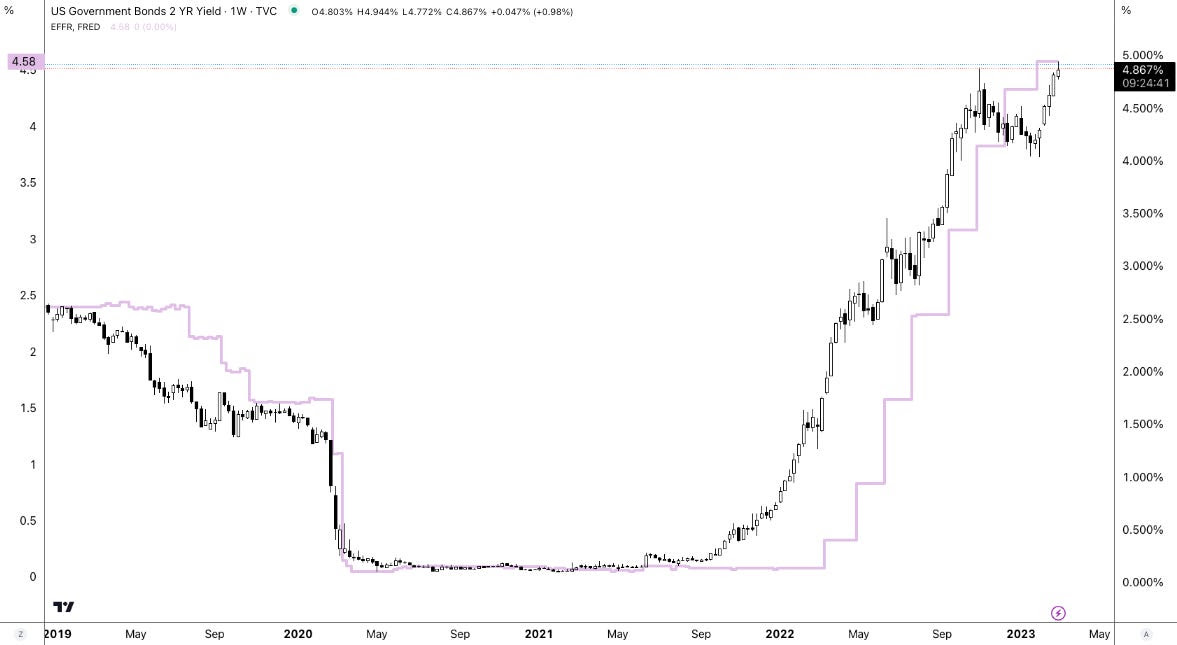
Policymakers, per recent remarks, maintain that more needs to be done, however. For instance, the Federal Reserve’s (Fed) Raphael Bostic, who generally carries an easier stance on monetary policy, mulled whether the Fed should raise interest rates beyond the 5.00-5.25% terminal rate consensus he previously endorsed. This commentary, coupled with newly released economic data, has sent yields surging at the front end.
Graphic: Retrieved from TradingView.
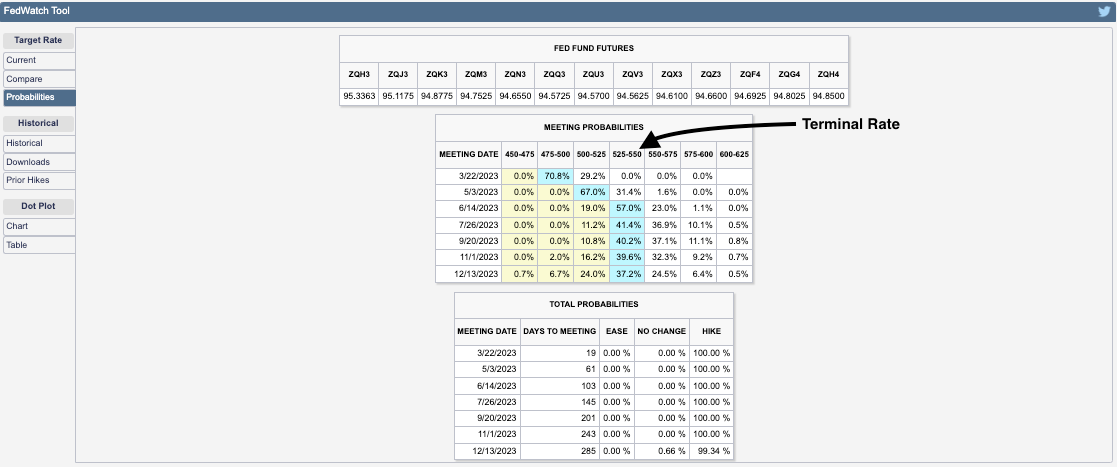
Traders are wildly repricing their terminal rate expectations this week. The terminal rate over the past few days has gone up from 5.25-5.50% to 5.50-5.75%, and back down to 5.25-5.50%.
Graphic: Retrieved from CME Group Inc (NASDAQ: CME).
Positioning
Stocks and bonds performed poorly. Commodity hedges are uninspiring also in that they do not hedge against (rising odds of) recession, per the Daily Brief for March 1.
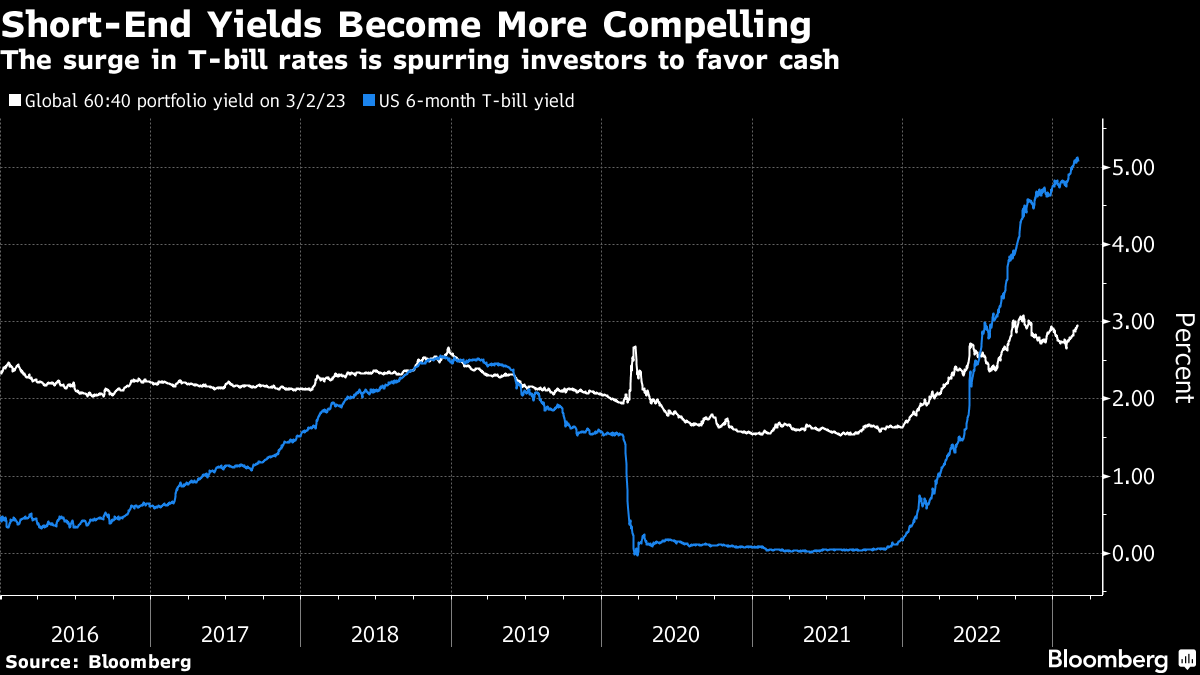
In navigating this precarious environment, this letter has put forward a few trade ideas including the sale of call options structures to finance put options structures, after the mid-February monthly options expiration (OpEx). Though measures suggest “we can [still] get cheap exposure to convexity while a lot of people are worried,” the location for similar (short call, long put) trades is not optimal. Rather, trades including building your own structured note, now catching the attention of some traders online, appear attractive now with T-bill rates surging.
Such trades reduce portfolio volatility and downside while providing upside exposure comparable to poorly performing traditional portfolio constructions like 60/40.
As an example, per IPS Strategic Capital’s Pat Hennessy, with $1,000,000 to invest and rates at ~5% (i.e., $50,000 is 5% of $1,000,000), one could buy 1000 USTs or S&P 500 (INDEX: SPX) Box Spreads which will have a value of $1 million at maturity for the price of $950,000.
With $50,000 left in cash, one can use options for leveraged exposure to an asset of their choosing, Hennessy explained. Should these options expire worthless, the $50,000 gain from USTs, at maturity, provides “a full return of principal.”
For traders who are focused on short(er)-term movements, one could allocate the cash remaining toward structures that buy and sell call options over very short time horizons (e.g., 0 DTE).
Knowing that the absence of range expansion to the downside, positioning flows may build a platform for the market to rally, one could lean into structures like fixed-width call option butterflies.
For instance, yesterday, Nasdaq 100 (INDEX: NDX) call option butterflies expanded in value ~10 times (i.e., $5 → $50). An example 0 DTE trade is the BUTTERFLY NDX 100 (Weeklys) 2 MAR 23 12000/12100/12200 CALL. Such trade could have been bought near ~$5.00 in debit and, later, sold for much bigger credits (e.g., ~$40.00).
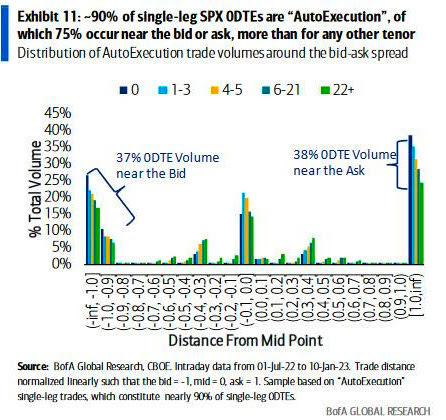
Such trade fits and plays on the narrative described in Physik Invest’s Daily Brief for February 24. That particular letter detailed Bank of America Corporation’s (NYSE: BAC) finding that “volume is uniquely skewed towards the ask early in the day but towards the bid later in the day” for these highly traded ultra-short-dated options.
Graphic: Retrieved from Goldman Sachs Group Inc (NYSE: GS) via Bloomberg.
Even options insight and data provider SqueezeMetrics agrees: “Buy 0 DTE call.” The typical “day doesn’t end above straddle b/e, but call makes money,” SqueezeMetrics explained. “Dealer and call-buyer both profit. Gap down, repeat.”
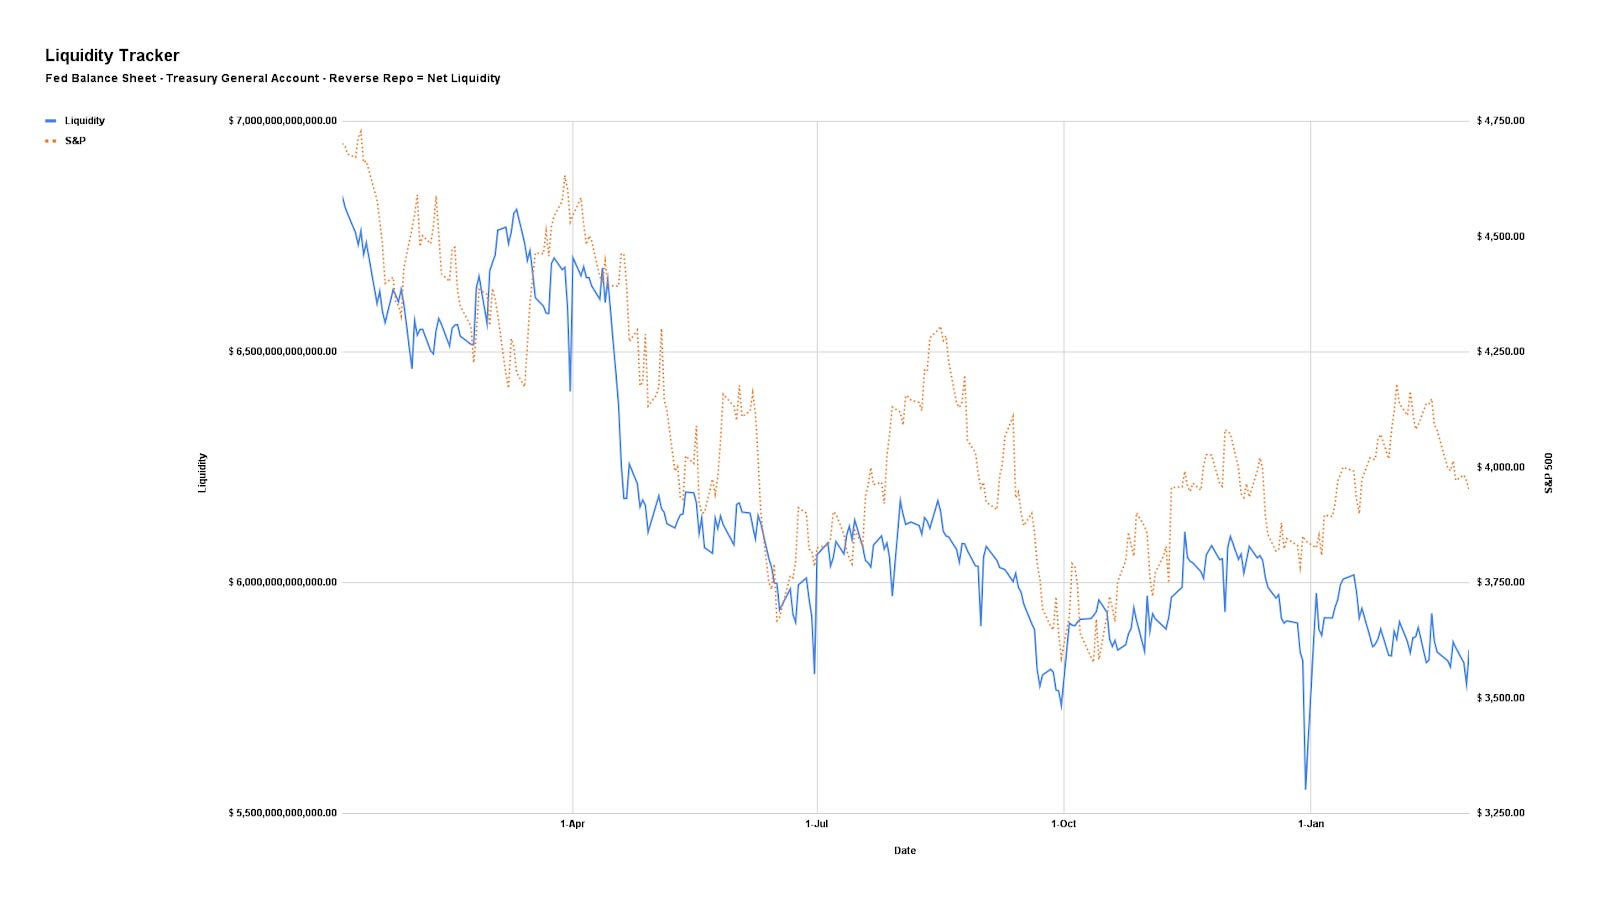
Anyways, back to the bigger trends impacted by liquidity coming off the table and increased competition between equities and fixed income.
Graphic: Via Physik Invest. Net Liquidity = Fed Balance Sheet – Treasury General Account – Reverse Repo.
As this letter put forth in the past, if the “market consolidates and doesn’t break,” as we see, the delta buy-back with respect to dropping implied volatility (IVOL) or vanna and buy-back with respect to the passage of time or charm could build a platform for a FOMO-driven call buying rally that ends in a blow-off.
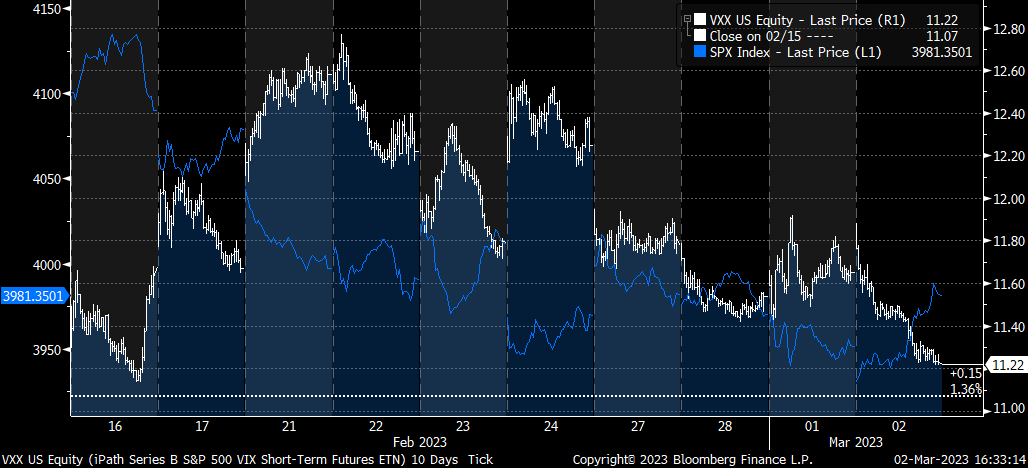
Graphic: Retrieved from Piper Sandler’s (NYSE: PIPR) Danny Kirsch. Short volatility and short stocks was attractive to trade. As your letter writer put in a recent SpotGamma note: “With IV at already low levels, the bullish impact of it falling further is weak, hence the SPX trending lower all the while IV measures (e.g., VIX term structure) have shifted markedly lower since last week. If IV was at a higher starting point, its falling would work to keep the market in a far more positive/bullish stance.”
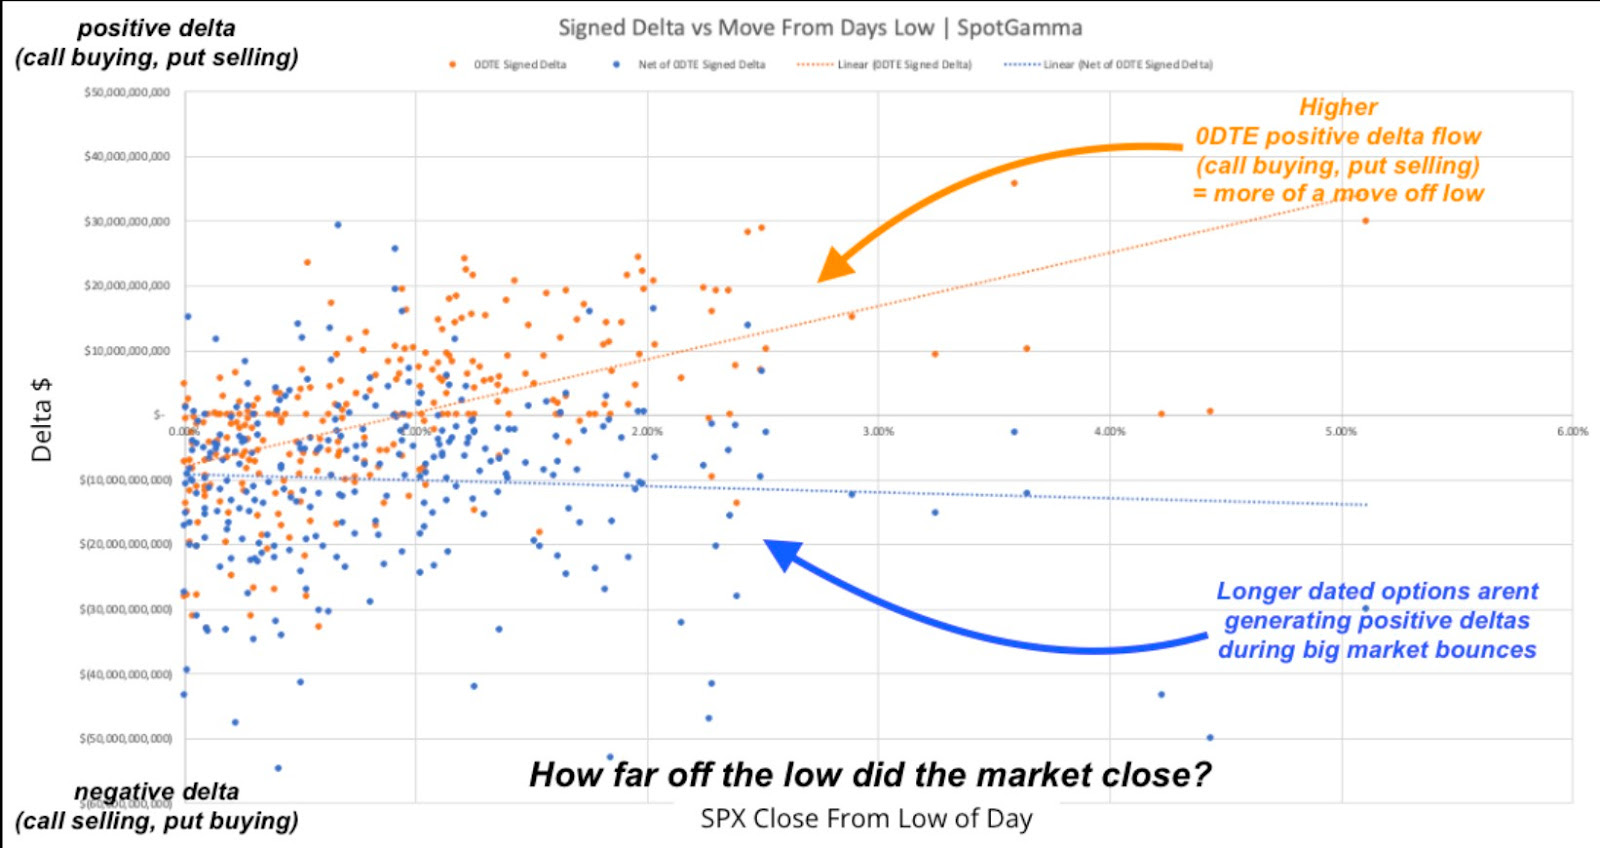
Per data by SpotGamma, another options insight and data provider your letter writer used to write for and highly recommends checking out, call buying, particularly over short time horizons, was often tied to market rallies.
“0DTE does not seem to be associated with betting on a large downside movement. Large downside market volatility appears to be driven by larger, longer-dated S&P volume,” SpotGamma founder Brent Kochuba said in the Bloomberg article. “Where 0DTE is currently most impactful is where it seems 0DTE calls are being used to ‘buy the dips’ after large declines. In a way this suppresses volatility.”
Anyways, the signs of a “more combustible situation” would likely show when “volatility is sticky into a rally,” explained Kai Volatiity’s Cem Karsan. To gauge combustibility, look to the Daily Brief for February 17.
Technical
As of 6:50 AM ET, Friday’s regular session (9:30 AM – 4:00 PM ET), in the S&P 500, is likely to open in the upper part of a positively skewed overnight inventory, outside of the prior day’s range, suggesting a potential for immediate directional opportunity.
The S&P 500 pivot for today is $3,988.25.
Key levels to the upside include $3,999.25, $4,012.25, and $4,024.75.
Key levels to the downside include $3,975.25, $3,965.25, and $3,947.00.
Disclaimer: Click here to load the updated key levels via the web-based TradingView platform. New links are produced daily. Quoted levels likely hold barring an exogenous development.
Graphic: 65-minute profile chart of the Micro E-mini S&P 500 Futures.
Definitions
Volume Areas: Markets will build on areas of high-volume (HVNodes). Should the market trend for a period of time, this will be identified by a low-volume area (LVNodes). The LVNodes denote directional conviction and ought to offer support on any test.
If participants auction and find acceptance in an area of a prior LVNode, then future discovery ought to be volatile and quick as participants look to the nearest HVNodes for more favorable entry or exit.
Vanna: The rate at which the Delta of an option changes with respect to implied volatility.
Charm: The rate at which the Delta of an option changes with respect to time.
POCs: Areas where two-sided trade was most prevalent in a prior day session. Participants will respond to future tests of value as they offer favorable entry and exit.
MCPOCs: Denote areas where two-sided trade was most prevalent over numerous sessions. Participants will respond to future tests of value as they offer favorable entry and exit.
Options Expiration (OPEX): Reduction in dealer Gamma exposure. Often, there is an increase in volatility after the removal of large options positions and associated hedging.
Options: Options offer an efficient way to gain directional exposure.
If an option buyer was short (long) stock, he or she could buy a call (put) to hedge upside (downside) exposure. Additionally, one can spread, or buy (+) and sell (-) options together, strategically.
Commonly discussed spreads include credit, debit, ratio, back, and calendar.
Credit: Sell -1 option closer to the money. Buy +1 option farther out of the money.
Debit: Buy +1 option closer to the money. Sell -1 option farther out of the money.
Ratio: Buy +1 option closer to the money. Sell -2 options farther out of the money.
Back: Sell -1 option closer to the money. Buy +2 options farther out of the money.
Calendar: Sell -1 option. Buy +1 option farther out in time, at the same strike.
Typically, if bullish (bearish), sell at-the-money put (call) credit spread and/or buy a call (put) debit/ratio spread structured around the target price. Alternatively, if the expected directional move is great (small), opt for a back spread (calendar spread). Also, if credit spread, capture 50-75% of the premium collected. If debit spread, capture 2-300% of the premium paid.
Be cognizant of risk exposure to the direction (Delta), movement (Gamma), time (Theta), and volatility (Vega).
Negative (positive) Delta = synthetic short (long).
Negative (positive) Gamma = movement hurts (helps).
Negative (positive) Theta = time decay hurts (helps).
The author, Renato Leonard Capelj, spends the bulk of his time at Physik Invest, an entity through which he invests and publishes free daily analyses to thousands of subscribers. The analyses offer him and his subscribers a way to stay on the right side of the market.
You may view this letter’s content calendar at this link.
Disclaimer
Do not construe this newsletter as advice. All content is for informational purposes. Capelj and Physik Invest manage their own capital and will not solicit others for it.
Physik Invest’s Daily Brief is read free by thousands of subscribers. Join this community to learn about the fundamental and technical drivers of markets.
Graphic updated 8:25 AM ET. Sentiment Neutral if expected /MES open is inside of the prior day’s range. /MES levels are derived from the profile graphic at the bottom of this letter. Click here for the latest levels. SqueezeMetrics Dark Pool Index (DIX) and Gamma (GEX) with the latter calculated based on where the prior day’s reading falls with respect to the MAX and MIN of all occurrences available. A higher DIX is bullish. The lower the GEX, the more (expected) volatility. Click to learn the implications of volatility, direction, and moneyness. Breadth reflects a reading of the prior day’s NYSE Advance/Decline indicator. The CBOE VIX Volatility Index (INDEX: VVIX) reflects the attractiveness of owning volatility. UMBS prices via MND. Click here for the economic calendar.
Positioning
Traders continue to balance the risks of owning risk assets versus less-risky bonds, for instance. In what can be construed as a fear-of-missing-out (FOMO), some have sought upside equity exposure in a way that limits downside: call options.
Consequently, implied volatility (IVOL) on the call side, particularly in options with less time to expiration, continues to be elevated by upwards of 10.00% or more.
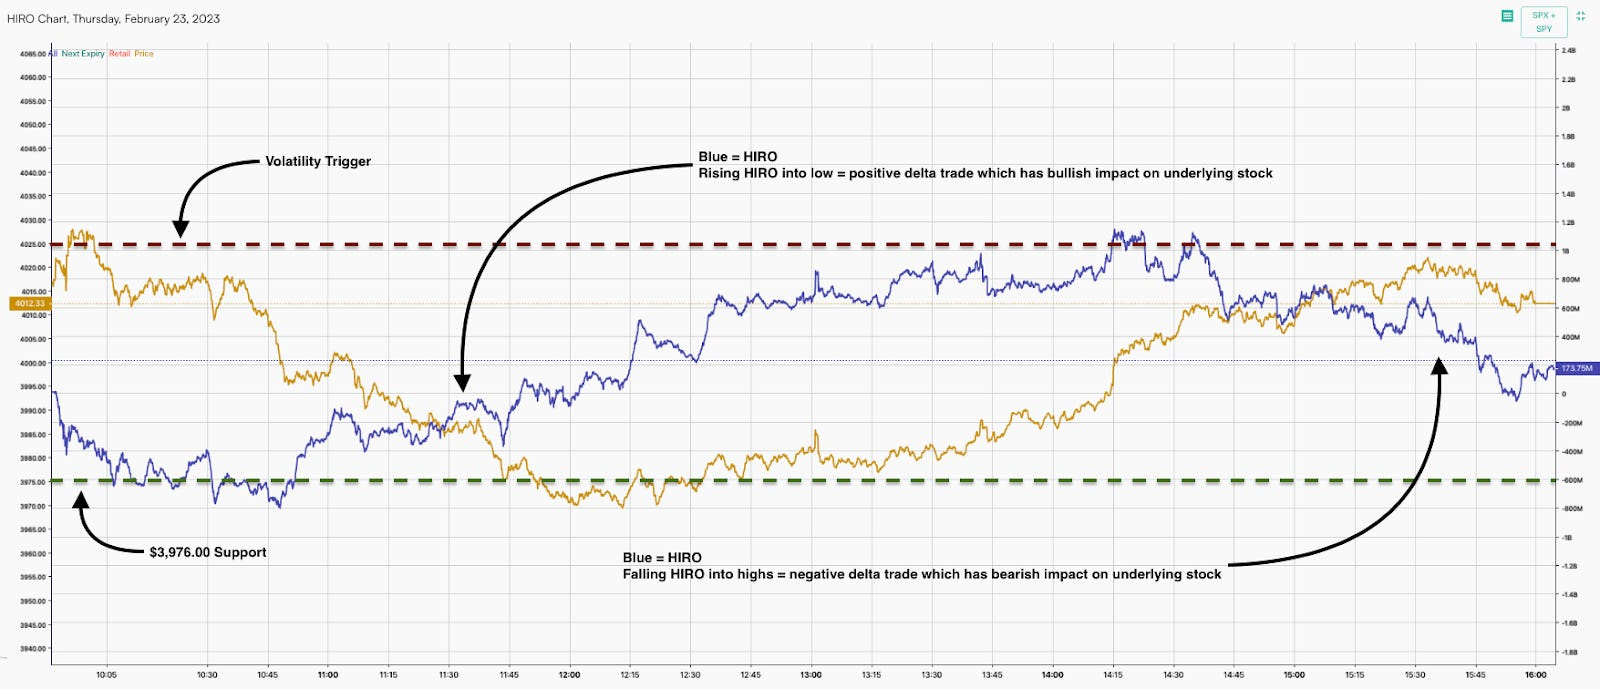
Further, this week’s trading has been dominated by the expected post-options expiry (OpEx) weakness, as well as short-term catalysts and trading. Take yesterday, for example, the market opened higher signaling a potential trend change on upbeat earnings reports, as I detailed in a SpotGamma note. Under the hood, however, there was little optimism. The S&P 500 (INDEX: SPX) succumbed to this weakness before reversing at a key support SpotGamma’s modeling established and rising toward a key resistance into session-end. Noteworthy was the options activity heading into the decline. We observe this activity with tools including SpotGamma’s HIRO indicator measuring the real-time hedging impact of traders’ options activities.
As the SPX traded lower, ultra-short-dated call buyers and put sellers synthetically bought the market. The hedging of this ultra-sensitive exposure portended a turn at the low. As the SPX resolved higher, this activity traded out, so to speak, as evidenced by ultra-short-dated call selling and put buying, hence mean-reversion into the close.
Graphic: Retrieved from SpotGamma.
SpotGamma’s founder said these “head-fakes” were to be expected. “Traders are uncertain and still are not committed to demanding longer-dated protection,” hence lower longer-dated IVOL.
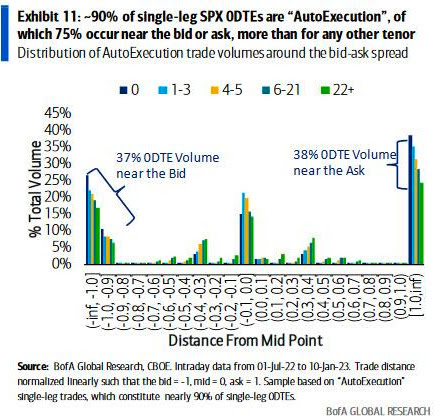
In a Bank of America Corporation (NYSE: BAC) response to JPMorgan Chase & Co’s (NYSE: JPM) note on an ultra-short-dated options trading catastrophe looming, we learn that mean-reversion is, in part, a result of “traders buying short-dated options at the beginning of the day and unwinding those same positions late in the day,” I put in a SpotGamma note.
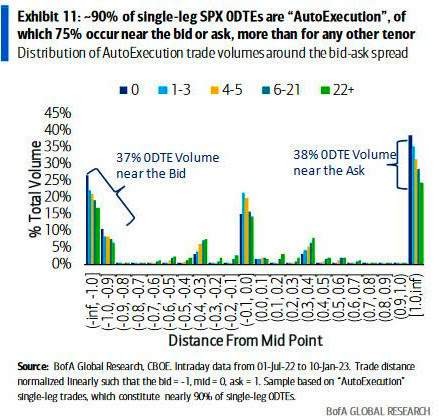
To quote BAC directly, half of all SPX ultra-short-dated options activity is “single-leg auto-execution.” Options IVOL is “at levels that are likely inconsistent with a market that has been overrun by option sellers,” contrary to JPM’s opinion, ZeroHedge said in one recap. “75% of trades occur near the bid or the ask – more than for any other tenor, and volume is uniquely skewed towards the ask early in the day but towards the bid later in the day.”
Consequently, a takeaway is that, as this letter has put forth in the past, ultra-short-dated options activity does not have a long-lasting impact. Rather, what is impactful is participants’ desire to carry exposure to options/protection that are farther-dated.
Graphic: Retrieved from Bank of America Corporation (NYSE: BAC) via SpotGamma.
As put in yesterday’s letter, the contexts for a far-reaching rally are weak. A change in the bearish context is likely to coincide with charged options values (i.e., wound IVOL or big put delta) or some fundamental, macro-type catalyst. In the latter, a caveat is that IVOL compression, alone, likely does little to inspire a far-reaching rally.
Technical
As of 7:30 AM ET, Friday’s regular session (9:30 AM – 4:00 PM ET), in the S&P 500, is likely to open in the lower part of a negatively skewed overnight inventory, inside of the prior day’s range, suggesting a limited potential for immediate directional opportunity.
The S&P 500 pivot for today is $3,992.75.
Key levels to the upside include $4,003.25, $4,012.25, and $4,024.75.
Key levels to the downside include $3,979.75, $3,965.25, and $3,949.00.
Disclaimer: Click here to load the updated key levels via the web-based TradingView platform. New links are produced daily. Quoted levels likely hold barring an exogenous development.
Graphic: 65-minute profile chart of the Micro E-mini S&P 500 Futures.
Definitions
Volume Areas: Markets will build on areas of high-volume (HVNodes). Should the market trend for a period of time, this will be identified by a low-volume area (LVNodes). The LVNodes denote directional conviction and ought to offer support on any test.
If participants auction and find acceptance in an area of a prior LVNode, then future discovery ought to be volatile and quick as participants look to the nearest HVNodes for more favorable entry or exit.
POCs: Areas where two-sided trade was most prevalent in a prior day session. Participants will respond to future tests of value as they offer favorable entry and exit.
MCPOCs: Denote areas where two-sided trade was most prevalent over numerous sessions. Participants will respond to future tests of value as they offer favorable entry and exit.
About
The author, Renato Leonard Capelj, works in finance and journalism.
Capelj spends the bulk of his time at Physik Invest, an entity through which he invests and publishes free daily analyses to thousands of subscribers. The analyses offer him and his subscribers a way to stay on the right side of the market. Separately, Capelj is an options analyst at SpotGamma and an accredited journalist.
You may view this letter’s content calendar at this link.
Disclaimer
Do not construe this newsletter as advice. All content is for informational purposes. Capelj and Physik Invest manage their own capital and will not solicit others for it.
Physik Invest’s Daily Brief is read free by thousands of subscribers. Join this community to learn about the fundamental and technical drivers of markets.
Graphic updated 6:30 AM ET. Sentiment Neutral if expected /MES open is inside of the prior day’s range. /MES levels are derived from the profile graphic at the bottom of this letter. Click here for the latest levels. SqueezeMetrics Dark Pool Index (DIX) and Gamma (GEX) with the latter calculated based on where the prior day’s reading falls with respect to the MAX and MIN of all occurrences available. A higher DIX is bullish. The lower the GEX, the more (expected) volatility. Click to learn the implications of volatility, direction, and moneyness. Breadth reflects a reading of the prior day’s NYSE Advance/Decline indicator. The CBOE VIX Volatility Index (INDEX: VVIX) reflects the attractiveness of owning volatility. UMBS prices via MND. Click here for the economic calendar.
Fundamental
Bloomberg’s John Authers summarized well the release of the Federal Open Market Committee (FOMC) meeting minutes. He said that almost all officials “supported a step down in the pace of tightening by 25 basis points, while a ‘few’ favored or could have supported a bigger 50 basis-point hike. Nobody wanted to stop straightaway.”
“Participants observed that a restrictive policy stance would need to be maintained until the incoming data provided confidence that inflation was on a sustained downward path to 2%, which was likely to take some time,” the minutes said.
Graphic: Retrieved from Royal Bank of Canada (NYSE: RY).
Notwithstanding hits to markets like housing, which news has concentrated on, the S&P 500 (INDEX: SPX) is trading about 18x forward price-to-earnings, Bank of America Corporation (NYSE: BAC) said, the highest since March 2022 and 20% above the last decade’s average P/E.
Graphic: Retrieved from Bloomberg.
Per Savita Subramanian, “the traditional Rule of 20 … holds that the multiple should be whatever number results by subtracting the inflation rate from 20 — which with inflation at 6.4% would imply that the P/E needs to fall to 13.6.”
Graphic: Retrieved from Bank of America Corporation (NYSE: BAC) via Bloomberg.
Recall yesterday’s letter discussing the “risk-reward of holding bonds [looking] betterthan equity (earnings yield).”
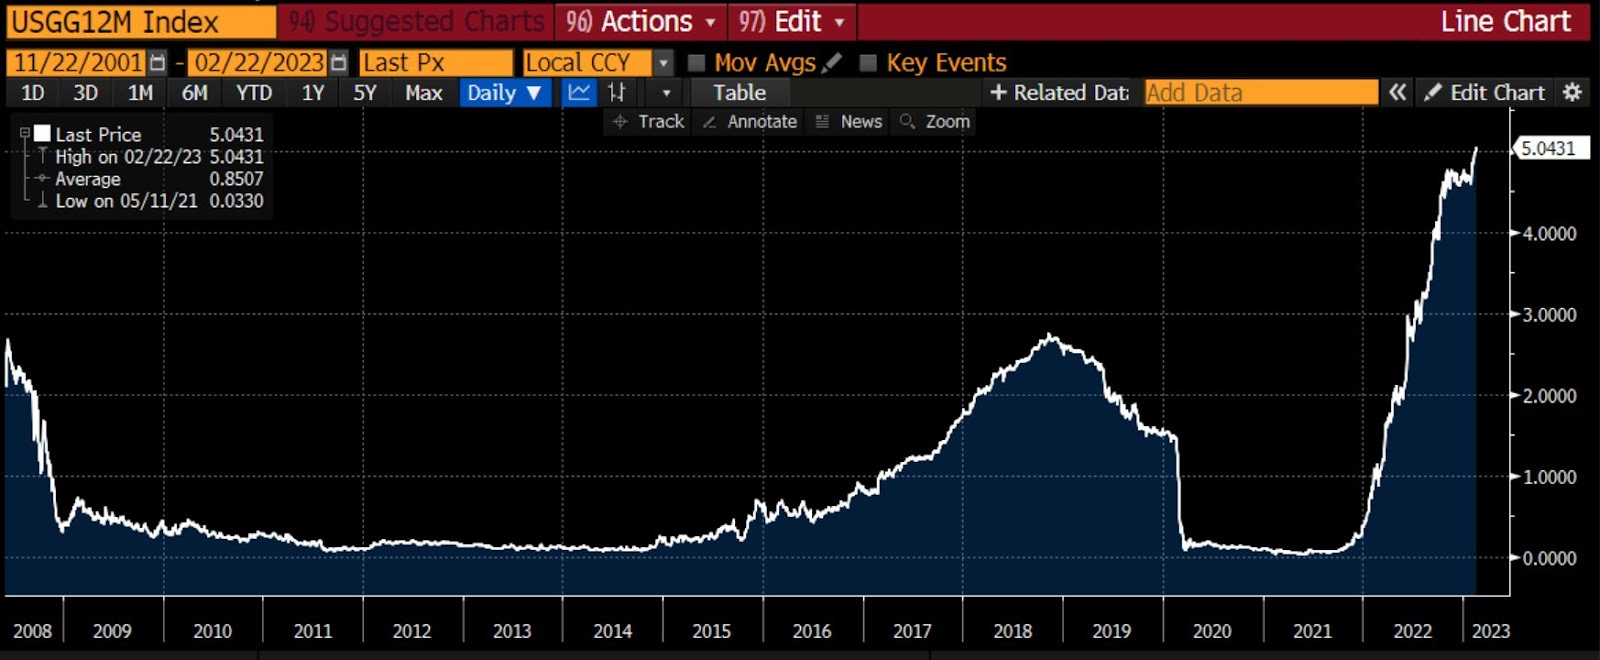
Graphic: Retrieved from Bloomberg’s Lisa Abramowicz. “Yields on 12-month T-bills have risen to their highest since 2001. Most of this has to do with Fed rate hike expectations.”
Positioning
The SPX’s decline is orderly and contained.
However, the break below $4,000.00 SPX did open the door to a “liquidity hole,” SpotGamma explained. New information has traders anticipating more equity market downside; traders are “reset[ing] to lower equity valuations” on the higher-for-longer rate narrative all the while “vanna and gamma hedging serve to pull markets lower.”
The contexts for a far-reaching rally are weak. A change in the context is likely to coincide with charged options values (i.e., wound implied volatility or big put delta).
Technical
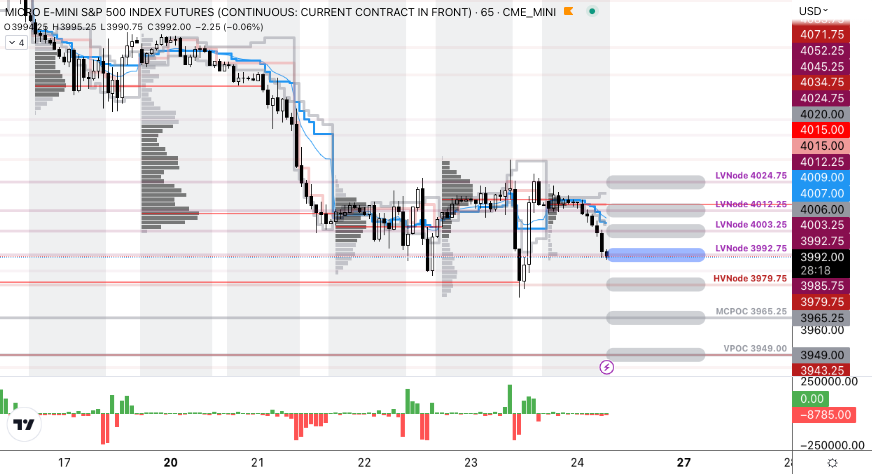
As of 6:30 AM ET, Thursday’s regular session (9:30 AM – 4:00 PM ET), in the S&P 500, is likely to open in the middle part of a positively skewed overnight inventory, inside of the prior day’s range, suggesting a limited potential for immediate directional opportunity.
The S&P 500 (FUTURE: /MES) pivot for today is $4,012.25.
Key levels to the upside include $4,024.75, $4,034.75, and $4,045.25.
Key levels to the downside include $4,003.25, $3,992.75, and $3,981.00.
Disclaimer: Click here to load the updated key levels via the web-based TradingView platform. New links are produced daily. Quoted levels likely hold barring an exogenous development.
Graphic: 65-minute profile chart of the Micro E-mini S&P 500 Futures.
Definitions
Volume Areas: Markets will build on areas of high-volume (HVNodes). Should the market trend for a period of time, this will be identified by a low-volume area (LVNodes). The LVNodes denote directional conviction and ought to offer support on any test.
If participants auction and find acceptance in an area of a prior LVNode, then future discovery ought to be volatile and quick as participants look to the nearest HVNodes for more favorable entry or exit.
Delta: An option’s exposure to the direction or underlying asset movement.
Gamma: The sensitivity of an option’s delta to changes in the underlying asset’s price.
Vanna: The rate at which the delta of an option changes with respect to implied volatility.
POCs: Areas where two-sided trade was most prevalent in a prior day session. Participants will respond to future tests of value as they offer favorable entry and exit.
About
The author, Renato Leonard Capelj, works in finance and journalism.
Capelj spends the bulk of his time at Physik Invest, an entity through which he invests and publishes free daily analyses to thousands of subscribers. The analyses offer him and his subscribers a way to stay on the right side of the market. Separately, Capelj is an options analyst at SpotGamma and an accredited journalist.
You may view this letter’s content calendar at this link.
Disclaimer
Do not construe this newsletter as advice. All content is for informational purposes. Capelj and Physik Invest manage their own capital and will not solicit others for it.
Physik Invest’s Daily Brief is read by thousands of subscribers. You, too, can join this community to learn about the fundamental and technical drivers of markets.
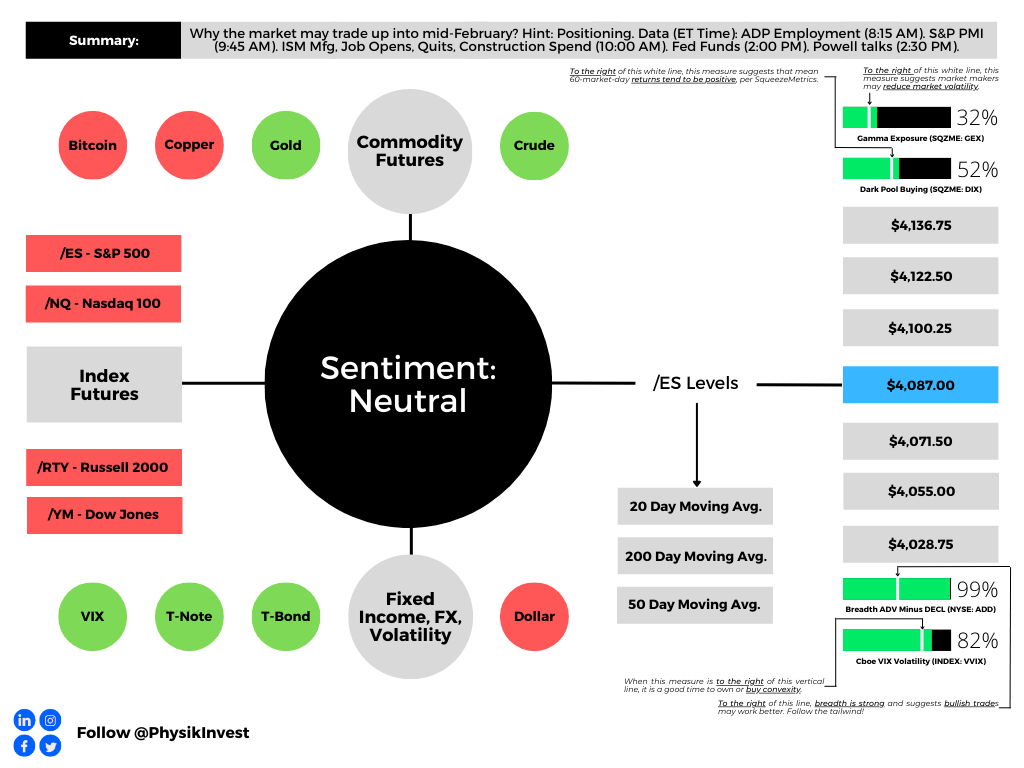
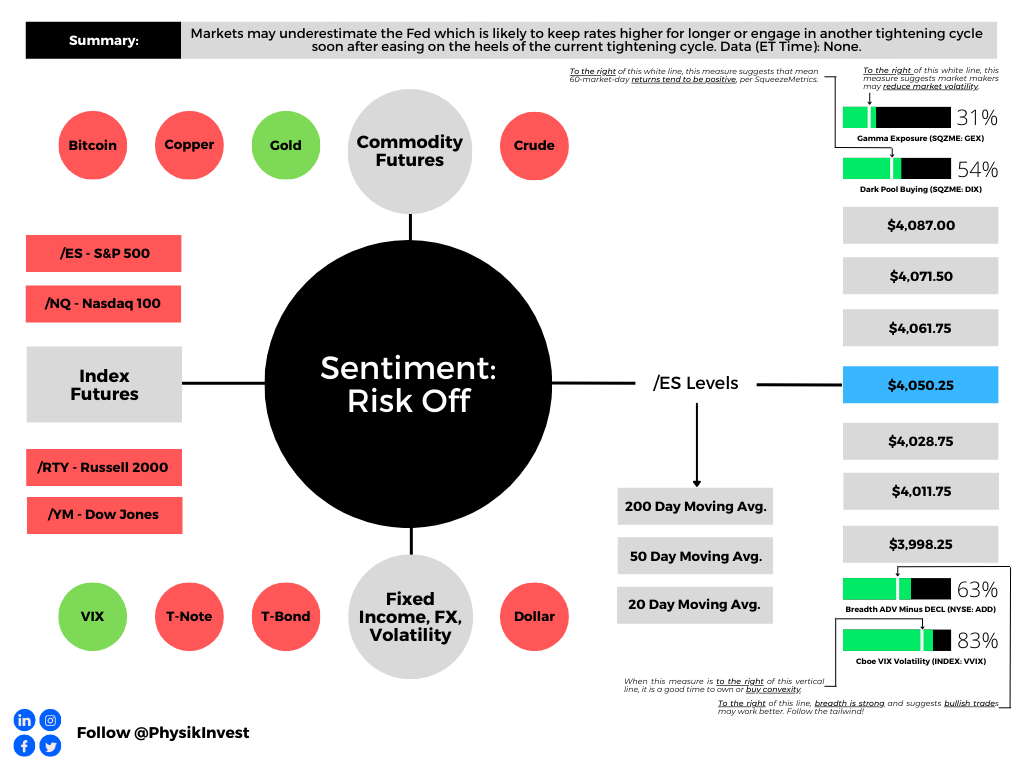
Graphic updated 8:00 AM ET. Sentiment Neutral if expected /ES open is inside of the prior day’s range. /ES levels are derived from the profile graphic at the bottom of this letter. Click here for the latest levels. SqueezeMetrics Dark Pool Index (DIX) and Gamma (GEX) with the latter calculated based on where the prior day’s reading falls with respect to the MAX and MIN of all occurrences available. A higher DIX is bullish. At the same time, the lower the GEX, the more (expected) volatility. Click to learn the implications of volatility, direction, and moneyness. Breadth reflects a reading of the prior day’s NYSE Advance/Decline indicator. The CBOE VIX Volatility Index (INDEX: VVIX) reflects the attractiveness of owning volatility.
Positioning
Markets think the Federal Reserve (Fed) raises its benchmark rate by 25 basis points. Notwithstanding the less aggressive hike, strategists believe the Fed will stay tougher on inflation for far longer and, accordingly, crush traders’ optimism.
“I suspect the Fed messaging tomorrow will push back against the pivot narrative and thereby current bond market pricing,” DoubleLine Capital CIO Jeffrey Gundlach said. Former investment banker and trader, as well as the president of the Minneapolis Fed, Neel Kashkari warned the Fed is set on finishing the job and cutting inflation, even if it costs millions of Americans their jobs. “I’ve spent enough time around Wall Street to know that they are culturally, institutionally, optimistic,” he said.
Further, relief in markets (e.g., stocks, housing) is a boon for asset owners and may enable companies to raise cash, bid up equipment prices, and demand new hires.
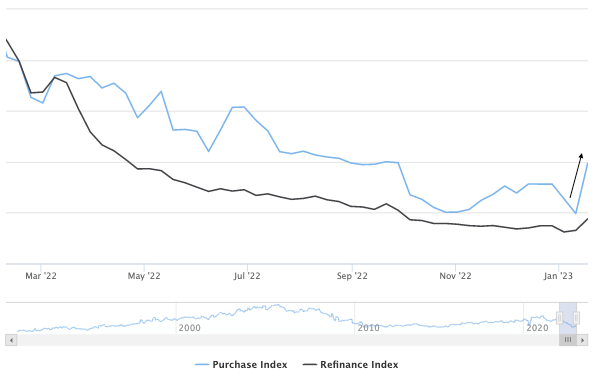
Graphic: Retrieved from Mortgage News Daily. “A trend of [increasing] purchase applications implies home buyer demand is [increasing].” The prevailing narrative is that the Fed wants less inflation and less demand. This narrative’s been disrupted, in part. Recall our Monday letter talking about investors’ desire to put their cash to work and the demand for treasuries (i.e., bond bid and yield pressured) which forced investors into previously depressed assets.
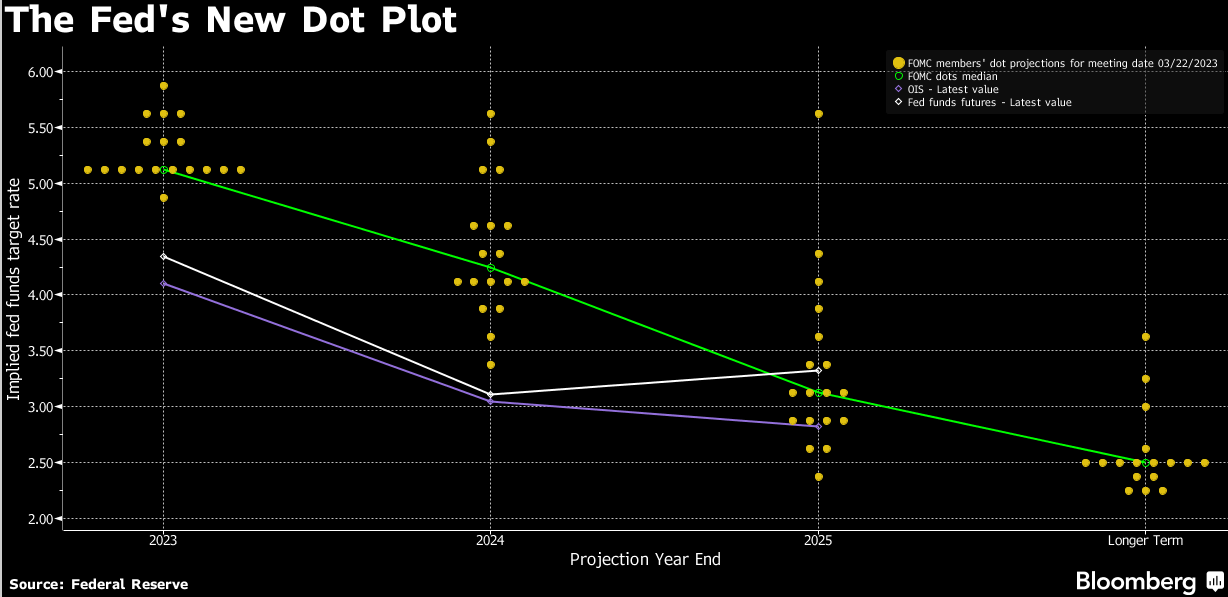
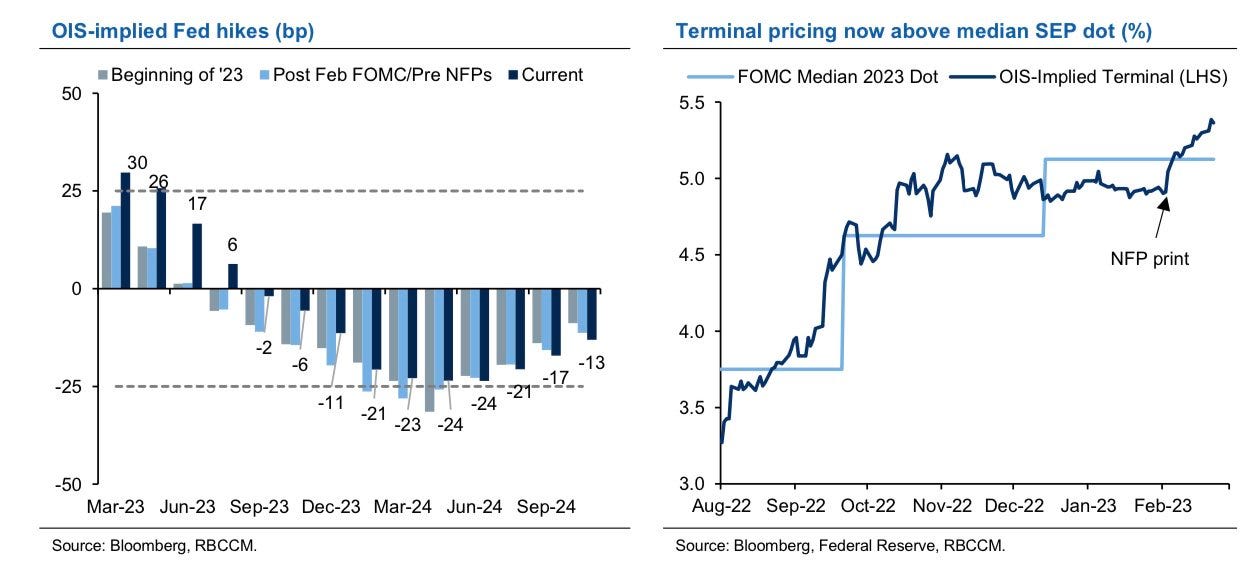
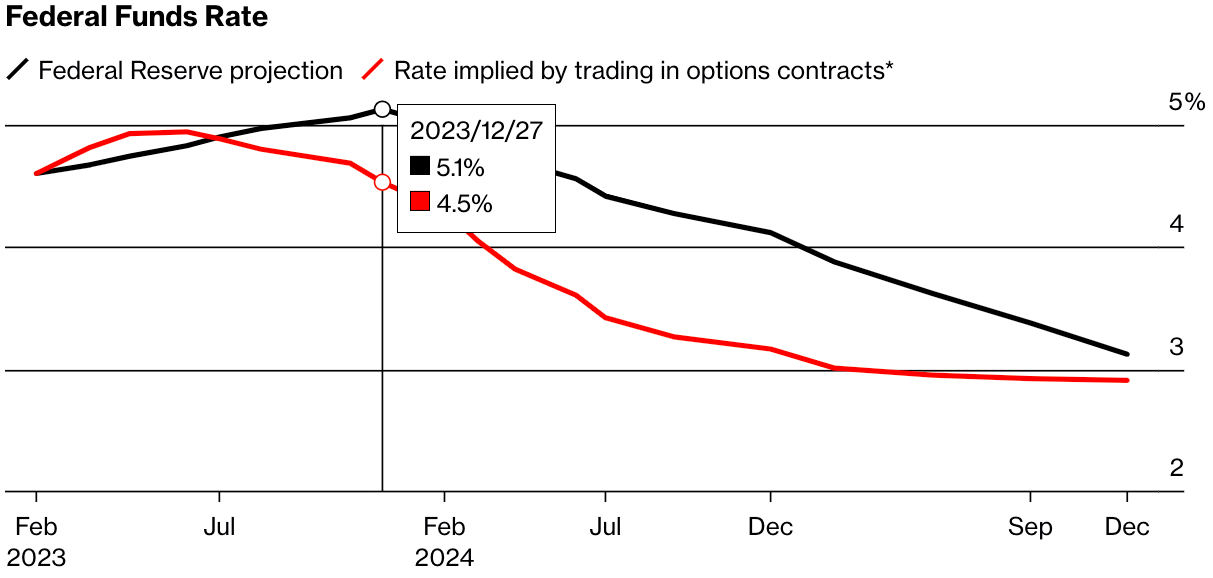
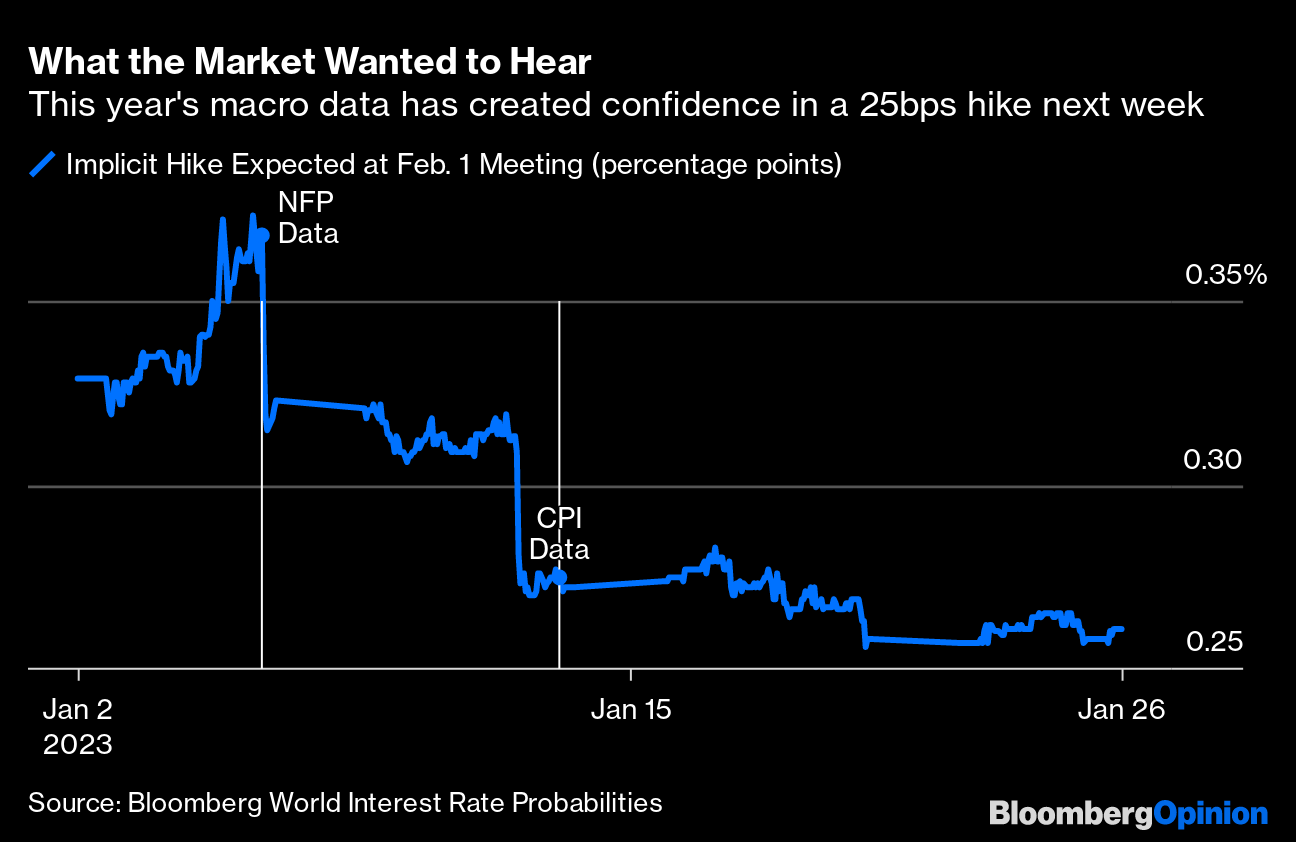
With inflation still a problem, regardless of whether there are better solutions as we put forth in the January 31 letter, the Fed is looking to keep rates above 5% for the rest of 2023, though markets are pricing a pivot far earlier and at a lower rate.
Despite the expectation of toughness from the Fed, markets have not broken down. Rather, if we zoom out, they are trending sideways to higher and may continue to do so. That’s according to Kai Volatility’s Cem Karsan who says that implied volatility (IVOL) is heightened across options with very little time to expiry (1- to 3-days).
“Event vol, which is the pricing of one-, two-, and three-day options, is significantly higher than everything else behind it right now,” he said, noting that customers’ or traders’ demands for downside put protection is the culprit. That said, despite the committee’s recent hawkishness, “the market responded relatively well at those levels, and you’re seeing vol come back down.”
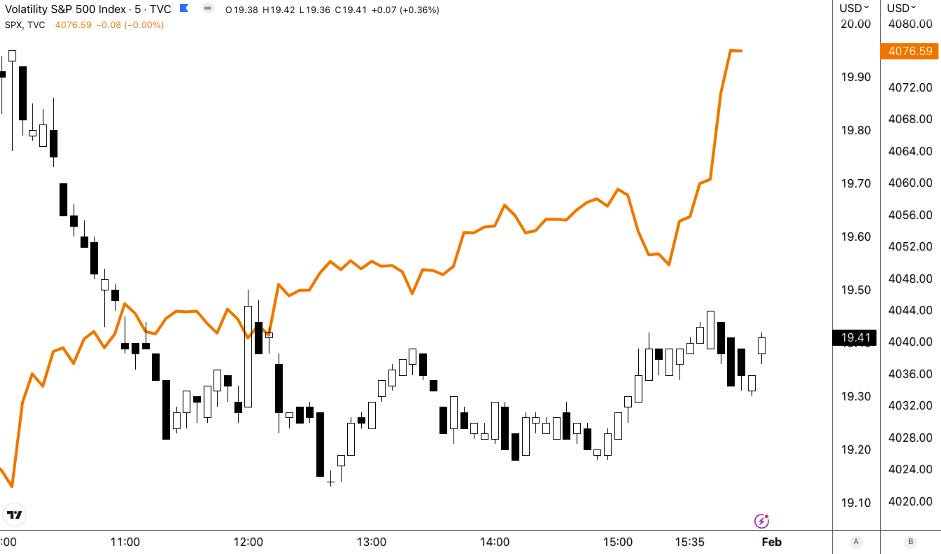
Graphic: Retrieved from TradingView. First included in SpotGamma’s PM Note for 1/31/2023. During Tuesday’s strength, measures of IVOL, such as the Cboe Volatility Index (INDEX: VIX) fell, though the VIX did not move lower in as sharp of a fashion that the S&P 500 (INDEX: SPX) traded higher. In fact, the VIX trended up into the close, after a mid-day bottom, suggesting some left-over hedging demands ahead of some important macroeconomic drivers this week.
“I think that’s kind of likely what you’re going to see, regardless of what the Fed does,” Karsan added. That’s because, barring some unexpected development, traders will not be able to justify the pricing of ultra-short-dated options post-Fed; the supply and expiry of short-dated options will coincide with the dealers or market makers who are short-stock against the puts they supplied buying back their hedges.
“Vol structurally affects how markets move. Puts are the way people hedge in the market and dealers are short the puts. If you have an event vol that comes down, those vanna and charm effects will naturally lead to a buyback,” post-Fed.
For context, vanna is the change in an options delta with respect to changes in IVOL. Charm is the change in an options delta with respect to changes in time. These are second-order derivatives of an option’s value, once to time or IVOL, and once to delta.
You might have heard the old #trading adage "never short a dull market", Cem Karsan @jam_croissant explains how some second order Greeks, vanna & charm, play a role in proving out that phrase. #Vol411pic.twitter.com/AMnd7kQQdA
As your letter writer explained in a SpotGamma analysis yesterday, we saw an interest to hedge heading into this week’s Fed announcement. This coincided with a slight rebound in measures like the Cboe VIX Volatility (INDEX: VVIX) (which, in general, reads low and suggests convexity is a good place to be), and put a damper on the rally, hence its climax on Friday.
Moreover, if “macroeconomic events do not disappoint, IVOL compression may provide markets a boost,” SpotGamma explained. “Notwithstanding, the marginal compression of heightened IVOL, because of its lower starting point, probably does less to encourage a longer-lasting rally,” hence the thought that, if there was to be relief post-Fed, it would likely last up until the mid-February monthly options expiration (OpEx). OpEx’s removal of traders’ options protection (as well as dealers’ supportive buyback to those options that were demanded), may leave the market at risk of bearish macro-type flows.
Compounding the risk is traders’ expected reaction in case of weakness. The desire to hedge during a drop would coincide with a re-pricing in IVOL dangerous to anyone who is short volatility, hence this letter’s recent focus on owning the S&P 500 (INDEX: SPX) via call butterflies and call ratio spreads, the sorts of trades that would benefit from an SPX and VIX up environment (the result of traders bidding up call options due to their fear of missing out, in the context of less liquidity to absorb those demands).
To summarize everything, we have the Fed rate decision coming up. After, markets will be volatile but more likely to trend higher into mid-February, bolstered by traders’ fears of missing out in the context of a lower liquidity environment, as well as stimulus (e.g., falling Treasury General Account played into an easing of financial conditions by making it easier for banks to lend and finance trading activities). After mid-February, the window for markets to weaken and accelerate to the downside may open, based on the information we have today.
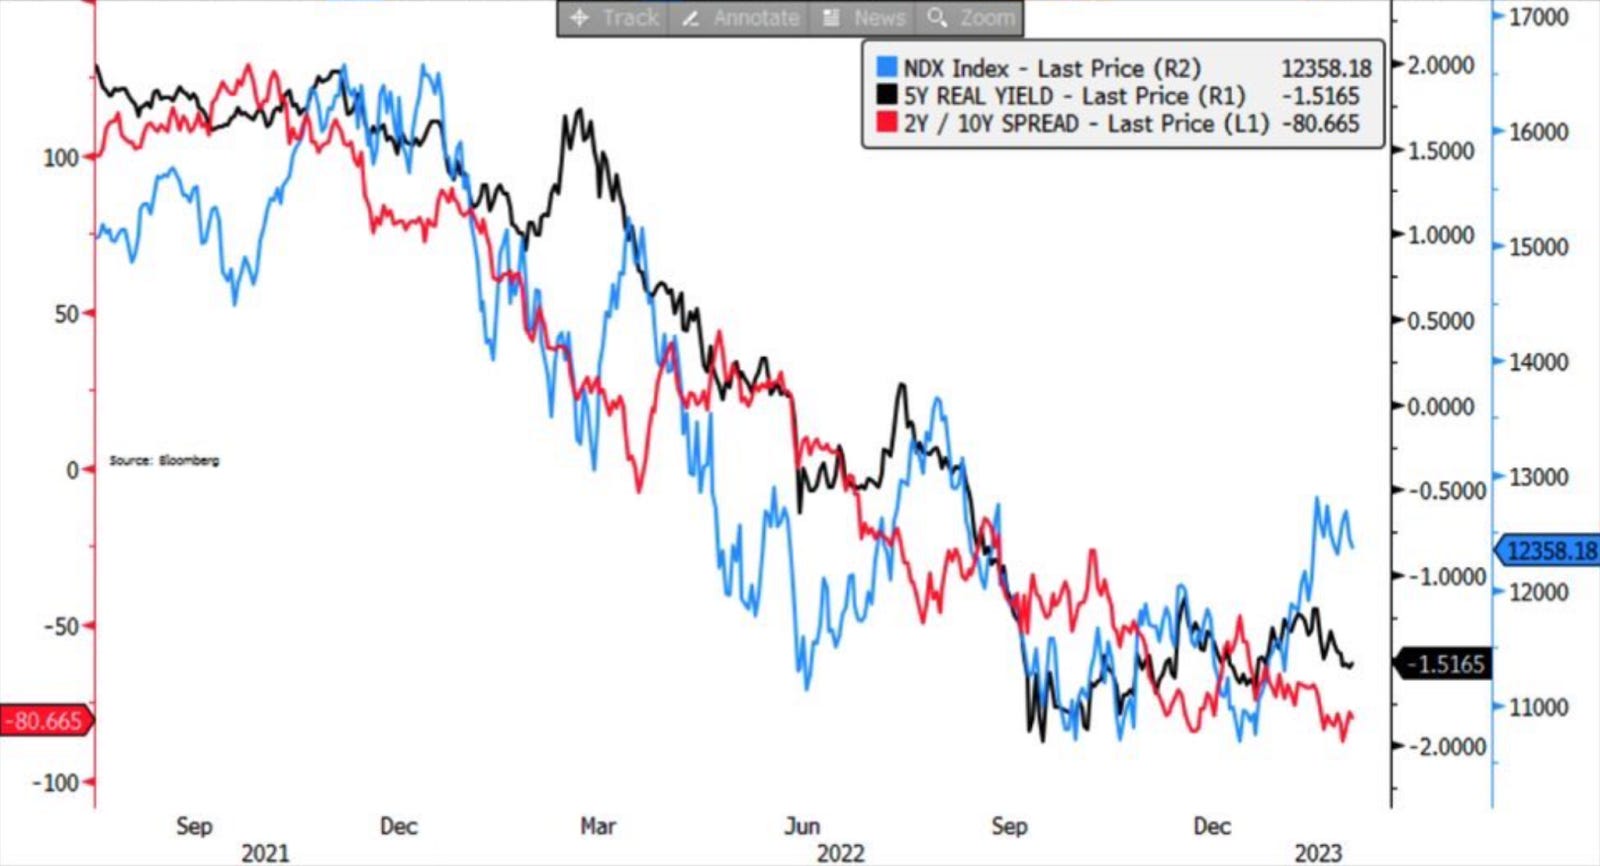
As an aside, the last time the Nasdaq 100 (INDEX: NDX) was up more than 10% in January was in 2001, The Market Ear informed subscribers yesterday.
Graphic: Retrieved from BNP Paribas ADR (OTC: BNPQY) via The Market Ear.
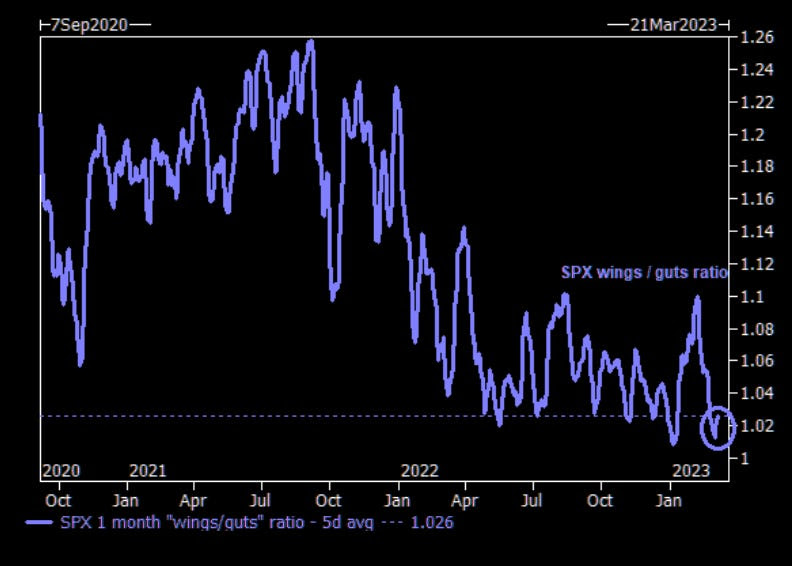
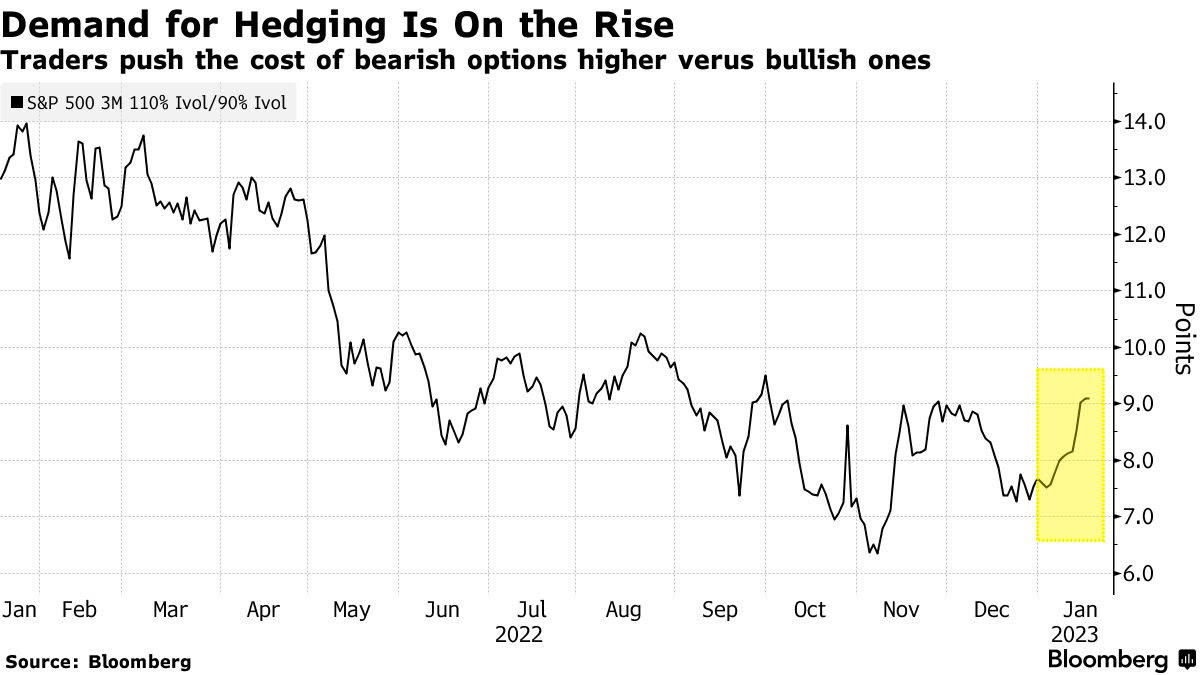
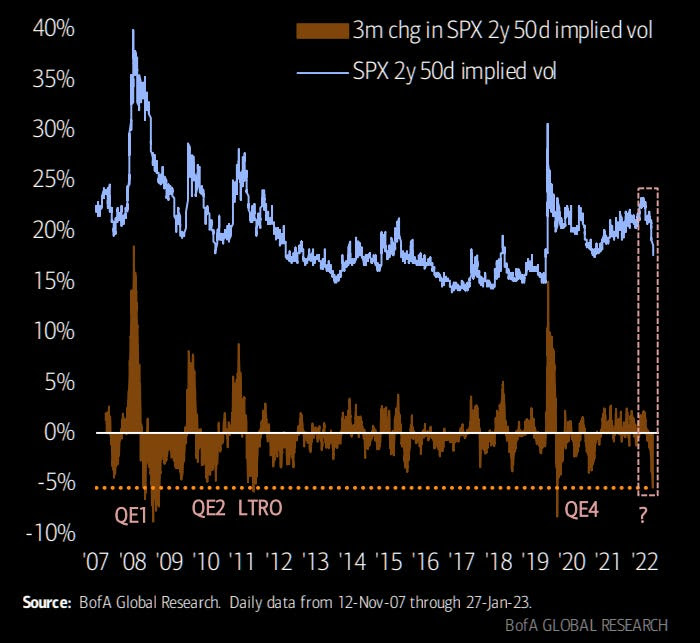
Should you wish to hedge, longer-dated SPX IVOL is cheap, relative to recent history.
Graphic: Retrieved from Bank of America Corporation (NYSE: BAC) via The Market Ear.
Finally, if you’re interested in following further along the fundamental conversation in Tuesday’s letter, check out Dr. Pippa Malmgren’s post on “ancient empires springing back to life.”
Technical
As of 8:00 AM ET, Wednesday’s regular session (9:30 AM – 4:00 PM ET), in the S&P 500, is likely to open in the middle part of a negatively skewed overnight inventory, inside of the prior range, suggesting a limited potential for immediate directional opportunity.
The S&P 500 pivot for today is $4,087.00.
Key levels to the upside include $4,100.25, $4,122.50, and $4,136.75.
Key levels to the downside include $4,071.50, $4,055.00, and $4,028.75.
Disclaimer: Click here to load the updated key levels via the web-based TradingView platform. New links are produced daily. Quoted levels hold weight barring an exogenous development.
Graphic: 65-minute profile chart of the Micro E-mini S&P 500 Futures.
Definitions
Volume Areas: Markets will build on areas of high-volume (HVNodes). Should the market trend for a period of time, this will be identified by a low-volume area (LVNodes). The LVNodes denote directional conviction and ought to offer support on any test.
If participants auction and find acceptance in an area of a prior LVNode, then future discovery ought to be volatile and quick as participants look to the nearest HVNodes for more favorable entry or exit.
POCs: Areas where two-sided trade was most prevalent in a prior day session. Participants will respond to future tests of value as they offer favorable entry and exit.
About
In short, Renato Leonard Capelj is an economics graduate working in finance and journalism.
Capelj spends most of his time as the founder of Physik Invest through which he invests and publishes daily analyses to subscribers, some of whom represent well-known institutions.
Separately, Capelj is an equity options analyst at SpotGamma and an accredited journalist interviewing global leaders in business, government, and finance.
Physik Invest’s Daily Brief is read by thousands of subscribers. You, too, can join this community to learn about the fundamental and technical drivers of markets.
Graphic updated 8:45 AM ET. Sentiment Risk-Off if expected /ES open is below the prior day’s range. /ES levels are derived from the profile graphic at the bottom of this letter. Click here for the latest levels. SqueezeMetrics Dark Pool Index (DIX) and Gamma (GEX) with the latter calculated based on where the prior day’s reading falls with respect to the MAX and MIN of all occurrences available. A higher DIX is bullish. At the same time, the lower the GEX, the more (expected) volatility. Click to learn the implications of volatility, direction, and moneyness. Breadth reflects a reading of the prior day’s NYSE Advance/Decline indicator. The CBOE VIX Volatility Index (INDEX: VVIX) reflects the attractiveness of owning volatility.
Fundamental
Since the start of 2023, markets have trended higher. This has coincided with traders’ expectations that inflation has peaked and the pace of tightening should slow or peak soon, China re-opening, and the aversion of an energy crisis abroad, given a warmer-than-expected winter.
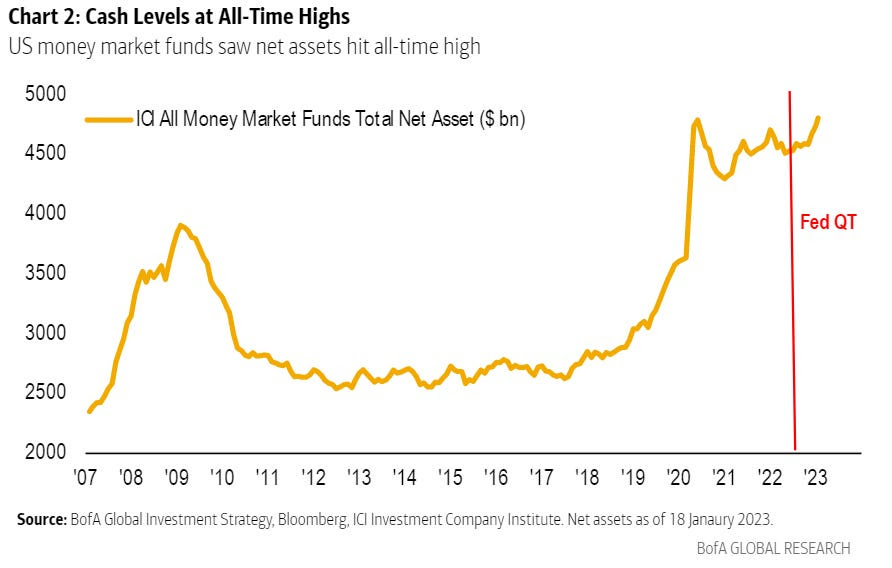
Investors continue to sit on a lot of cash, at this time.
Graphic: Retrieved from Bank Of America Corporation (NYSE: BAC) via Bloomberg.
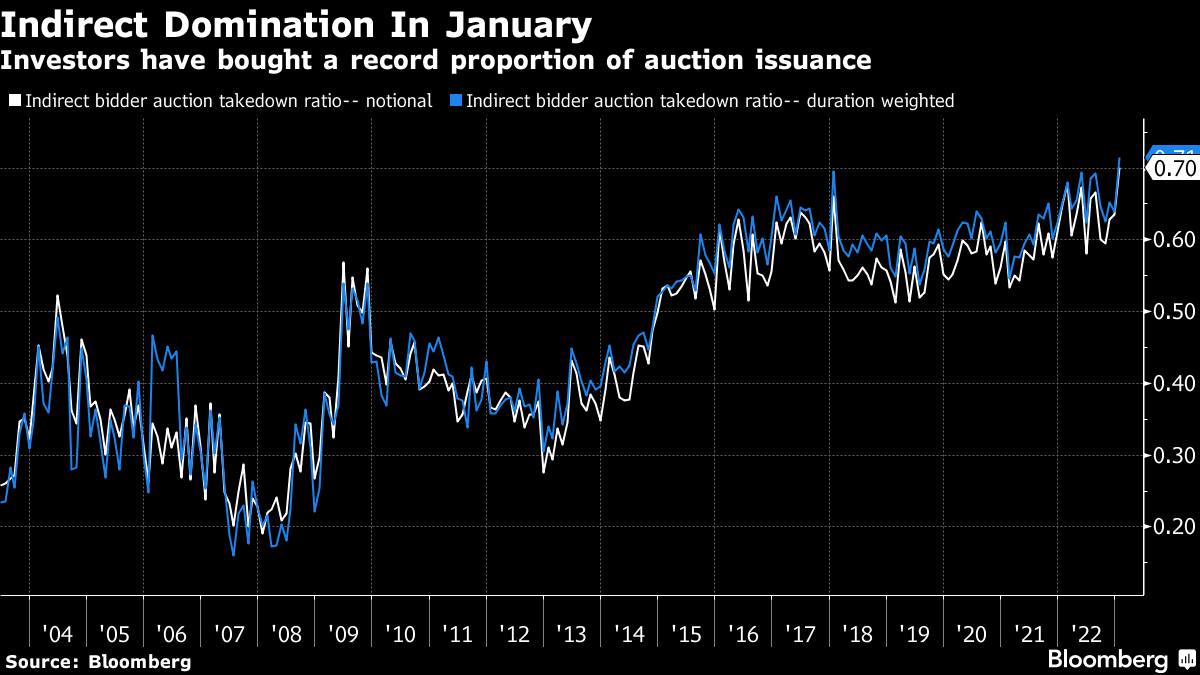
Some, in their desire to put their cash to work, have demanded Treasuries.
Graphic: Retrieved from Bloomberg. “Each of the Treasury auctions this month were awarded at a yield lower than expected based on pre-sale trading, known as ‘stopping through’ — meaning that demand was strong. Primary dealers (who are obligated to bid) in Thursday’s $35 billion offering of seven-year notes picked up just 6.1% of the securities, the smallest in any Treasury note or bond auction in data going back to 2003.”
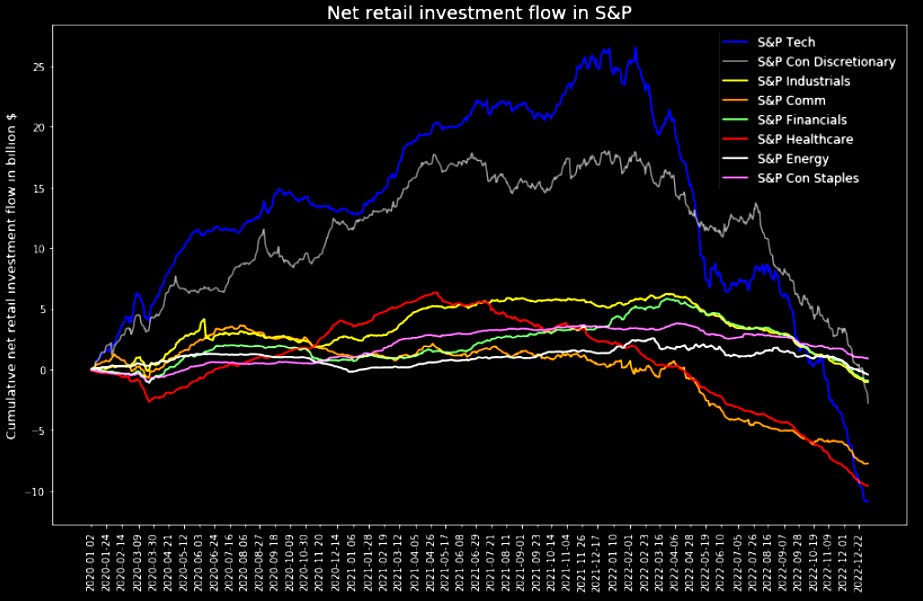
Strong demand during Treasury auctions (i.e., bond bid and yield pressured), as some suggest, is forcing investors into previously depressed equities which Goldman Sachs Group Inc (NYSE: GS) showed investors selling heavily leading up to 2023.
Graphic: Retrieved from Goldman Sachs Group Inc (NYSE: GS) via The Market Ear.
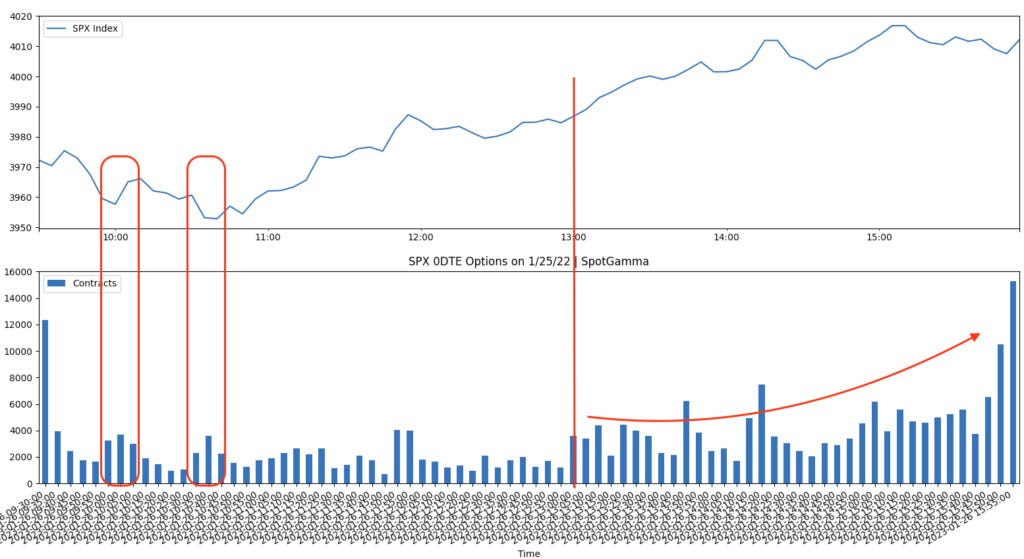
In fact, Treasury auctions have coincided with big demand for short-dated exposure to call options and short-covering.
Graphic: Retrieved from SpotGamma’s Weekend Note. “Last week’s bullishness appeared to be bolstered by very strong treasury auctions, which ignited the trade of short-dated (i.e., 0 DTE) call options. You can see this relationship in the image below wherein large 0DTE options flow (bottom) were triggered by the 1 PM ET treasury auction (red vertical line).”
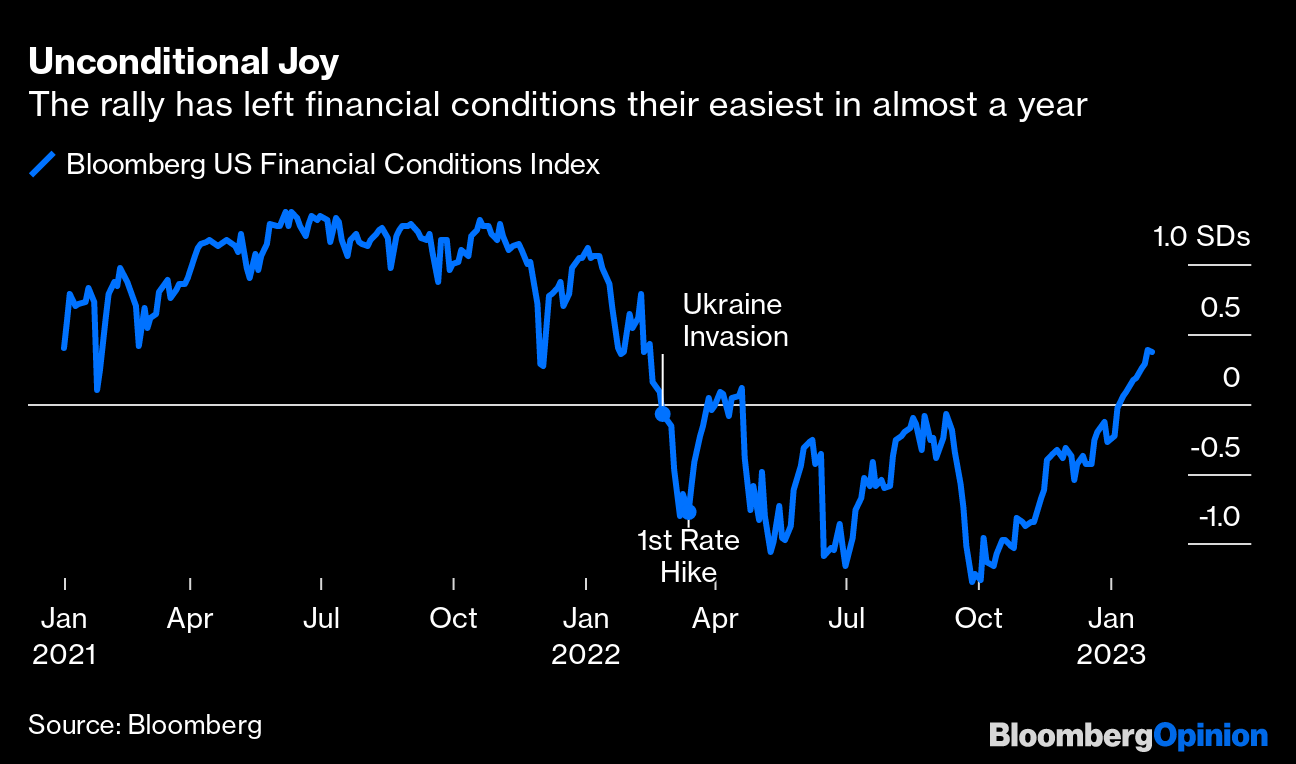
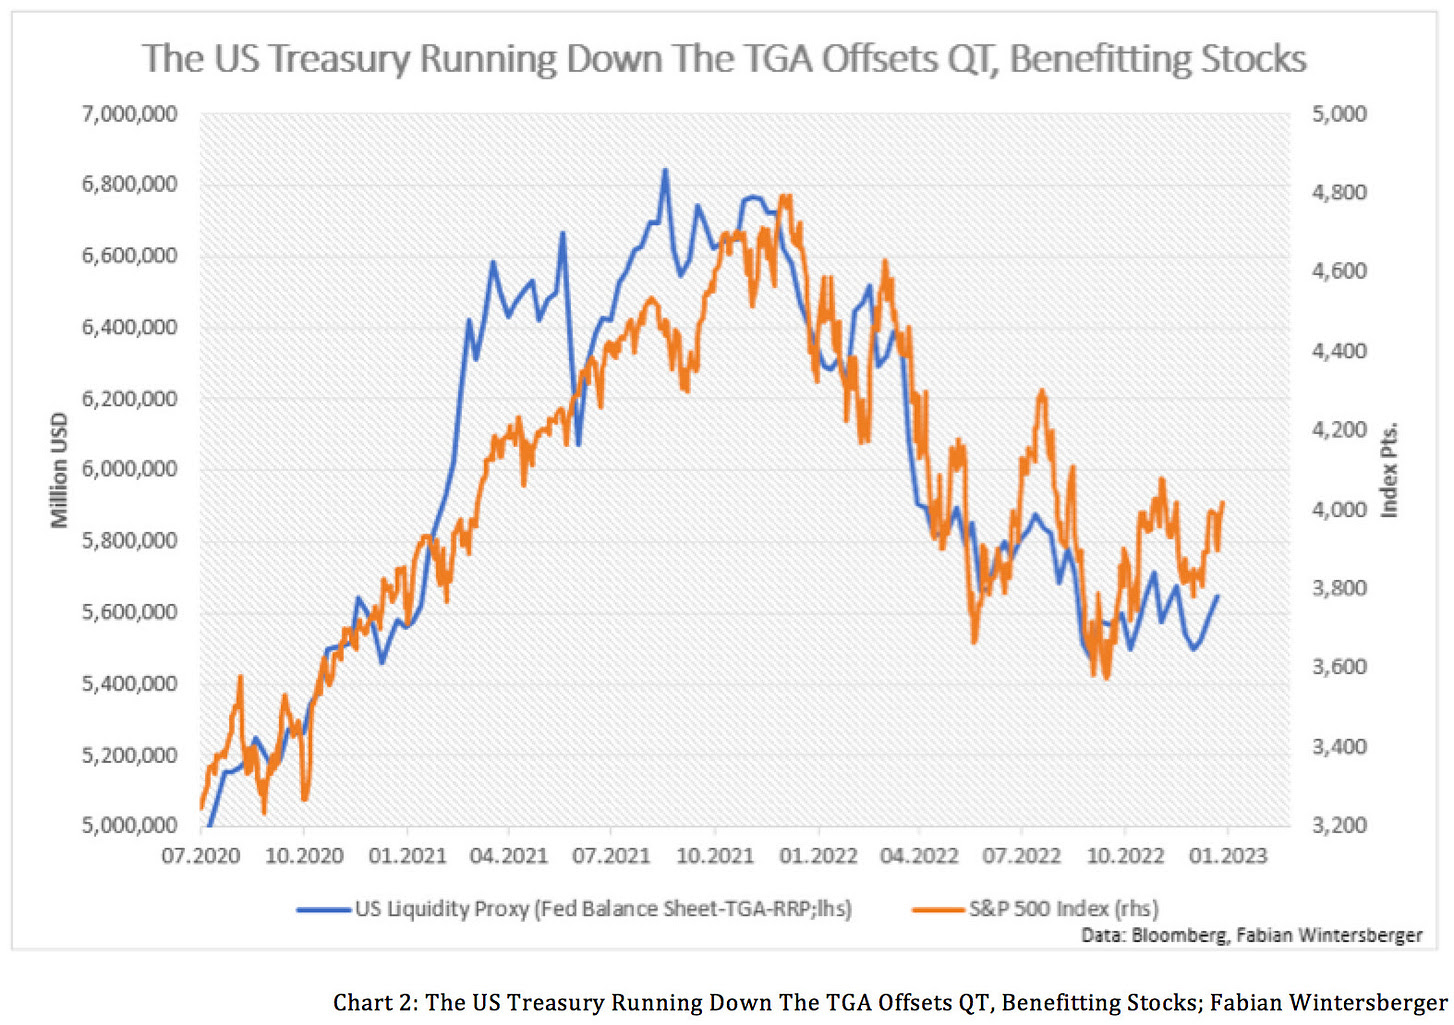
Additionally, the markets have enjoyed a liquidity boost, also a driver of equity market relief. The Treasury General Account (TGA), or the government’s checking account, if we will, was driven down and played into an easing of financial conditions which has benefitted stocks.
Per past letters, we note that a falling TGA is likely to be accompanied by a rise in bank reserves (liabilities to the Fed), increasing the room banks have to lend and finance trading activities which add to market liquidity. This added market liquidity, some suggest, is due to the debt ceiling. Consequently, once a debt ceiling deal is signed, run for the hills!
Graphic: Retrieved from Fabian Wintersberger. “One driving factor is the US is facing its debt ceiling (again). Hence, the US treasury needs to run off its Treasury General Account, which injects liquidity into markets from which stock markets benefit.”
“[T]he single most important driver of equities over the last year has been excess liquidity, and it’s about to turn more restrictive. The amount of liquidity in the system is about to change again – the Treasury is increasing bill issuance sizes, which will drain liquidity from the system. The Treasury could build cash by more than $200 billion over the span of a month – which on top of QT will effectively drain nearly $300 billion from bank reserves – which implies the S&P 500 should be 6% lower over the net month.”
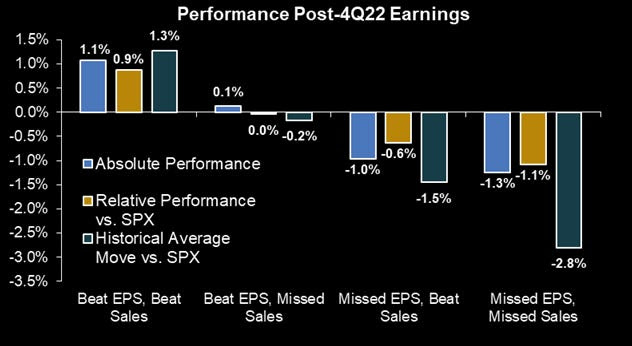
Anyways, strategists think markets are underestimating the Fed which is likely to keep rates higher for longer. There are not enough restrictions to reduce inflation. This would ultimately boost capital costs, leading to earnings misses and lower EPS.
Graphic: Retrieved from Morgan Stanley (NYSE: MS) via The Market Ear. “[M]isses, both on revenue and margin, were not punished as much as they have been historically.”
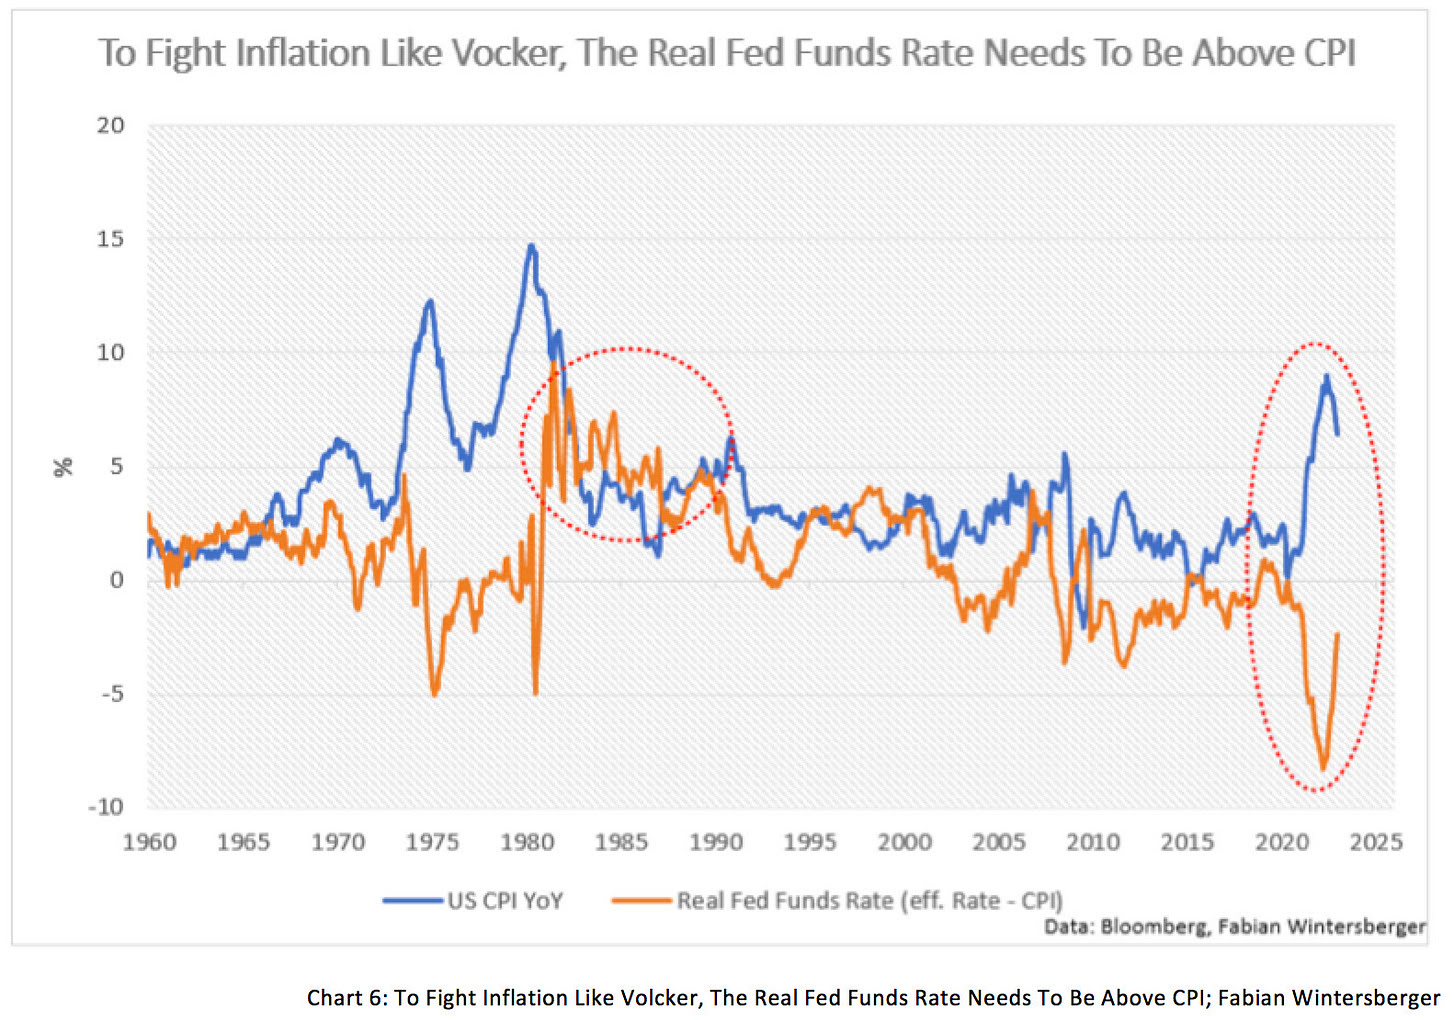
If this market strength is, in part, the result of a so-called front-running of the Fed’s pivot from tightening, either the failure to realize a pivot or an eventual pivot may be followed by the markets selling (i.e., buy the rumor and sell the news scenario).
Graphic: Retrieved from Fabian Wintersberger. “Neither the ECB nor the Fed is restrictive enough to bring inflation back to 2 %. A look at the Volcker era shows that it is necessary to increase real interest rates above the inflation rate for a prolonged period to achieve that.”
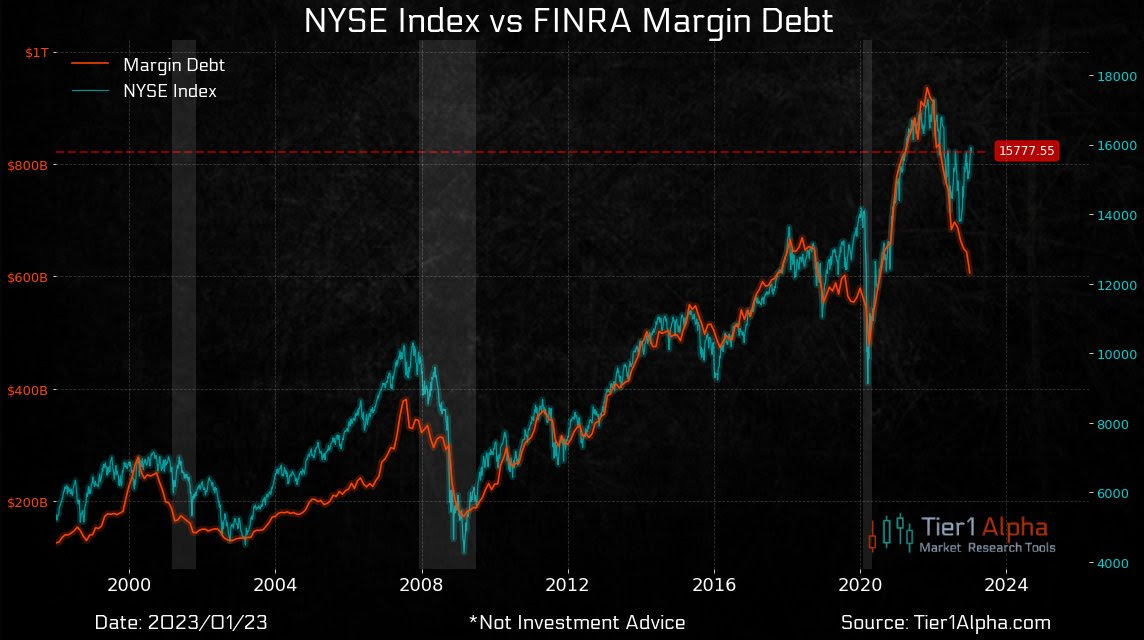
A chart to tack on here at the end of the section is FINRA margin debt versus the S&P 500 (INDEX: SPX). In short, this measure is not supportive of the move up in stocks. More on this sometime later. Take care!
Graphic: Retrieved from Tier1Alpha via Callum Thomas.
Technical
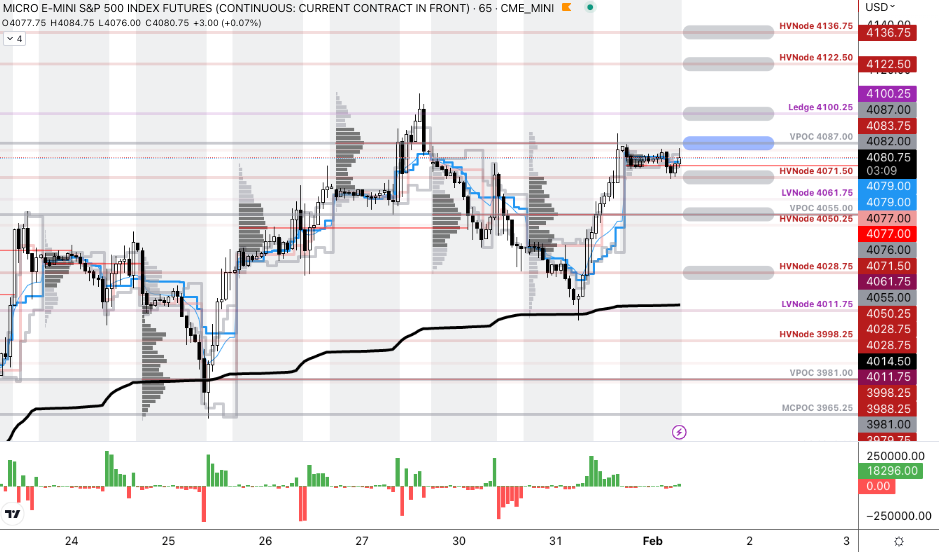
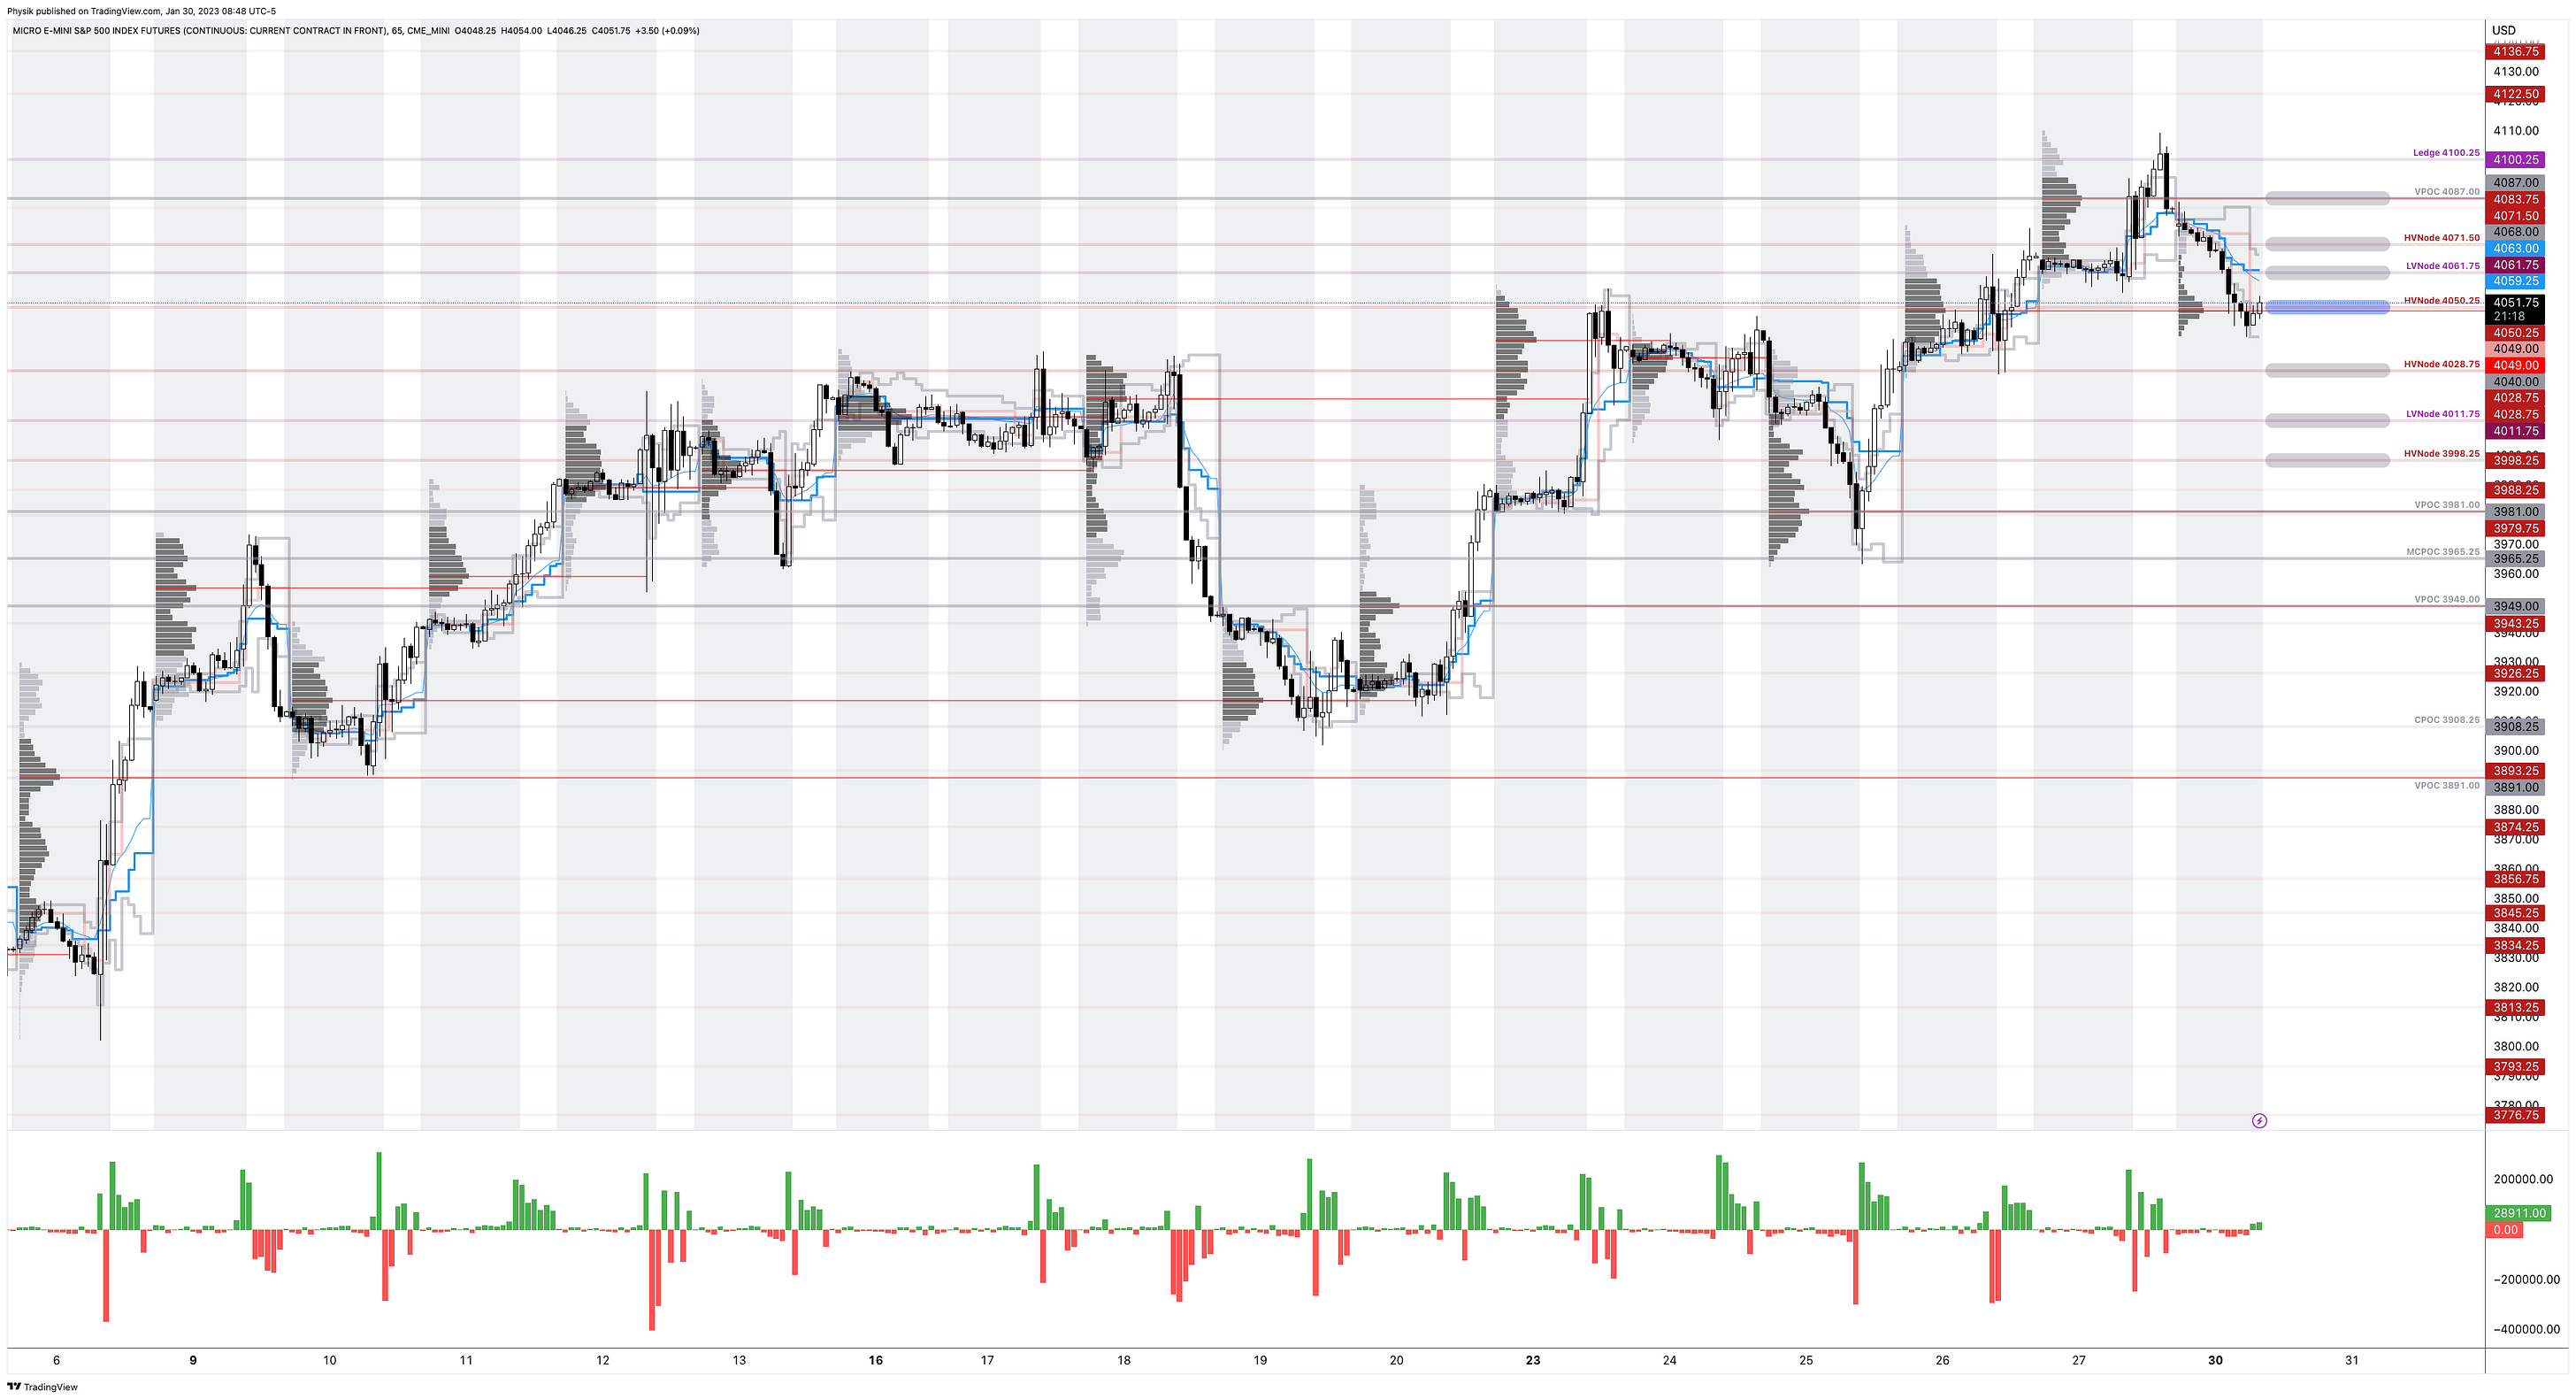
As of 8:45 AM ET, Monday’s regular session (9:30 AM – 4:00 PM ET), in the S&P 500, is likely to open in the lower part of a negatively skewed overnight inventory, outside of the prior range, suggesting a potential for immediate directional opportunity.
The S&P 500 pivot for today is $4,050.25.
Key levels to the upside include $4,061.75, $4,071.50, and $4,087.00.
Key levels to the downside include $4,028.75, $4,011.75, and $3,998.25.
Disclaimer: Click here to load the key levels via the TradingView platform. New links are produced daily. Quoted levels hold weight barring exogenous event.
Graphic: 65-minute profile chart of the Micro E-mini S&P 500 Futures.
Definitions
Volume Areas: Markets will build on areas of high-volume (HVNodes). Should the market trend for a period of time, this will be identified by a low-volume area (LVNodes). The LVNodes denote directional conviction and ought to offer support on any test.
If participants auction and find acceptance in an area of a prior LVNode, then future discovery ought to be volatile and quick as participants look to the nearest HVNodes for more favorable entry or exit.
POCs: Areas where two-sided trade was most prevalent in a prior day session. Participants will respond to future tests of value as they offer favorable entry and exit.
About
In short, Renato Leonard Capelj is an economics graduate working in finance and journalism.
Capelj spends most of his time as the founder of Physik Invest through which he invests and publishes daily analyses to subscribers, some of whom represent well-known institutions.
Separately, Capelj is an equity options analyst at SpotGamma and an accredited journalist interviewing global leaders in business, government, and finance.