Categories
Commentary

Weekly Brief For July 18, 2021

Market Commentary

Key Takeaways: Equity index futures spike lower in their attempt to discover fair prices for two-sided trade.

  • COVID, waning stimulus cloud outlook.
  • Ahead: Housing and employment data.
  • Indices diverge; breadth, inflows lower.

What Happened: U.S. stock index futures auctioned sideways to lower.

The drop wasn’t entirely uncalled for. 

Into the seasonally-aligned price rise led by the Nasdaq 100 and S&P 500, inflows decelerated and breadth weakened

At the same time, a measure of inflation – via the Consumer Price Index (CPI) – rose the largest since the Global Financial Crisis. In response, the 5s30s curve resumed its flattening and the 10-year U.S. Treasury yield ended little changed.
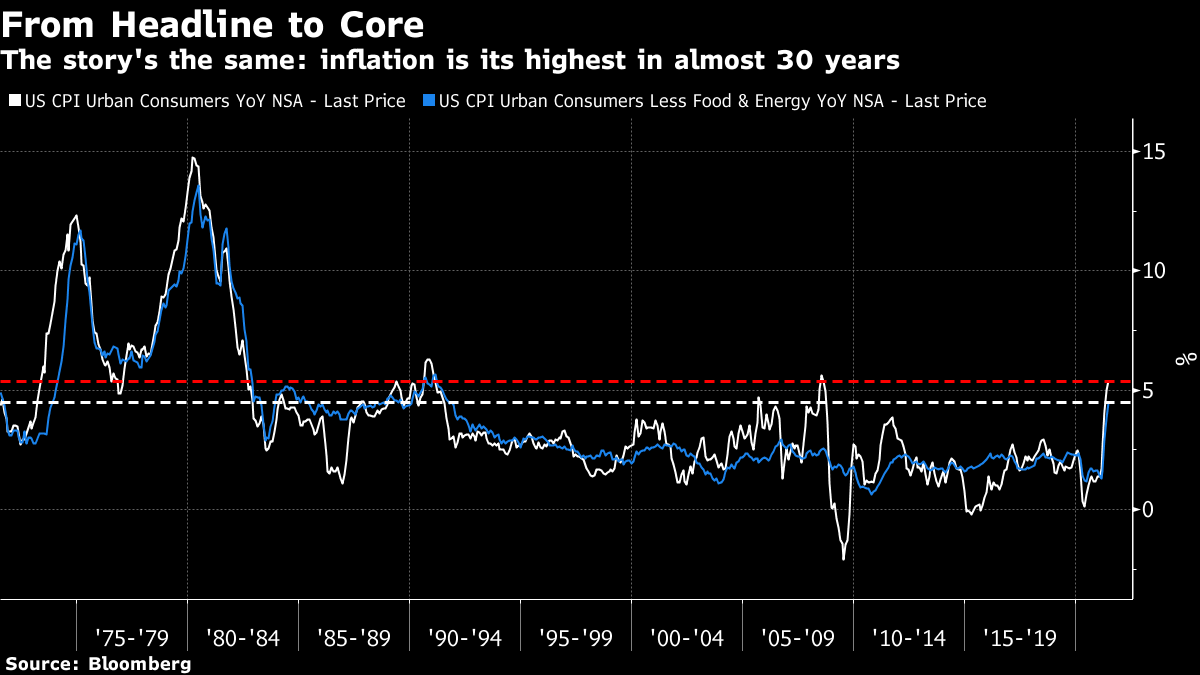
Graphic: Inflation at its highest in almost 30 years via Bloomberg.

Simply put, it’s likely that bond market participants shrugged off the data and an acceleration in inflation will be temporary.

Still, yields could become further depressed due in part to fundamental and technical factors – issuance, short coverings, a fading reflation trade, peak growth – as well as the August 1 reinstatement of the U.S. debt limit.

“[I]f Congress idly stands by, the Treasury will eventually hit the debt limit on October 18. The consequences would be severe,” Moody’s strategists believe. Michael A. Gayed of the Lead-Lag Report adds the odds of a rating downgrade increase, as a result, also.

Moody’s concludes: “[T]apering earlier than the markets are pricing would risk causing yields to jump when some of the technical drags are easing.”
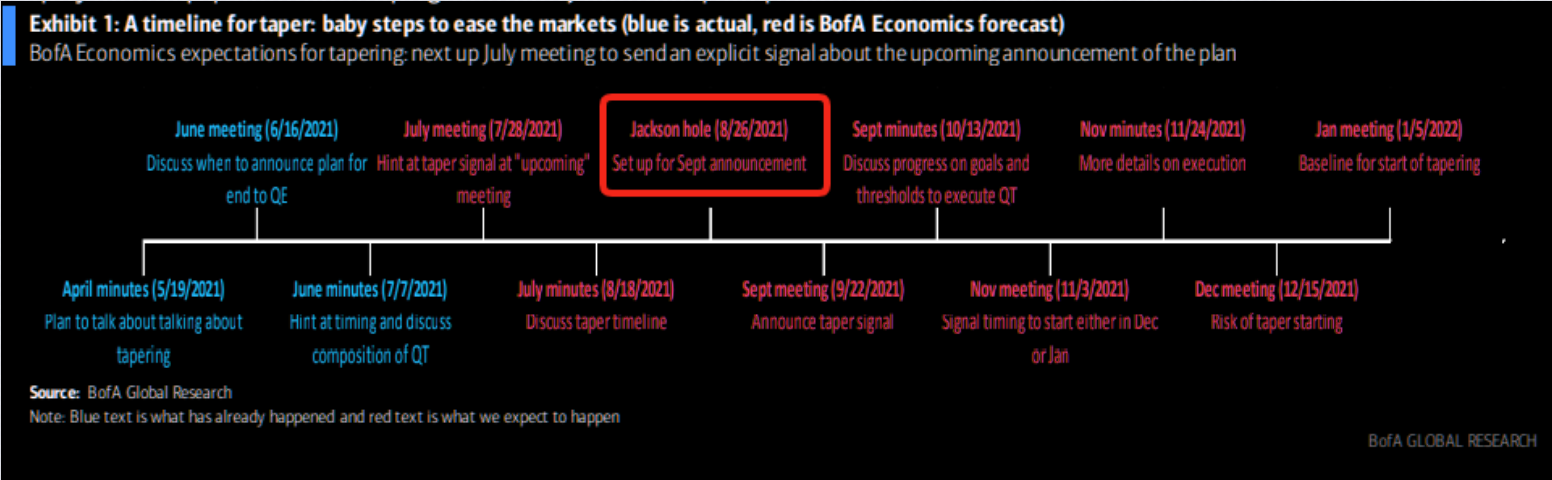
Graphic: Bank of America Corp’s (NYSE: BAC) timeline for taper via The Market Ear

Adding, since inflation and rates move inversely to each other, a mistimed bump in rates – alongside increased nervousness over a COVID-19 resurgence and fading fiscal stimulus – would potentially take away from the commitment to keep inflation expectations closer to the Federal Reserve’s 2%-plus target.

In all, in support of the Fed’s target, COVID-19 must not become a problem, and the Biden administration, alongside Congress, must come to terms on another fiscal package – a few trillion in size – that looks to extend the Treasury debt ceiling.

As unemployment declines and labor force participation increases, expectations of rate normalization will solidify. This is a boon for beta sectors, according to JPMorgan Chase & Co’s (NYSE: JPM) Marko Kolanovic.

Considerations: Investment bank and financial services company Morgan Stanley (NYSE: MS) believes downside risks are compounded by equity and bond positioning, low short interest, and the involvement of systemic strategies which could intensify a sell-off.
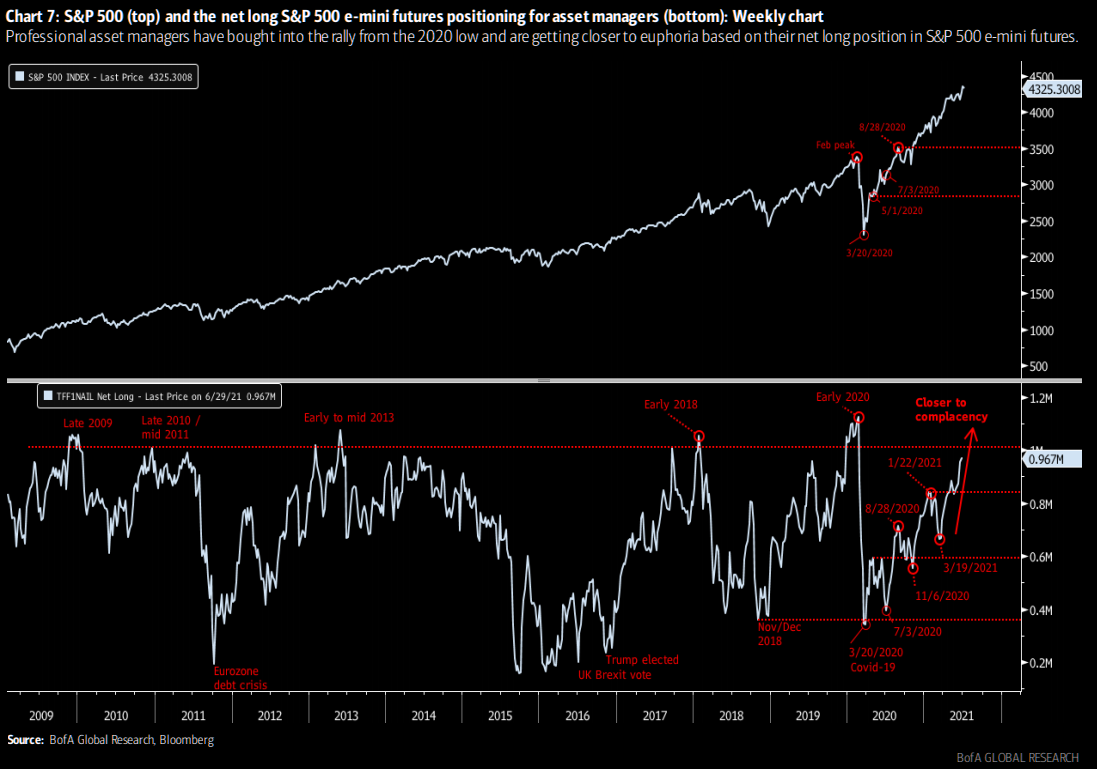
Graphic: Bank of America Corp (NYSE: BAC) chart on futures positioning via The Market Ear.

MS says CTAs are still short bonds which, according to CityWire, could continue the bond rally, pressuring stocks as investors “fear the bond market may know[] something they don’t.”

Add the passage of the July options expiration (OPEX), the window for the aforementioned dynamics (alongside a shift in preferences from saving and investing to spending, monetary tightening, seasonality, as well as a COVID-19 resurgence) to take over is opened.

After OPEX, according to SpotGamma, “the market tends to experience its largest intraday volatility which corresponds to the reduction in large options positions, and the hedging associated with them.”
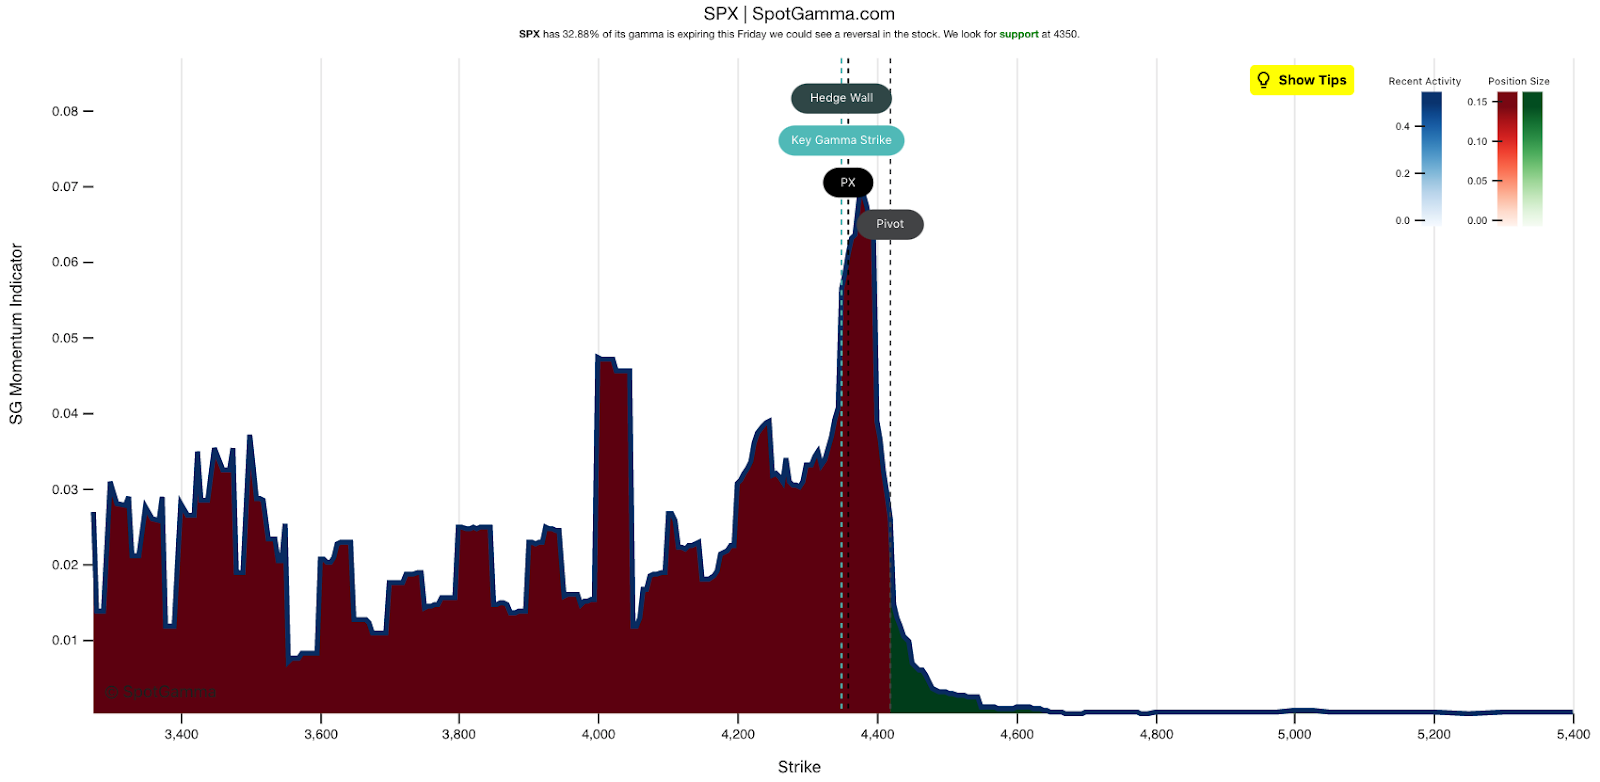
Graphic: SpotGamma’s EquityHub showed 30% of the S&P 500’s gamma expiring July 16 which, as SpotGamma has said in the past, “creates volatility because, as large options positions expire[], are closed and/or rolled, dealers have large hedges they need to adjust.”

What To Expect: In the coming sessions, participants will want to focus their attention on where the S&P 500 trades in relation to the $4,334.25 spike base.

Spikes: Spike’s mark the beginning of a break from value. Spikes higher (lower) are validated by trade at or above (below) the spike base (i.e., the origin of the spike).

In the best case, the S&P 500 trades sideways or higher; activity above $4,334.25 puts in play the $4343.00 VPOC. Trade beyond that signposts may then put in play the $4,346.75 HVNode – which corresponds with two anchored Volume Weighted Average Prices (VWAPs). 

POCs: POCs are valuable as they denote areas where two-sided trade was most prevalent. Participants will respond to future tests of value as they offer favorable entry and exit. 

More On Volume-Weighted Average Prices (VWAPs): A metric highly regarded by chief investment officers, among other participants, for quality of trade. Additionally, liquidity algorithms are benchmarked and programmed to buy and sell around VWAPs.

Volume Areas: A structurally sound market will build on past areas of high volume. Should the market trend for long periods of time, it will lack sound structure (identified as a low volume area which denotes directional conviction and ought to offer support on any test). 

If participants were to auction and find acceptance into areas of prior low volume, then future discovery ought to be volatile and quick as participants look to areas of high volume for favorable entry or exit.

If higher, entry into an overhead supply area, above the $4,357.75 low volume area (LVNode), portends continuation to the $4,371.00 VPOC and$4,384.50 RTH High. 

In the worst case, the S&P 500 trades lower; activity below $4,334.25 puts in play the $4,314.75 high volume area (HVNode). Initiative trade beyond $4,314.75 could reach as low as the $4,297.00 HVNode. Closeby is the $4,291.00 VPOC and $4,285.00 composite HVNode.

Graphic: 65-minute profile chart of the Micro E-mini S&P 500 Futures.
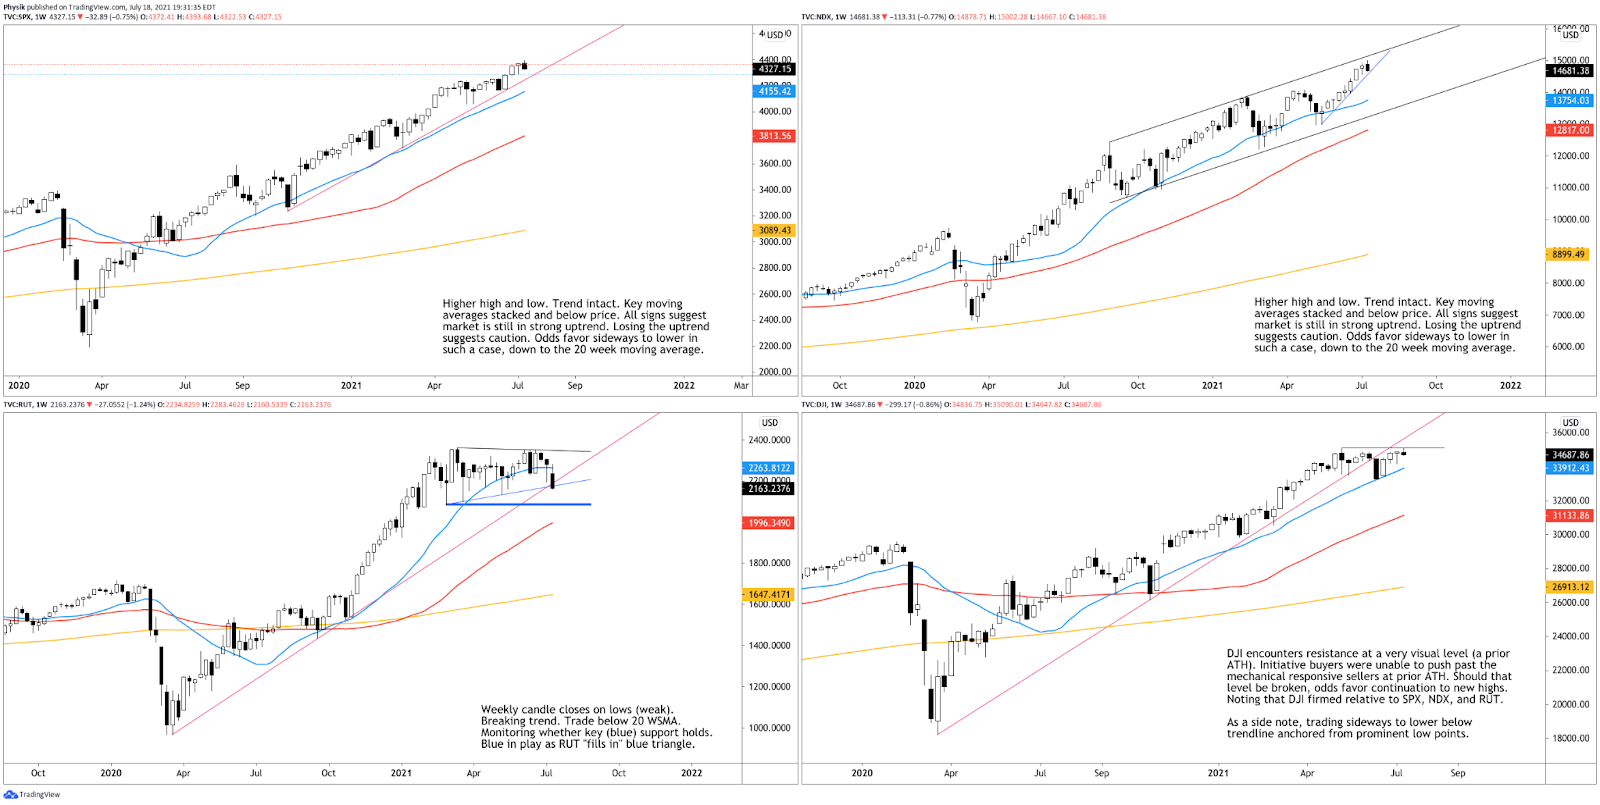
Graphic: Daily candlestick charts of the S&P 500 (top left), Nasdaq 100 (top right), Russell 2000 (bottom left), and Dow Jones Industrial Average (bottom right).

News And Analysis

When VIX hits an extreme, options traders look to volatility arbitrage. (tasty)

Identifying gamma squeezes with SpotGamma’s options modeling. (BZ)

U.S. banks see loan, revenue pressure despite consumer spending. (Fitch)

The U.S. economy continued to strengthen as mobility trended up. (S&P)

‘A free put on the market’: Ambrus CIO talking volatility dislocations. (BZ)

OPEC+ agrees oil supply boost after UAE, Saudi reach compromise. (REU)

An unexpected tightening in policy would generate market volatility. (Moody’s)

Semiconductor supply shortage, inflation, and technology regulation. (S&P)

Frenzied retail investing boom has been cooling off in recent weeks. (Fortune)

Delta Air is seeing positive growth in business travel as offices open. (S&P)

What People Are Saying

About

After years of self-education, strategy development, and trial-and-error, Renato Leonard Capelj began trading full-time and founded Physik Invest to detail his methods, research, and performance in the markets. Additionally, Capelj is a finance and technology reporter. Some of his biggest works include interviews with leaders such as John Chambers, founder and CEO, JC2 Ventures, Kevin O’Leary, businessman and Shark Tank host, Catherine Wood, CEO and CIO, ARK Invest, among others.

Disclaimer

At this time, Physik Invest does not manage outside capital and is not licensed. In no way should the materials herein be construed as advice. Derivatives carry a substantial risk of loss. All content is for informational purposes only.

Categories
Commentary

Market Commentary For The Week Ahead: ‘The Flow Won’

Key Takeaways:

What Happened: Amid a volatile, news-heavy week, after a slew of earnings reports by heavily weighted index constituents, and an FOMC meeting that made no change to existing monetary policy, financial markets experienced a rapid de-risking, similar to what transpired prior to the sell-off in February 2020.

What Does It Mean: After extending the S&P 500’s rally, as well as establishing acceptance near the $3,850.00 price extension, an upside target, and excess (i.e., a proper end to price discovery), participants auctioned back into range, repairing poor structures left in the wake of initiative buying.

The action found acceptance below the $3,824.00 – $3,763.75 balance-area, invalidating the prior week’s break-out to new highs.

Since then, market participants were witness to violent two-sided trade, a result of the market transitioning into a short-gamma environment (Graphic 1).

In such case dealers hedge derivatives exposure by buying into strength and selling into weakness. This, will exacerbate volatility.

Graphic 1: SpotGamma data suggests S&P 500 has entered short-gamma environment

In a conversation for a Benzinga article to be released this coming week, I spoke with Kris Sidial, co-chief investment officer at The Ambrus Group, a volatility arbitrage fund, regarding GameStop Corporation (NYSE: GME) share price volatility, market microstructure, and regulation.

According to Sidial, the dynamics that transpired in GameStop can be traced back to factors like Federal Reserve stabilization efforts, and low rates, which incentivize risk taking (see Graphic 2).

“The growth of structured products, passive investing, the regulatory standpoint that’s been implemented with Dodd-Frank and dealers needing to hedge off their risk more frequently, than not,” are all part of a regime change that’s affected the stability of markets, Sidial notes. 

“These dislocations happen quite frequently in small windows, and it offers the potential for large outlier events,” like the equity bust and boom during 2020. “Strength and fragility are two completely different components. The market could be strong, but fragile.”

The aforementioned regime change is one in which dealer exposure to direction and volatility promotes crash up and down dynamics. Last February, the market was heavily one-sided with participants, like target date funds (e.g., mutual funds), selling far out-of-the-money puts on the S&P 500 for passive yield, and investors buying-to-open put options in an increasing amount for downside exposure, thus exacerbating volatility. 

Graphic 2: Newfound Research unpacks market drivers, implications of liquidity.
Graphic 3: SqueezeMetrics highlights implications of volatility, direction, and moneyness.

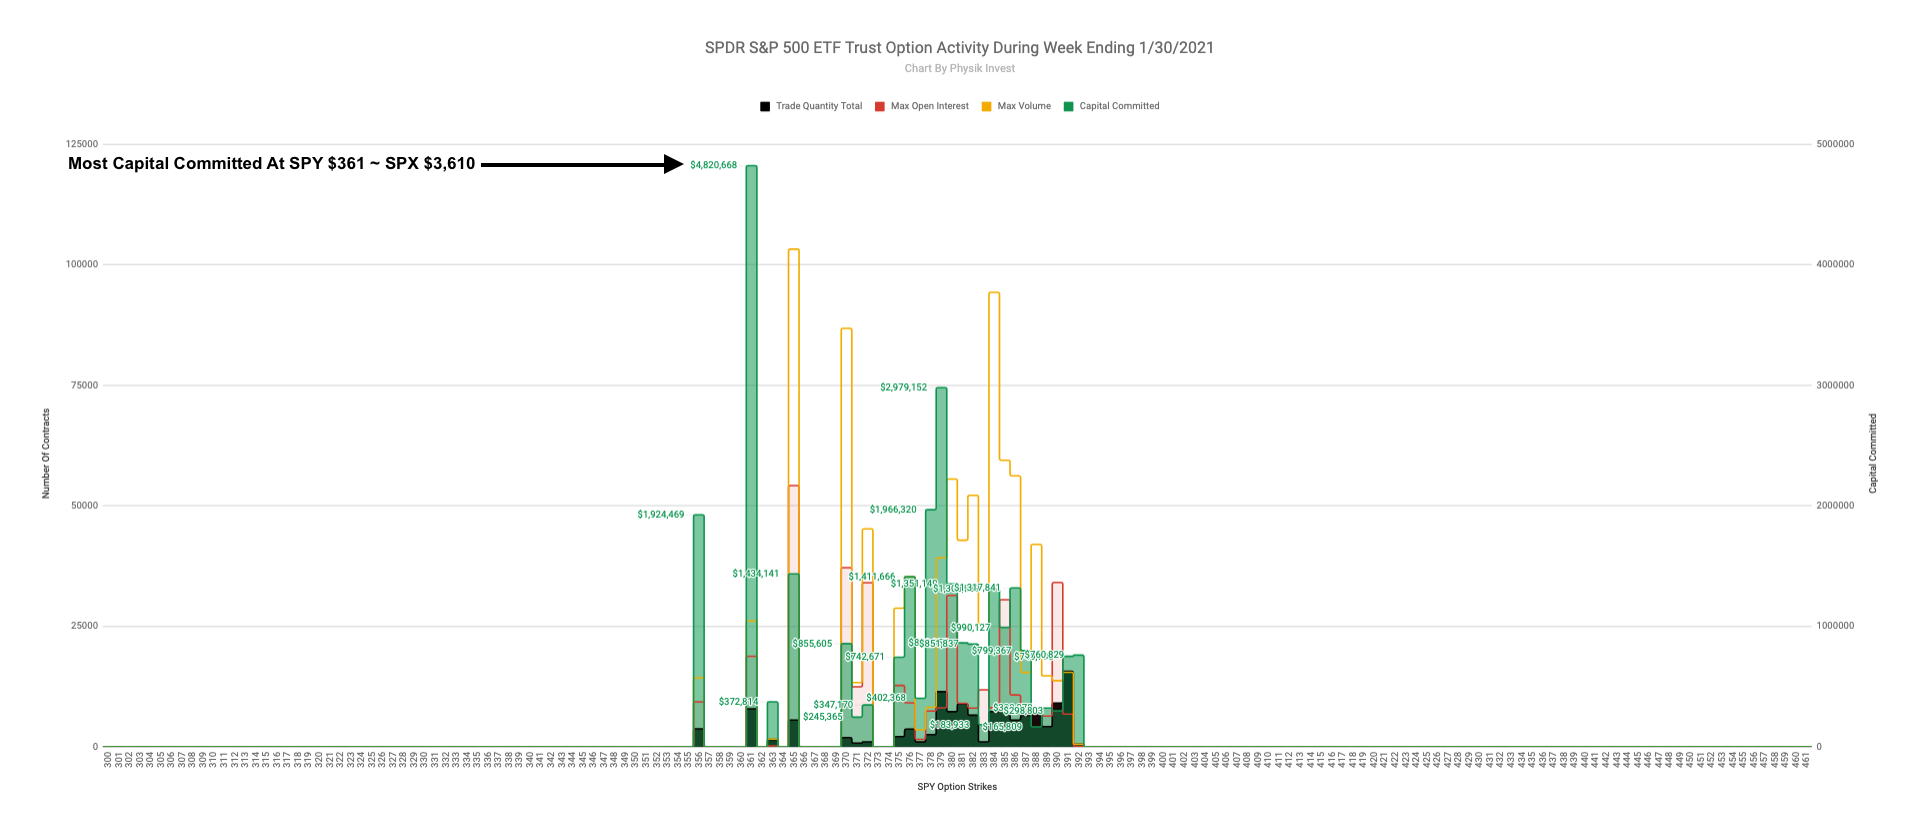
Last week, per Graphic 4, the SPDR S&P 500 ETF Trust, the largest ETF that tracks the S&P 500, saw a rise in purchases of downside protection with time, which will likely lead to an increase in implied volatility and sensitivity of options to changes in underlying price.

These risks will be hedged off by dealers selling into weakness (see Graphic 3), thereby exacerbating downside volatility.

Graphic 4: Physik Invest maps out the purchase of call and put options in the SPDR S&P 500 ETF Trust, for the week ending January 30, 2021.

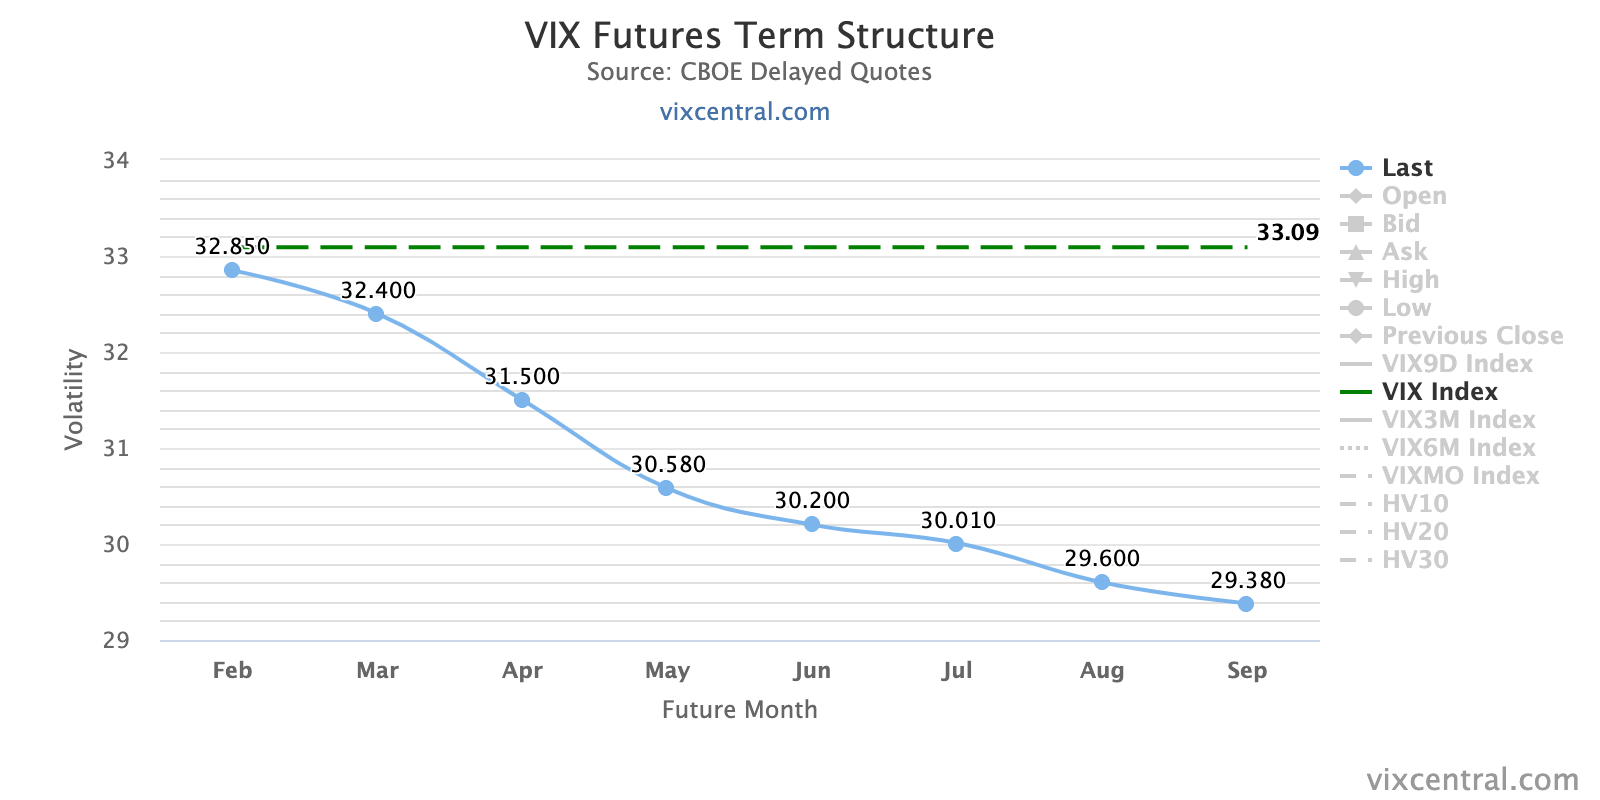
The activity was most concentrated in put options with a strike price of $361, corresponding with $3,610 in the cash-settled S&P 500 Index (INDEX: SPX). This, alongside the market’s entry into short gamma, and an inversion of the VIX futures term structure (see Graphic 5), in which longer-dated VIX expiries are less expensive, is a warning of elevated near-term risks for equity market stability.

Graphic 5: VIX Futures Term Structure per vixcentral.com.

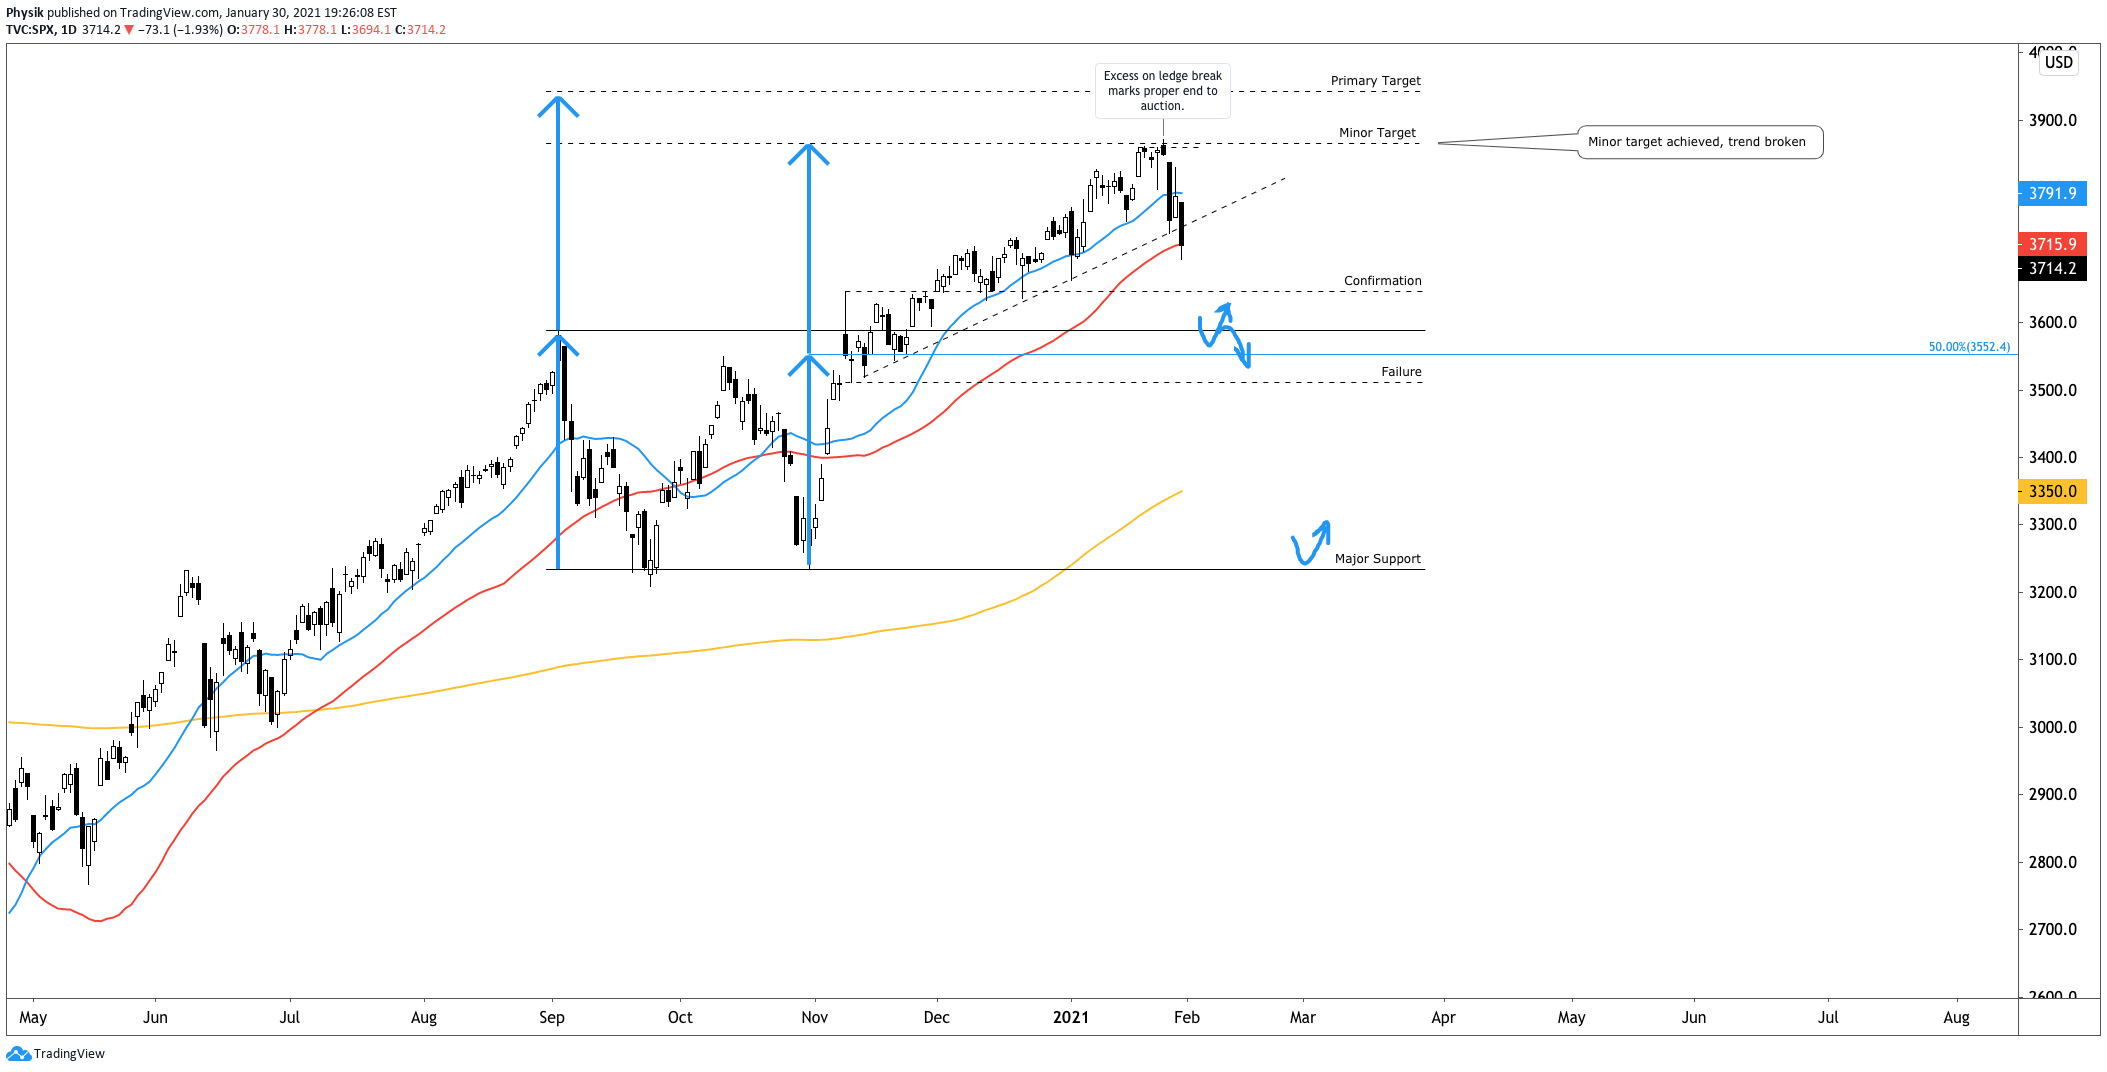
What’s more? Aside from breaking technical trend (Graphic 6) is DIX, a proxy for buying derived from short sales (i.e., liquidity provision on the market making side) declining, and the presence of divergent speculative flows and delta (e.g., non-committed buying as measured by volume delta).

Graphic 6: Cash-settled S&P 500 Index experiences technical breakdown.
Graphic 7: DIX by SqueezeMetrics suggests large divergence between price and buying on January 27.
Graphic 8: Divergent Delta in the SPDR S&P 500 ETF (NYSE: SPY), the largest ETF that tracks the S&P 500.

What To Expect: In light of the technical breakdown U.S. stock indexes are best positioned for downside discovery.

As a result, participants ought to zoom out, and look for valuable areas to transact.

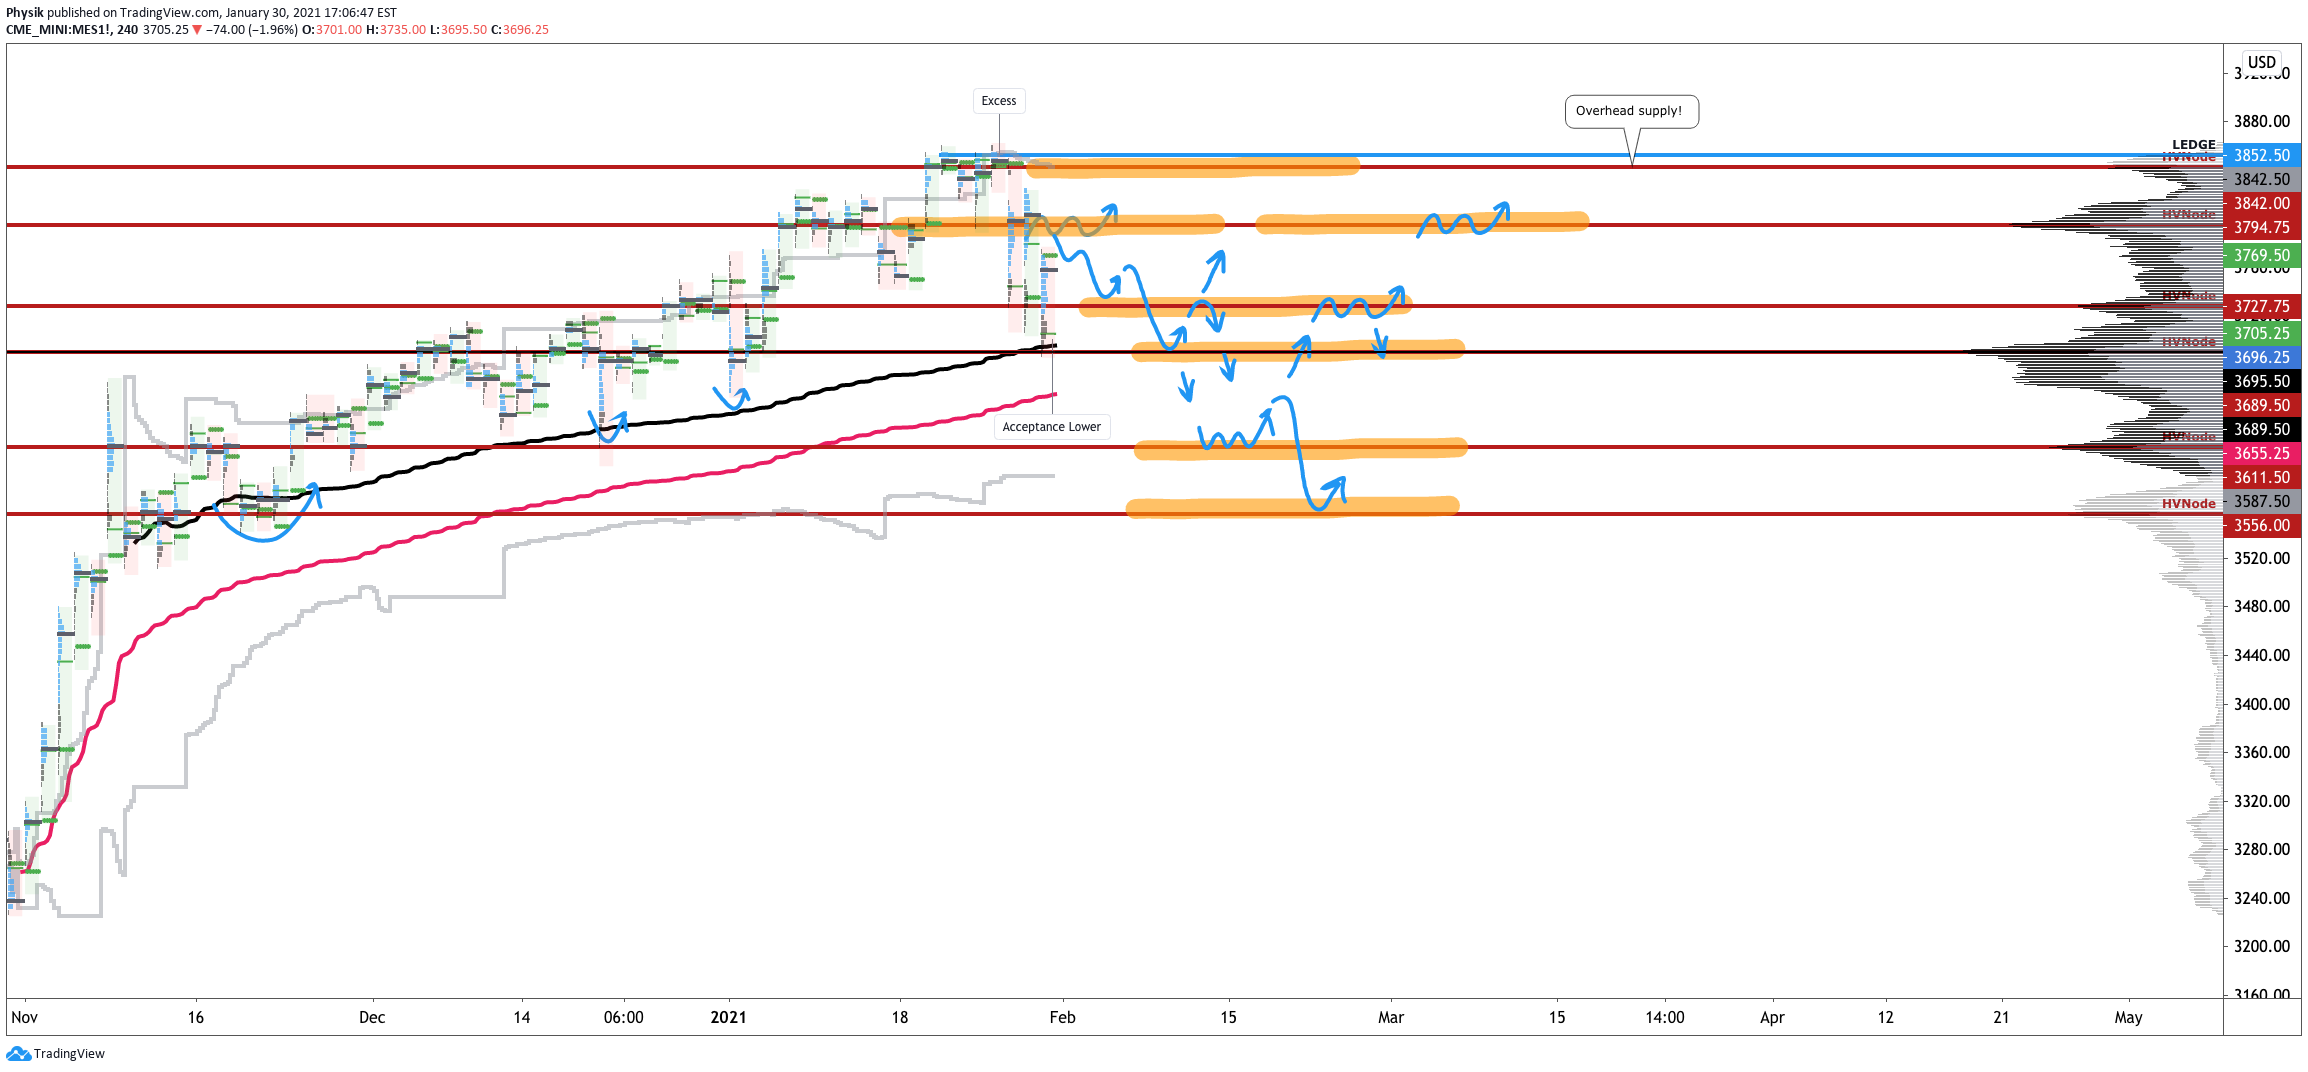
Graphic 9: 4-hour profile chart of the Micro E-mini S&P 500 Futures.

In Graphic 9, the highlighted zones denote high-volume areas (HVNodes), which can be thought of as building blocks.

A structurally sound market will build on past areas of high-volume. Should the market trend for long periods of time, it will lack sound structure (identified as a low-volume area which denotes directional conviction and ought to offer support on any test). 

If participants were to auction and find acceptance into areas of prior low-volume, as they have in the week prior, then future discovery ought to be volatile and quick as participants look to areas of value for favorable entry or exit.

Additionally, it’s important to remember what the market’s long-term trajectory is: up.

Late last year, JPMorgan Chase & Co. (NYSE: JPM) strategist Marko Kolanovic suggested equities would rally short-term with the S&P 500 auctioning as high as $4,000 on the basis of low rates, improved fundamentals, buybacks, as well as systematic and hedge fund strategies. Since then, Kolanovic has downgraded growth and suggested the limited potential for further upside despite odds of a sustained economic recovery.

Note, Kolanovic has not called for an implosion in equity markets. Instead, the market is due for some downside discovery given a moderation in the recovery.

Given the above dynamics, the following frameworks apply for next week’s trade.

In the best case, the S&P 500 takes back Friday’s liquidation and auctions above the $3,727.75 HVNode. Expectations thereafter include continued balance.

In the worst case, any break that finds increased involvement (i.e., supportive flows and delta) below the $3,689.50 HVNode, would favor continuation as low as the $3,611.50 and $3,556.00 HVNodes. Note that the second to last HVNode corresponds with the $361 SPY put concentration, which may serve as a near-term target, or bottom, for this sell-off, given last week’s activity at that strike.

Graphic 10: Profile overlays on a 15-minute candlestick chart of the Micro E-mini S&P 500 Futures.

Conclusions: Participants ought to look for favorable areas to transact, such as those highlighted areas in the S&P 500, featured in Graphic 9.

Big picture, the sell-off ought to be bought, just not yet. Per Graphic 11, euphoria is still too high.

Graphic 11: Bank of America Corporation (NYSE: BAC) sentiment indicators.

Levels Of Interest: $3,727.75, $3,689.50, $3,611.50 and $3,556.00 HVNodes.

Cover photo by Pixabay from Pexels.

Categories
Commentary

Market Commentary For The Week Ahead: ‘All In At The Top’

Key Takeaways:

  • Analysts extended 2021 S&P 500 targets.
  • Fear and greed are tugging at each other. 
  • Jefferies ups 2021 GDP forecast to 5.25%.
  • Net equity buying the largest in months.
  • Inflation is rising where you don’t want it.
  • Positioning suggests elevation of volatility.
  • The big picture breakouts remain intact.

What Happened: Coming into the extended holiday weekend, on tapering volumes, U.S. index futures balanced within prior range. 

This activity occurred in the context of a larger balance-area forming just beyond the $3,600.00 multi-month break-out point. Given the lack of range expansion, in addition to the aforementioned responsive, back-and-forth trade, participants are signaling a lack of conviction.

Though there is a lot of noise in the markets — an uneven recovery, stimulus, elections, trade, and the like — one key point remains: the multi-month upside breakout targeting S&P 500 prices as high as $4,000.00 remains intact. Add to this the recovery of Monday’s liquidation fueled by weak-handed, short-term buyers, and the fact that the all-time $3,724.25 rally-high was established in an overnight session, it is highly likely that the upside discovery process has yet to end.

Note: Historically, there is a low probability that overnight all-time highs end the upside discovery process. 

Pictured: Profile overlays on a 30-minute candlestick chart of the Micro E-mini S&P 500 Futures

What To Expect: Friday’s session found responsive selling surface near the $3,691.00 profile level. Given that participants had difficulty in sustaining higher prices, alongside shortened holiday trade, the following frameworks apply for next week’s trade.

In the best case, the S&P 500 remains above its $3,667.75 HVNode, and continues to balance. As stated earlier, given the tapering volume and holiday, the odds of directional resolve are quite low. 

Two go, no-go levels exist; trade that finds increased involvement above $3,691.00 and below $3,667.75 would suggest a change in conviction. Anything in-between favors responsive trade.

Conclusion: Bank of America Corp’s (NYSE: BAC) Michael Hartnett summarized it best: “[T]he year of the virus, the lockdown, a crash, a recession, an epic policy panic, the greatest stock market rally of all-time, a V-shape economic recovery, and ending with a vaccine for COVID-19.”

Though risks remain, markets are pricing in the odds of a continued rebound. Unless some exogenous event were to transpire, technically speaking, all broad-market indices are in an uptrend. A move below $3,600.00 in the S&P 500 would denote a change in tone, increasing the likelihood of a failed breakout that would target prices as low as $3,200.00.

Pictured: Retest of the upside breakpoint on a daily candlestick chart of the cash S&P 500 Index

Levels Of Interest: The $3,691.00 boundary and $3,667.75 HVNode.

Bonus: Here is a look at some of the opportunities unfolding.

Photo by Raka Miftah from Pexels.