Categories
Methodology

Successful Traders’ Tips To Beat The Markets

Separate from his work at Physik Invest, founder Renato Leonard Capelj is an accredited journalist interviewing prestigious global leaders in business, government, and finance.

In his desire to learn and apply the methods of those others who are far more experienced, Capelj has a long list of interviews you may find helpful in strengthening your understanding of markets.

March 10, 2023: Portfolio Manager Prefers Option, Bond Overlays To Hedge Big Uncertainty Facing Markets

Capelj spoke with Simplify Asset Management’s Michael Green about cutting investors’ portfolio volatility while amplifying profit potential.

In response to uncertainty, Green says investors can park cash in short-term near-risk-free bonds yielding 5% or more, as well as allocate some capital to volatility “to introduce a degree of convexity,” risking only the premium paid. Alternatively, investors can take a more optimistic long view and position in innovations like artificial intelligence or next-generation energy production.

Michael Green of Simplify Asset Management

January 8, 2023: Two Major Risks Investors Should Watch Out For In 2023

Capelj spoke with The Ambrus Group’s Kris Sidial about his market perspectives.

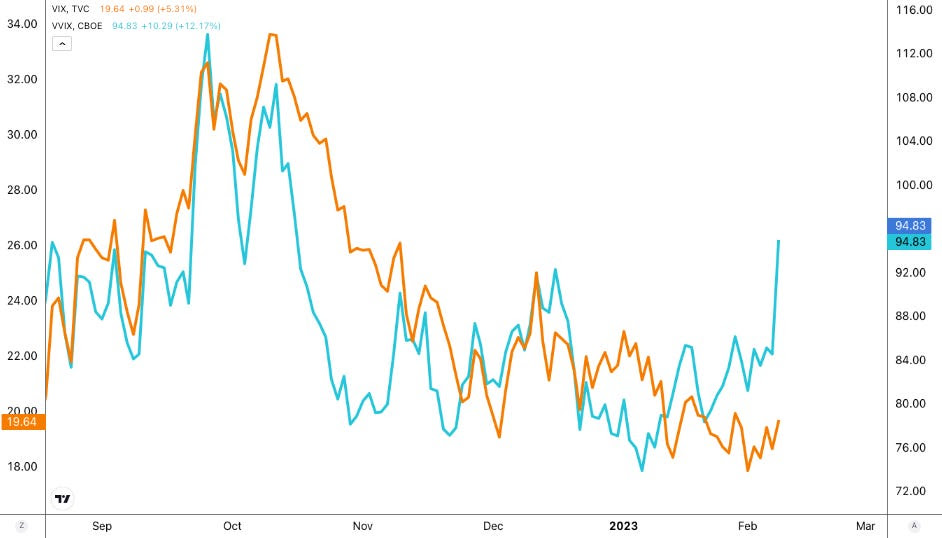
Naive measures like the VVIX, which is the volatility of the VIX or the volatility of the S&P 500’s volatility, are printing at levels last seen in 2017, Sidial explains, noting this would suggest “we can get cheap exposure to convexity while a lot of people are worried.”

“Even if inflation continues, the rate at which it rises won’t be the same. Due to this, CTA exposures likely will not perform as well as they did in 2022, and that’s why you may see more opportunities in the volatility space.”

Kris Sidial of The Ambrus Group

June 28, 2022: Former Bridgewater Associate Andy Constan Talks Recession Odds, Capturing A Macro Edge

Capelj spoke with Damped Spring Advisors’ Andy Constan about what investors should focus on and how he creates trades that lose him less money.

Constan’s trades are constructed around two- to four-month time horizons and are structured long and short using defined-risk options trades like debit or credit spreads, depending on whether volatility is cheap or expensive.

I want deltas and leverage. My macro indicators give me an edge on price and in the worst case, the loss is limited to 10%, if everything has to go against me all at once. I can be 100% invested and only risk 10%.”

Andy Constan of Damped Spring Advisors

May 16, 2022: 42 Macro’s Darius Dale On His Wall Street Story, The Markets: ‘This Is Not The Financial Crisis’

Capelj spoke with 42 Macro’s Darius Dale about his Wall Street story and perspectives on life and markets.

“We’re tracking at an above-potential level of output in terms of the growth rate of output. We’re also slowing and the pace of that deceleration is likely to pick up steam in the coming quarters.”

By 2023, that process is likely to “catalyze pressure on asset markets through the lens of corporate earnings and valuations you assign to a lower level of growth.”

Darius Dale of 42 Macro

July 22, 2021: ShadowTrader’s Peter Reznicek On His Early Days, Tips For Success And Evolution

Capelj spoke with ShadowTrader’s Peter Reznicek about his start, perspectives, success tips, and visions for the future.

Reznicek recalled two turning points in his trading career.

The first was learning from expert floor traders involved with the thinkorswim team.

“That was really the genesis of where I started to learn the broken-wing butterflyratio spread and things like that,” he shared.

Floor traders, according to Reznicek, had low capital requirements. As a result, they could put on strategies like the 1×2 ratio — a debit spread with an extra short option — for a low cost.

(See parts 12, and 3 of ShadowTrader’s how-to series on ratio spreads.)

“On the floor, it is either go big or go home,” he chuckled, remarking that ratio spreads were the way of the casino. “You either get rich or they take your house. So, why would you put on any other spread?”

The next big turning point was Jim Dalton, who’s been a member of the Chicago Board of Trade, as well as a member of the Chicago Board Options Exchange (CBOE) and senior executive vice president of the CBOE during its formative years.

“I’m still in touch with him on a regular basis and I consider him a friend,” Reznicek said in a discussion on Dalton’s works like Mind Over Markets and Markets in Profile, as well as his use of WindoTrader Market Profile software. “I went to Chicago twice to see him teach live … and I came home from those seminars with five, six, 10 pages of notes. The nuances of profile continue to mold me.”

Peter Reznicek of ShadowTrader

July 26, 2021: Kai Volatility’s Cem Karsan Unpacks Implications Of Fed Taper, Shift To Fiscal Policy And More

Capelj spoke with Kai Volatility Advisors’ Cem Karsan about the implications of record valuations and the growth of derivatives markets on policy, the economy, and financial markets.

“It’s not a coincidence that the mid-February to mid-March 2020 downturn literally started the day after February expiration and ended the day of March quarterly expiration. These derivatives are incredibly embedded in how the tail reacts and there’s not enough liquidity, given the leverage, if the Fed were to taper.”

Cem Karsan of Kai Volatility Advisors

July 13, 2021: Ambrus Group CIO On Taking Advantage Of Volatility Dislocations

Capelj spoke with The Ambrus Group’s Kris Sidial to understand how to capitalize on volatility dislocations.

Unlike standard tail-risk funds which systematically buy equity puts, Ambrus’ approach is bespoke, cutting down on negative dynamics like decay with respect to time.

Given dislocations across single stock skew, term structure, and volatility risk premium, Ambrus will position itself in options with less time to maturity, buying protection up to six weeks out.

“The market will underestimate the distribution,” Sidial said in a conversation on Ambrus’ internal models that spot positional imbalances to determine who is off-sides and in what single asset. “We’re buying things that have happened before and we’re looking for it to carry a heavier beta when the sell-off happens.”

So, by analyzing flow, as well as using internal models to assess the probabilities of deleveraging in a risk-off event, Ambrus is able to venture into individual stocks where there may be excess fragility; “I know if stock XYZ goes down five percent, it’s going to go down 10% because this fund needs to deleverage.”

To aid the cost to carry, Ambrus utilizes defined-risk, short-volatility, absolute return strategies.

“I’m basically giving you a free put on the market – with a ton of convexity – with something that offers a payout that’s just more than a regular put,” Sidial summarized. “If the market doesn’t do anything, and we do an amazing job, we’re flat and you made money on all your long-only equity exposure.”

“You had a free hedge the entire time.”

Kris Sidial of The Ambrus Group

February 1, 2021: Volatility Arbitrage Trader Talks GameStop, Market Microstructure, Regulation

Capelj spoke with The Ambrus Group’s Kris Sidial about the meme stock debacle of 2021.

“You have distressed debt hedge funds that focus on shorting these types of companies. Melvin Capital is the one that is singled out due to the media, but they aren’t the only ones.”

Market participants added to the crash-up dynamics. Retail investors aggressively bought stock and short-term call options, while institutional investors further took advantage of the momentum and dislocations.

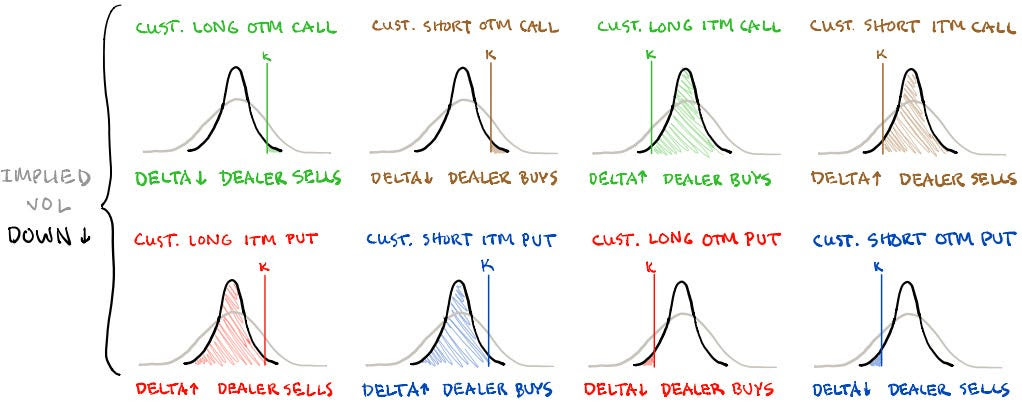
“You have this dynamic in the derivatives market where there is a gamma squeeze when people are buying way far out-of-the-money calls, and dealers reflexively have to hedge off their risk,” Sidial said.

“It causes a cascading reaction, moving the stock price up because dealers are short calls and they have to buy stock when the delta moves a specific way.”

The participation in the stock on the institutional side has not received much attention, he said. 

“We’ve noticed that some of the flow is more institutional,” he said in reference to activity on the level two and three order books, which are electronic lists of buy and sell orders for a particular security.

“You have certain prop guys and other hedge funds that understand what’s going on, and they’re trying to take advantage of it, as well.”

This institutional activity disrupted traditional correlations and caused shares of distressed debt assets like GameStop, BlackBerry Ltd, and AMC Entertainment Holdings Inc to trade in-line with each other.

“This was not some WallStreetBet user, … if you look at how some of these things were moving premarket, you would see GME drop like 2%, BB’s best bid would drop and AMC’s best bid would drop. That’s an algo.”

The takeaway: although the WallStreetBets crowd is getting most of the blame, institutions are also at fault for the volatility.

Kris Sidial of The Ambrus Group
Categories
Commentary

Daily Brief For March 20, 2023

Physik Invest’s Daily Brief is read free by thousands of subscribers. Join this community to learn about the fundamental and technical drivers of markets.

Graphic updated 8:10 AM ET. Sentiment Neutral if expected /MES open is inside of the prior day’s range. /MES levels are derived from the profile graphic at the bottom of this letter. Click here for the latest levels. SqueezeMetrics Dark Pool Index (DIX) and Gamma (GEX) with the latter calculated based on where the prior day’s reading falls with respect to the MAX and MIN of all occurrences available. A higher DIX is bullish. The lower the GEX, the more (expected) volatility. Click to learn the implications of volatility, direction, and moneyness. Breadth reflects a reading of the prior day’s NYSE Advance/Decline indicator. The CBOE VIX Volatility Index (INDEX: VVIX) reflects the attractiveness of owning volatility. UMBS prices via MNDClick here for the economic calendar.

Fundamental

As well summarized by Eric Basmajian, inflation, and growth are on a downward trajectory. Most leading indicators “suggest recessionary pressure will be ongoing.” The banking crisis and response, which will ultimately “cause a tightening of lending to the private economy,” likely exacerbates the ongoing recessionary pressures.

Breaking: UBS To Buy Credit Suisse In $3.3 Billion Deal

Most strategists including the Damped Spring’s Andy Constan agree. In a recent video, Constan detailed the implications of policymakers’ intervention. In short, an asset fire sale was turned into a managed sale, and a reduction in credit creation will tighten financial conditions, slowing the economy and inflation.

“Small banks that are facing deposit outflows will see earnings and margins collapse as their cost of funds surges from 1% or 2% on deposits to 4% or 5% at the Fed funding facility,” Basmajian summarizes, noting that the increase in the Federal Reserve (Fed) balance sheet came from the discount window, new bank funding facilities, and spillover from the FDIC insurance backstop, all of which are not to be confused with quantitative easing or QE (i.e., monetary stimulus and a flow of capital into capital markets). 

Graphic: Retrieved from Bank of American Corporation (NYSE: BAC) via The Market Ear.

“As deposits leave regional and smaller banks for more yield and safety, they will flow into bigger banks that do less lending or into money market funds that don’t drive credit creation.” Consequently, there will be “a significant tightening of lending standards, and a credit crunch on the private economy as regional and smaller banks face massive funding pressure.”

Graphic: Retrieved from Morgan Stanley (NYSE: MS) via The Market Ear. “MS models show that a permanent +10pt tightening in lending standards for C&I loans leads to a 35bps rise in the unemployment rate over the next two years. Historically, recessions have arrived more than half a year after jobless claims begin a sustained rise.”

Traders are conflicted about the Fed’s coming interest rate decision. Many were expecting a couple more hikes of at least 25 basis points in size. However, following the recent bank turmoil in the US and abroad, it appears that traders think it will be one additional 25 basis point hike before rate cuts ensue in mid-2023.

Graphic: Retrieved from CME Group Inc’s (NASDAQ: CME) FedWatch Tool.

Historically, selling markets on the last Fed rate hike is a good strategy, Bank of America found.

Graphic: Retrieved from Bank of American Corporation (NYSE: BAC) via The Market Ear.

Positioning

Top-line measures of implied volatility or IVOL including the Cboe Volatility Index or VIX are higher heading into Monday’s trade.

Macro uncertainties have some frightened, hence “equity volatility present[ing] itself in a much stronger way,” said The Ambrus Group’s Kris Sidial. For this equity volatility (i.e., implied volatility or IVOL) to continue performing well, realized volatility or RVOL (i.e., the movement that actually happens and is not implied by traders’ supply and demand of options) must shift and stay higher as well (note: in many ways RVOL and IVOL reinforce the other during extreme greed or fear events.

Though big options expiries (OpEx) “may help unpin the market” and manifest market downside and follow-through in RVOL needed to keep IVOL performing, the window for this to happen may be closing.

The monetization of profitable options structures, as well as volatility compression and options decay, may result in counterparties buying back their short stock and/or futures hedges (to the short put positions they have on), thus boosting the market (particularly the depressed and rate-sensitive Nasdaq 100).

If the market rallies, that has the potential to “make things hotter” in the economy, explained Kai Volatility’s Cem Karsan, which emboldens policymakers to make and keep policy tighter. So, barring follow-through to the downside, any equity market upside that arises is likely limited, as a disclaimer, some think.

Apologies for rushing this section, today. More on positioning in the coming letters.

Technical

As of 8:10 AM ET, Monday’s regular session (9:30 AM – 4:00 PM ET), in the S&P 500, is likely to open in the middle part of a negatively skewed overnight inventory, inside of the prior day’s range, suggesting a limited potential for immediate directional opportunity.

The S&P 500 pivot for today is $3,946.75. 

Key levels to the upside include $3,970.75, $3,994.25, and $4,026.75.

Key levels to the downside include $3,912.25, $3,891.00, and $3,868.25.

Disclaimer: Click here to load the updated key levels via the web-based TradingView platform. New links are produced daily. Quoted levels likely hold barring an exogenous development.

Graphic: 65-minute profile chart of the Micro E-mini S&P 500 (FUTURE: /MES) bottom-middle.

Definitions

Volume Areas: Markets will build on areas of high-volume (HVNodes). Should the market trend for a period of time, this will be identified by a low-volume area (LVNodes). The LVNodes denote directional conviction and ought to offer support on any test.

If participants auction and find acceptance in an area of a prior LVNode, then future discovery ought to be volatile and quick as participants look to the nearest HVNodes for more favorable entry or exit.

POCs: Areas where two-sided trade was most prevalent in a prior day session. Participants will respond to future tests of value as they offer favorable entry and exit.


About

The author, Renato Leonard Capelj, spends the bulk of his time at Physik Invest, an entity through which he invests and publishes free daily analyses to thousands of subscribers. The analyses offer him and his subscribers a way to stay on the right side of the market. 

Separately, Capelj is an accredited journalist with past works including interviews with investor Kevin O’Leary, ARK Invest’s Catherine Wood, FTX’s Sam Bankman-Fried, North Dakota Governor Doug Burgum, Lithuania’s Minister of Economy and Innovation Aušrinė Armonaitė, former Cisco chairman and CEO John Chambers, and persons at the Clinton Global Initiative.

Connect

Direct queries to renato@physikinvest.com. Find Physik Invest on TwitterLinkedInFacebook, and Instagram. Find Capelj on TwitterLinkedIn, and Instagram. Only follow the verified profiles.

Calendar

You may view this letter’s content calendar at this link.

Disclaimer

Do not construe this newsletter as advice. All content is for informational purposes. Capelj and Physik Invest manage their own capital and will not solicit others for it.

Categories
Commentary

Daily Brief For March 17, 2023

Physik Invest’s Daily Brief is read free by thousands of subscribers. Join this community to learn about the fundamental and technical drivers of markets.

Graphic updated 8:50 AM ET. Sentiment Neutral if expected /MES open is inside of the prior day’s range. /MES levels are derived from the profile graphic at the bottom of this letter. Click here for the latest levels. SqueezeMetrics Dark Pool Index (DIX) and Gamma (GEX) with the latter calculated based on where the prior day’s reading falls with respect to the MAX and MIN of all occurrences available. A higher DIX is bullish. The lower the GEX, the more (expected) volatility. Click to learn the implications of volatility, direction, and moneyness. Breadth reflects a reading of the prior day’s NYSE Advance/Decline indicator. The CBOE VIX Volatility Index (INDEX: VVIX) reflects the attractiveness of owning volatility. UMBS prices via MNDClick here for the economic calendar.

Fundamental

Higher asset prices boosted household wealth and demand; consumers’ increased ability to spend more wealth pushed up inflation. If policymakers use their tools to lower household wealth and demand, this should cut down on inflation.

Kai Volatility’s Cem Karsan says the latter was a policy objective and recent financial institution failures are a sign of follow-through; excesses and speculation are being removed, as policymakers desired.

Policymakers don’t want liquidations, however. They want lower asset prices. Recent events put policymakers in an odd position after raising rates non-stop. In the Federal Reserve’s (Fed) case, and we paraphrase Karsan, policy/rates moved very quickly with little pause. With there being a lag, the Fed may want to pause and assess. However, they have to telegraph this carefully so that the market does not read it as a pivot. If the market rallies, that “makes things hotter,” Karsan says.

There’s already been an overreaction in the bond market, he adds, which is not ideal. The Fed does not want the long end of the yield curve to fall, as it has on the back of the turmoil and intervention, as well as data including housing starts which show more supply coming onto the market, likely a mortgage application booster in the near term.

Graphic: Retrieved from USTreasuryYieldCurve.com.

Even at the front end, there’s been lots of movement. This has “forc[ed] widespread risk liquidation,” Bloomberg says. Take a look at the Three-Month SOFR (FUTURE: /SR3), a tool used to hedge USD short-term interest rates.

Graphic: Retrieved from Charles Schwab Corporation-owned (NYSE: SCHW) TD Ameritrade’s thinkorswim platform.

The consensus, which Karsan agrees with, is that the Fed moves forward with a 25 basis point hike while telegraphing it wants the long end of the curve to rise or higher for longer as it is colloquially referred to.

Graphic: Retrieved from CME Group Inc’s (NASDAQ: CME) FedWatch Tool.

It is possible for the US policymakers to adopt a meeting-by-meeting stance, as their counterparts have in Europe, letting uncertainties regarding the likes of Credit Suisse Group AG (which just received a ~$54 billion or so liquidity backstop and is mulling a combination with other lenders), SVB Financial Group (NASDAQ: SVB) and First Republic Bank (NYSE: FRC) pan out.

Graphic: Retrieved from Bloomberg. “[T]he credit extended through the two backstops show a banking system that is still fragile and dealing with deposit migration in the wake of the failure of Silicon Valley Bank of California and Signature Bank of New York last week.” Per John Authers: the phenomenal borrowing from the Fed’s discount window suggests that if these are just liquidity problems, they are widespread and serious. Further, the point of the exercise is to slow down the economy, which will in time tend to put pressure on banks’ solvency.”

Pausing, or intending to pause explicitly, could raise inflation expectations or “boost the odds of a recession by spooking consumers and companies into believing that the economy is worse off than they thought,” Bloomberg explainsnoting: “All told, the emergency loans reversed around half of the balance-sheet shrinkage that the Fed has achieved since it began so-called quantitative tightening — allowing its portfolio of assets to run down — in June last year.”

Graphic: Compiled by Physik Invest. Per Jefferies Financial Group Inc’s (NYSE: JEF) Christopher Wood: “2022 was the year when US equities suffered multiple contraction from monetary tightening. This year will be the year when earnings downgrades hit the stock market if the US recession forecast proves to be accurate. This is now the key issue in world financial markets. Then 2024 will be the year when markets will have to deal with the emerging credit problems in the private space.”

Positioning

Heading into this most recent market decline, investors foresaw increased volatility and were positioned for it as indicated by the pricing of tail risk and performance of implied volatility or IVOL (as investors continued to demand protection during this window of non-strength), said Laya Royer of Citadel Securities.

Recall that Kris Sidial warned us of this. Options, colloquially referred to as volatility, would serve as the only hedge in an environment wherein commodities, stocks, and bonds don’t combine or balance each other as well as they did in 2022.

Graphic: Retrieved from Bloomberg.

Now, there are options expirations (OpEx) nearing (March 16 and 31); monetization of profitable options structures, as well as volatility compression and options decay, have counterparties buying back their short stock and/or futures hedges (to the short put positions they have on), boosting the market (particularly the depressed and rate-sensitive Nasdaq 100) through this OpEx/triple witching window.

Graphic: Retrieved from Cboe Global Markets (BATS: CBOE).

Following this period, the “rollover” of existing positions may result in “price swings” that last, Bloomberg puts forth. “This quarterly expiry may help unpin the market.”

Structures proposed in the Daily Brief for March 14 may work in reducing portfolio downside while allowing you to participate directionally at less cost.

Technical

As of 8:50 AM ET, Friday’s regular session (9:30 AM – 4:00 PM ET), in the S&P 500, is likely to open in the lower part of a negatively skewed overnight inventory, inside of the prior day’s range, suggesting a limited potential for immediate directional opportunity.

The S&P 500 pivot for today is $3,970.75. 

Key levels to the upside include $4,004.75, $4,037.00, and $4,059.25.

Key levels to the downside include $3,946.75, $3,921.25, and $3,891.00.

Disclaimer: Click here to load the updated key levels via the web-based TradingView platform. New links are produced daily. Quoted levels likely hold barring an exogenous development.

Graphic: 65-minute profile chart of the Micro E-mini S&P 500 (FUTURE: /MES) at the middle bottom.

Definitions

Volume Areas: Markets will build on areas of high-volume (HVNodes). Should the market trend for a period of time, this will be identified by a low-volume area (LVNodes). The LVNodes denote directional conviction and ought to offer support on any test.

If participants auction and find acceptance in an area of a prior LVNode, then future discovery ought to be volatile and quick as participants look to the nearest HVNodes for more favorable entry or exit.

POCs: Areas where two-sided trade was most prevalent in a prior day session. Participants will respond to future tests of value as they offer favorable entry and exit.


About

The author, Renato Leonard Capelj, spends the bulk of his time at Physik Invest, an entity through which he invests and publishes free daily analyses to thousands of subscribers. The analyses offer him and his subscribers a way to stay on the right side of the market. 

Separately, Capelj is an accredited journalist with past works including interviews with investor Kevin O’Leary, ARK Invest’s Catherine Wood, FTX’s Sam Bankman-Fried, North Dakota Governor Doug Burgum, Lithuania’s Minister of Economy and Innovation Aušrinė Armonaitė, former Cisco chairman and CEO John Chambers, and persons at the Clinton Global Initiative.

Connect

Direct queries to renato@physikinvest.com. Find Physik Invest on TwitterLinkedInFacebook, and Instagram. Find Capelj on TwitterLinkedIn, and Instagram. Only follow the verified profiles.

Calendar

You may view this letter’s content calendar at this link.

Disclaimer

Do not construe this newsletter as advice. All content is for informational purposes. Capelj and Physik Invest manage their own capital and will not solicit others for it.

Categories
Commentary

Daily Brief For February 22, 2023

Physik Invest’s Daily Brief is read free by thousands of subscribers. Join this community to learn about the fundamental and technical drivers of markets.

Graphic updated 7:15 AM ET. Sentiment Neutral if expected /MES open is inside of the prior day’s range. /MES levels are derived from the profile graphic at the bottom of this letter. Click here for the latest levels. SqueezeMetrics Dark Pool Index (DIX) and Gamma (GEX) with the latter calculated based on where the prior day’s reading falls with respect to the MAX and MIN of all occurrences available. A higher DIX is bullish. The lower the GEX, the more (expected) volatility. Click to learn the implications of volatility, direction, and moneyness. Breadth reflects a reading of the prior day’s NYSE Advance/Decline indicator. The CBOE VIX Volatility Index (INDEX: VVIX) reflects the attractiveness of owning volatility. UMBS prices via MNDClick here for the economic calendar.

Fundamental

We look beyond all the doom-and-gloom narrative to the bond-equity divergence which JPMorgan Chase & Co’s (NYSE: JPM) Marko Kolanovic wrote about recently.

Essentially, regressions suggest the move in interest rates since the Federal Reserve’s (Fed) meeting earlier this month should have resulted in a 5-10% sell-off in the rate-sensitive Nasdaq. It didn’t. Per Kolanovic, “this divergence cannot go much further.”

Recall interest rates matter to discounted future cash flows. The higher rates are the, worse that is for equities, says Damped Spring’s Andy Constan well in an interview. 

Interest rates matter elsewhere as well. When interest rates increase, “a mortgage goes down in price by a greater amount than the bond because the expected maturity of the mortgage becomes longer. The magnitude of this unbalanced price volatility characteristic is measured by a financial statistic called ‘convexity.’” Managing this convexity can be problematic and force feedback loops, just as we talk about with options per the below. See here for more.

Graphic: The “Biggest tail risk to SPX isn’t any macro data/virus/war but its own options market.”

Kolanvoic ends: The “risk-reward of holding bonds at this level of short-term yields looks better than equity (earnings yield) than any time since the great financial crisis (i.e., the spread between 2y and equity earnings yield is at the lowest point since 2007).”

Graphic: Retrieved from JPMorgan Chase & Co (NYSE: JPM).

Positioning

This letter said there would be movement after last week’s options expirations (OpEx). 

To quote the February 15 letter, ignoring the “excellent” liquidity and traders buying S&P 500 (INDEX: SPX) “hand over fist,” OpEx would result in a decline in counterparty exposure to positive gamma (i.e., positive exposure to movement). Support from an options positioning perspective would decline, and counterparties would “do less to disrupt and more to bolster movement.”

That’s along the lines of what’s happening, though the movement appears orderly.

Per SpotGamma, “The selling appears contained, as evidenced by an upward trending [implied volatility or IVOL] term structure and light bid in topline measures of [IVOL] like the [Cboe Volatility Index (INDEX: VIX)].” Notwithstanding this light bid at the front of the term structure, there is no rush to protect, as would be evidenced by longer-dated IVOL shifting “materially higher as traders reset to lower equity valuations.”

Graphic: Retrieved from SpotGamma. “SPX term structure today vs 2/13 (day prior to CPI). Traders had higher vol expectations for CPI vs today’s FOMC minutes, but [the] term structure is now more elevated. Makes sense as SPX [is] -3% lower. However, the loss of stabilizing OPEX positioning, elevated IV, & flat gamma may lead to higher relative vol today.”

With there being many options positions concentrated near the $4,000.00 SPX area, markets may be at risk of accelerated selling. Below $4,000.00 traders desire to own predominantly puts, and this leaves counterparties “short puts and [] positive delta, as well as negative gamma and vega, meaning they lose money in an increasing way as the market trades lower and volatility increases.” To hedge, counterparties could sell futures or stocks into the decline. This accelerates selling.

Graphic: Retrieved from SpotGamma.

So, with a break of that big $4,000.00 level increasing risk that selling accelerates, the desire to protect will bid IVOL and the marginal impact of its expansion can do more damage than good that any marginal compression can do.

Graphic: Retrieved from SpotGamma. “IV has now compressed to levels associated with recent market tops. If realized vol (RV) declined, then IV could go lower. But, realized isn’t declining.”

In light of this, your letter writer leans negative delta, as well as positive gamma and vega. If the market trades lower, such a setup would make money in short.

Technical

As of 7:15 AM ET, Wednesday’s regular session (9:30 AM – 4:00 PM ET), in the S&P 500, is likely to open in the middle part of a negatively skewed overnight inventory, inside of the prior day’s range, suggesting a limited potential for immediate directional opportunity.

The S&P 500 pivot for today is $3,998.25. 

Key levels to the upside include $4,015.75, $4,034.75, and $4,052.25.

Key levels to the downside include $3,981.00, $3,965.25, and $3,949.00.

Disclaimer: Click here to load the updated key levels via the web-based TradingView platform. New links are produced daily. Quoted levels likely hold barring an exogenous development.

Graphic: 65-minute profile chart of the Micro E-mini S&P 500 Futures.

Definitions

Volume Areas: Markets will build on areas of high-volume (HVNodes). Should the market trend for a period of time, this will be identified by a low-volume area (LVNodes). The LVNodes denote directional conviction and ought to offer support on any test.

If participants auction and find acceptance in an area of a prior LVNode, then future discovery ought to be volatile and quick as participants look to the nearest HVNodes for more favorable entry or exit.

Gamma: The sensitivity of an option’s Delta to changes in the underlying asset’s price.

CPOCs: Denote areas where two-sided trade was most prevalent over all sessions. Participants will respond to future tests of value as they offer favorable entry and exit.

POCs: Areas where two-sided trade was most prevalent in a prior day session. Participants will respond to future tests of value as they offer favorable entry and exit.

MCPOCs: Denote areas where two-sided trade was most prevalent over numerous sessions. Participants will respond to future tests of value as they offer favorable entry and exit.

Inversion Of VIX Futures Term Structure: Longer-dated VIX expiries are less expensive; is a warning of elevated near-term risks for equity market stability.


About

The author, Renato Leonard Capelj, works in finance and journalism.

Capelj spends the bulk of his time at Physik Invest, an entity through which he invests and publishes free daily analyses to thousands of subscribers. The analyses offer him and his subscribers a way to stay on the right side of the market. Separately, Capelj is an options analyst at SpotGamma and an accredited journalist.

Capelj’s past works include conversations with investor Kevin O’Leary, ARK Invest’s Catherine Wood, FTX’s Sam Bankman-Fried, North Dakota Governor Doug Burgum, Lithuania’s Minister of Economy and Innovation Aušrinė Armonaitė, former Cisco chairman and CEO John Chambers, and persons at the Clinton Global Initiative.

Connect

Direct queries to renato@physikinvest.com. Find Physik Invest on TwitterLinkedInFacebook, and Instagram. Find Capelj on TwitterLinkedIn, and Instagram. Only follow the verified profiles.

Calendar

You may view this letter’s content calendar at this link.

Disclaimer

Do not construe this newsletter as advice. All content is for informational purposes. Capelj and Physik Invest manage their own capital and will not solicit others for it.

Categories
Commentary

Daily Brief For February 10, 2023

Physik Invest’s Daily Brief is read by thousands of subscribers. You, too, can join this community to learn about the fundamental and technical drivers of markets.

Graphic updated 7:00 AM ET. Sentiment Risk-Off if expected /ES open is below the prior day’s range. /ES levels are derived from the profile graphic at the bottom of this letter. Click here for the latest levels. SqueezeMetrics Dark Pool Index (DIX) and Gamma (GEX) with the latter calculated based on where the prior day’s reading falls with respect to the MAX and MIN of all occurrences available. A higher DIX is bullish. At the same time, the lower the GEX, the more (expected) volatility. Click to learn the implications of volatility, direction, and moneyness. Breadth reflects a reading of the prior day’s NYSE Advance/Decline indicator. The CBOE VIX Volatility Index (INDEX: VVIX) reflects the attractiveness of owning volatility.

Positioning

A brief letter, today. Have a good weekend!

Last week, this letter discussed the precariousness of the market’s position. The data suggested pressure was to surface. This pressure surfaced and was exacerbated by traders’ new demands to hedge their downside, hence higher implied volatility (IVOL), among other things like poor Treasury auctions and higher yields pulling investors out of equities.

Graphic: Retrieved from Bloomberg via Piper Sandler Companies’ (NYSE: PIPR) Danny Kirsch.

Furthermore, pressures from demands to protect against the downside are mounting. To explain, think about what’s happening to the other side of those positions traders demanded. As markets trade lower, those positions work against the counterparty. To hedge, the counterparty likely sells underlying. This adds to pressure and instability.

When does it stop?

Well, all else equal, the Damped Spring’s Andy Constan thinks the instability sticks around at least until the S&P 500 (INDEX: SPX) reaches the $4,050.00 strike area, which we discussed the importance of in yesterday’s letter, and profits are taken, or the middle of next week after an update of the Consumer Price Index (CPI). Any short-term relief having to do with the decay of those options would be exacerbated next week by volatility compression if traders’ inflation fears are assuaged.

After next week, the market may be more at the mercy of macro-type repositioning, but we will discuss next week in detail. Also, note that previously attractive trades included selling rich call verticals to finance put verticals. These are no longer the most attractive trades.

Technical

As of 6:50 AM ET, Friday’s regular session (9:30 AM – 4:00 PM ET), in the S&P 500, is likely to open in the lower part of a negatively skewed overnight inventory, outside of the prior day’s range, suggesting a potential for immediate directional opportunity.

The S&P 500 pivot for today is $4,070.00. 

Key levels to the upside include $4,083.75, $4,100.25, and $4,122.75.

Key levels to the downside include $4,052.25, $4,028.75, and $4,011.75.

Disclaimer: Click here to load the updated key levels via the web-based TradingView platform. New links are produced daily. Quoted levels likely hold barring an exogenous development.

Graphic: 65-minute profile chart of the Micro E-mini S&P 500 Futures.

Definitions

Volume Areas: Markets will build on areas of high-volume (HVNodes). Should the market trend for a period of time, this will be identified by a low-volume area (LVNodes). The LVNodes denote directional conviction and ought to offer support on any test.

If participants auction and find acceptance in an area of a prior LVNode, then future discovery ought to be volatile and quick as participants look to the nearest HVNodes for more favorable entry or exit.


About

The author, Renato Leonard Capelj, works in finance and journalism.

Capelj spends the bulk of his time at Physik Invest, an entity through which he invests and publishes free daily analyses to thousands of subscribers. The analyses offer him and his subscribers a way to stay on the right side of the market. Separately, Capelj is an options analyst at SpotGamma and an accredited journalist.

Capelj’s past works include conversations with investor Kevin O’Leary, ARK Invest’s Catherine Wood, FTX’s Sam Bankman-Fried, Lithuania’s Minister of Economy and Innovation Aušrinė Armonaitė, former Cisco chairman and CEO John Chambers, and persons at the Clinton Global Initiative.

Connect

Direct queries to renato@physikinvest.com or find Physik Invest on TwitterLinkedInFacebook, and Instagram.

Calendar

You may view this letter’s content calendar at this link.

Disclaimer

Do not construe this newsletter as advice. All content is for informational purposes.

Categories
Commentary

Daily Brief For February 9, 2023

Physik Invest’s Daily Brief is read by thousands of subscribers. You, too, can join this community to learn about the fundamental and technical drivers of markets.

Graphic updated 7:20 AM ET. Sentiment Neutral if expected /ES open is inside of the prior day’s range. /ES levels are derived from the profile graphic at the bottom of this letter. Click here for the latest levels. SqueezeMetrics Dark Pool Index (DIX) and Gamma (GEX) with the latter calculated based on where the prior day’s reading falls with respect to the MAX and MIN of all occurrences available. A higher DIX is bullish. At the same time, the lower the GEX, the more (expected) volatility. Click to learn the implications of volatility, direction, and moneyness. Breadth reflects a reading of the prior day’s NYSE Advance/Decline indicator. The CBOE VIX Volatility Index (INDEX: VVIX) reflects the attractiveness of owning volatility.

Positioning

The cross-cutting forces on inflation are set to net out says Bob Elliott, the CIO at Unlimited. The former Bridgewater Associates executive thinks short-term inflation pressures are skewed upward, and that new data suggests “the respite in inflation … is probably going to fade and higher numbers are going to print.”

In short, disinflation from oil prices and the amelioration of supply chains “cannot persist, and that’s what we’re seeing now. It looks like those upward pressures on inflation are moving faster than the pace that services prices and housing costs are moving down.”

Consequently, there is a potential for broad inflation measures to remain higher for longer, hence the thinking that the Federal Reserve (Fed) indeed stays tougher on inflation for longer (i.e., higher rates for longer). This would support traders’ recent desire to bet large on downside movement next week when the Consumer Price Index (CPI) is set to update.

Publicized by Kai Volatility’s Cem Karsan and Damped Spring’s Andy Constan, some trader(s) bought to open 24,000 put options at the $4,050.00 S&P 500 (FUTURE: /ES) strike expiring February 17, 2023. The trade coincided with market makers selling to open “roughly 7,200 [/ES] futures contracts worth roughly $1.5 billion.” This “caused the local low,” Constan, who also worked at Bridgewater (and your letter writer had the honor of interviewing before), explained.

This trade, and others like it, compounded the pressures of the dealers selling their existing stock and futures “to re-hedge their call options exposures that are declining in value.”

Graphic: Retrieved from SqueezeMetrics.

Accordingly, the Cboe Volatility Index (INDEX: VIX) is bid, as is the Cboe VIX Volatility Index (INDEX: VVIX), which your letter writer talked about in a SpotGamma note last night. Basically, traders are hedging more, and this is observed by previously low readings of convexity moving higher. Still, given that there is still some time to CPI, there’s potential for “current prices the SPX trades at [to] appear sticky for lack of better phrasing,” SpotGamma explained; pre-CPI, traders often sell short-term volatility as a bet on limited movement. It’s the post-CPI expirations in which implied volatility (IVOL) is wound and will serve as a catalyst for a fast move higher or lower. 

Graphic: Retrieved from TradingView. Blue = VVIX. Orange = VIX.

So, in the short-term, there may be some pinning, followed by an expansion of range into the mid-February (2/17) monthly options expiration (OpEx). This event likely puts the market in a precarious position and at the whims of macro-type repositioning, which may be bearish based on the insights this letter has covered in the past.

Graphic: Retrieved from Physik Invest. Data from SqueezeMetrics. Gamma exposure is set to fall in mid-February, and this may result in less support from the options market.

Trades that look and are working well include those that use short-call vertical credits to finance long-put vertical debits out months from now. For instance, for every two units of short call verticals (SOLD -1 VERTICAL SPX 100 19 MAY 23 [AM] 4150/4200 CALL), your letter writer is looking to own one unit of the long put vertical (BUY +1 VERTICAL SPX 100 16 JUN 23 [AM] 3450/3350 PUT). Remember that your letter writer may not necessarily think the market will trade that far, rather it may be a bet on IVOL repricing.

A case study on last week’s ultra-successful call ratio spreads is coming soon. Take care and watch your risk!

Technical

As of 7:20 AM ET, Thursday’s regular session (9:30 AM – 4:00 PM ET), in the S&P 500, is likely to open in the upper part of a positively skewed overnight inventory, inside of the prior day’s range, suggesting a limited potential for immediate directional opportunity.

The S&P 500 pivot for today is $4,168.75. 

Key levels to the upside include $4,189.00, $4,202.75, and $4,214.25.

Key levels to the downside include $4,153.25, $4,136.25, and $4,122.75.

Disclaimer: Click here to load the updated key levels via the web-based TradingView platform. New links are produced daily. Quoted levels likely hold barring an exogenous development.

Graphic: 65-minute profile chart of the Micro E-mini S&P 500 Futures.

Definitions

Volume Areas: Markets will build on areas of high-volume (HVNodes). Should the market trend for a period of time, this will be identified by a low-volume area (LVNodes). The LVNodes denote directional conviction and ought to offer support on any test.

If participants auction and find acceptance in an area of a prior LVNode, then future discovery ought to be volatile and quick as participants look to the nearest HVNodes for more favorable entry or exit.


About

The author, Renato Leonard Capelj, works in finance and journalism.

Capelj spends the bulk of his time at Physik Invest, an entity through which he invests and publishes free daily analyses to thousands of subscribers. The analyses offer him and his subscribers a way to stay on the right side of the market. Separately, Capelj is an options analyst at SpotGamma and an accredited journalist.

Capelj’s past works include conversations with investor Kevin O’Leary, ARK Invest’s Catherine Wood, FTX’s Sam Bankman-Fried, Lithuania’s Minister of Economy and Innovation Aušrinė Armonaitė, former Cisco chairman and CEO John Chambers, and persons at the Clinton Global Initiative.

Connect

Direct queries to renato@physikinvest.com or find Physik Invest on TwitterLinkedInFacebook, and Instagram.

Calendar

You may view this letter’s content calendar at this link.

Disclaimer

Do not construe this newsletter as advice. All content is for informational purposes.

Categories
Commentary

Daily Brief For February 7, 2023

Physik Invest’s Daily Brief is read by thousands of subscribers. You, too, can join this community to learn about the fundamental and technical drivers of markets.

Graphic updated 7:00 AM ET. Sentiment Neutral if expected /ES open is inside of the prior day’s range. /ES levels are derived from the profile graphic at the bottom of this letter. Click here for the latest levels. SqueezeMetrics Dark Pool Index (DIX) and Gamma (GEX) with the latter calculated based on where the prior day’s reading falls with respect to the MAX and MIN of all occurrences available. A higher DIX is bullish. At the same time, the lower the GEX, the more (expected) volatility. Click to learn the implications of volatility, direction, and moneyness. Breadth reflects a reading of the prior day’s NYSE Advance/Decline indicator. The CBOE VIX Volatility Index (INDEX: VVIX) reflects the attractiveness of owning volatility.

Fundamental

In late December 2022, this letter unpacked the likelihood that concerns over inflation were overblown. Strength in markets would re-appear despite earnings deterioration.

Graphic: Retrieved from Morgan Stanley (NYSE: MS) via The Market Ear.

“If the market sniffs out an inflation-driven pause or a pivot from the Fed, even before a drawdown in risk assets is seen, we may get a disinflation rally,” this letter quoted Andreas Steno Larsen explaining. Accordingly, when the Fed upped its benchmark rate by 25 basis points last week and chairman Jerome Powell appeared “not ‘overly combative,” traders turned ultra-optimistic and levered up.

Notwithstanding, the Damped Spring’s Andy Constan believes that pressures are set to remain strong. Traders are pricing higher rates for longer after some new data last week, and the flow of capital, out of capital markets (via quantitative tightening or QT), will be a strong headwind. 

Graphic: Retrieved from Bloomberg.

Fabian Wintersberger added that if central banks, indeed, are “more restrictive for longer to dampen the pressure of rising consumer prices, … [this] supports the thesis that stocks and bonds will have to fall … [leading] to a demand shift, back from financial markets into the real economy, … [and] the current consumer price disinflation is probably just an injury break before we see the real slowdown between inflation and central banks next year.” Consequently, the double-top inflation playbook appears intact, and volatility in financial markets is likely to persist. 

Positioning

Late last week, this letter talked about data that pointed to weaker returns over a 5- to 10-day window. This was, in part, the result of short-dated options activity. After implied volatility (IVOL) compression helped catalyze a rally, SpotGamma, noted that traders’ open interest at slightly higher S&P 500 (INDEX: SPX) prices, and associated counterparty hedging, would likely result “in range suppression or pressure” as time passes and volatility falls. Why? Well, if a long call option’s probability of having value at expiration falls, the counterparty’s risk falls as well and, so, they can sell some of their hedges. This is market pressure.

Graphic: Retrieved from SqueezeMetrics.

Anyways, SpotGamma added, yesterday, that “pressure surfaced just when the … data said it was most likely to surface. This appears coincidental, however … [as] the SPX drops began during the first round of [some] VIX [trades]. Some traders entered into 300,000 VIX March 24 and 26 strike calls. The selling accelerated into Monday when nearly 122,000 VIX June 30/40 call spreads fired off. Dealers who may be short VIX calls are likely hedged with VIX futures (or other long volatility hedges). This hedging is market pressure.”

Graphic: Retrieved from SpotGamma’s PM Note on 2/6/2023.

If you’re playing for expansive moves, an attractive way to protect portfolios includes selling rich call verticals to finance put verticals with months left before expiration.

Technical

As of 7:00 AM ET, Tuesday’s regular session (9:30 AM – 4:00 PM ET), in the S&P 500, is likely to open in the middle part of a balanced overnight inventory, inside of the prior day’s range, suggesting a limited potential for immediate directional opportunity.

The S&P 500 pivot for today is $4,122.75. 

Key levels to the upside include $4,136.75, $4,147.00, and $4,165.75.

Key levels to the downside include $4,100.25, $4,079.00, and $4,052.25.

Disclaimer: Click here to load the updated key levels via the web-based TradingView platform. New links are produced daily. Quoted levels likely hold barring an exogenous development.

Graphic: 65-minute profile chart of the Micro E-mini S&P 500 Futures.

Definitions

Volume Areas: Markets will build on areas of high-volume (HVNodes). Should the market trend for a period of time, this will be identified by a low-volume area (LVNodes). The LVNodes denote directional conviction and ought to offer support on any test.

If participants auction and find acceptance in an area of a prior LVNode, then future discovery ought to be volatile and quick as participants look to the nearest HVNodes for more favorable entry or exit.

POCs: Areas where two-sided trade was most prevalent in a prior day session. Participants will respond to future tests of value as they offer favorable entry and exit.


About

The author, Renato Leonard Capelj, works in finance and journalism.

Capelj spends the bulk of his time at Physik Invest, an entity through which he invests and publishes free daily analyses to thousands of subscribers. The analyses offer him and his subscribers a way to stay on the right side of the market. Separately, Capelj is an options analyst at SpotGamma and an accredited journalist.

Capelj’s past works include conversations with investor Kevin O’Leary, ARK Invest’s Catherine Wood, FTX’s Sam Bankman-Fried, Lithuania’s Minister of Economy and Innovation Aušrinė Armonaitė, former Cisco chairman and CEO John Chambers, and persons at the Clinton Global Initiative.

Connect

Direct queries to renato@physikinvest.com or find Physik Invest on TwitterLinkedInFacebook, and Instagram.

Calendar

You may view this letter’s content calendar at this link.

Disclaimer

Do not construe this newsletter as advice. All content is for informational purposes.

Categories
Commentary

Daily Brief For January 23, 2023

Physik Invest’s Daily Brief is read by thousands of subscribers. You, too, can join this community to learn about the fundamental and technical drivers of markets.

Graphic updated 7:15 AM ET. Sentiment Neutral if expected /ES open is inside of the prior day’s range. /ES levels are derived from the profile graphic at the bottom of this letter. Levels may have changed since initially quoted; click here for the latest levels. SqueezeMetrics Dark Pool Index (DIX) and Gamma (GEX) with the latter calculated based on where the prior day’s reading falls with respect to the MAX and MIN of all occurrences available. A higher DIX is bullish. At the same time, the lower the GEX, the more (expected) volatility. Click to learn the implications of volatility, direction, and moneyness. Breadth reflects a reading of the prior day’s NYSE Advance/Decline indicator. The CBOE VIX Volatility Index (INDEX: VVIX) measure reflects the total attractiveness of owning volatility.

Administrative

Your letter writer has returned after a period of travel. Now, there is a lot of content to cover, so we’ll give it a good shot today and fill in some of the missing points over the coming days. Thanks!

Fundamental

At its core, the expectation is that the US economy will fall into recession in the first half of 2023, and traders are betting policymakers will reverse in the second half of the year. This, in part, has boosted the S&P 500 (INDEX: SPX) over the past weeks.

However, many strategists think there is little reason for the policymakers to reverse course, and that will not be good for the markets.

Graphic: Retrieved from Bloomberg. Traders bet big on a peak in interest rates; some have amassed positions “in June 2023 SOFR options targeting a policy peak between 4.75% to 4.875%, and paying a premium of approximately $5.25 million for the hedge.”

As a recap, recall our past letters featuring the likes of Kai Volatility’s Cem Karsan and Credit Suisse Group AG’s (NYSE: CS) Zoltan Pozsar. The inflation conversation began when authorities cut rates and bought bonds, while money was sent to people.

Risk assets were the first to respond; it was easier to borrow and make bets on ideas with a lot of promise in the future. As the economy reopened and demand picked up, supply chains tightened, and prices in the real economy inflated. 

Graphic: Retrieved from Moody’s Corporation (NYSE: MCO).

As argued by Pozsar, Andy Constan, and Joseph Wang, inflation likely trends higher for longer. Trends in de-globalization, supply chain chokepoints and restructuring, and a large credit boom in the banking sector are among the factors to blame.

Policymakers will continue generating negative wealth effects. Collateral damages to the economy (e.g., Alphabet Inc [NASDAQ: GOOGL] [NASDAQ: GOOG] and Spotify Technology SA [NYSE: SPOT] layoffs) are expected, consequently.

Graphic: Retrieved from The Market Ear. Per Morgan Stanley (NYSE: MS), “the single most important driver of equities over the last year has been excess liquidity, and it’s about to turn more restrictive. The amount of liquidity in the system is about to change again – the Treasury is increasing bill issuance sizes, which will drain liquidity from the system. The Treasury could build cash by more than $200 billion over the span of a month – which on top of QT will effectively drain nearly $300 billion from bank reserves – which implies the S&P 500 should be 6% lower over the net month.”

Moreover, per Andreas Steno Larsen, markets likely bottoms in the middle of 2023.

“[Christopher] Waller said that the QT process will either have to slow or come to a complete halt if the amount of USD reserves is equal to 10-11% of USD GDP, which is around 2.5 trillion USDs relative to current GDP (but rising over time obviously).”

Because we have more than $3 trillion USD in the system, and “more to be added due to the debt ceiling, we need a withdrawal of another $5-600 billion before QT will end [or] slow in between weeks 34-40 on our calculations,” Steno Larsen added, noting that if GDP flatlines, that would help keep QT running for longer. 

“If the Fed is willing to bring reserves down to 10% of GDP, we should expect S&P 500 to bottom around $3,250.00 in the second half of the year,” Steno Larsen said. “The Waller Rule is not good news ultimately, but for now let’s enjoy the liquidity added in February and March due to the debt ceiling. When a debt ceiling deal is signed, run for the hills.”

Graphic: Retrieved from Andreas Steno Larsen.

Technical

As of 7:15 AM ET, Monday’s regular session (9:30 AM – 4:00 PM ET), in the S&P 500, is likely to open in the middle part of a balanced overnight inventory, inside of prior-range and -value, suggesting a limited potential for immediate directional opportunity.

Our S&P 500 pivot for today is $3,988.25. 

Key levels to the upside include $3,998.25, $4,011.75, and $4,019.00.

Key levels to the downside include $3,979.75, $3,965.25, and $3,949.00.

Click here to load today’s key levels into the web-based TradingView platform. All levels are derived using the 65-minute timeframe. New links are produced, daily. 

As a disclaimer, the S&P 500 could trade beyond the levels quoted in the letter. Therefore, you should load the above link on your browser for more relevant levels.

Graphic: 65-minute profile chart of the Micro E-mini S&P 500 Futures.

Definitions

Volume Areas: Markets will build on areas of high-volume (HVNodes). Should the market trend for long periods of time, it will be identified by low-volume areas (LVNodes). LVNodes denote directional conviction and ought to offer support on any test.

If participants auction and find acceptance in an area of a prior LVNode, then future discovery ought to be volatile and quick as participants look to HVNodes for favorable entry or exit.

POCs: Denote areas where two-sided trade was most prevalent in a prior day session. Participants will respond to future tests of value as they offer favorable entry and exit.

MCPOCs: Denote areas where two-sided trade was most prevalent over numerous sessions. Participants will respond to future tests of value as they offer favorable entry and exit.

About

In short, an economics graduate working in finance and journalism.

Capelj spends most of his time as the founder of Physik Invest through which he invests and publishes daily analyses to subscribers, some of whom represent well-known institutions.

Separately, Capelj is an equity options analyst at SpotGamma and an accredited journalist interviewing global leaders in business, government, and finance.

Past works include conversations with investor Kevin O’Leary, ARK Invest’s Catherine Wood, FTX’s Sam Bankman-Fried, Lithuania’s Minister of Economy and Innovation Aušrinė Armonaitė, former Cisco chairman and CEO John Chambers, and persons at the Clinton Global Initiative.

Contact

Direct queries to renato@physikinvest.com or Renato Capelj#8625 on Discord.

Calendar

You may view this letter’s content calendar at this link.

Disclaimer

Do not construe this newsletter as advice. All content is for informational purposes.

Categories
Commentary

Daily Brief For November 9, 2022

The daily brief is a free glimpse into the prevailing fundamental and technical drivers of U.S. equity market products. Join the 1,200+ that read this report daily, below!

Graphic updated 8:45 AM ET. Sentiment Neutral if expected /ES open is inside of the prior day’s range. /ES levels are derived from the profile graphic at the bottom of the following section. Levels may have changed since initially quoted; click here for the latest levels. SqueezeMetrics Dark Pool Index (DIX) and Gamma (GEX) calculations are based on where the prior day’s reading falls with respect to the MAX and MIN of all occurrences available. A higher DIX is bullish. At the same time, the lower the GEX, the more (expected) volatility. Learn the implications of volatility, direction, and moneyness. Breadth reflects a reading of the prior day’s NYSE Advance/Decline indicator. VIX reflects a current reading of the CBOE Volatility Index (INDEX: VIX) from 0-100.

Fundamental

A crypto-market leader and a lender of last resort – FTX – co-founded by Sam Bankman-Fried (SBF) was little questioned by many. It appears, however, that the company had growing pain points.

Events are developing quickly, too add. Here is a note that SBF issued to investors after entering into a nonbinding agreement with Binance.

Graphic: Retrieved from @gurgavin on Twitter. Read the story on The Block.

In short, there’s little substance.

Let’s go through the motions and start unpacking this debacle. Should we have loose ends, we’ll address those in the coming days.

In late December of 2021, I spoke with SBF regarding his background and aims with FTX. The resulting work was published on Benzinga.com, where I continue to work part-time as a writer and project lead.

Graphic: Retrieved from Renato Leonard Capelj. On the top is Renato Leonard Capelj. On the bottom is SBF.

In short, SBF is an MIT alumnus who started in finance at Jane Street, a trading firm and liquidity provider. Eventually, he saw an opportunity elsewhere; there were spot price inconsistencies across cryptocurrency exchanges.

SBF then founded the firm Alameda Research in 2017. A focus, there, was to extract premiums to spot via arbitrage. SBF et al would purchase Bitcoin (CRYPTO: BTC) domestically, send it to foreign exchanges to sell at higher prices, and, then, convert and wire the funds back. 

​​“You do have to put together this incredibly sophisticated global corporate framework in order to be able to actually do this trade,” SBF said in one conversation. “That’s the real task, the real hard part.”

In light of some frustration with existing exchange offers, SBF founded FTX.com and FTX.US parent FTX Trading Ltd. As late as September 2022, FTX was seeking $1 billion at a value of $32 billion. The firm was looking to become a one-stop-shop for retail and institutional market participants such as FTX brand ambassador and spokesperson Kevin O’Leary who I talked to just prior to my interview with SBF.

“If you’re being compliant internally and also with regulators in each jurisdiction you operate in, you don’t have the option to be off-sides,” O’Leary explained to me on FTX building one of the larger infrastructures institutions’ compliance departments could easily “work with and external auditors can audit.”

Eventually, the exchange grew to become a major player.

FTX was a top-five exchange, adding market share through acquisitions of players like Blockfolio and LedgerX, as well as building a reputation of transparency, or so it appeared, through its work with regulators.

Adding, SBF said to me he wanted FTX to cater to other asset classes and “become a global liquidity venue across the board.” In mid-to-late this year, FTX added stock trading via no-fee brokerage accounts, a follow-through on his vision.

The expansion narrative cooled, however. There was the collapse of the TerraUSD stablecoin, Celsius Network, Three Arrows Capital, and Voyager Digital, which FTX’s subsidiary in the US, FTX.US, won assets to in an auction this year.

At the surface, it appeared FTX was “seemingly untouchable,” as Immutable Holdings’ Jordan Fried explained online. Check out my last chat with Jordan Fried, here.

However, “cracks started to appear [and] people in crypto were taking notice”; the CEOs of both Alameda Research and FTX.US stepped down. Fried added that the situation worsened when Alameda Research’s balance sheet was leaked.

The firm had $14.6 billion in assets (nearly $4 billion in FTT, which is FTX’s utility token, and about $2 billion in FTT token collateral) against $8 billion in liabilities.

“Binance owns a bunch of FTT themselves and, two days ago, Changpeng Zhao (CZ) [who is the] founder of Binance, [said] that SBF … could be lobbying to get regulators to help out FTX more than Binance.” In response, CZ was to “dump all $2 billion of FTT” Binance was holding.

This coincided with a large selling pressure on the FTX utility token. With Alameda Research having ~50% of their assets in FTT, Fried says, “they were dead in the water”. A run appeared likely and, with FTX and Alameda Research’s dealings so intertwined, “the failure of one meant the failure of another.”

On the heels of billions in withdrawals, users weren’t “getting their cash” and, ultimately, in SBF seeking to protect users’ assets, FTX entered into a strategic transaction with Binance.

The follow-on impacts of this week’s events, during which SBF saw a ~90% wipeout of his wealth, can be speculated on. Apparent losers include SoftBank Group Corporation’s (OTC: SFTBY) Vision Fund, the Ontario Teachers’ Pension Plan, and Tiger Global Management.

Some, including Arthur Breitman of Tezos (CRYPTO: XTZ), mulled the impact of FTX’s potential divestment from Solana (CRYPTO: SOL) which “took a drubbing Tuesday,” along with just about every other crypto token including Bitcoin.

Graphic: Retrieved from Bloomberg.

Noteworthy are the impacts of this crypto-market turmoil in equities. As I stated in a note to SpotGamma subscribers yesterday, following “news of a liquidity crunch at FTX, when the selling accelerated in FTT [] and Bitcoin, so did the selling in the S&P 500.”

“The bottom, in all three products, happened at 2:30 PM ET.”

Graphic: Retrieved by Physik Invest from TradingView.

I add that these products – S&P 500 (INDEX: SPX) and Bitcoin – have traded in sync and held positive correlations.

In short, both are recipients of the same risk-on and -off flows. Easy monetary policies cut financial asset volatility and pushed market participants into riskier investments. In short, it was easier to borrow and make longer-duration bets on ideas (e.g., crypto and Ponzi-like DeFi, growth, risky private equity investments) with a lot of promise in the future. 

Financial asset investments were more attractive. That’s, in part, why we saw asset inflation early on in 2020 when policymakers embarked on historic interventions.

Monetary authorities cut interest rates and bought bonds, all the while money was sent to people. Risk assets were the first to respond. Then, as the economy reopened, demand picked up, supply chains tightened, and prices in the real economy inflated.

As we added on Monday, de-globalization and persistent supply chokepoints (e.g., Ukraine and Russia) have done little to help. Inflation remains a problem and investors are seeking safety amid Fed intervention. 

Financial assets are in less demand while real assets are in more demand. A disruption (or reversal) in these policies puts at risk the prevailing carry regime. A stock and crypto market drop is, in part, the result of an unwind in carry. 

The drop is a deflationary shock, precisely what policymakers are seeking, per Credit Suisse Group AG’s (NYSE: CS) Zoltan Pozsar who says inflation is a structural issue, and “we [have] to generate a round of negative wealth effects to lower demand such that it becomes more in line with the new realities of supply.” 

As we established on Monday, that invokes “collateral damage to the US economy,” S&P Global Inc (NYSE: SPGI) economists have put forth “as households and businesses pull back spending and investment.” 

For example, just announced today, Meta Platforms Inc (NASDAQ: META), which became wrapped up in the speculativeness of the early 2020s reaching beyond the crypto markets, hence the name change from Facebook Inc, is seeking to cut 11,000 jobs.

Per Bloomberg, “the macroeconomic downturn, increased competition, and ads signal loss have caused [] revenue to be much lower than expected.”

Ultimately, a deflationary pulse manifesting disinflation in consumer prices may prompt the policymakers to reverse on rates and efforts like quantitative tightening (QT), the (out)flow of capital from capital markets.

We’re seeing demand erode and many businesses starting to suffer the effects of a switch to “just-in-case” from “just-in-time,” according to S&P Global Inc. Inventories (which are to be sold at a loss) are piling up and workers are needed less.

That’s a recession.

Graphic: Retrieved from Bloomberg. “The overhang is leading to canceled orders, a sharp slowdown in global trade growth and stagnating factory activity. On one hand, it’s good that logistics networks are seeing relief from the logjams that plagued the start of 2022 — ocean-shipping rates have tumbled close to pre-pandemic levels and delivery times are shortening.”

This said, the “risk of recession, whether it is real or merely implied by an inversion of the yield curve, won’t deter the Fed from hiking rates higher faster or from injecting more volatility to build up negative wealth effects.”

“Rallies could beget more forceful pushback from the Fed,” which is a concern given the poor performance in implied volatility (IVOL) that’s resulted in participants’ disinterest in maintaining their hedges this year; equities’ left tail is growing.

Graphic: Retrieved from Bloomberg. Initially created by QVR Advisors. “When shares drop, demand for fresh protection remains subdued given the unusually thin positioning among big money. At the same time, put owners quickly book profits, often leading to a drop in implied vol.

In summary, there’s no longer “a disinterest and unimportance to cash flows.” The commitment to reducing liquidity and credit has consequences on the real economy and asset prices which rose and kept the deflationary pressure of policies at bay.  

It is elevated volatility and persistent declines that are to prompt investors to lower their selling prices in risk(ier) assets (e.g., options bets, metals, cryptocurrency and stablecoins, equities, bonds), and compete for cash.

Positioning

Based on traders’ current positioning, the market, absent exogenous shocks, is more so prone to sharp upside reversals and a slow(er) grind lower.

As the former Bridgewater Associate Andy Constan explained to me once, therefore, you “want Deltas and leverage” via options trades that are defined risk and two-to-four months out in maturity.

We shall go more into this, later.

Technical

As of 8:45 AM ET, Wednesday’s regular session (9:30 AM – 4:00 PM ET), in the S&P 500, is likely to open in the lower part of a negatively skewed overnight inventory, inside of prior-range and -value, suggesting a limited potential for immediate directional opportunity.

In the best case, the S&P 500 trades higher.

If above the $3,828.75 HVNode, the $3,874.25 HVNode is in play. Initiative trade beyond the latter could reach as high as the $3,909.25 MCPOC and $3,936.25 ONH, or higher.

In the worst case, the S&P 500 trades lower.

If above the $3,828.75 HVNode, the $3,806.25 LVNode is in play. Initiative trade beyond the latter could reach as low as the $3,787.00 VPOC and $3,727.00 VPOC, or lower.

Click here to load today’s key levels into the web-based TradingView charting platform. Note that all levels are derived using the 65-minute timeframe. New links are produced, daily.

Graphic: 65-minute profile chart of the Micro E-mini S&P 500 Futures.

Definitions

Volume Areas: A structurally sound market will build on areas of high volume (HVNodes). Should the market trend for long periods of time, it will lack sound structure, identified as low volume areas (LVNodes). LVNodes denote directional conviction and ought to offer support on any test. 

If participants were to auction and find acceptance into areas of prior low volume (LVNodes), then future discovery ought to be volatile and quick as participants look to HVNodes for favorable entry or exit.

POCs: POCs are valuable as they denote areas where two-sided trade was most prevalent in a prior day session. Participants will respond to future tests of value as they offer favorable entry and exit.

MCPOCs: POCs are valuable as they denote areas where two-sided trade was most prevalent over numerous day sessions. Participants will respond to future tests of value as they offer favorable entry and exit.

About

After years of self-education, strategy development, mentorship, and trial-and-error, Renato Leonard Capelj began trading full-time and founded Physik Invest to detail his methods, research, and performance in the markets.

Capelj also develops insights around impactful options market dynamics at SpotGamma and is a Benzinga reporter.

Some of his works include conversations with ARK Invest’s Catherine Wood, investors Kevin O’Leary and John Chambers, FTX’s Sam Bankman-Fried, ex-Bridgewater Associate Andy Constan, Kai Volatility’s Cem Karsan, The Ambrus Group’s Kris Sidial, among many others.

Disclaimer

In no way should the materials herein be construed as advice. Derivatives carry a substantial risk of loss. All content is for informational purposes only.

Categories
Commentary

Daily Brief For September 20, 2022

The daily brief is a free glimpse into the prevailing fundamental and technical drivers of U.S. equity market products. Join the 900+ that read this report daily, below!

Graphic updated 6:20 AM ET. Sentiment Neutral if expected /ES open is inside of the prior day’s range. /ES levels are derived from the profile graphic at the bottom of the following section. Levels may have changed since initially quoted; click here for the latest levels. SqueezeMetrics Dark Pool Index (DIX) and Gamma (GEX) calculations are based on where the prior day’s reading falls with respect to the MAX and MIN of all occurrences available. A higher DIX is bullish. At the same time, the lower the GEX, the more (expected) volatility. Learn the implications of volatility, direction, and moneyness. Breadth reflects a reading of the prior day’s NYSE Advance/Decline indicator. VIX reflects a current reading of the CBOE Volatility Index (INDEX: VIX) from 0-100.

Fundamental

A hot topic over the past sessions is speculation on the Federal Reserve’s (Fed) next steps and the impact those steps may have.

Further, in the news, last night, aside from the prospects of another big hike, was “the biggest annual increase since 1994” in two-year Treasury yields. That’s in part due to recent upside surprises in inflation talked about yesterday and last week.

Graphic: Retrieved from Bloomberg. US Government Bonds 2 YR Yield and Fed Funds.

Per the CME Group Inc’s (NASDAQ: CME) FedWatch Tool, there’s a near-80% chance of a 50 to 75 basis point bump to the target rate, as the Fed looks to stem inflation.

Graphic: Retrieved from CME Group Inc (NASDAQ: CME).

This is all the while the Fed will let their Treasuries mature and, “instead of using the proceeds to buy another Treasury,” they will “buy nothing and reduce their balance sheet,” explained the Damped Spring’s Andy Constan.

Accordingly, “to pay that bond off, the US Treasury has to issue a bond,” and this bond will need to be “bought by the private sector” which has “to sell something to buy the bond, and that starts at the riskiest asset,” like crypto, watches, and cars, for instance.

Let’s unpack this further, below.

The transmission mechanism of quantitative easing (QE) and tightening (QT) is very weak “to economic activity but very strong to financial markets.”

In a detailed explainer, initially quoted in the September 16 letter, we learned “QE creates new reserves on bank balance sheets. The added cushion gives banks … more room to lend or to finance trading activity by hedge funds, … further enhancing market liquidity.”

Therefore, QE (QT) will mildly inflate (deflate) the economy as asset owners are pushed further out (in) on the risk curve. In practice, with QE, owners get pushed from Treasury to corporate bonds, bonds to equities, equities to crypto, and, finally, homes, watches, cars, and beyond.

With QT, as put forth, earlier, the reverse happens.

As Joseph Wang, author of Central Banking 101, said, in short, with QT “consumers have less wealth to spend” and this means that drops in financial markets and the tightening of “financial conditions impact the real economy,” negatively, albeit not as harshly as a rise in interest rates.

Unpacking further, with the Treasury set to increase issuance, thus boosting the government’s checking account, or Treasury General Account (TGA), “the level of reserves in the banking system declines, or the level of RRP could also decline,” Wang added.

This is as all of the above are liabilities to the Fed. Therefore, money comes out of the economy, via a fall in reserves, and this is put into the government’s checking account (TGA boost).

The linked reduction in bank deposits and reserves bolsters “repurchase agreement rates and borrowing benchmarks linked to them,” per Bloomberg. This, then, may play into “an additional tightening of overall financial conditions,” as mentioned, earlier.

Graphic: Via Physik Invest. Data compiled by @jkonopas623. Fed Balance Sheet data, here. Treasury General Account Data, here. Reverse Repo data, here. NL = BS – TGA – RRP.

Here’s a provision.

It’s the case that the Fed believes it needs a certain level of reserves for the proper functioning of the financial system (~$2 trillion). Wang explained that in 2019, banks dumped a lot of their reserves into repo to earn some extra return. 

When QT was about to end, there was less money in their reserves which preceded a spike in rates and a blow-up among those who needed the money the most, as explained here.

Graphic: Retrieved via Bloomberg.

“The Fed saw the system breaking at around 8% GDP and thinks that is where the limit is,” he added. “This suggests, going forward, the Fed is going to have to do something to top up the reserves in the banking system, and they have tools to do that.”

What’s the result, then?

These tools include capping the RRP, “forcing money out into the banking system,” as well as modifying the supplementary leverage ratio (SLR), making it “cheaper for banks to maintain a large balance sheet.”

Together, this, ultimately, may increase “the capacity of banks to make loans [and] create credit, so that is financial easing.”

As Wang said in another work best: These “easing effects may even overwhelm the tightening impact of a marginally longer QT.”

So, what can we expect? 

In terms of timelines, Wang puts forth that economic data will likely prompt a mid-2023 cut in rates, which is in line with what the futures market is pricing.

Graphic: Retrieved from CME Group Inc (NASDAQ: CME).

Before then, traders are pricing nearly 225 to 250 basis points of rate increases. Based on where rates are at, now, some argue the market may still be too expensive.

Graphic: Retrieved from Bloomberg via Michael J. Kramer. “What is amazing is how expensive this market is relative to rates. The spread between the S&P 500 Earnings yield and the 10-Yr nominal rate is at multi-year lows.”

Positioning

We’ve talked about this before but what is expected, after Wednesday’s Fed update, is a move that is “structural,” as Kai Volatility’s Cem Karsan has put it before, and “a function of inevitable rebalancing of dealer inventory post-event.”

“The second move and final resolution, if you wait for it, is usually tied to the incremental effects on liquidity (QE/QT).”

Should participants’ fears with respect to the pace of tightening, for one, be assuaged, then it is likely that the protection demanded heading into the meeting, that’s bidding measures of implied volatility (IVOL), is supplied. This likely provides a boost.

From thereon, markets are more at the whims of macro-type positioning on rising rates and the withdrawal of liquidity.

Technical

As of 6:20 AM ET, Tuesday’s regular session (9:30 AM – 4:00 PM ET), in the S&P 500, is likely to open in the lower part of a negatively skewed overnight inventory, inside of prior-range and -value, suggesting a limited potential for immediate directional opportunity.

In the best case, the S&P 500 trades higher.

Any activity above the $3,909.25 MCPOC puts into play the $3,936.25 ONH. Initiative trade beyond the ONH could reach as high as the $3,964.75 HVNode and $4,001.00 VPOC, or higher.

In the worst case, the S&P 500 trades lower.

Any activity below the $3,909.25 MCPOC puts into play the $3,885.00 VPOC. Initiative trade beyond the VPOC could reach as low as the $3,857.25 and $3,826.25 HVNode, or lower.

Click here to load today’s key levels into the web-based TradingView charting platform. Note that all levels are derived using the 65-minute timeframe. New links are produced, daily.
Graphic: 65-minute profile chart of the Micro E-mini S&P 500 Futures.

Definitions

Volume Areas: A structurally sound market will build on areas of high volume (HVNodes). Should the market trend for long periods of time, it will lack sound structure, identified as low volume areas (LVNodes). LVNodes denote directional conviction and ought to offer support on any test. 

If participants were to auction and find acceptance into areas of prior low volume (LVNodes), then future discovery ought to be volatile and quick as participants look to HVNodes for favorable entry or exit.

POCs: POCs are valuable as they denote areas where two-sided trade was most prevalent in a prior day session. Participants will respond to future tests of value as they offer favorable entry and exit.

MCPOCs: POCs are valuable as they denote areas where two-sided trade was most prevalent over numerous day sessions. Participants will respond to future tests of value as they offer favorable entry and exit.

About

After years of self-education, strategy development, mentorship, and trial-and-error, Renato Leonard Capelj began trading full-time and founded Physik Invest to detail his methods, research, and performance in the markets.

Capelj also develops insights around impactful options market dynamics at SpotGamma and is a Benzinga reporter.

Some of his works include conversations with ARK Invest’s Catherine Wood, investors Kevin O’Leary and John Chambers, FTX’s Sam Bankman-Fried, ex-Bridgewater Associate Andy Constan, Kai Volatility’s Cem Karsan, The Ambrus Group’s Kris Sidial, among many others.

Disclaimer

In no way should the materials herein be construed as advice. Derivatives carry a substantial risk of loss. All content is for informational purposes only.