Categories
Commentary

Daily Brief For November 9, 2021

What Happened

Overnight, equity index futures were divergent.

The Nasdaq-100 led while the Russell 2000, which broke out of massive range, recently, slowed its pace of price discovery, trading relatively weak.

Ahead is data on the PPI (8:30 AM ET) and real household debt (11:00 AM ET).
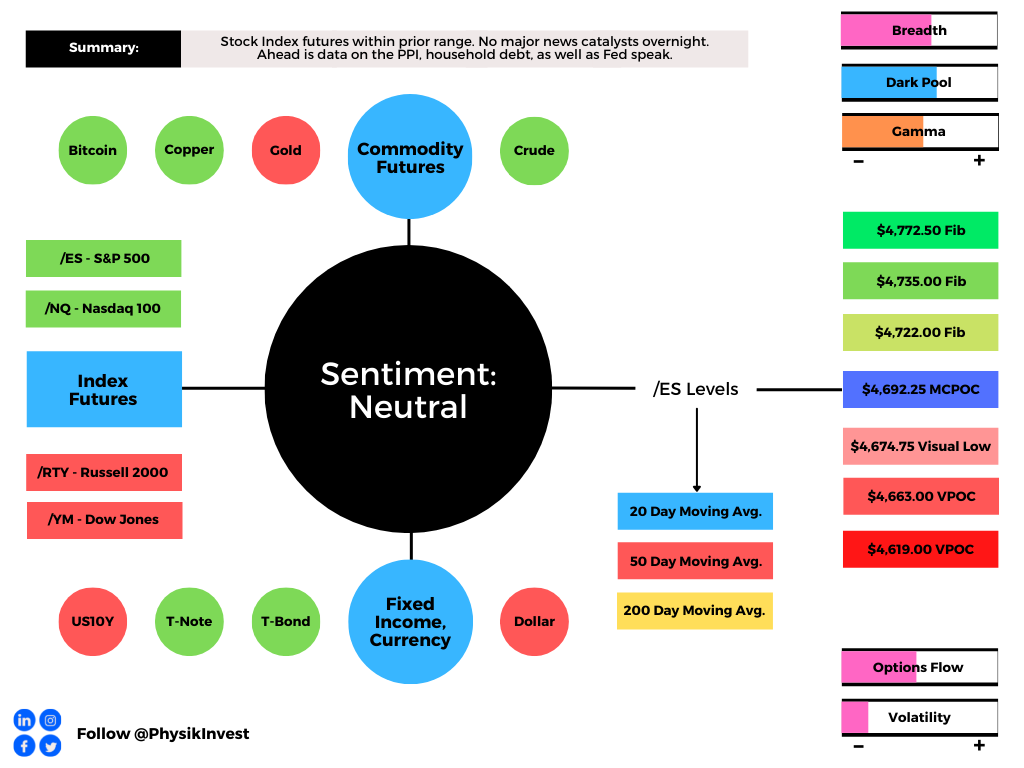
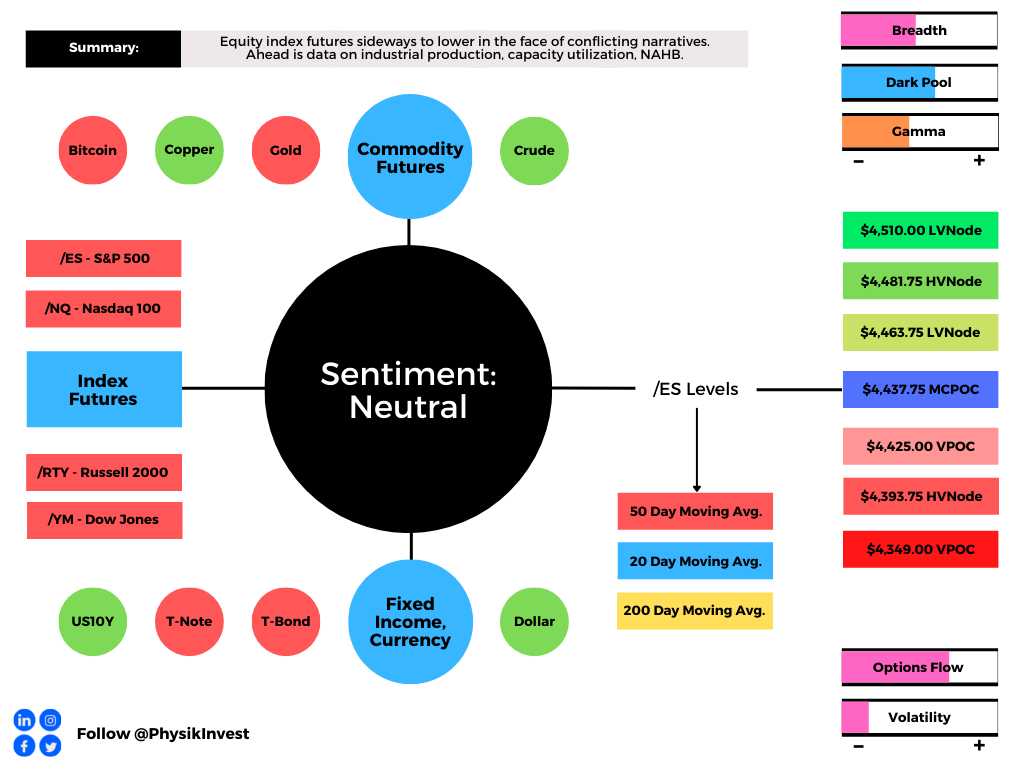
Graphic updated 6:20 AM ET. Sentiment Neutral if expected /ES open is inside of the prior day’s range. /ES levels are derived from the profile graphic at the bottom of the following section. Levels may have changed since initially quoted; click here for the latest levels. SqueezeMetrics Dark Pool Index (DIX) and Gamma (GEX) calculations are based on where the prior day’s reading falls with respect to the MAX and MIN of all occurrences available. A higher DIX is bullish. At the same time, the lower the GEX, the more (expected) volatility. Learn the implications of volatility, direction, and moneyness. SHIFT data used for S&P 500 (INDEX: SPX) options activity. Note that options flow is sorted by the call premium spent; if more positive then more was spent on call options. Breadth reflects a reading of the prior day’s NYSE Advance/Decline indicator. VIX reflects a current reading of the CBOE Volatility Index (INDEX: VIX) from 0-100.

What To Expect

On lackluster intraday breadth and supportive market liquidity metrics, the best case outcome occurred, evidenced by the balance and overlap of value areas (i.e., where 70% of the prior day’s trade occurred, or +/- 1 standard deviation), at the current S&P 500 prices.

This activity, which marks a potential willingness to continue balance as participants seek new information to resolve on, is built on poor structure, a dynamic that adds to technical instability.
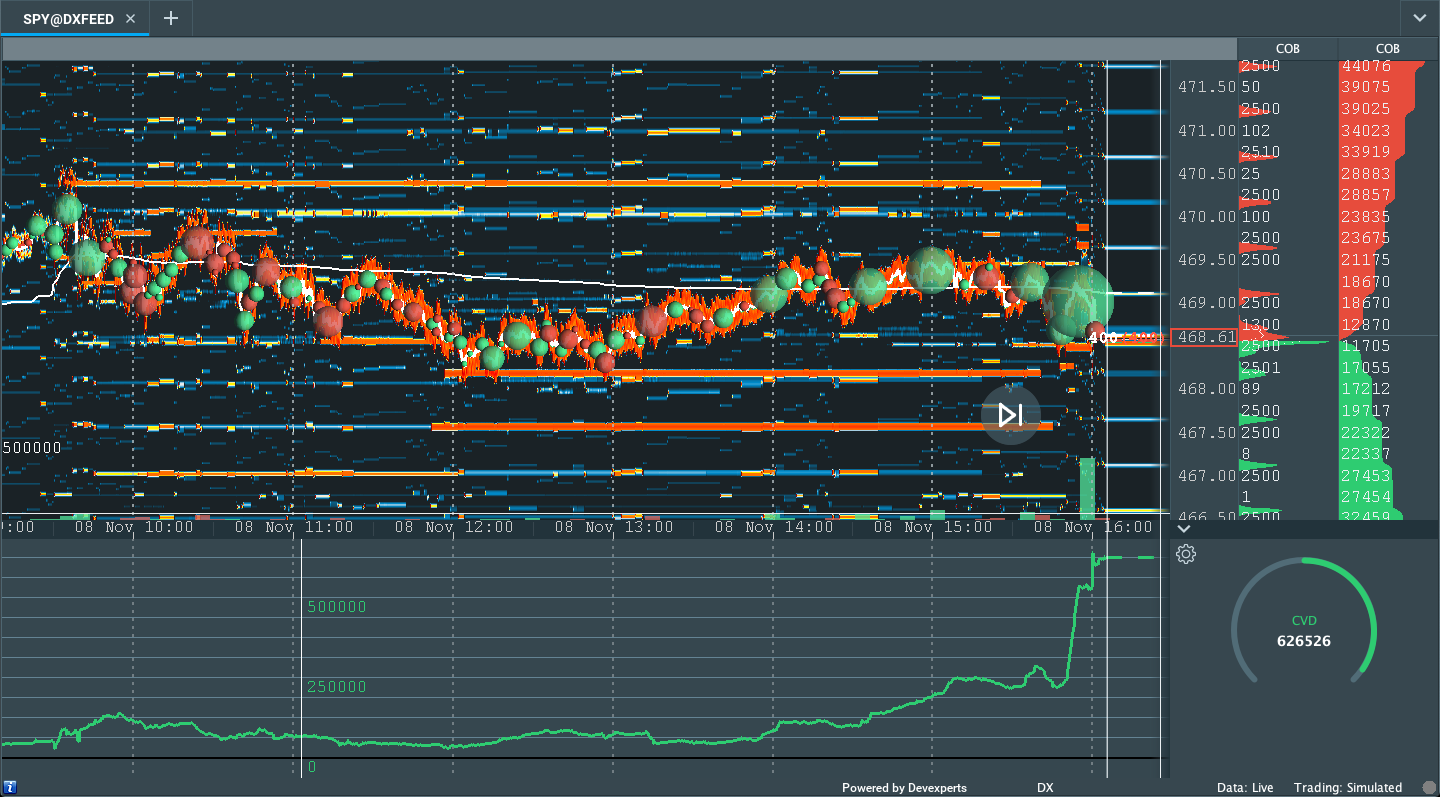
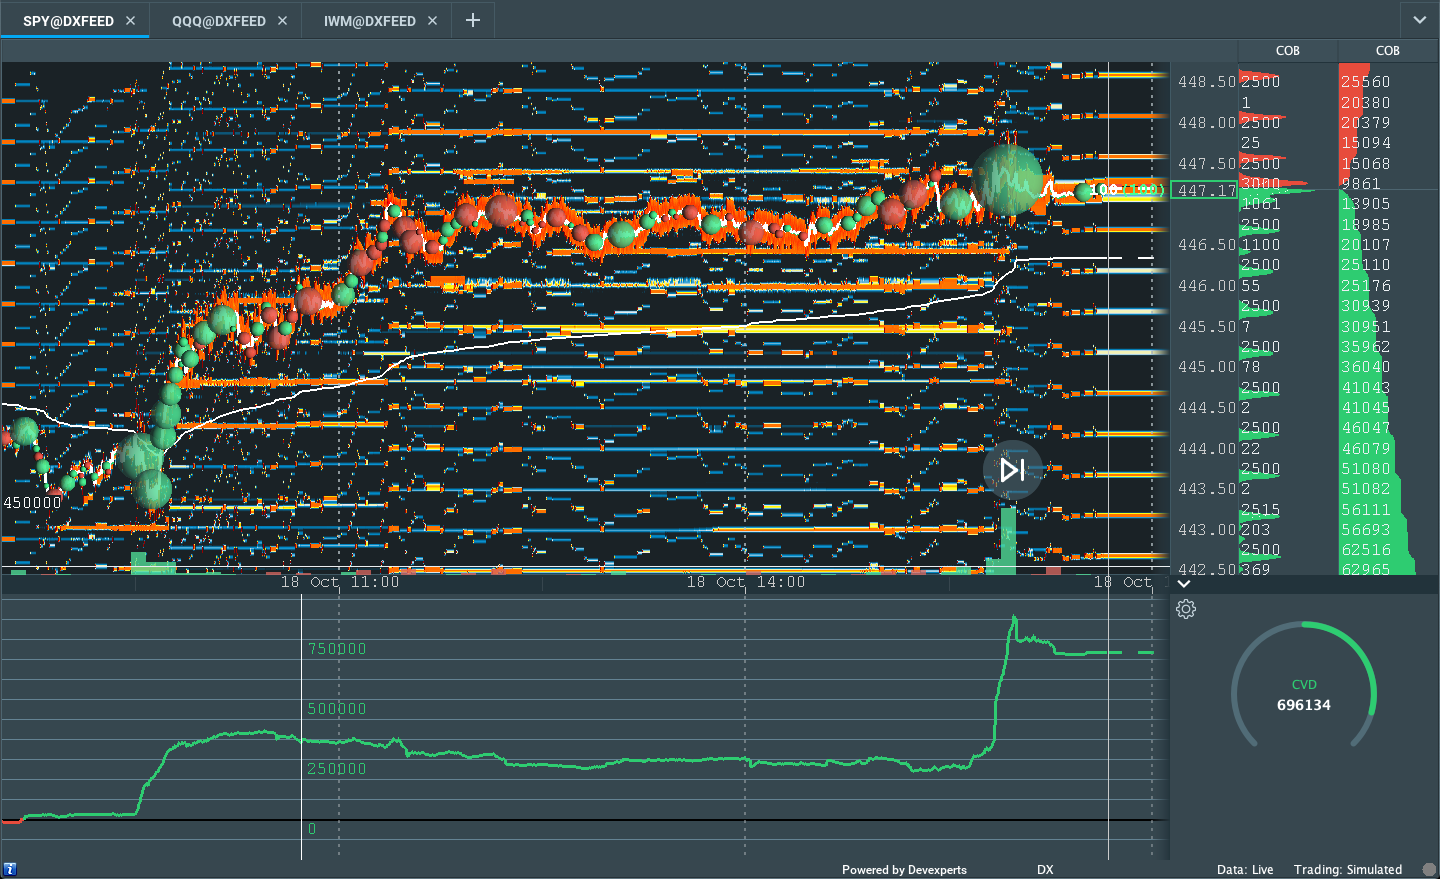
Graphic: Supportive delta (i.e., committed buying as measured by volume delta or buying and selling power as calculated by the difference in volume traded at the bid and offer) in SPDR S&P 500 ETF Trust (NYSE: SPY), one of the largest ETFs that track the S&P 500 index, via Bookmap. The readings are supportive of responsive trade (i.e., rotational trade that suggests current prices offer favorable entry and exit; the market is in balance).

Context: The aforementioned trade is happening in the context of a lot of big-picture dynamics such as the growth of derivatives exposure and tail risk, the heightened moneyness of nonmonetary assets, trends in seasonality, buybacks, earnings surprises, and more.

The implications of these themes on price are contradictory.

To elaborate, on one hand, seasonality, buybacks, and earnings surprises have bolstered (and will continue to bolster) the most recent price rise, since early October. 

Similarly, participants are seeing a trend of outperformance in the extended day, due in part to the front-running of increasingly impactful vanna and charm flows (both of which are tied to the hedging of options exposure), as a result of increased options activity (which, at least at this juncture, exposes customers to high leverage and risk). 

I say “high leverage and risk” as a result of short-term speculators’ record call buying and put selling over the past weeks.

As stated in a SpotGamma note, yesterday, “Should there be an adverse move, those short-term speculators are likely to cover (sell) their short put (long call) positions as they lack the wherewithal (capital) to maintain exposure.”

With exposure concentrated in shorter-dated expiries, the November 19 monthly options expiration (OPEX) is somewhat of a concern for us.

The reason being?

Presently, the S&P 500 is pinned near options strikes at which positive options gamma – delta sensitivity to underlying price – is highest. 

I note those participants that take the other side of options trades will hedge their exposure to risk by buying and selling the underlying. 

When dealers are short-gamma (e.g., Tesla), they buy into strength and sell into weakness, exacerbating volatility. 

When long-gamma, counterparties buy into weakness and sell into strength, calming volatility.

Coming into OPEX, the forces that promote pinning turn stronger; counterparties supply more liquidity as their long gamma becomes longer (i.e., rises), so to speak. 

As OPEX is essentially a reset (or reduction) in dealer gamma exposure, participants ought to see an increase in realized volatility as a lot of the exposure that warranted dealers’ supply of liquidity comes off the table, thus necessitating less liquidity

Less liquidity means more movement

More liquidity means less movement

Get it?

With short-term speculators taking on the risks that we’re seeing them take on, and the prospects of a front-running of post-OPEX volatility – given that, according to Pat Hennessy, “OPEX week returns peaked in 2016 and have trended lower since” – there is a potential that adverse moves force those that are off-sides cover (sell) their short put (long call) positions, thereby exacerbating near-term volatility.

We see recent options activity reflected in a sideways to higher CBOE Volatility Index (INDEX: VIX) and shift up in the VIX futures term structure; both suggest a demand for hedges and a reduction in the flows (e.g., vanna) that support sideways to higher trade. 

“The moves have been large and the demand for upside in single stock land insatiable,” said Danny Kirsch of Cornerstone Macro LLC. “Single stock vols clearly feeding into the index.”

Expectations: As of 6:20 AM ET, Tuesday’s regular session (9:30 AM – 4:00 PM ET), in the S&P 500, will likely open in the upper part of a balanced overnight inventory, inside of prior-range and -value, suggesting a limited potential for immediate directional opportunity.

Market Is In Balance: Current prices offer favorable entry and exit. Modus operandi is responsive trade (i.e., fade the edges), rather than initiative trade (i.e., play the break).

In the best case, the S&P 500 trades sideways or higher; activity above the $4,692.25 micro composite point of control (MCPOC) puts in play the $4,722.00 Fibonacci. Initiative trade beyond $4,722.00 could reach as high as the $4,735.00 and $4,772.50 Fibonacci, or higher.

In the worst case, the S&P 500 trades lower; activity below the $4,692.25 MCPOC puts in play the $4,674.75 visual low. Initiative trade beyond the visual low (likely paid attention to by short-term, technically driven market participants who seldom defend retests) could reach as low as the $4,663.00 untested point of control (VPOC) and $4,619.00 VPOC, or lower.

Click here to load today’s updated key levels into the web-based TradingView charting platform. Note that all levels are derived using the 65-minute timeframe. New links are produced, daily.
Graphic: 65-minute profile chart of the Micro E-mini S&P 500 Futures. Notice Monday’s “Cave-Fill” or the act of increasing the area deemed favorable to transact at by participants. This is most obvious by observing where the bulk of Monday’s distribution sits, relative to the pocket of low-volume left behind Friday’s trade. This is a positive development. Learn about the profile.

Charts To Watch

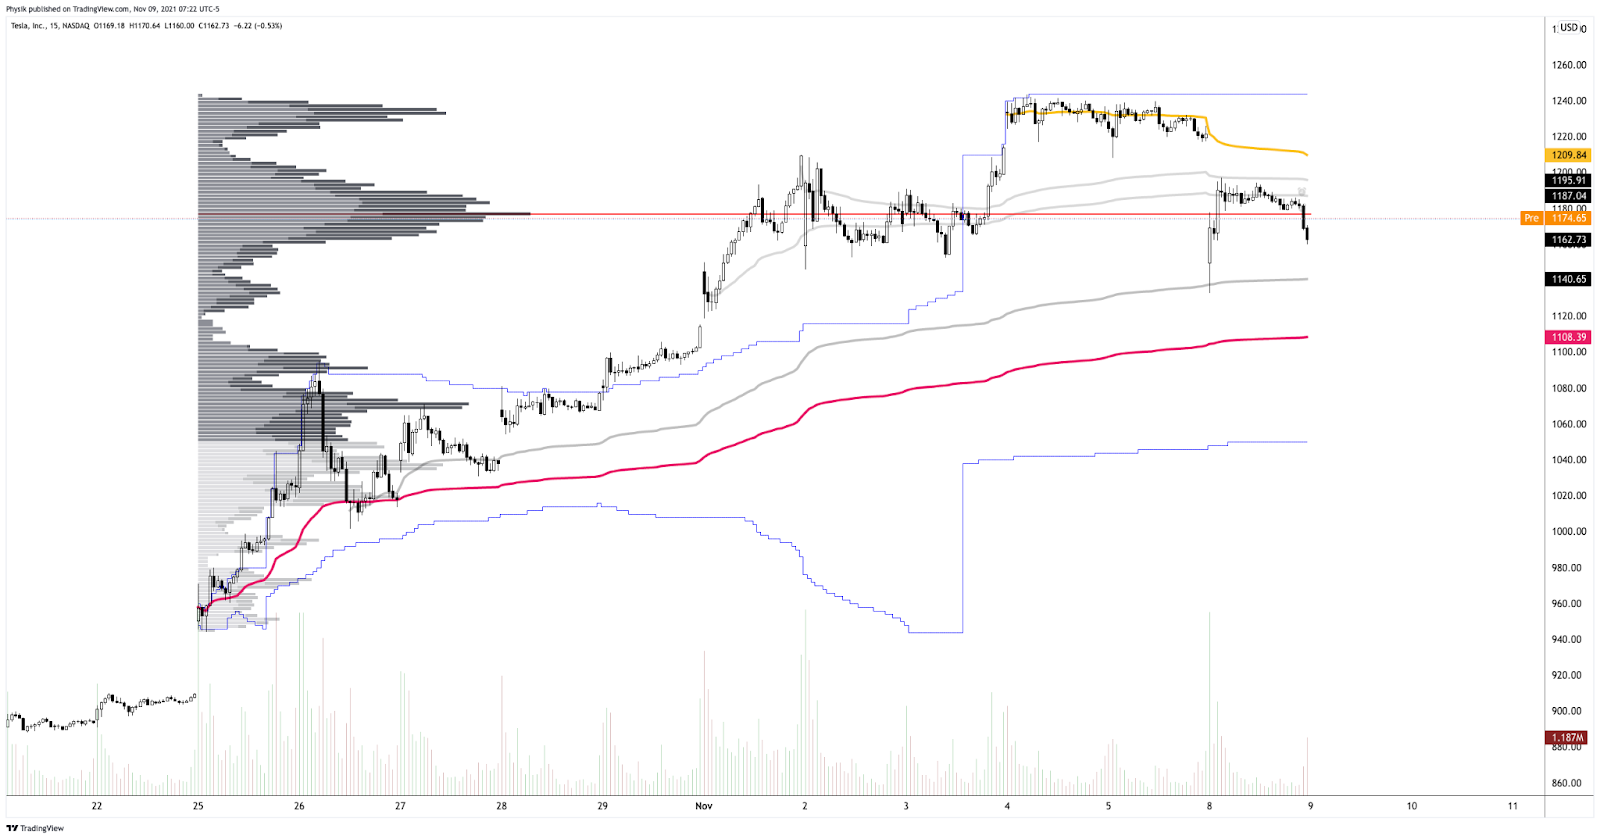
Graphic: (NASDAQ: TSLA). (S~1108, R~1187 to 1195). S is for support. R is for resistance. Looking to buy/sell responsively. 
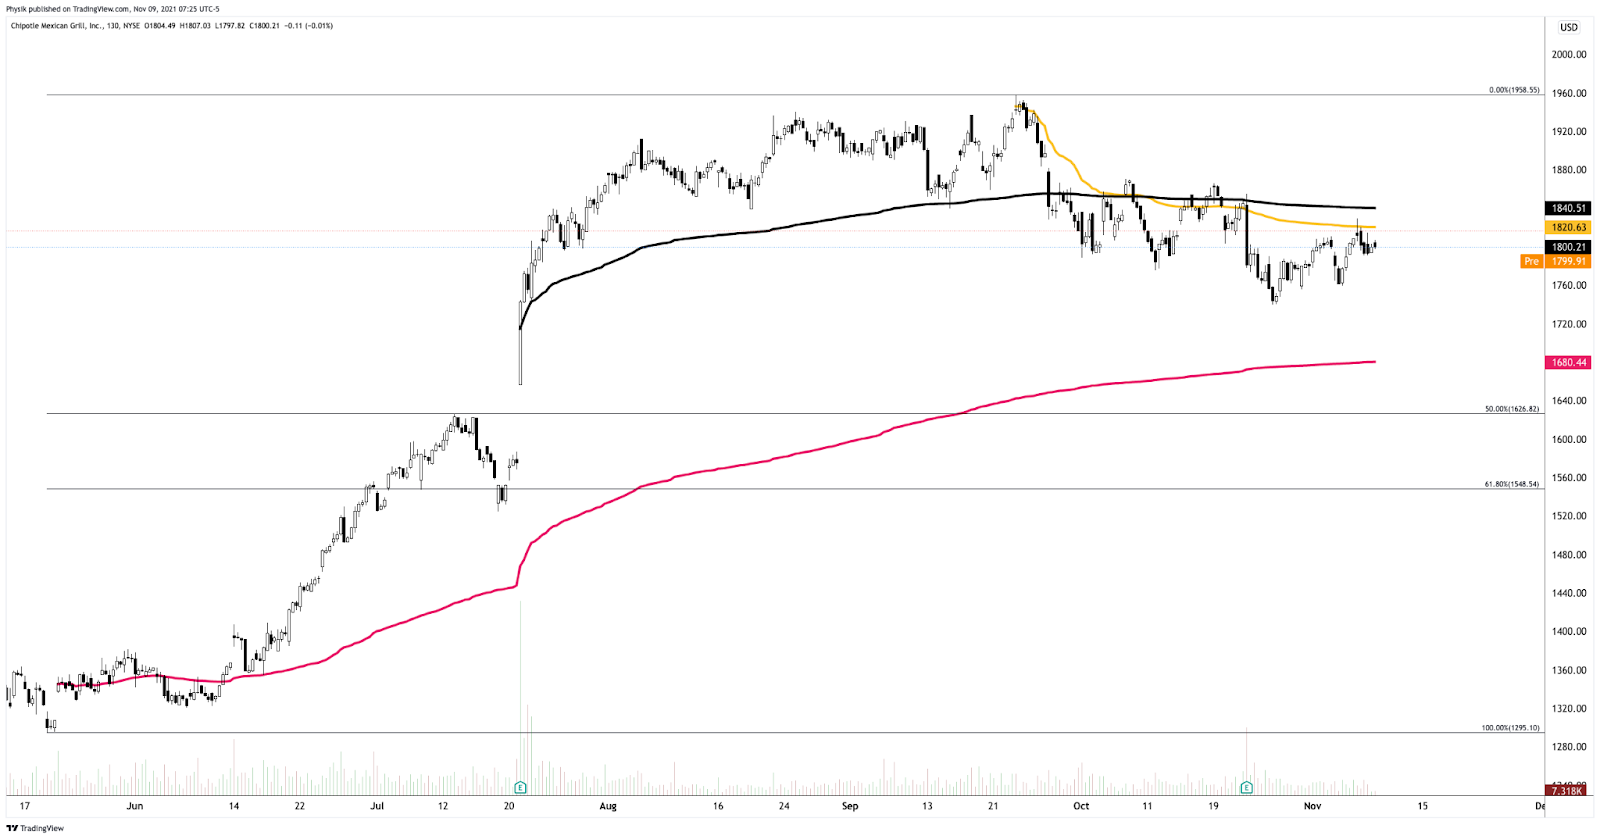
Graphic: (NYSE: CMG). (S~1680, R~1820). S is for support. R is for resistance. Looking to buy/sell responsively.
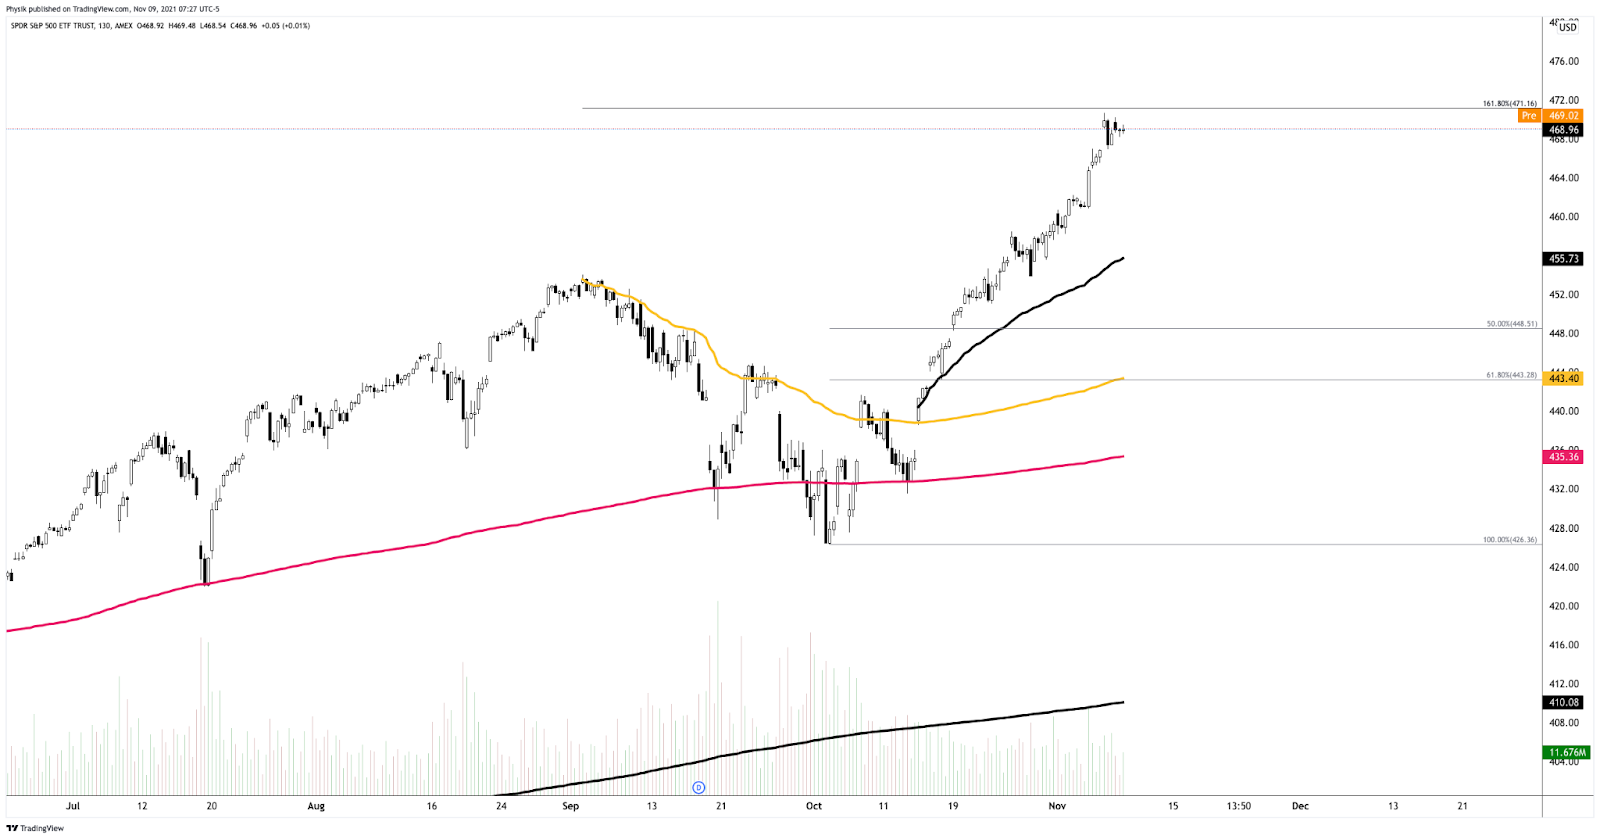
Graphic: (NYSE: SPY). (S~456, R~471). S is for support. R is for resistance. Looking to buy responsively.
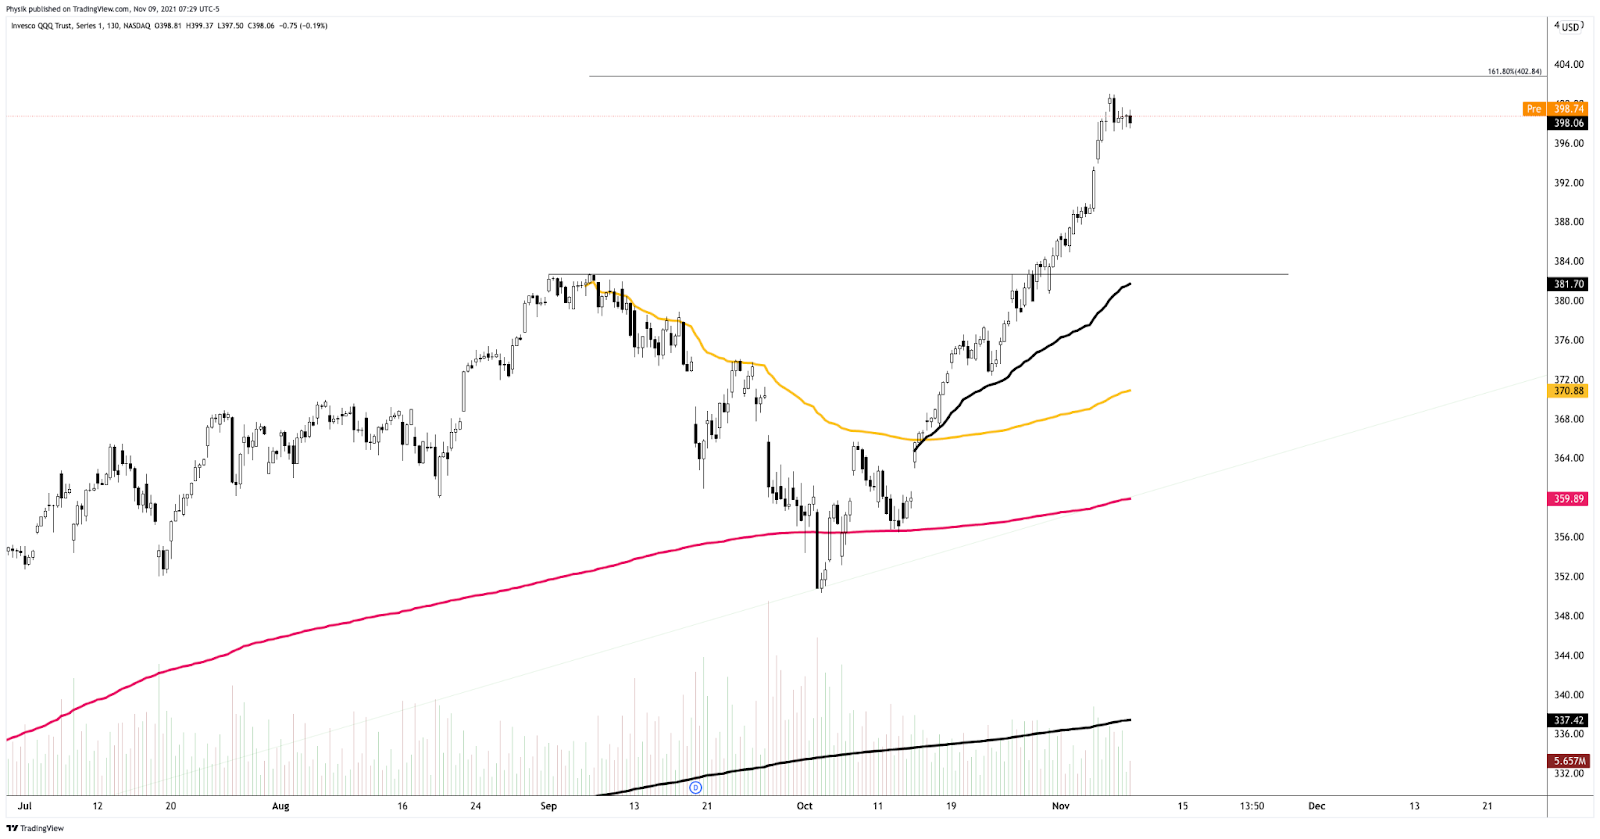
Graphic: (NASDAQ: QQQ). (S~382, R~403). S is for support. R is for resistance. Looking to buy responsively.

What People Are Saying

Definitions

Vanna: The rate at which the delta of an option changes with respect to volatility.

Charm: The rate at which the delta of an option changes with respect to time.

POCs: POCs are valuable as they denote areas where two-sided trade was most prevalent in a prior day session. Participants will respond to future tests of value as they offer favorable entry and exit.

MCPOCs: POCs are valuable as they denote areas where two-sided trade was most prevalent over numerous day sessions. Participants will respond to future tests of value as they offer favorable entry and exit.

About

After years of self-education, strategy development, and trial-and-error, Renato Leonard Capelj began trading full-time and founded Physik Invest to detail his methods, research, and performance in the markets.

Additionally, Capelj is a Benzinga finance and technology reporter interviewing the likes of Shark Tank’s Kevin O’Leary, JC2 Ventures’ John Chambers, and ARK Invest’s Catherine Wood, as well as a SpotGamma contributor, developing insights around impactful options market dynamics.

Disclaimer

At this time, Physik Invest does not manage outside capital and is not licensed. In no way should the materials herein be construed as advice. Derivatives carry a substantial risk of loss. All content is for informational purposes only.
Categories
Commentary

Daily Brief For November 3, 2021

Abstract

Equity index futures and commodities were mixed. Bonds sideways to higher. Volatility bid.

Ahead is a heavy day of economic releases, in the face of fundamental narratives and positioning metrics that may later support directional resolve.

What Happened

Overnight, equity index futures were flat as participants wait to initiate the next leg – higher or lower – until they are provided clarity on monetary policy frameworks, the pace of the economic recovery, and the like.

Ahead is ADP employment (8:15 AM ET), Markit services PMI (9:45 AM ET), ISM services index and factory orders (10:00 AM ET), as well as Federal Reserve statements (2:00 PM ET).

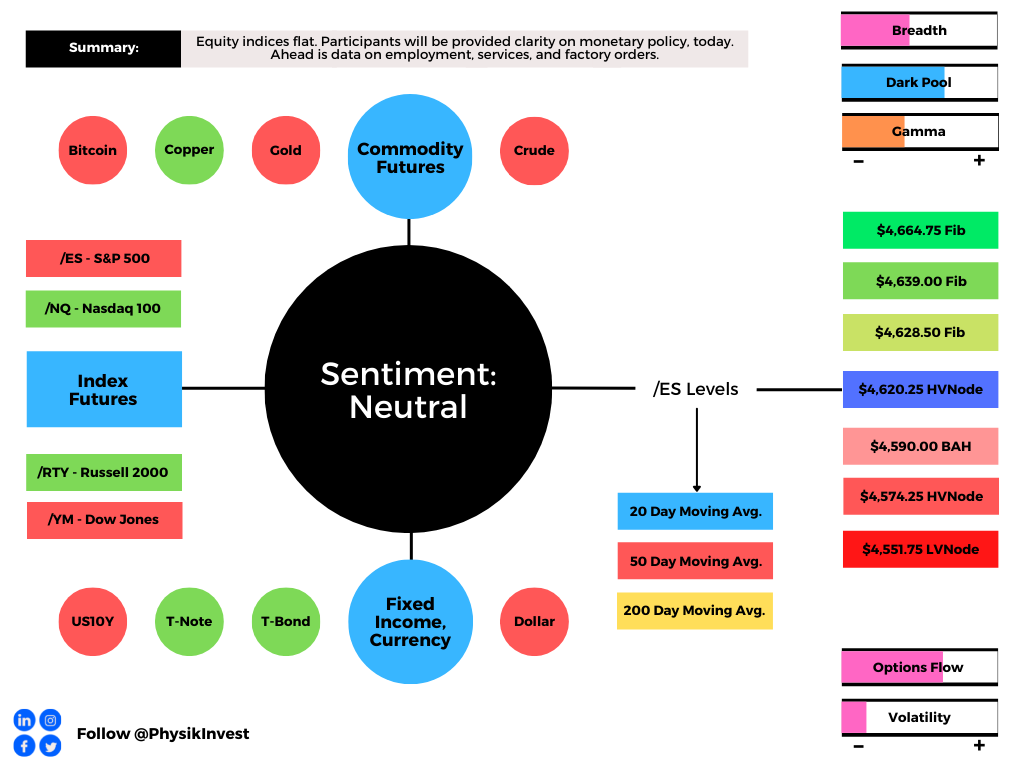
Graphic updated 6:30 AM ET. Sentiment Neutral if expected /ES open is inside of the prior day’s range. /ES levels are derived from the profile graphic at the bottom of the following section. Levels may have changed since initially quoted; click here for the latest levels. SqueezeMetrics Dark Pool Index (DIX) and Gamma (GEX) calculations are based on where the prior day’s reading falls with respect to the MAX and MIN of all occurrences available. A higher DIX is bullish. At the same time, the lower the GEX, the more (expected) volatility. Learn the implications of volatility, direction, and moneyness. SHIFT data used for S&P 500 (INDEX: SPX) options activity. Note that options flow is sorted by the call premium spent; if more positive then more was spent on call options. Breadth reflects a reading of the prior day’s NYSE Advance/Decline indicator. VIX reflects a current reading of the CBOE Volatility Index (INDEX: VIX) from 0-100.

What To Expect

Action: On lackluster breadth and market liquidity metrics, the best case outcome occurred, evidenced by participants’ exploration of new prices in the S&P 500.

Intent: The intraday excess high marks potential exhaustion (or willingness to end trend). Also, the rounding of the composite profile (i.e., developing ledge) suggests participants are either painting themselves into a corner or there is a lack of conviction to take price higher.

Validation: Sideways trade, above the $4,590.00 balance area high (BAH), and overlapping value areas, validates the market’s intent to pause ahead of new information.

Consideration: Poor structure left behind prior initiative trade (as evidenced by the presence of numerous gaps and p-shaped emotional, multiple-distribution profile structures which denote short-covering and a lack of material, new-money buying) adds to technical instability.

Should the market crack, participants will likely look to check old value (i.e., revisit, repair, and strengthen) these pockets of low-volume. This is called the “cave-fill” process, in volume profile terms.

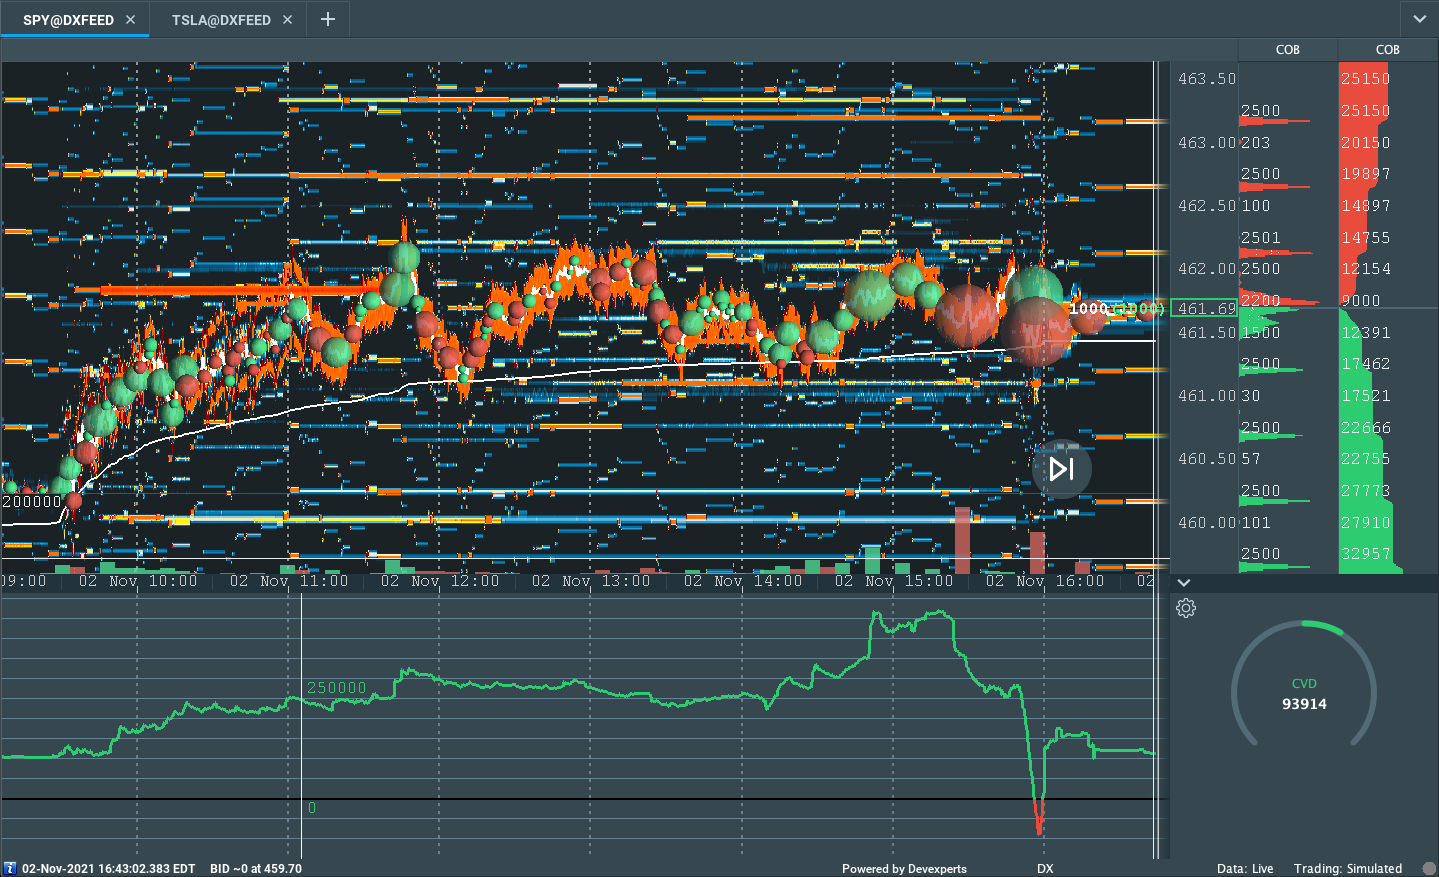
Graphic: Flat delta (i.e., non-committed buying as measured by volume delta or buying and selling power as calculated by the difference in volume traded at the bid and offer) in SPDR S&P 500 ETF Trust (NYSE: SPY), one of the largest ETFs that track the S&P 500 index, via Bookmap. The readings are supportive of responsive trade (i.e., rotational trade that suggests current prices offer favorable entry and exit; the market is in balance).

Context: Federal Open Market Committee (FOMC) announcement later today.

The announcement will provide participants with color on the economic recovery and the Federal Reserve’s intent to continue supporting the economy, at the rate it has. 

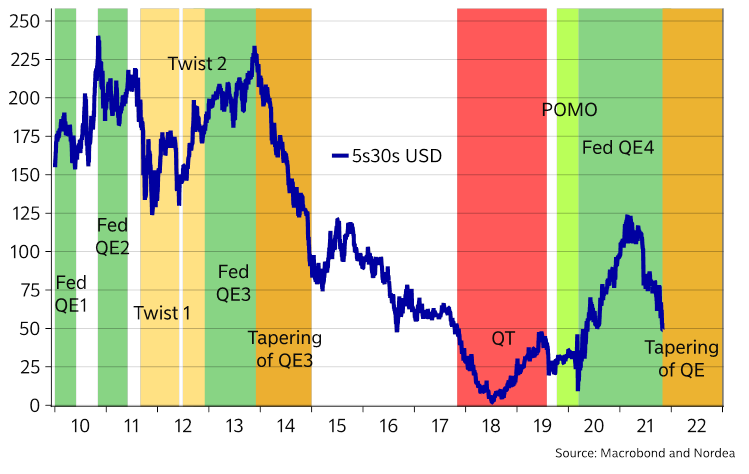
Nordea’s Andreas Steno Larsen states: “Jay Powell will have to walk on eggshells to prevent an acceleration of the front-end of the USD yield curve. Arguments for the Fed to tighten policy keep piling up and hence we see a swift tapering process (30B a meeting) and a first hike in June.” 

“The combination of 1) even higher inflation prints during Q4 (with several extremely volatile base effects), 2) a removal of USD liquidity, 3) a historically weak credit impulse into 2022 (due to a massive credit expansion 20/21) sounds like the perfect flattener setup to us,” which may weigh on sentiment and long term investments.

Graphic: “Keep flattening the yield curve during tapering,” via Nordea.

In terms of positioning, the CBOE Volatility Index (INDEX: VIX) was a touch higher, while spreads across the VIX futures term structure widened with demand coming in at the front.

Such a situation, as touched on yesterday, in addition to the long-gamma environment (in which counterparties hedge their warehoused options risk by buying underlying into weakness and selling into strength), has the effect of making it difficult to resolve directionally.

The reasons are: (1) options will slide down their term structure (vanna) and (2) skew decays (charm). When this happens, we expect to see supportive flows as dealers cover their short equity/futures hedges. 

With volatility bid, the effect of vanna and charm is dulled. As a result, it is likely that participants see more movement after the FOMC announcement.

To note, the potential for upside resolve comes down to how participants take the FOMC announcement. We know that, according to SpotGamma, there is increased capital being committed to higher and higher options strikes, a development often seen as bullish.

Expectations: As of 6:30 AM ET, Wednesday’s regular session (9:30 AM – 4:00 PM ET), in the S&P 500, will likely open in the middle part of a neutral overnight inventory, inside of prior-range and -value, suggesting a limited potential for immediate directional opportunity.

Balance (Two-Timeframe Or Bracket) Is The Status Quo: Rotational trade that denotes current prices offer favorable entry and exit. Modus operandi is responsive trade (i.e., fade the edges), rather than initiative trade (i.e., play the break).

In the best case, the S&P 500 trades sideways or higher; activity above the $4,620.25 high volume area (HVNode) pivot puts in play the $4,628.50 Fibonacci extension. Initiative trade beyond $4,628.50 could reach the $4,639.00 and $4,664.75 Fibonacci levels, or higher.

In the worst case, the S&P 500 trades lower; activity below the $4,620.25 HVNode puts in play the $4,590.00 balance area high (BAH). Initiative trade beyond the BAH could reach as low as the $4,574.25 HVNode and $4,551.75 low volume area (LVNode), or lower.

Click here to load today’s updated key levels into the web-based TradingView charting platform. Note that all levels are derived using the 65-minute timeframe. New links are produced, daily.
Graphic: 65-minute profile chart of the Micro E-mini S&P 500 Futures. Learn about the profile.

What People Are Saying

Definitions

Cave-Fill Process: Widened the area deemed favorable to transact at by an increased share of participants. This is a good development.

Volume Areas: A structurally sound market will build on areas of high volume (HVNodes). Should the market trend for long periods of time, it will lack sound structure, identified as low volume areas (LVNodes). LVNodes denote directional conviction and ought to offer support on any test. 

If participants were to auction and find acceptance into areas of prior low volume (LVNodes), then future discovery ought to be volatile and quick as participants look to HVNodes for favorable entry or exit.

Excess: A proper end to price discovery; the market travels too far while advertising prices. Responsive, other-timeframe (OTF) participants aggressively enter the market, leaving tails or gaps which denote unfair prices.

Ledges: Flattened area on the profile which suggests responsive participants are in control, or initiative participants lack the confidence to continue the discovery process. The ledge will either hold and force participants to liquidate (cover) their positions, or crack and offer support (resistance).

Value-Area Placement: Perception of value unchanged if value overlapping (i.e., inside day). Perception of value has changed if value not overlapping (i.e., outside day). Delay trade in the former case.

About

After years of self-education, strategy development, and trial-and-error, Renato Leonard Capelj began trading full-time and founded Physik Invest to detail his methods, research, and performance in the markets.

Additionally, Capelj is a Benzinga finance and technology reporter interviewing the likes of Shark Tank’s Kevin O’Leary, JC2 Ventures’ John Chambers, and ARK Invest’s Catherine Wood, as well as a SpotGamma contributor, developing insights around impactful options market dynamics.

Disclaimer

At this time, Physik Invest does not manage outside capital and is not licensed. In no way should the materials herein be construed as advice. Derivatives carry a substantial risk of loss. All content is for informational purposes only.
Categories
Commentary

Daily Brief For October 20, 2021

Market Commentary

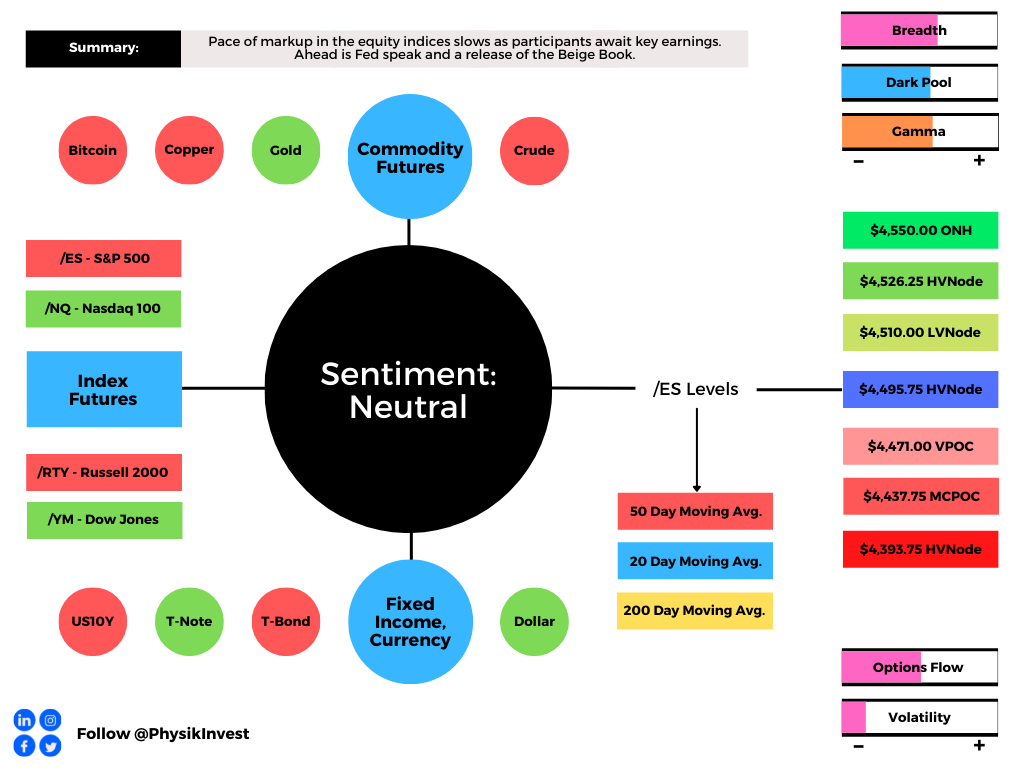
Mostly in sync with bonds and commodities, equity index futures were mixed. Volatility compressed, further.

  • Ahead: Fed speak and the Beige Book.
  • Monetary uncertainty. Earnings pick up.
  • Options positioning may support prices.

What Happened: The pace of markup in the equity indices slowed as participants await key earnings, as well as updates on monetary and fiscal policy. 

Ahead is Fed-speak by Evans, Bullard, Bostic, Kashkari, and Quarles (12:00 and 1:00 PM ET), as well as a release of the Beige Book (2:00 PM ET). Tonight, also, Fed President Daly speaks (8:35 PM ET).

Graphic updated 6:45 AM ET. Sentiment Neutral if expected /ES open is inside of the prior day’s range. /ES levels are derived from the profile graphic at the bottom of the following section. Levels may have changed since initially quoted; click here for the latest levels. SqueezeMetrics Dark Pool Index (DIX) and Gamma (GEX) calculations are based on where the prior day’s reading falls with respect to the MAX and MIN of all occurrences available. A higher DIX is bullish. At the same time, the lower the GEX, the more (expected) volatility. SHIFT data used for S&P 500 (INDEX: SPX) options activity. Note that options flow is sorted by the call premium spent; if more positive then more was spent on call options. Breadth reflects a reading of the prior day’s NYSE Advance/Decline indicator. VIX reflects a current reading of the CBOE Volatility Index (INDEX: VIX) from 0-100.

What To Expect: As of 6:40 AM ET, Wednesday’s regular session (9:30 AM – 4:00 PM EST) in the S&P 500 will likely open inside of prior-range and -value, suggesting a limited potential for immediate directional opportunity.

Status Quo Is Balance: Rotational trade that denotes current prices offering favorable entry and exit. Modus operandi is responsive trade (i.e., fade the edges), rather than initiative trade (i.e., play the break), coming into today’s session.

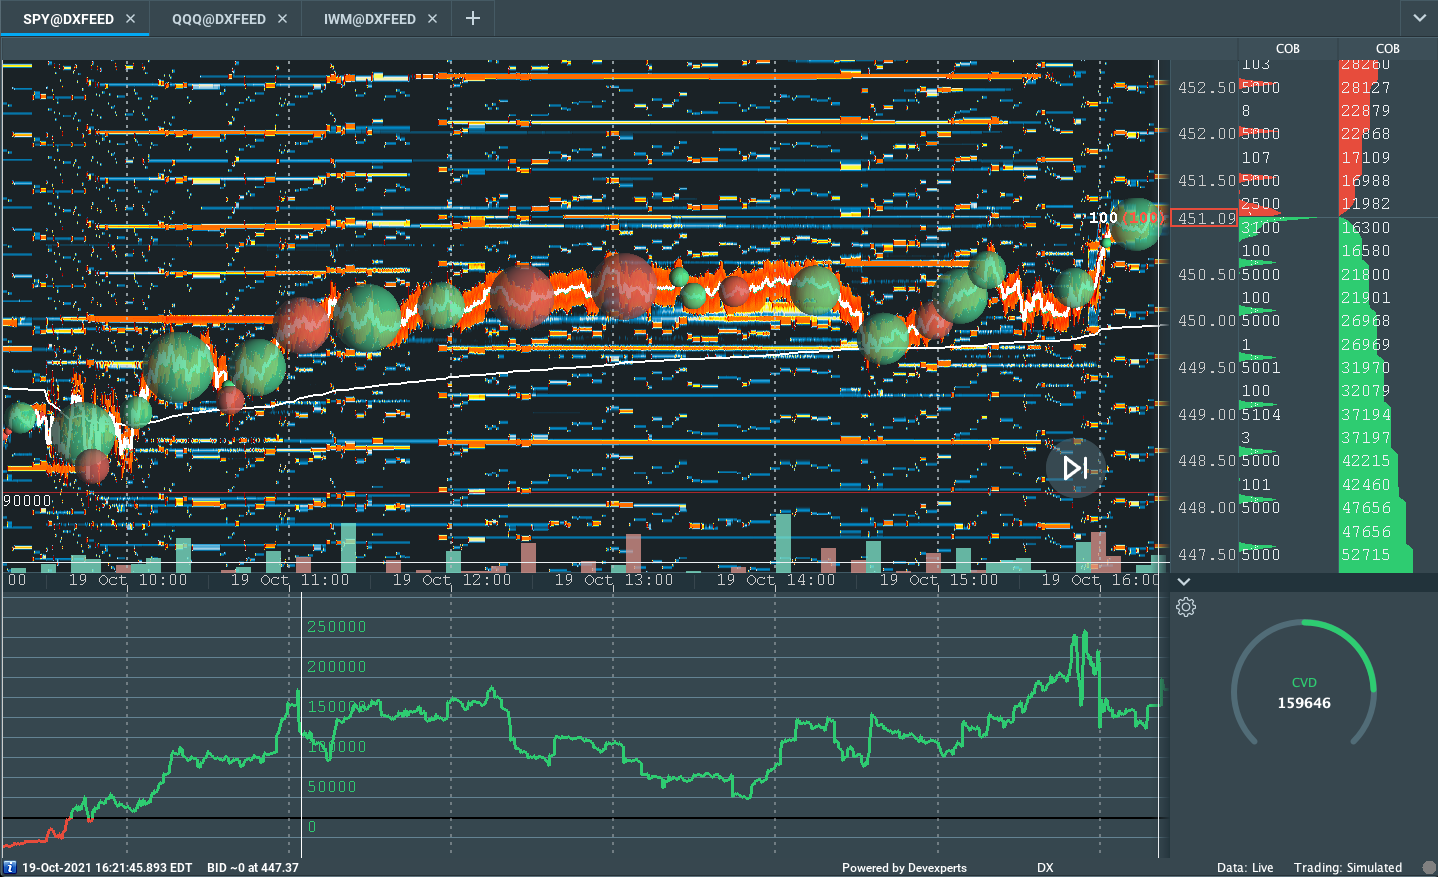
Adding, during the prior day’s regular trade, on supportive intraday breadth and market liquidity metrics, the best case outcome occurred, evidenced by initiative buying and separation of value.

Coupled with that dynamic, in carrying forward the narrative from days prior, is the sustained presence of numerous gaps and p-shaped emotional, multiple-distribution profile structures (i.e., old-money shorts covering).

Participants will likely look to revisit, repair, and strengthen – build out areas of high volume (HVNodes) via the cave-fill process – these areas of low volume (LVNodes), later.

Graphic: Supportive delta (i.e., committed buying as measured by volume delta or buying and selling power as calculated by the difference in volume traded at the bid and offer) in SPDR S&P 500 ETF Trust (NYSE: SPY), one of the largest ETFs that track the S&P 500 index, via Bookmap. The readings are supportive of the initiative trade or markup in price.

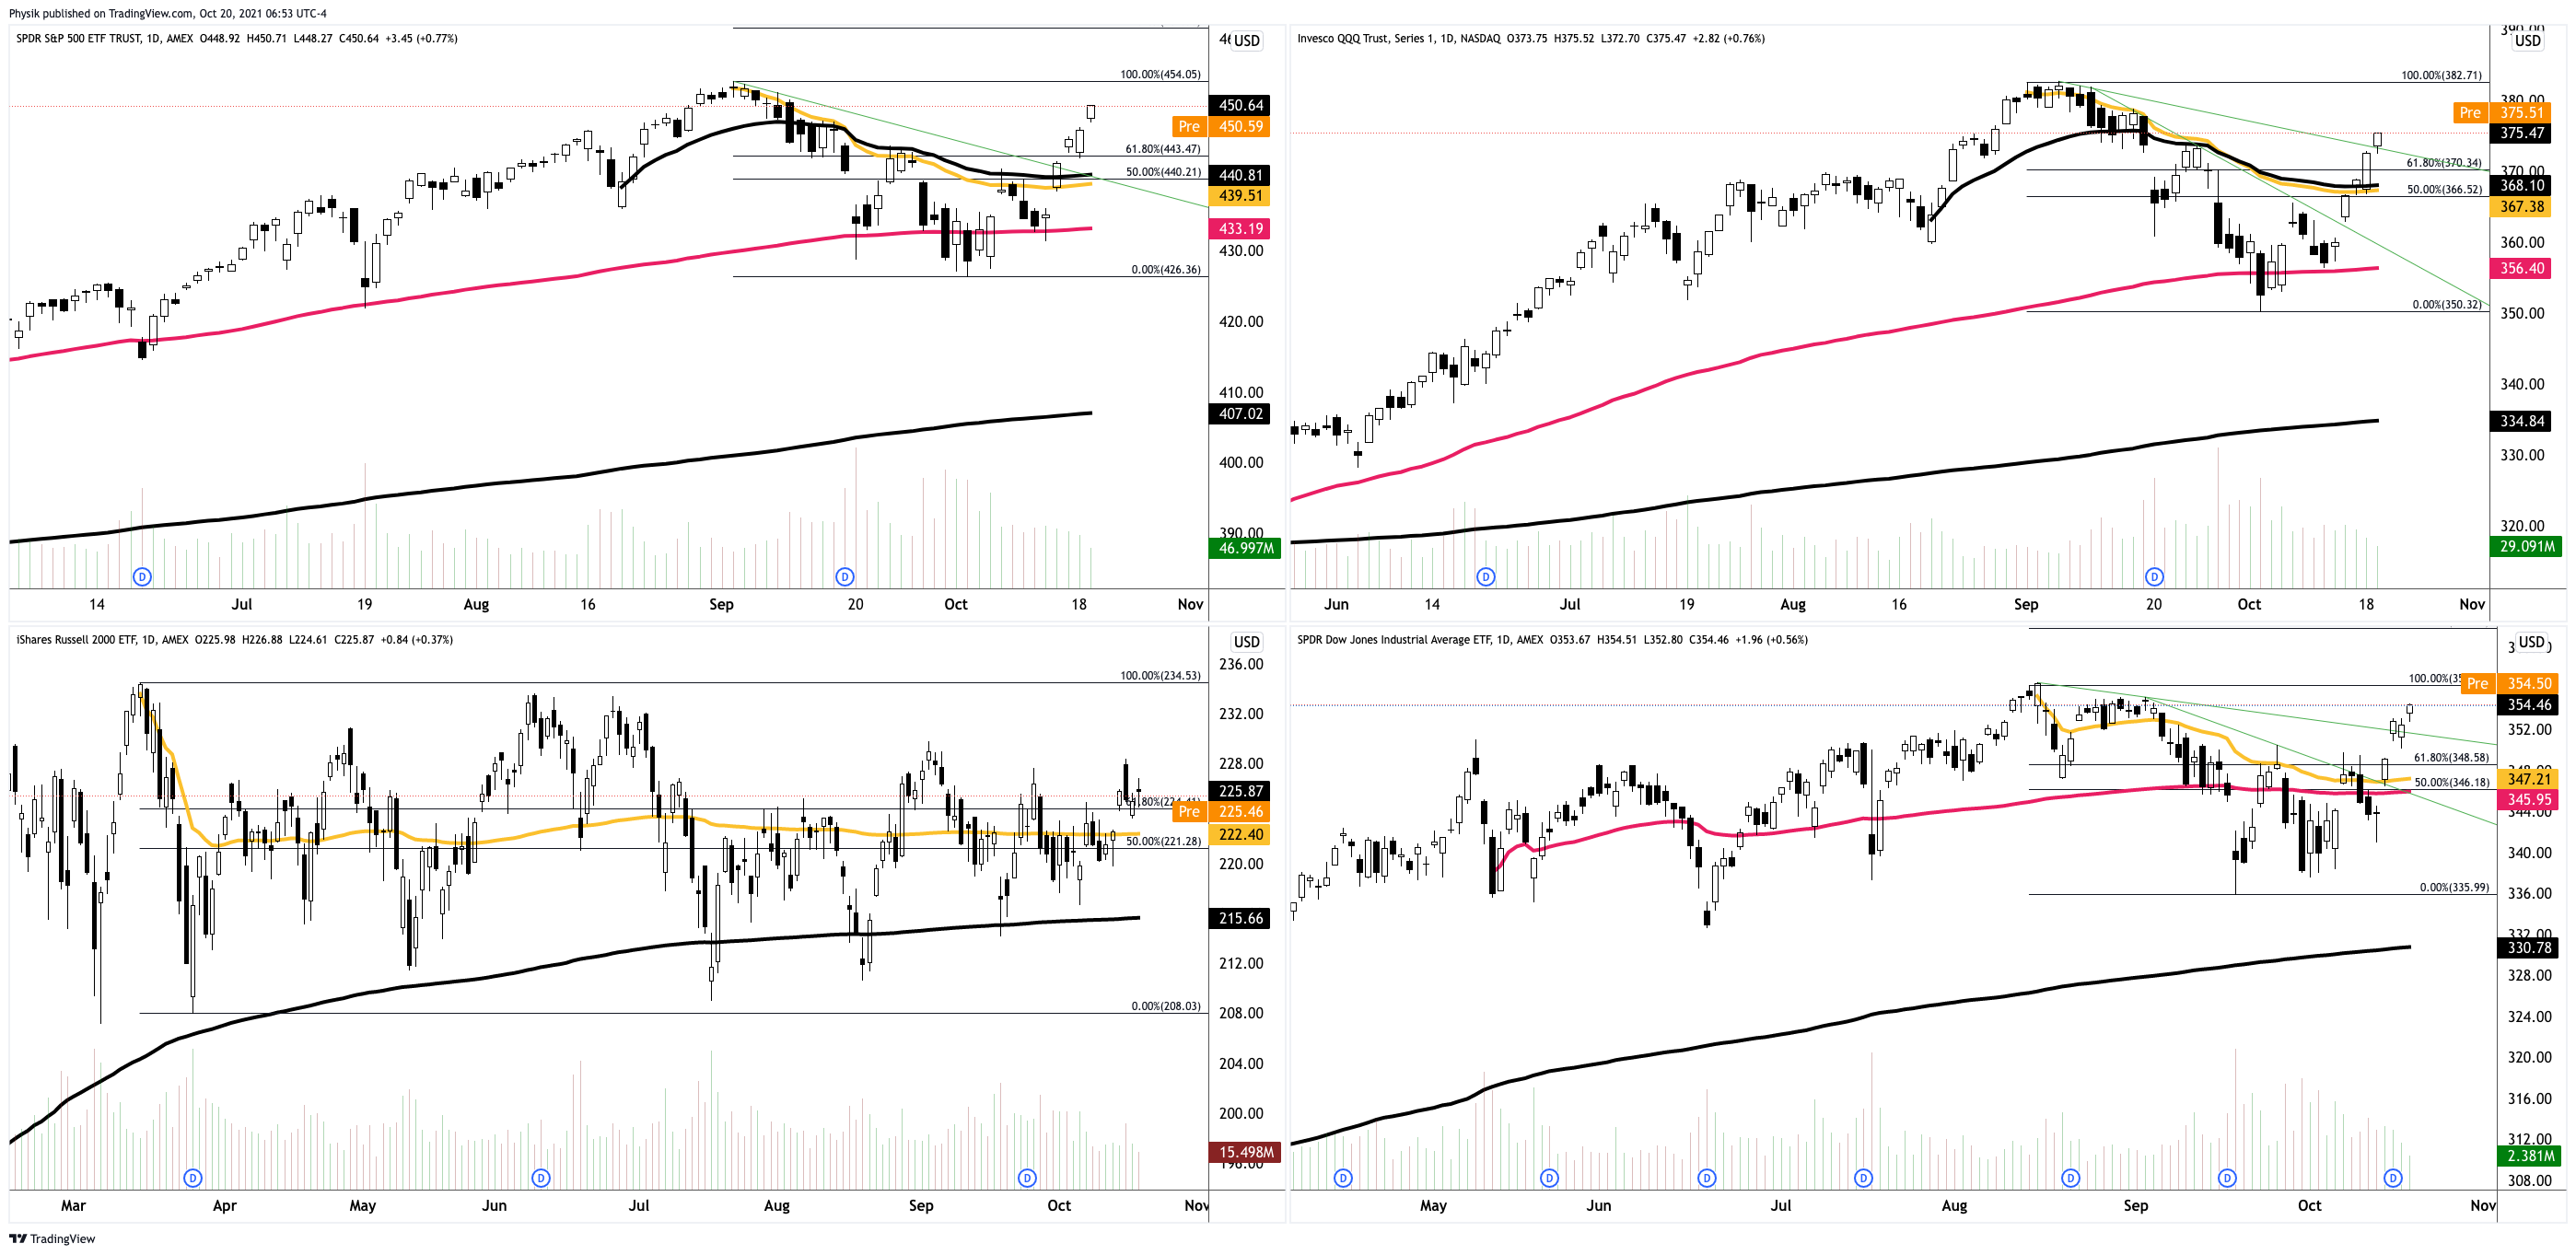
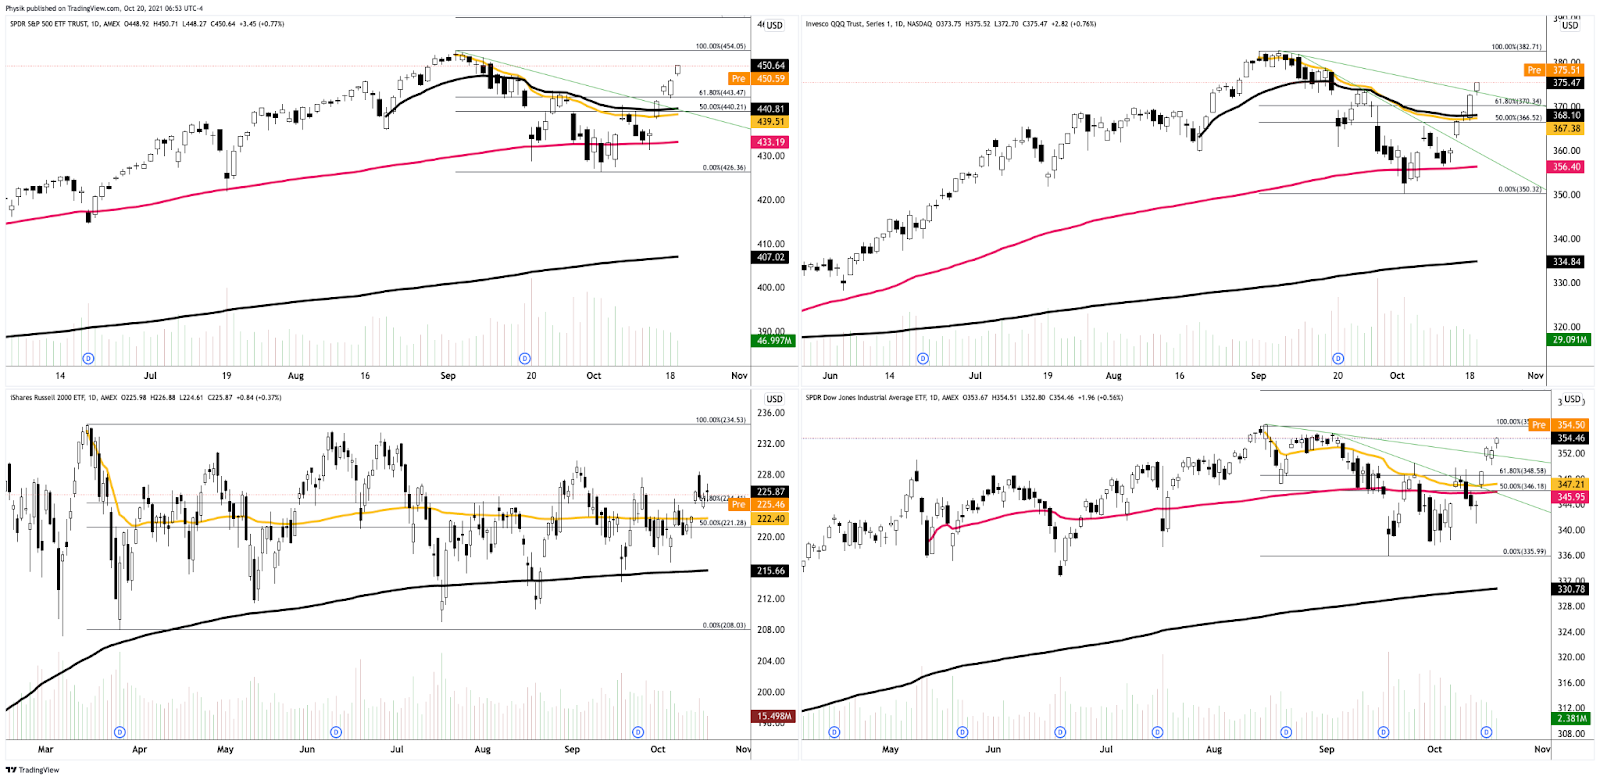
Zooming out, we see the Nasdaq 100 trading strong, relative to its peers. 

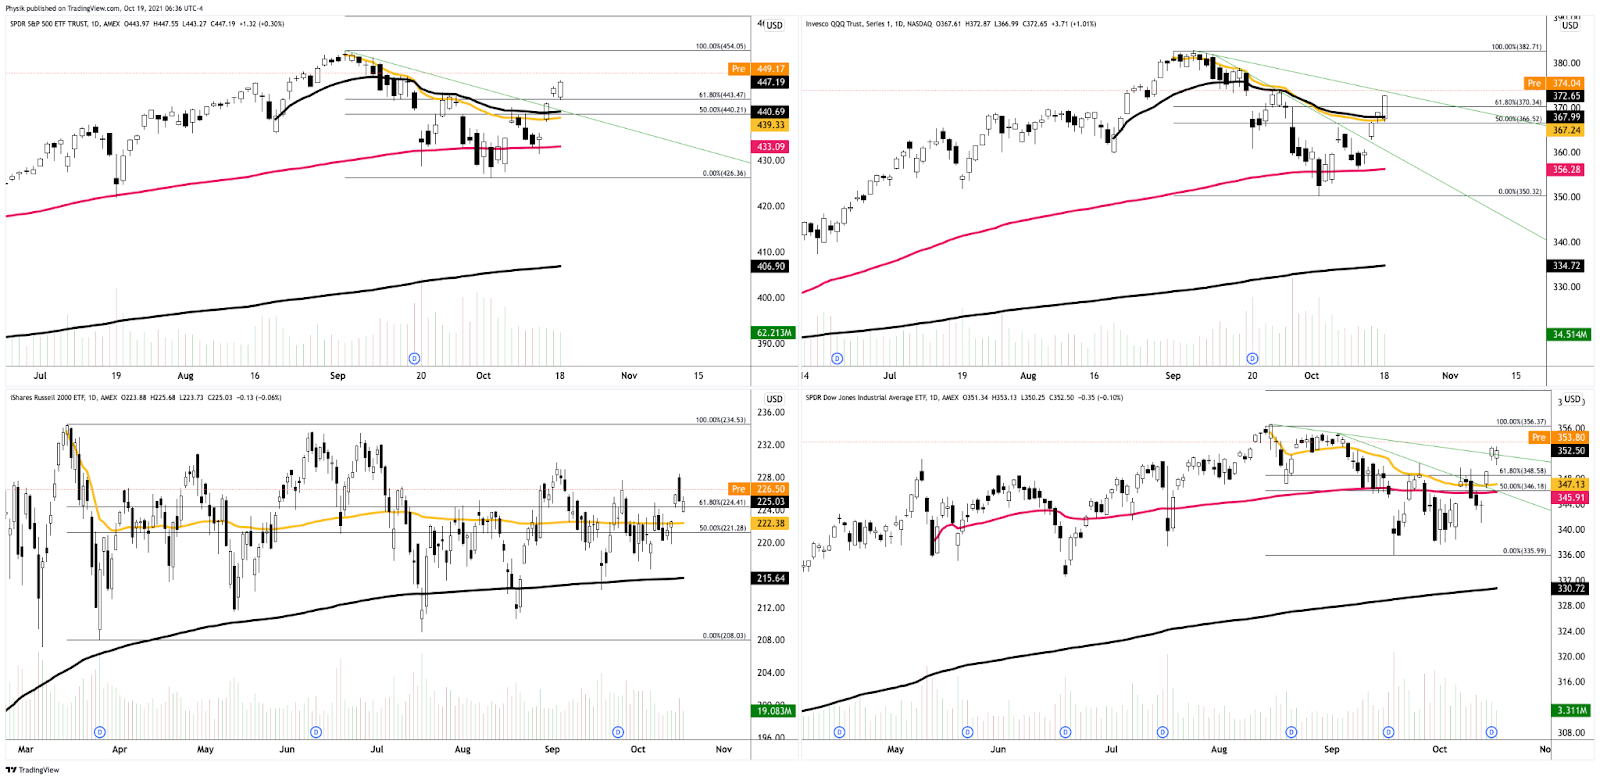
Given where the S&P 500’s price is in relation to the yellow anchored volume-weighted average price (VWAP), below, the average buyer, since the all-time high, holds a winning position; sideways-to-higher trade, above the upward sloping trendline, as well as the 50.00% and 61.8% retracements, likely puts in play a recovery of the all-time high.

Graphic: SPDR S&P 500 ETF (NYSE: SPY) top left, Invesco QQQ Trust Series 1 (NASDAQ: QQQ) top right, iShares Russell 2000 ETF (NYSE: IWM) bottom left, SPDR Dow Jones Industrial Average ETF Trust (NYSE: DIA) bottom right.

Further, the aforementioned trade is happening in the context of improving breadth amidst a seasonally bullish cycle of contributions, rebalancing, and earnings, as well as the risks associated with a taper in asset purchases and a hike in rates.

In terms of positioning, the CBOE Volatility Index (INDEX: VIX) was lower, while the VIX futures term structure was unchanged; supply at the front end of the curve, alongside the long-gamma environment, signals a potential for near-term equity market stability.

With this decline in implied volatility (a dynamic that, at least in recent history, leads into increased call selling, more dealer hedging and liquidity, as well as further realized volatility suppression), the S&P 500 found itself marked up to the key $4,510.00 low volume area (LVNode)

The $4,510.00 figure is in the vicinity of what options modeling platform SpotGamma calls a Call Wall (i.e., the level at which positive options gamma, essentially delta sensitivity to the underlying price, is highest), which is a near term magnet (and resistance) given associated hedging and a failure to see increased interest and activity in higher options strikes.

Moreover, we’re carrying forward yesterday’s price levels; for today, participants may make use of the following frameworks.

In the best case, the S&P 500 trades sideways or higher; activity above the $4,495.75 high volume area (HVNode) puts in play the $4,510.00 low volume area (LVNode). Initiative trade beyond the LVNode could reach as high as the $4,526.25 HVNode and $4,550.00 overnight high (ONH), or higher.

In the worst case, the S&P 500 trades lower; activity below the $4,495.75 HVNode puts in play the $4,471.00 untested point of control (VPOC). Initiative trade beyond the VPOC could reach as low as the $4,437.75 micro composite point of control (MCPOC) and $4,393.75 HVNode, or lower.

Click here to load today’s updated real-time key levels into the web-based TradingView charting platform. Please note that all levels are derived using the 65-minute timeframe.
Graphic: 65-minute profile chart of the Micro E-mini S&P 500 Futures updated 6:40 AM ET.

Definitions

Cave-Fill Process: Widened the area deemed favorable to transact at by an increased share of participants. This is a good development.

Volume Areas: A structurally sound market will build on areas of high volume (HVNodes). Should the market trend for long periods of time, it will lack sound structure, identified as low volume areas (LVNodes). LVNodes denote directional conviction and ought to offer support on any test. 

If participants were to auction and find acceptance into areas of prior low volume (LVNodes), then future discovery ought to be volatile and quick as participants look to HVNodes for favorable entry or exit.

Gamma: Gamma is the sensitivity of an option to changes in the underlying price. Dealers that take the other side of options trades hedge their exposure to risk by buying and selling the underlying. When dealers are short-gamma, they hedge by buying into strength and selling into weakness. When dealers are long-gamma, they hedge by selling into strength and buying into weakness. The former exacerbates volatility. The latter calms volatility.

POCs: POCs are valuable as they denote areas where two-sided trade was most prevalent in a prior day session. Participants will respond to future tests of value as they offer favorable entry and exit.

MCPOCs: POCs are valuable as they denote areas where two-sided trade was most prevalent over numerous day sessions. Participants will respond to future tests of value as they offer favorable entry and exit.

More On Volume-Weighted Average Prices (VWAPs): A metric highly regarded by chief investment officers, among other participants, for quality of trade. Additionally, liquidity algorithms are benchmarked and programmed to buy and sell around VWAPs.

News And Analysis

A combination of lower growth, higher inflation isn’t good.

Sentiment in neutral territory, supporting high index price.

Cryptocurrency versus gold – debating on store of value.

Who could be the winners and losers of the energy crisis?

Feeling the strain of supply chain issues and high prices.

Global oil refiners cranking up output as margins recover.

Democrats are looking to break stalemate on Biden plan.

Bitcoin futures ETF starts as second-highest traded fund.

What People Are Saying

About

After years of self-education, strategy development, and trial-and-error, Renato Leonard Capelj began trading full-time and founded Physik Invest to detail his methods, research, and performance in the markets. 

Additionally, Capelj is a finance and technology reporter. Some of his biggest works include interviews with leaders such as John Chambers, founder and CEO, JC2 Ventures, Kevin O’Leary, businessman and Shark Tank host, Catherine Wood, CEO and CIO, ARK Invest, among others.

Disclaimer

At this time, Physik Invest does not manage outside capital and is not licensed. In no way should the materials herein be construed as advice. Derivatives carry a substantial risk of loss. All content is for informational purposes only.
Categories
Commentary

Daily Brief For October 19, 2021

Market Commentary

Out sync with bonds, equity index futures and commodities traded higher. Volatility compressed.

  • Monetary uncertainty. Earnings pick up.
  • Options positioning may support prices.
  • Ahead: Building permits, housing starts.

What Happened: U.S. stock index futures auctioned sideways to higher overnight as participants sought to price in robust earnings against the backdrop of monetary uncertainty and increased pricing pressures. 

“The world is watching interest rates more closely than it has for some time — and rightly so, the moves have been emphatic, especially in the short-term maturities,” Chris Weston, head of research at Pepperstone Financial Pty, said. He added it’s “impressive how resilient and calm markets are in the face of the rates repricing.”

Ahead is data on building permits and housing starts (8:30 AM ET).

Graphic updated 6:30 AM ET. Sentiment Risk-On if expected /ES open is above the prior day’s range. /ES levels are derived from the profile graphic at the bottom of the following section. Levels may have changed since initially quoted; click here for the latest levels. SqueezeMetrics Dark Pool Index (DIX) and Gamma (GEX) calculations are based on where the prior day’s reading falls with respect to the MAX and MIN of all occurrences available. A higher DIX is bullish. At the same time, the lower the GEX, the more (expected) volatility. SHIFT data used for S&P 500 (INDEX: SPX) options activity. Note that options flow is sorted by the call premium spent; if more positive then more was spent on call options. Breadth reflects a reading of the prior day’s NYSE Advance/Decline indicator. VIX reflects a current reading of the CBOE Volatility Index (INDEX: VIX) from 0-100.

What To Expect: As of 6:30 AM ET, Tuesday’s regular session (9:30 AM – 4:00 PM EST) in the S&P 500 will likely open outside of prior-range and -value, suggesting a potential for immediate directional opportunity.

Gap Scenarios: Gaps ought to fill quickly. Should they not, that’s a signal of strength; do not fade. Leaving value behind on a gap-fill or failing to fill a gap (i.e., remaining outside of the prior session’s range) is a go-with indicator.

Auctioning and spending at least 1-hour of trade back in the prior range suggests a lack of conviction; in such a case, do not follow the direction of the most recent initiative activity.

Adding, during the prior day’s regular trade, on non participatory intraday breadth and supportive market liquidity metrics, the best case outcome occurred, evidenced by a response at the $4,437.75 micro composite point of control (MCPOC), which carried into initiative buying, past the $4,469.75 overnight high (ONH).

Coupled with that dynamic is the sustained presence of numerous gaps and p-shaped emotional, multiple-distribution profile structures (i.e., old-money shorts covering); as a result, participants will likely look to revisit, repair, and strengthen – build out areas of high volume (HVNodes) via the cave-fill process – these areas of low volume (LVNodes).

Graphic: Mostly supportive delta (i.e., committed buying as measured by volume delta or buying and selling power as calculated by the difference in volume traded at the bid and offer) in SPDR S&P 500 ETF Trust (NYSE: SPY), one of the largest ETFs that track the S&P 500 index, via Bookmap. The readings support this recent leg of initiative trade.

Zooming out, we see the Nasdaq 100 trading relatively strong.

Given where the S&P 500’s price is in relation to the yellow anchored volume-weighted average price (VWAP), below, the average buyer, since the all-time high, holds a winning position; sideways-to-higher trade, above the upward sloping trendline, as well as the 50.00% and 61.8% retracements, likely puts in play a recovery of the all-time high.

Graphic: SPDR S&P 500 ETF (NYSE: SPY) top left, Invesco QQQ Trust Series 1 (NASDAQ: QQQ) top right, iShares Russell 2000 ETF (NYSE: IWM) bottom left, SPDR Dow Jones Industrial Average ETF Trust (NYSE: DIA) bottom right.

Further, the aforementioned trade is happening in the context of improving breadth amidst a seasonally bullish cycle of contributions, rebalancing, and earnings, as well as the risks associated with a taper in asset purchases and a hike in rates.

In terms of positioning, the CBOE Volatility Index (INDEX: VIX) was lower, while the VIX futures term structure remained in contango; supply at the front end of the curve, alongside the long-gamma environment, signals a potential for near-term equity market stability.

According to SpotGamma analyses, participants were likely selling puts into yesterday’s price rise; this dynamic may support sideways to higher trade.

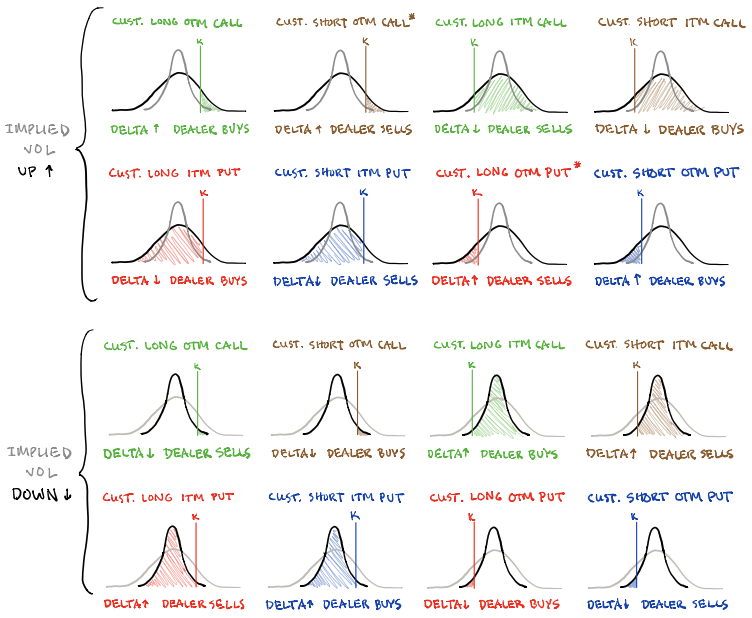
In a barebones overview of some of the dynamics at play, here, if implied volatility were to rise, the counterparty to the aforementioned trade would purchase stock (long delta) to hedge their rising long put (short delta) exposure. If implied volatility were to decline, the counterparty would likely sell stock (short delta) as their long put (short delta) exposure declines.

Pictured: SqueezeMetrics highlights implications of volatility, direction, and moneyness.

Moreover, for today, participants may make use of the following frameworks.

In the best case, the S&P 500 trades sideways or higher; activity above the $4,495.75 high volume area (HVNode) puts in play the $4,510.00 low volume area (LVNode). Initiative trade beyond the LVNode could reach as high as the $4,526.25 HVNode and $4,550.00 overnight high (ONH), or higher.

In the worst case, the S&P 500 trades lower; activity below the $4,495.75 HVNode puts in play the $4,471.00 untested point of control (VPOC). Initiative trade beyond the VPOC could reach as low as the $4,437.75 micro composite point of control (MCPOC) and $4,393.75 HVNode, or lower.

Click here to load today’s updated real-time key levels into the web-based TradingView charting platform. Please note that all levels are derived using the 65-minute timeframe.
Graphic: 65-minute profile chart of the Micro E-mini S&P 500 Futures updated 6:20 AM ET.

Definitions

Cave-Fill Process: Widened the area deemed favorable to transact at by an increased share of participants. This is a good development.

Overnight Rally Highs (Lows): Typically, there is a low historical probability associated with overnight rally-highs (lows) ending the upside (downside) discovery process.

Volume Areas: A structurally sound market will build on areas of high volume (HVNodes). Should the market trend for long periods of time, it will lack sound structure, identified as low volume areas (LVNodes). LVNodes denote directional conviction and ought to offer support on any test. 

If participants were to auction and find acceptance into areas of prior low volume (LVNodes), then future discovery ought to be volatile and quick as participants look to HVNodes for favorable entry or exit.

Short Covering: The profile shape suggests participants were “too” short and had poor location.

Gamma: Gamma is the sensitivity of an option to changes in the underlying price. Dealers that take the other side of options trades hedge their exposure to risk by buying and selling the underlying. When dealers are short-gamma, they hedge by buying into strength and selling into weakness. When dealers are long-gamma, they hedge by selling into strength and buying into weakness. The former exacerbates volatility. The latter calms volatility.

POCs: POCs are valuable as they denote areas where two-sided trade was most prevalent in a prior day session. Participants will respond to future tests of value as they offer favorable entry and exit.

MCPOCs: POCs are valuable as they denote areas where two-sided trade was most prevalent over numerous day sessions. Participants will respond to future tests of value as they offer favorable entry and exit.

Initiative Buying (Selling): Buying (selling) within or above (below) the previous day’s value area.

Responsive Buying (Selling): Buying (selling) in response to prices below (above) an area of recent price acceptance.

Volume-Weighted Average Prices (VWAPs): A metric highly regarded by chief investment officers, among other participants, for quality of trade. Additionally, liquidity algorithms are benchmarked and programmed to buy and sell around VWAPs.

News And Analysis

Nordea: Is permanent inflation now an alarming consensus?

Evergrande unit has remit funds to pay yuan bond coupon.

China’s central bank should cut RRR, one adviser suggests.

World facing fiscal problems much worse than from COVID.

Investing prosperously in light of China’s common prosperity.

Bitcoin pushes toward record before debut of ETF products.

What People Are Saying

About

After years of self-education, strategy development, and trial-and-error, Renato Leonard Capelj began trading full-time and founded Physik Invest to detail his methods, research, and performance in the markets. 

Additionally, Capelj is a finance and technology reporter. Some of his biggest works include interviews with leaders such as John Chambers, founder and CEO, JC2 Ventures, Kevin O’Leary, businessman and Shark Tank host, Catherine Wood, CEO and CIO, ARK Invest, among others.

Disclaimer

At this time, Physik Invest does not manage outside capital and is not licensed. In no way should the materials herein be construed as advice. Derivatives carry a substantial risk of loss. All content is for informational purposes only.

Categories
Commentary

Daily Brief For October 18, 2021

Market Commentary

In sync with bonds, equity index futures were sideways to lower, overnight. Commodities were mixed. Volatility expanded.

  • More support for an EOY run-up.
  • Ahead is a light day for releases.
  • Positioned for sideways balance.

What Happened: U.S. stock index futures auctioned sideways to lower overnight alongside conflicting narratives.

Ahead is data on industrial production and capacity utilization (9:15 AM ET), as well as the National Association of Home Builders Index (10:00 AM ET).

Graphic updated 6:00 AM ET. Sentiment Neutral if expected /ES open is inside of the prior day’s range. Sentiment Risk-On if expected /ES open is above the prior day’s range. Sentiment Risk-Off if expected /ES open is below the prior day’s range. /ES levels are derived from the profile graphic at the bottom of the following section. Levels may have changed since initially quoted; click here for the latest levels. SqueezeMetrics Dark Pool Index (DIX) and Gamma (GEX) calculations are based on where the prior day’s reading falls with respect to the MAX and MIN of all occurrences available. A higher DIX is bullish. At the same time, the lower the GEX, the more (expected) volatility. SHIFT data used for S&P 500 (INDEX: SPX) options activity. Note that options flow is sorted by the call premium spent; if more positive then more was spent on call options. Breadth reflects a reading of the prior day’s NYSE Advance/Decline indicator. VIX reflects a current reading of the CBOE Volatility Index (INDEX: VIX) from 0-100.

What To Expect: As of 6:00 AM ET, Monday’s regular session (9:30 AM – 4:00 PM EST) in the S&P 500 may open inside of prior-range and -value, suggesting a limited potential for immediate directional opportunity.

Adding, during the prior day’s regular trade, on lackluster intraday breadth and market liquidity metrics, the best case outcome occurred, evidenced by an expansion of range above the $4,437.75 micro composite point of control (MCPOC), to a new overnight high (ONH) at $4,469.75.

Coupled with that dynamic is the presence of numerous gaps and p-shaped emotional, multiple-distribution profile structures (i.e., old-money shorts covering); participants will likely look to revisit, repair, and strengthen – build out areas of high volume (HVNodes) via the cave-fill process – these areas of low volume (LVNodes). 

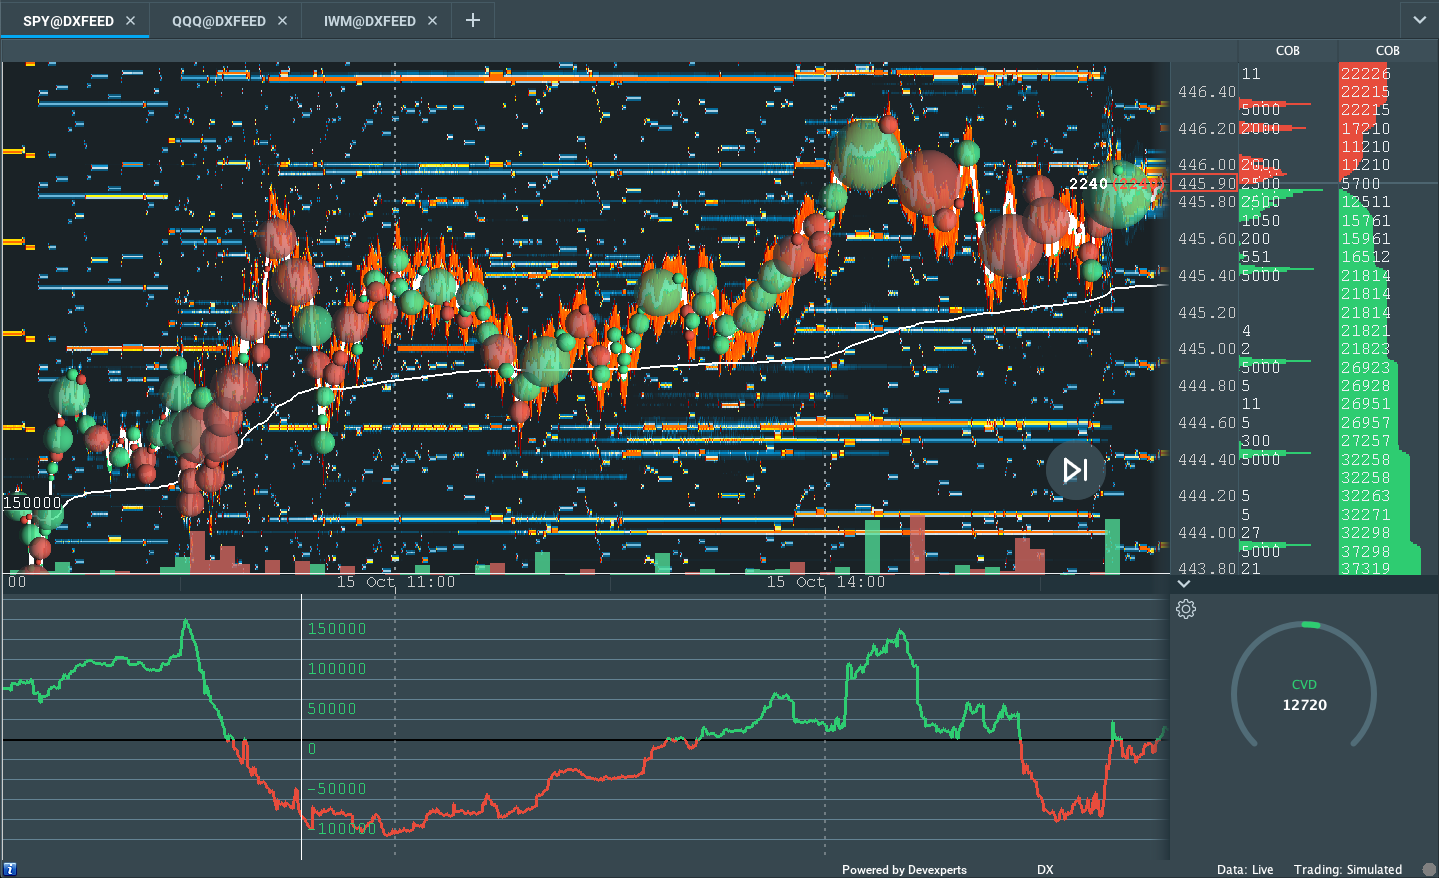
Graphic: Unsupportive delta (i.e., non-committed buying and selling as measured by volume delta or buying and selling power as calculated by the difference in volume traded at the bid and offer) in SPDR S&P 500 ETF Trust (NYSE: SPY), one of the largest ETFs that track the S&P 500 index, via Bookmap. The readings are supportive of responsive trade or balance (i.e., rotational trade that suggests current prices offer favorable entry and exit).

Zooming out, we saw the Nasdaq 100 firming, relative to its peers, last week, a significant change in tone.

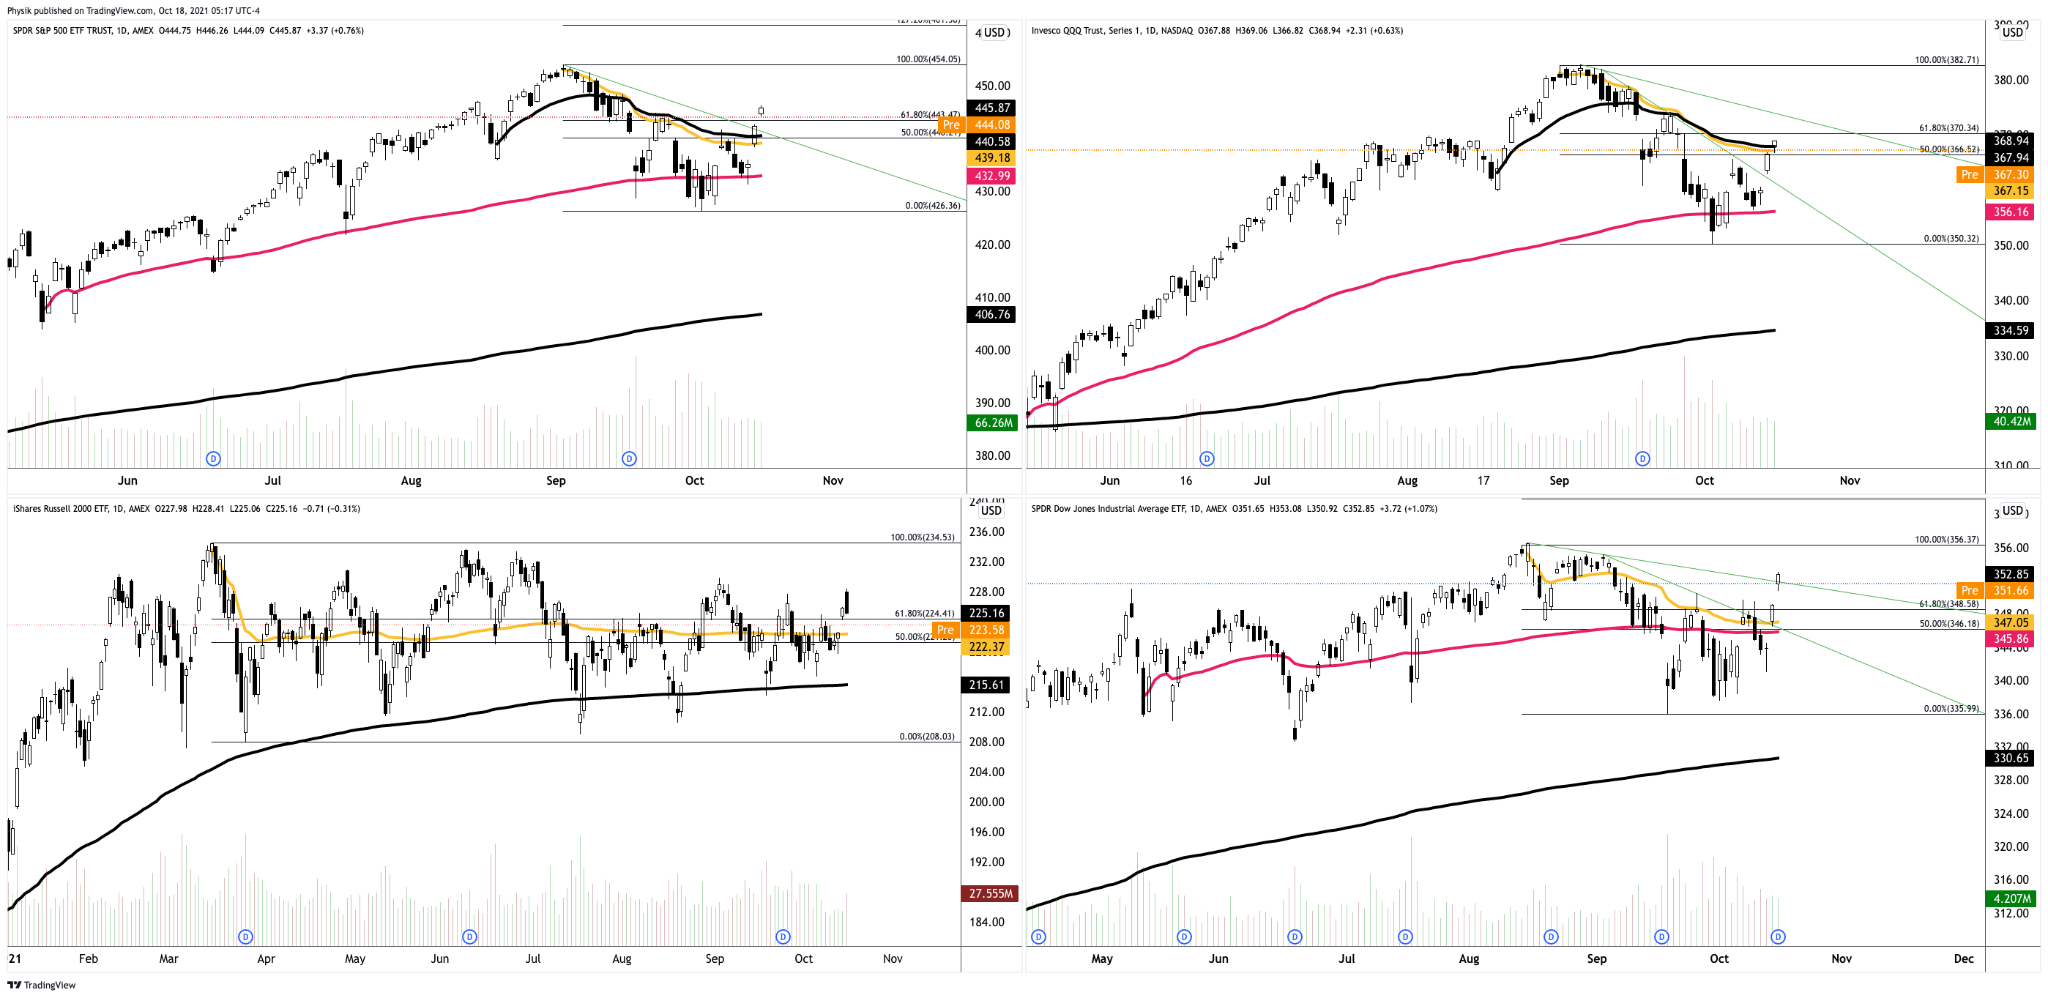
Given where the S&P 500’s price is in relation to the yellow anchored volume-weighted average price (VWAP), the average buyer, since the all-time high, holds a winning position; sideways-to-higher trade, above the upward sloping trendline, as well as the 50.00% and 61.8% retracements, likely puts in play a recovery of the all-time high.

Graphic: SPDR S&P 500 ETF (NYSE: SPY) top left, Invesco QQQ Trust Series 1 (NASDAQ: QQQ) top right, iShares Russell 2000 ETF (NYSE: IWM) bottom left, SPDR Dow Jones Industrial Average ETF Trust (NYSE: DIA) bottom right.

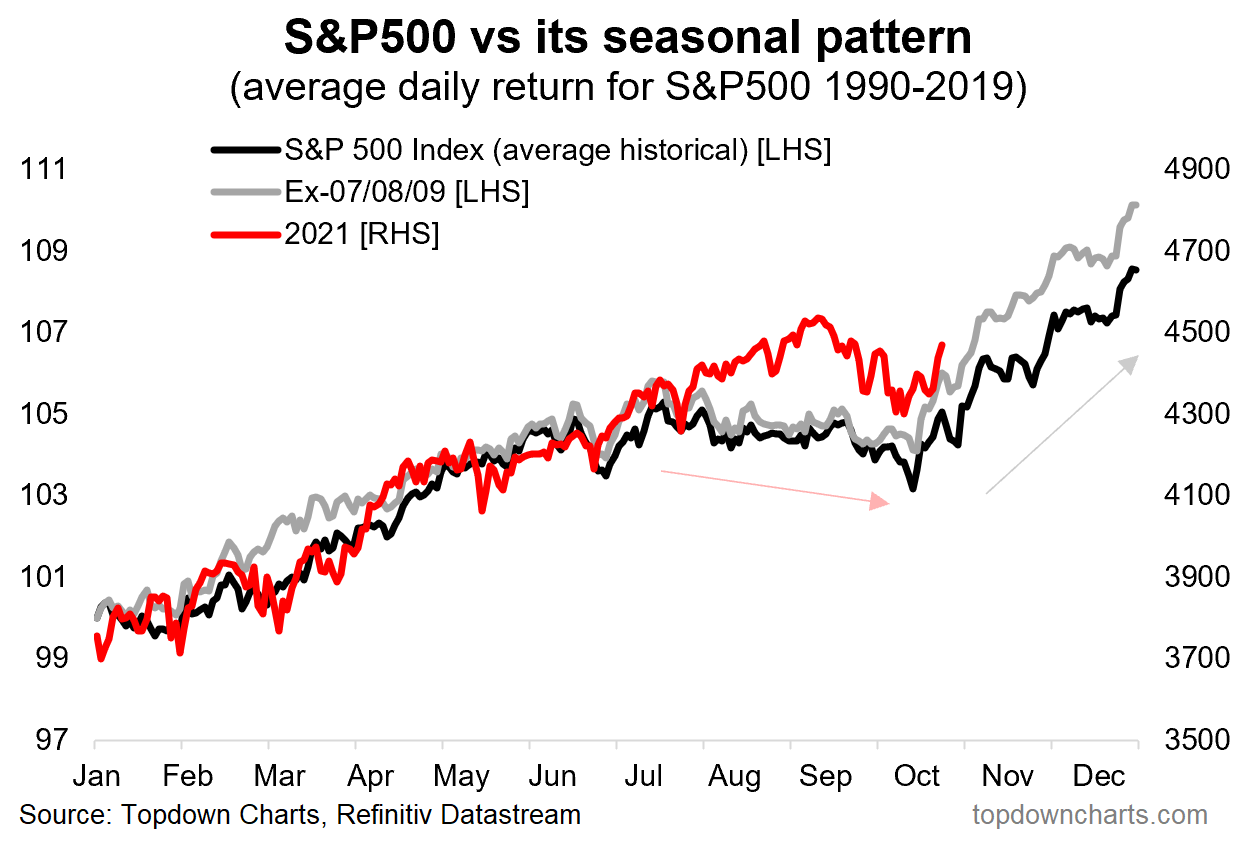
Further, the aforementioned trade is happening in the context of improving breadth amidst a seasonally bullish cycle of contributions, rebalancing, and earnings, as well as the risks associated with a taper in asset purchases and a hike in rates.

Graphic: S&P 500 seasonality via @topdowncharts

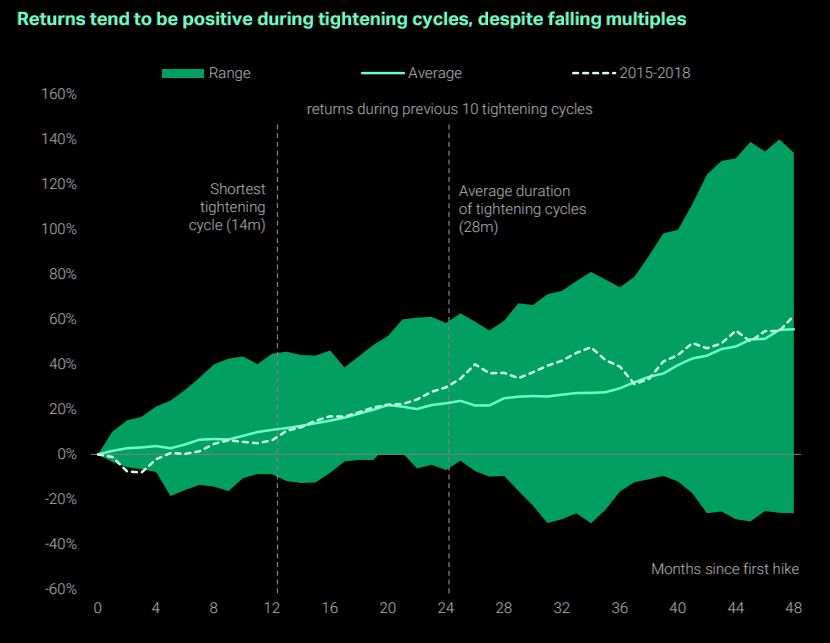
According to a TS Lombard note featured by The Market Ear, the odds are that a tightening in monetary policy should not douse the bullish narrative:

“Tightening monetary policy cycles have historically been positive for stocks. The exceptions were in the 1970s, when inflation was counter-cyclical and the Fed tightened despite slowing growth. In ‘regular’ cycles the Fed raises rates only when the economy (and corporate earnings) warrants a tighter policy stance. What is interesting is that positive returns happen despite falling P/E multiples. Higher rates tend to lead to falling valuations, but earnings growth is typically strong enough to compensate for the derating. Since multiples are still much higher than normal, favouring Growth (faster EPS growth) over Value (slower EPS growth) is a good strategy at this stage.”

Graphic: TS Lombard’s analysis of tightening cycles, via The Market Ear.

In terms of positioning, the CBOE Volatility Index (INDEX: VIX) was higher, overnight, while the VIX futures term structure was in contango; supply at the front end of the curve, alongside the long-gamma environment, signals a potential for near-term equity market stability.

To note, according to SpotGamma models, last week’s near-vertical price rise was responsively sold as dealers looked to hedge their increasing positive directional market exposure; going forward, hedging pressures may dampen volatility, potentially setting the market up for balance (i.e., sideways trade) as participants muster the conviction to initiate the next leg.

Moreover, for today, participants may make use of the following frameworks.

In the best case, the S&P 500 trades sideways or higher; activity above the $4,437.75 MCPOC puts in play the $4,463.75 low volume area (LVNode). Initiative trade beyond the LVNode could reach as high as the $4,481.75 high volume area (HVNode) and $4,510.00 LVNode, or higher.

In the worst case, the S&P 500 trades lower; activity below the $4,437.75 MCPOC puts in play the $4,425.00 untested point of control (VPOC). Initiative trade beyond the VPOC could reach as low as the $4,393.75 HVNode and $4,349.00 VPOC, or lower.

Click here to load today’s updated real-time key levels into the web-based TradingView charting platform. Please note that all levels are derived using the 65-minute timeframe.
Graphic: 65-minute profile chart of the Micro E-mini S&P 500 Futures updated 5:15 AM ET.

Definitions

Overnight Rally Highs (Lows): Typically, there is a low historical probability associated with overnight rally-highs (lows) ending the upside (downside) discovery process.

Cave-Fill Process: Widened the area deemed favorable to transact at by an increased share of participants. This is a good development.

Volume Areas: A structurally sound market will build on areas of high volume (HVNodes). Should the market trend for long periods of time, it will lack sound structure, identified as low volume areas (LVNodes). LVNodes denote directional conviction and ought to offer support on any test. 

If participants were to auction and find acceptance into areas of prior low volume (LVNodes), then future discovery ought to be volatile and quick as participants look to HVNodes for favorable entry or exit.

Gamma: Gamma is the sensitivity of an option to changes in the underlying price. Dealers that take the other side of options trades hedge their exposure to risk by buying and selling the underlying. When dealers are short-gamma, they hedge by buying into strength and selling into weakness. When dealers are long-gamma, they hedge by selling into strength and buying into weakness. The former exacerbates volatility. The latter calms volatility.

POCs: POCs are valuable as they denote areas where two-sided trade was most prevalent in a prior day session. Participants will respond to future tests of value as they offer favorable entry and exit.

MCPOCs: POCs are valuable as they denote areas where two-sided trade was most prevalent over numerous day sessions. Participants will respond to future tests of value as they offer favorable entry and exit.

Inversion Of VIX Futures Term Structure: Longer-dated VIX expiries are less expensive; is a warning of elevated near-term risks for equity market stability.

Balance (Two-Timeframe Or Bracket): Rotational trade that denotes current prices offer favorable entry and exit. Balance-areas make it easy to spot a change in the market (i.e., the transition from two-time frame trade, or balance, to one-time frame trade, or trend). 

Modus operandi is responsive trade (i.e., fade the edges), rather than initiative trade (i.e., play the break).

More On Volume-Weighted Average Prices (VWAPs): A metric highly regarded by chief investment officers, among other participants, for quality of trade. Additionally, liquidity algorithms are benchmarked and programmed to buy and sell around VWAPs.

Rates: Low rates have to potential to increase the present value of future earnings making stocks, especially those that are high growth, more attractive. To note, inflation and rates move inversely to each other. Low rates stimulate demand for loans (i.e., borrowing money is more attractive). In conjunction with the rapid recovery, lower rates may solicit hawkish commentary as policymakers look to inhibit inflation.

News And Analysis

Forbearances declining faster, plans drop by 10%.

Morgan Stanley CEO is calling for Fed rate hiking.

Analysts warn that 60/40 portfolio will be battered.

Moody’s: Fundamental siding with Fed on inflation.

S&P Global: Data on job gains has come up short.

Global energy turning to fossil fuels amid demand.

How the asset management industry got disrupted.

What People Are Saying

About

After years of self-education, strategy development, and trial-and-error, Renato Leonard Capelj began trading full-time and founded Physik Invest to detail his methods, research, and performance in the markets. 

Additionally, Capelj is a finance and technology reporter. Some of his biggest works include interviews with leaders such as John Chambers, founder and CEO, JC2 Ventures, Kevin O’Leary, businessman and Shark Tank host, Catherine Wood, CEO and CIO, ARK Invest, among others.

Disclaimer

At this time, Physik Invest does not manage outside capital and is not licensed. In no way should the materials herein be construed as advice. Derivatives carry a substantial risk of loss. All content is for informational purposes only.
Categories
Commentary

Daily Brief For October 5, 2021

Editor’s Note: Sorry for the delay, everyone. I’m back in action, today, after traveling!

Market Commentary

Equity index futures trade higher with yields and the dollar. Commodities were mixed.

  • Positioning: Some risks weigh to the upside.
  • Ahead is data on the trade deficit, PMI, ISM.
  • Fundamental narratives are reducing clarity.

What Happened: U.S. stock index futures sideways to higher overnight alongside narratives surrounding a taper to Federal Reserve asset purchases and debt ceiling complications.

Ahead is data on the trade deficit (8:30 AM ET), Markit services PMI (9:45 AM ET), and ISM services index (10:00 AM ET).

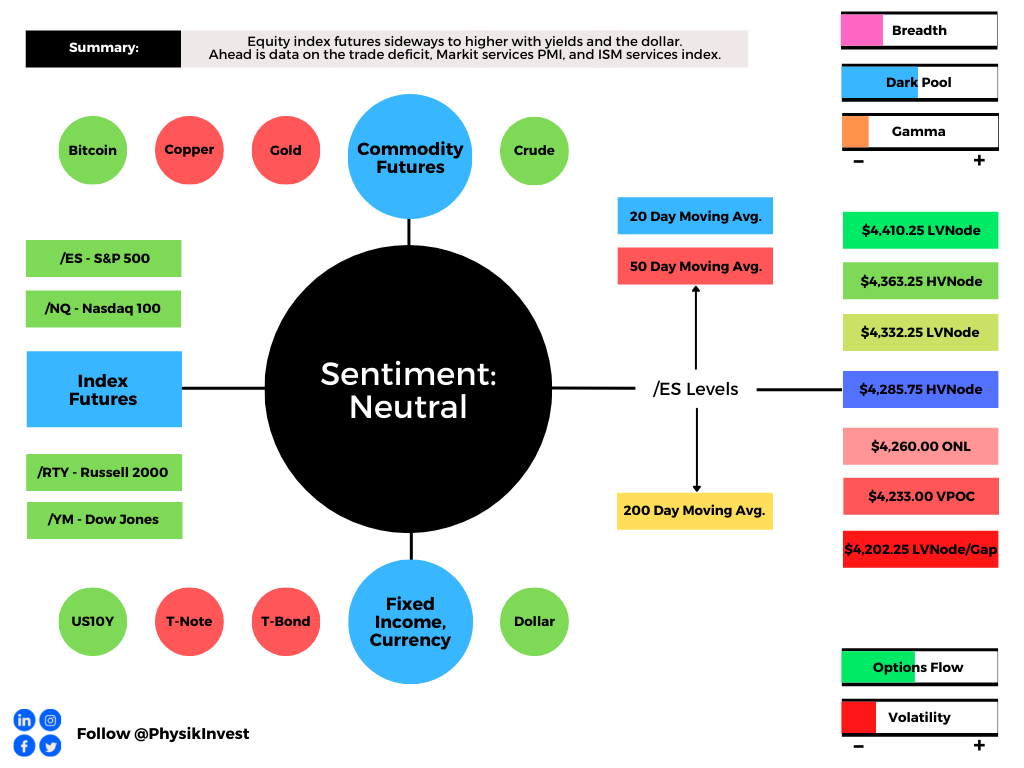
Graphic updated 7:50 AM ET. Sentiment Neutral if expected /ES open is inside of the prior day’s range. /ES levels are derived from the profile graphic at the bottom of the following section. SqueezeMetrics Dark Pool Index (DIX) and Gamma (GEX) calculations are based on where the prior day’s reading falls with respect to the MAX and MIN of all occurrences available. A higher DIX is bullish. At the same time, the lower the GEX, the more (expected) volatility. SHIFT data used for S&P 500 (INDEX: SPX) options activity. Note that options flow is sorted by the call premium spent; if more positive then more was spent on call options. Breadth reflects a reading of the prior day’s NYSE Advance/Decline indicator. VIX reflects a current reading of the CBOE Volatility Index (INDEX: VIX) from 0-100.

What To Expect: As of 7:50 AM ET, Tuesday’s regular session (9:30 AM – 4:00 PM EST) in the S&P 500 will likely open inside of prior-range and -value, suggesting a limited potential for immediate directional opportunity.

Adding, during the prior day’s regular trade, on weak intraday breadth and divergent market liquidity metrics, the worst-case outcome occurred, evidenced by a liquidation into the bulk of last Friday’s value, the area where about 70% of the volume took place. 

In the process, participants left a letter b-shaped profile which suggests participants were “too” long and had poor location; Friday’s advance away from the value area, on a taper of volume, left poor structure – lacking commitment – that gave during Monday’s move lower alongside fundamental drivers, putting in play the S&P 500’s October 1 $4,260.00 overnight low (ONL).

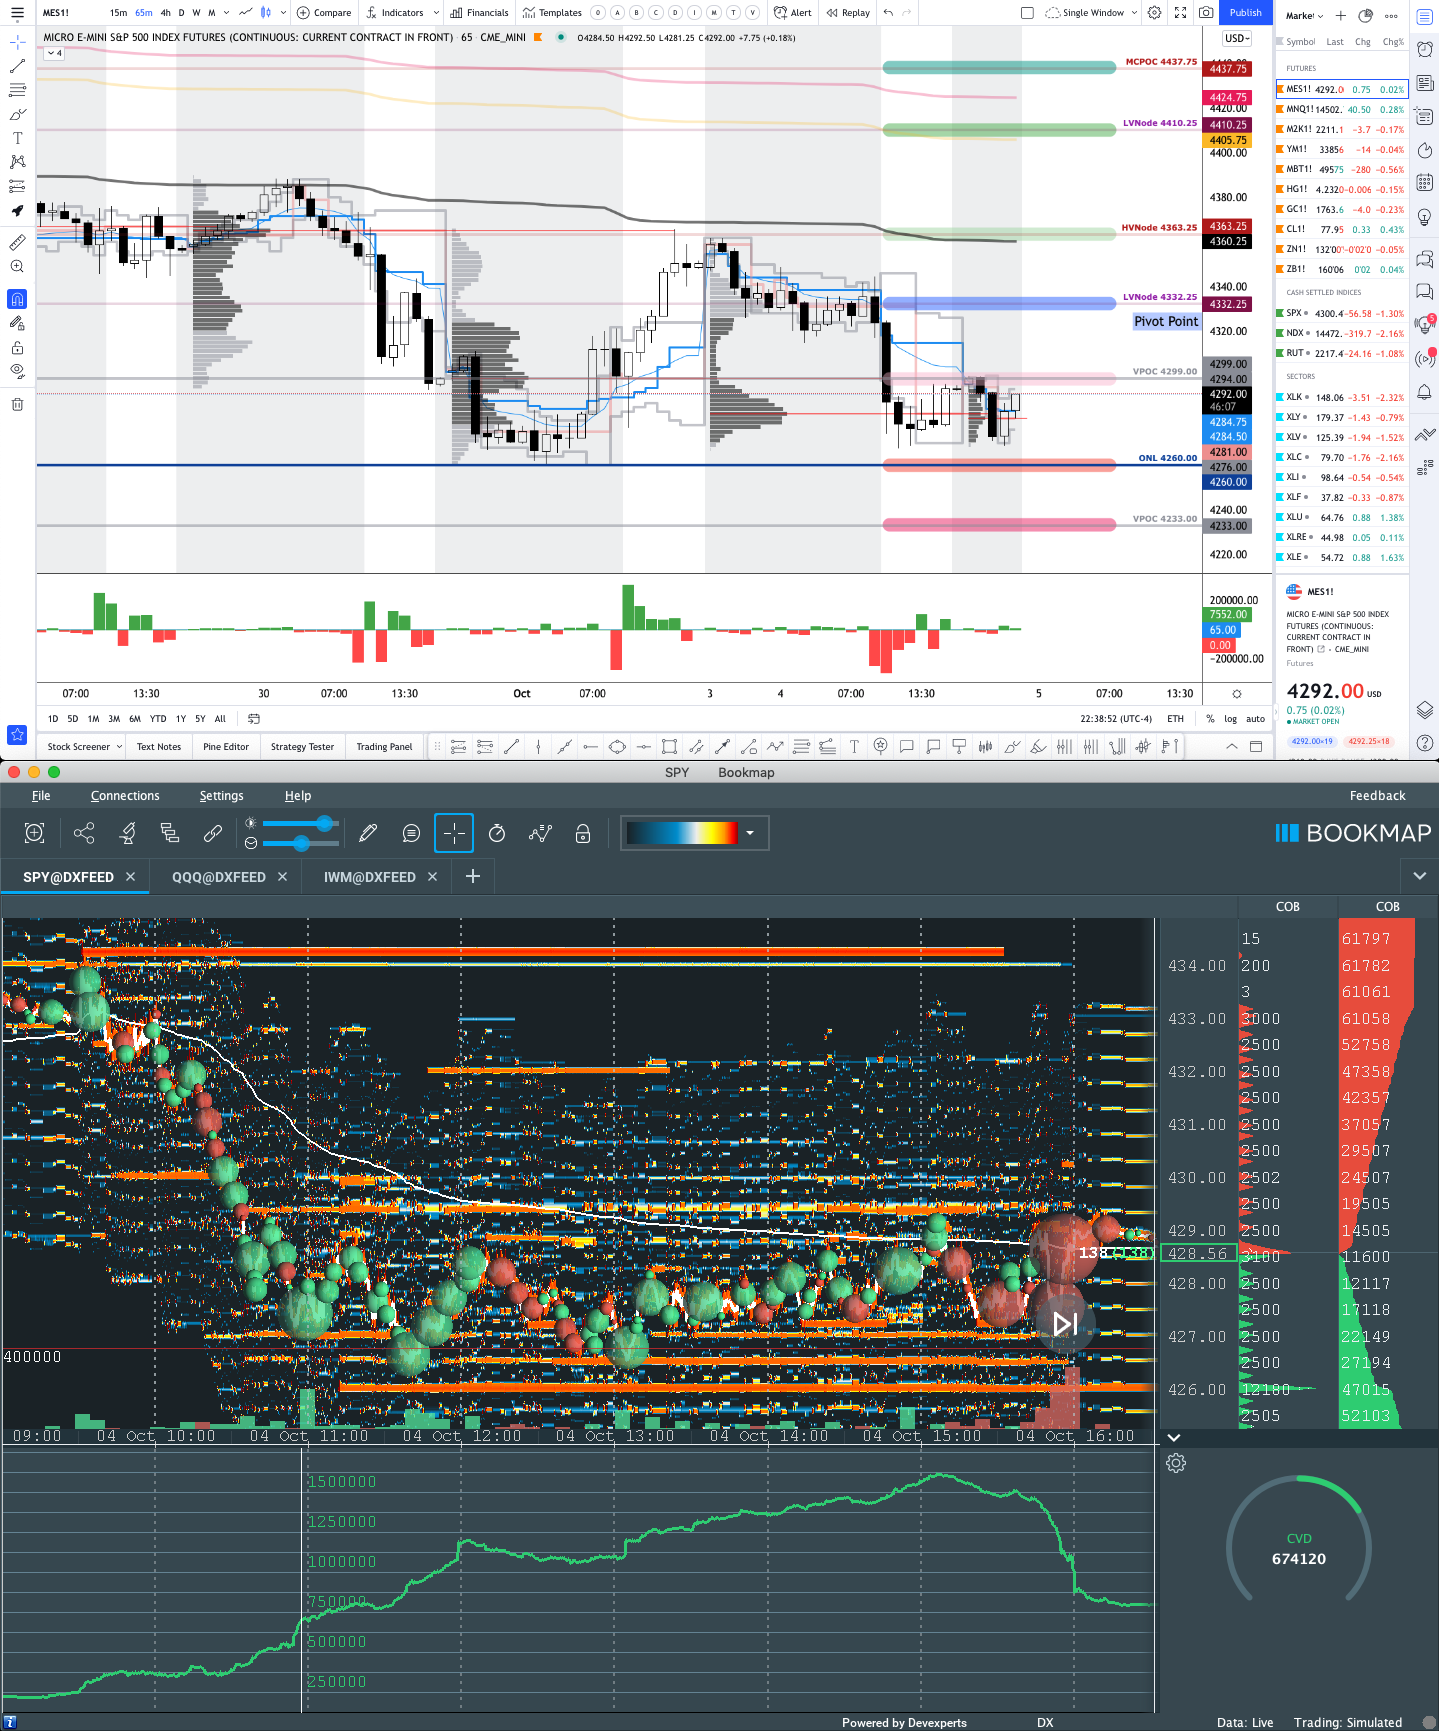
Graphic: Divergent delta (i.e., non-committed selling as measured by volume delta or buying and selling power as calculated by the difference in volume traded at the bid and offer) in SPDR S&P 500 ETF Trust (NYSE: SPY), one of the largest ETFs that track the S&P 500 index, via Bookmap. The readings are supportive of responsive trade or balance (i.e., rotational trade that suggests current prices offer favorable entry and exit).

Further, the aforementioned trade is happening in the context of a traditionally volatile October, as well as narratives surrounding a taper to Federal Reserve asset purchases and debt ceiling complications.

These themes are supportive of fear and uncertainty.

To elaborate, on one hand, according to Bloomberg, “the bond market thinks the Fed is going to make a hawkish mistake, and stamp out the life in the economy when previously there had been a belief that the Fed would be easy and let inflation move higher.”

On the other hand, in reference to default on a failure to raise or suspend the debt limit, “The consensus (from clients to whom we speak) is that it just will not happen,” Barclays Plc (NYCE: BCS) analysts explained. “But political schisms in Congress are stronger than they have been in a long time and battle lines more hardened.”

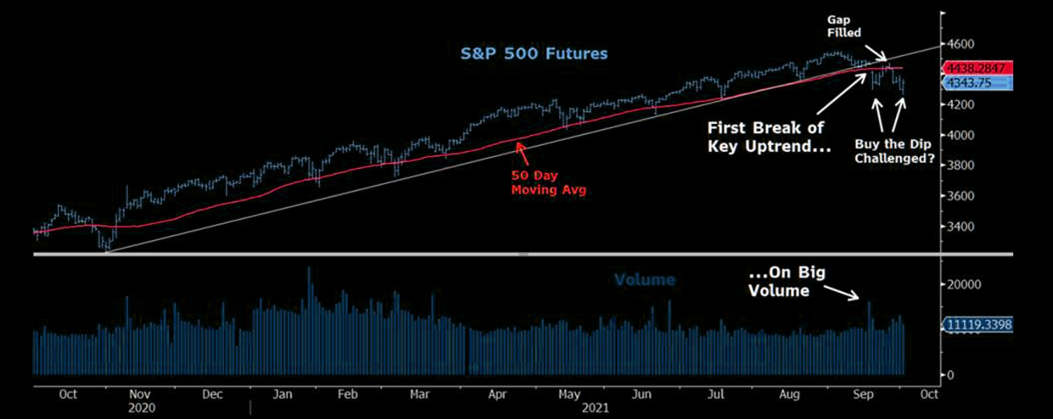
In addition, according to The Market Ear, Morgan Stanley’s (NYSE: MS) Mike Wilson sees the inability of companies to pass on pricing, margin risk related to higher wages, and a reversion to trend in goods consumption, coupled with near term risks on supply chain issues, weighing earnings into early next year.

“In short, higher real rates should mean lower equity prices. Secondarily, they may also mean value over growth even as the overall equity market goes lower. This makes for a doubly difficult investment environment given how most investors are positioned,” Wilson said in a discussion that also touched on a fraying in the buy-the-dip psychology

In opposition, JPMorgan Chase & Co (NYSE: JPM) sales believe liquidity will remain ample while a capital return and consumer balance sheet health make the recent dip a buy.

Graphic: Morgan Stanley unpacks fraying of buy-the-dip psychology, visually, via The Market Ear.

In terms of positioning, there is more risk to the upside than the downside; indices are best positioned for a vicious rebound as near-term downside discovery has likely reached a limit.

Moreover, for today, participants may make use of the following frameworks.

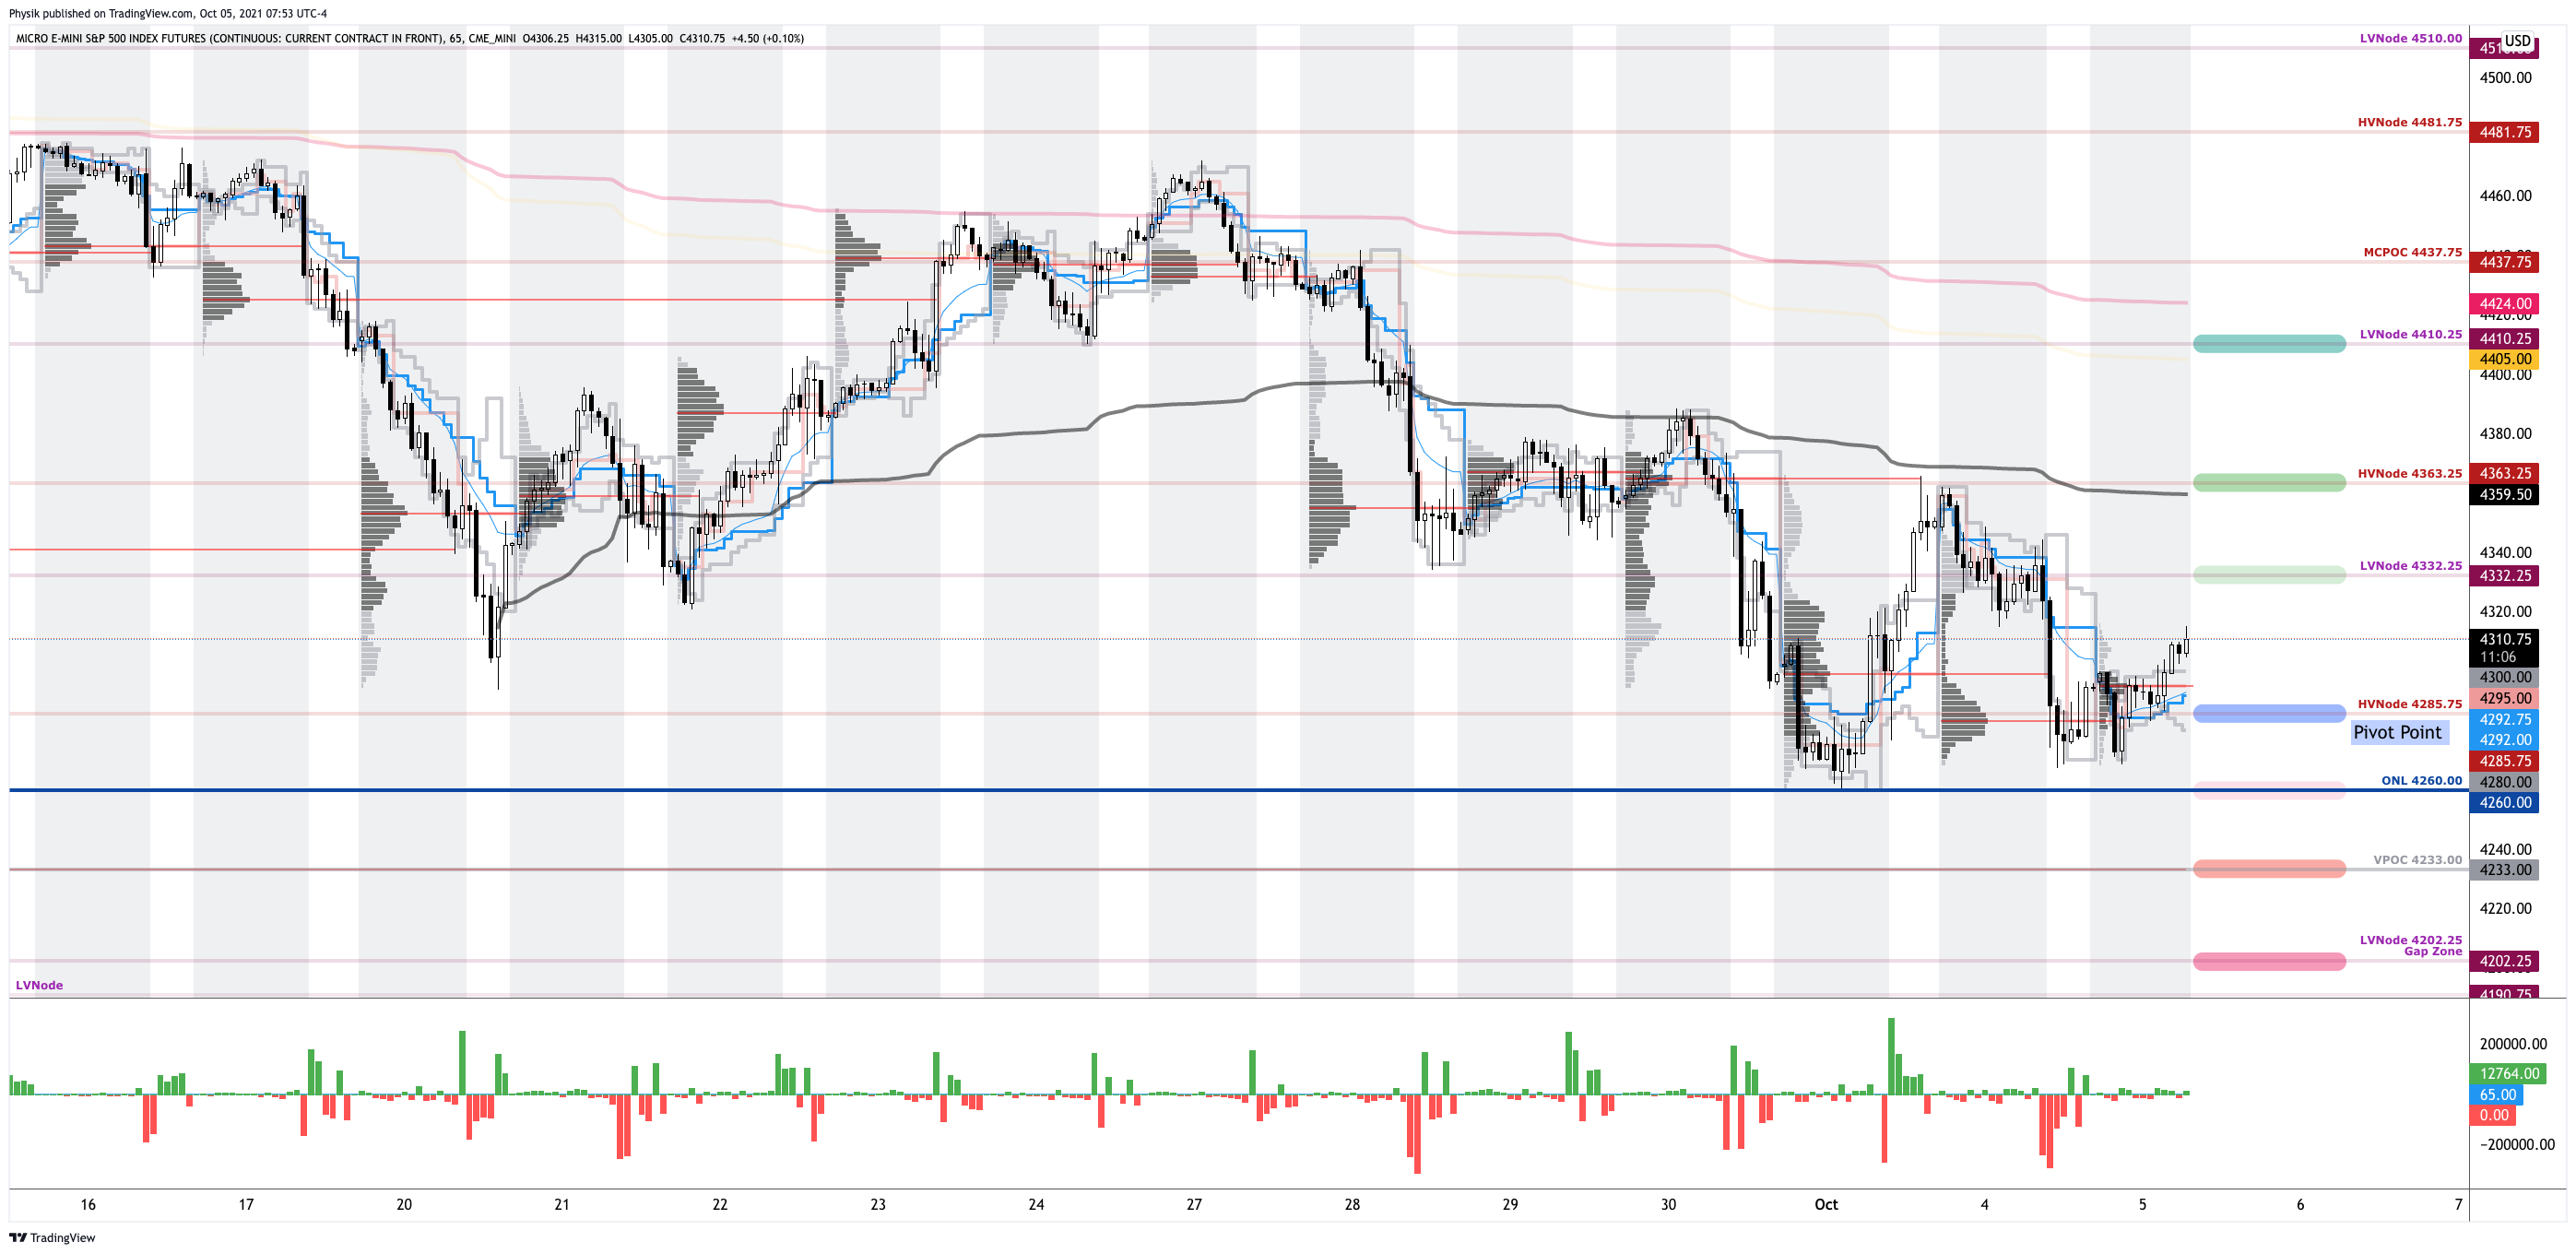
In the best case, the S&P 500 trades sideways or higher; activity above the $4,285.75 high volume area (HVNode) puts in play the $4,332.25 low volume area (LVNode). Initiative trade beyond the LVNode could reach as high as the $4,363.25 HVNode and $4,410.25 LVNode, or higher.

In the worst case, the S&P 500 trades lower; activity below the $4,285.75 HVNode puts in play the $4,260.00 overnight low (ONL). Initiative trade beyond the ONL could reach as low as the $4,233.00 VPOC and $4,202.25 gap zone, or lower.

Graphic: 65-minute profile chart of the Micro E-mini S&P 500 Futures updated 7:50 AM ET.

Definitions

Overnight Rally Highs (Lows): Typically, there is a low historical probability associated with overnight rally-highs (lows) ending the upside (downside) discovery process.

Volume Areas: A structurally sound market will build on areas of high volume (HVNodes). Should the market trend for long periods of time, it will lack sound structure, identified as low volume areas (LVNodes). LVNodes denote directional conviction and ought to offer support on any test. 

If participants were to auction and find acceptance into areas of prior low volume (LVNodes), then future discovery ought to be volatile and quick as participants look to HVNodes for favorable entry or exit.

POCs: POCs are valuable as they denote areas where two-sided trade was most prevalent in a prior day session. Participants will respond to future tests of value as they offer favorable entry and exit.

News And Analysis

Stagflation fear is having a British renaissance.

Global energy crisis is first of many in transition.

Buy the dip has failed. Here’s what you do next.

What People Are Saying

About

After years of self-education, strategy development, and trial-and-error, Renato Leonard Capelj began trading full-time and founded Physik Invest to detail his methods, research, and performance in the markets. 

Additionally, Capelj is a finance and technology reporter. Some of his biggest works include interviews with leaders such as John Chambers, founder and CEO, JC2 Ventures, Kevin O’Leary, businessman and Shark Tank host, Catherine Wood, CEO and CIO, ARK Invest, among others.

Disclaimer

At this time, Physik Invest does not manage outside capital and is not licensed. In no way should the materials herein be construed as advice. Derivatives carry a substantial risk of loss. All content is for informational purposes only.
Categories
Commentary

Daily Brief For October 4, 2021

Market Commentary

Equity index futures were sideways to lower with bonds and the dollar.

  • Nordea: Macro backdrop worsens.
  • Ahead is a relatively light calendar.
  • October is volatile while Q4 bullish.

What Happened: U.S. stock index futures auctioned sideways to lower overnight alongside reports that China was showing little interest in a direct bailout of Evergrande and U.S. political leaders remain at odds on the debt limit.

Ahead is data on factory orders and core capital goods orders (10:00 AM ET).

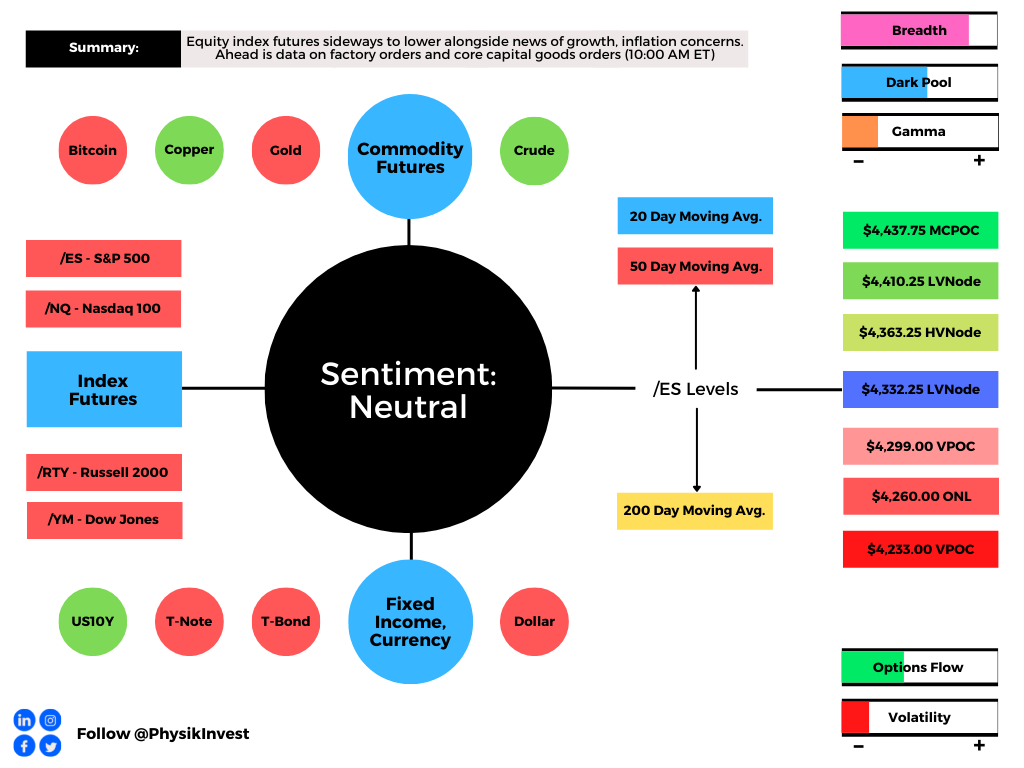
Graphic updated 6:30 AM ET. Sentiment Neutral if expected /ES open is inside of the prior day’s range. /ES levels are derived from the profile graphic at the bottom of the following section. SqueezeMetrics Dark Pool Index (DIX) and Gamma (GEX) calculations are based on where the prior day’s reading falls with respect to the MAX and MIN of all occurrences available. A higher DIX is bullish. At the same time, the lower the GEX, the more (expected) volatility. SHIFT data used for S&P 500 (INDEX: SPX) options activity. Note that options flow is sorted by the call premium spent; if more positive then more was spent on call options. Breadth reflects a reading of the prior day’s NYSE Advance/Decline indicator. VIX reflects a current reading of the CBOE Volatility Index (INDEX: VIX) from 0-100.

What To Expect: As of 6:30 AM ET, Monday’s regular session (9:30 AM – 4:00 PM EST) in the S&P 500 will likely open inside of prior-range and -value, suggesting a limited potential for immediate directional opportunity.

Adding, during the prior day’s regular trade, on a strengthening of intraday breadth, among other metrics including positioning measures, the best case outcome occurred, evidenced by a recovery of Thursday’s $4,365.00 untested point of control (VPOC). 

Given the overnight response at the top of Friday’s value area – the bulk of where trade was conducted – it looks as though participants are interested in slowing the pace of downside discovery. 

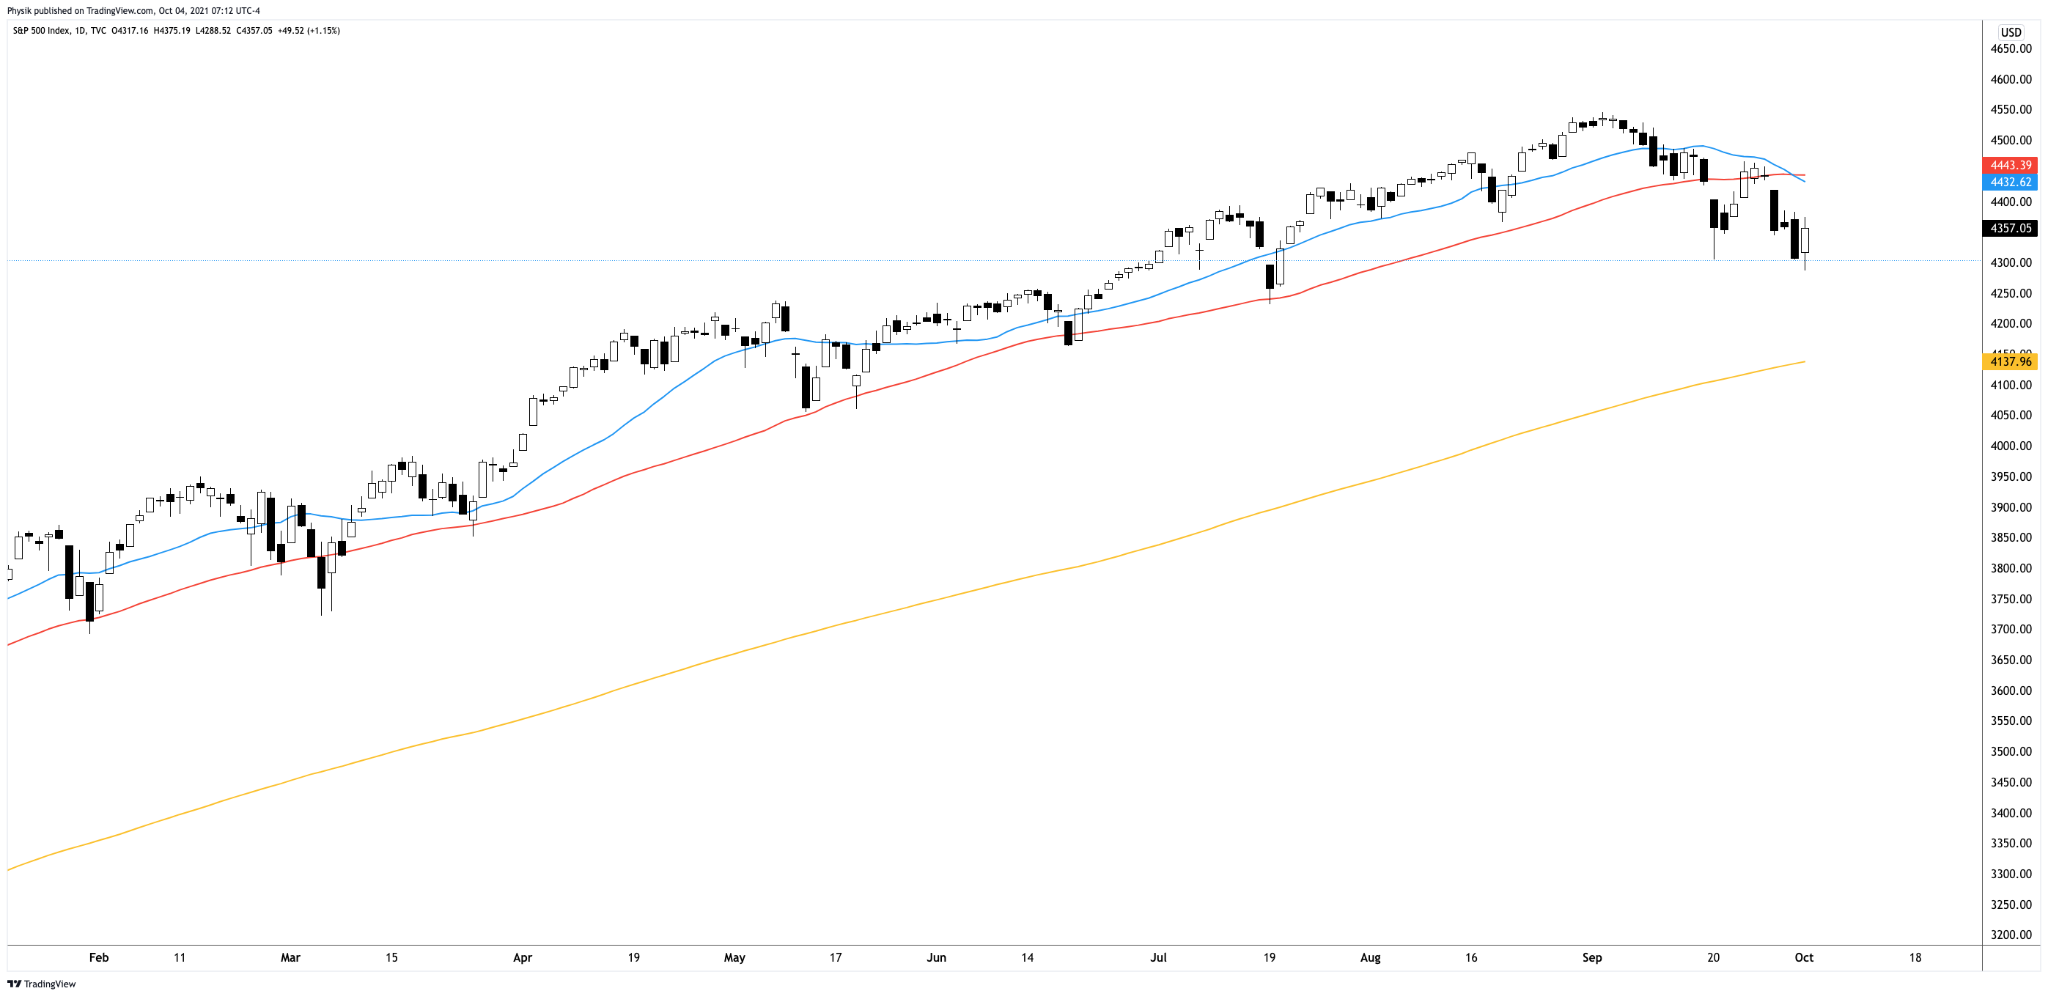
Still, the S&P 500 is well below its 20- and 50-day simple moving averages and multiple distribution profile structures denote emotion, as well as a lack of commitment

Graphic: S&P 500 daily chart with 20-, 50-, and 200-day simple moving average.

Further, the aforementioned trade is happening in the context of a traditionally volatile October and a fraying in the buy-the-dip psychology.

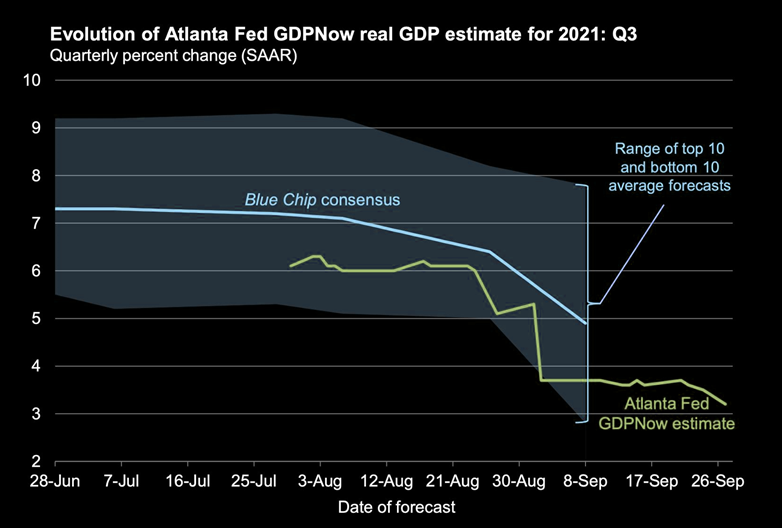
According to Nordea, despite a calm, upward-sloping term structure, there has been “a slightly upward tilting trend” in futures tracking the S&P 500 volatility index, likely warranted by several macro reasons including a worsening in liquidity, a slowdown in growth, cost/margin problems, and risks to the Fed put.

Graphic: Fed’s GDPNow estimate lowers expectations for U.S. economic growth, via The Market Ear

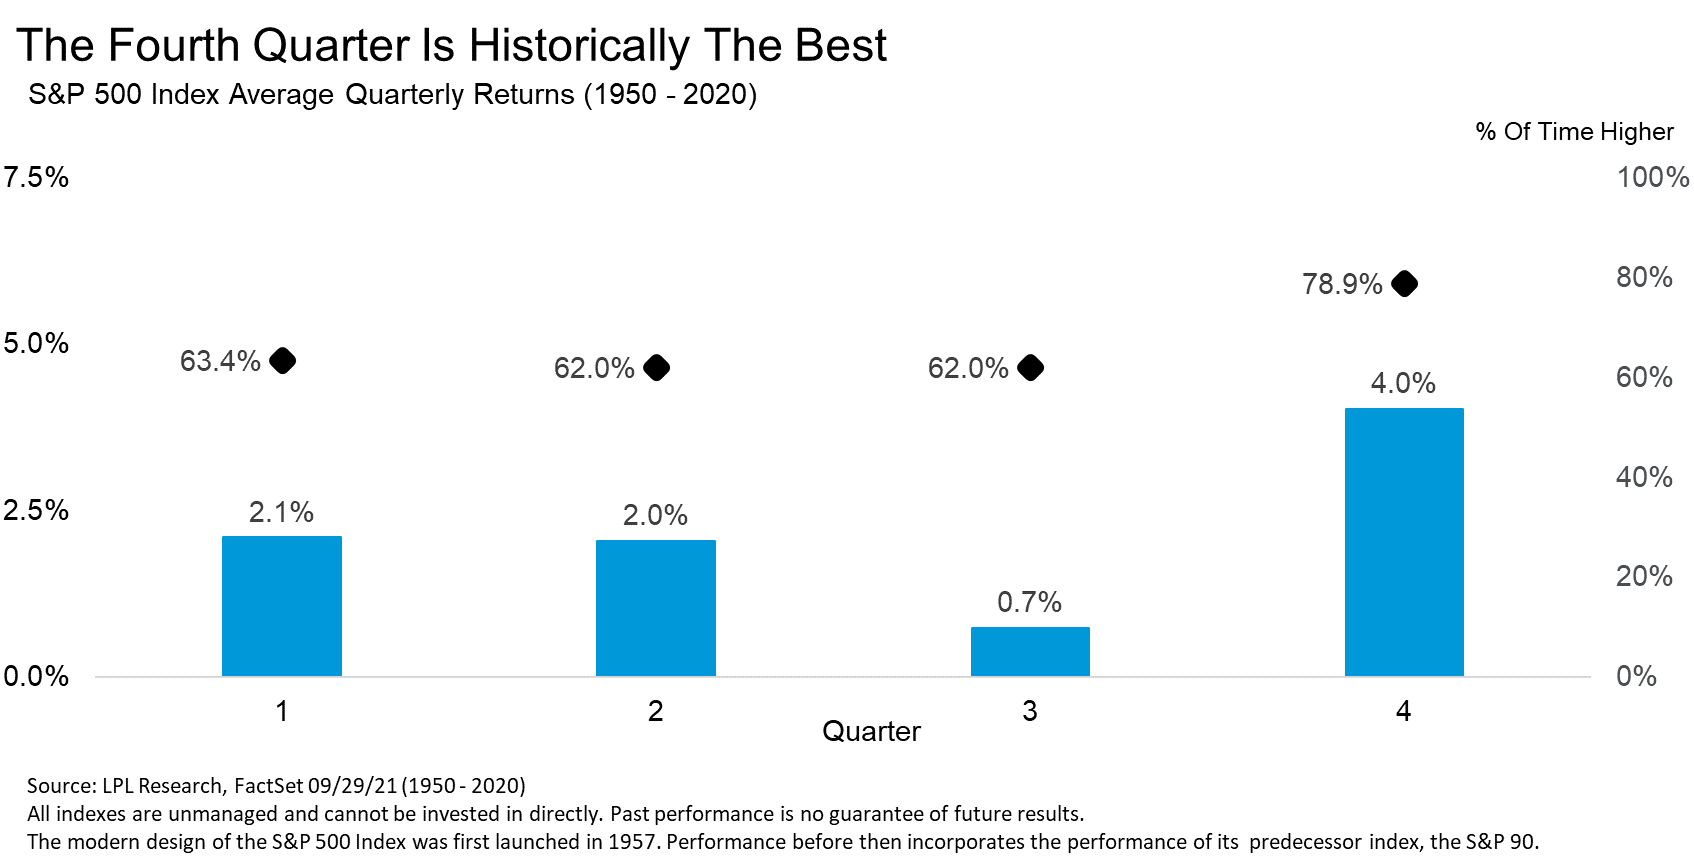
LPL Research adds that aside from October, no other month has seen more 1% moves, and the fourth quarter is “historically the best for stocks, with the third quarter the worst.”

Graphic: LPL Research unpacks S&P 500 seasonality. 

Moreover, for today, given expectations of heightened volatility, participants may make use of the following frameworks.

In the best case, the S&P 500 trades sideways or higher; activity above the $4,332.25 low volume area (LVNode) puts in play the $4,363.25 high volume area (HVNode). Initiative trade beyond the HVNode could reach as high as the $4,410.25 LVNode and $4,437.75 micro composite point of control (MCPOC), or higher.

In the worst case, the S&P 500 trades lower; activity below the $4,332.25 LVNode puts in play the $4,299.00 VPOC. Initiative trade beyond the VPOC could reach as low as $4,260.00 overnight low (ONL) and $4,233.00 VPOC, or lower.

Graphic: 65-minute profile chart of the Micro E-mini S&P 500 Futures updated 6:30 AM ET.

Definitions

Overnight Rally Highs (Lows): Typically, there is a low historical probability associated with overnight rally-highs (lows) ending the upside (downside) discovery process.

Volume Areas: A structurally sound market will build on areas of high volume (HVNodes). Should the market trend for long periods of time, it will lack sound structure, identified as low volume areas (LVNodes). LVNodes denote directional conviction and ought to offer support on any test. 

If participants were to auction and find acceptance into areas of prior low volume (LVNodes), then future discovery ought to be volatile and quick as participants look to HVNodes for favorable entry or exit.

POCs: POCs are valuable as they denote areas where two-sided trade was most prevalent in a prior day session. Participants will respond to future tests of value as they offer favorable entry and exit.

MCPOCs: POCs are valuable as they denote areas where two-sided trade was most prevalent over numerous day sessions. Participants will respond to future tests of value as they offer favorable entry and exit.

Responsive Buying (Selling): Buying (selling) in response to prices below (above) an area of recent price acceptance.

Price Discovery (One-Timeframe Or Trend): Elongation and range expansion denotes a market seeking new prices to establish value, or acceptance (i.e., more than 30-minutes of trade at a particular price level).

News And Analysis

EM bond markets continue to grow, as do vulnerabilities.

There’s is no inflation without income; there’s no income.

Action on Evergrande to avoid financial, social instability.

Global growth steady as delta spurs big regional swings.

Doomsday clock for U.S. debt ticks on political clashings.

Global Credit Conditions Q4: supply strain, inflation pain.

What People Are Saying

About

After years of self-education, strategy development, and trial-and-error, Renato Leonard Capelj began trading full-time and founded Physik Invest to detail his methods, research, and performance in the markets. 

Additionally, Capelj is a finance and technology reporter. Some of his biggest works include interviews with leaders such as John Chambers, founder and CEO, JC2 Ventures, Kevin O’Leary, businessman and Shark Tank host, Catherine Wood, CEO and CIO, ARK Invest, among others.

Disclaimer

At this time, Physik Invest does not manage outside capital and is not licensed. In no way should the materials herein be construed as advice. Derivatives carry a substantial risk of loss. All content is for informational purposes only.
Categories
Commentary

Daily Brief For September 21, 2021

Market Commentary

Equity index futures trade higher with commodities and yields. Volatility ebbs. 

  • Ahead is a 2-day FOMC meeting.
  • SPX below balance, 50-day SMA.
  • Conditions slowly start improving.

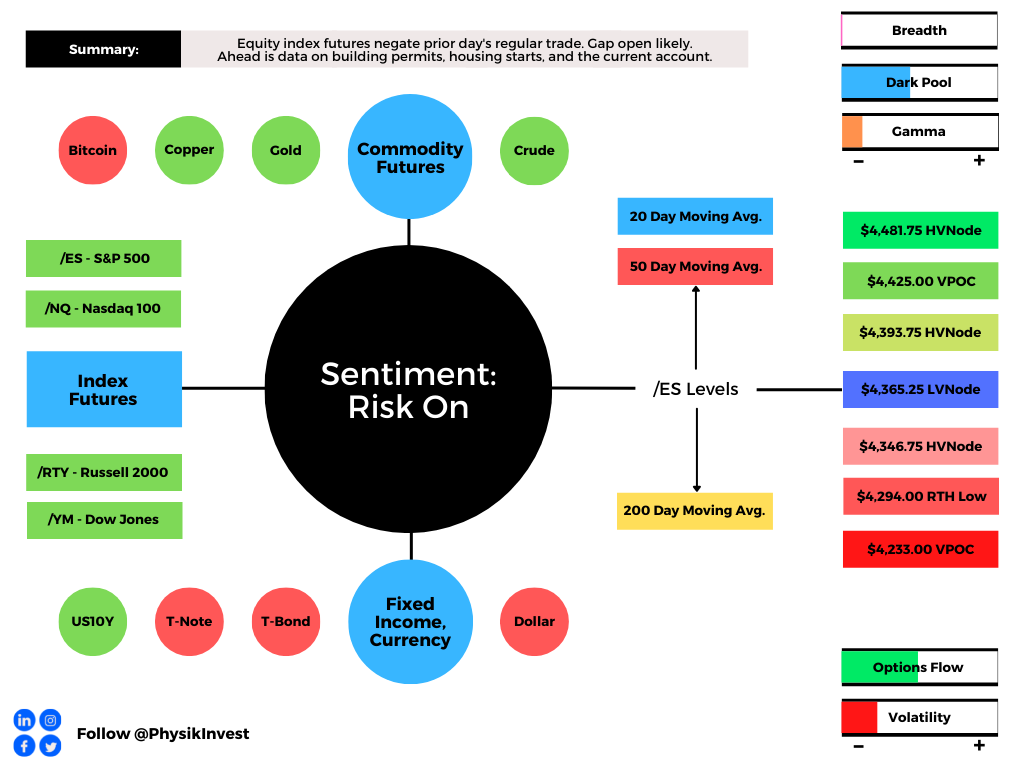
What Happened: End of day rally continued overnight with U.S. stock index futures negating much of yesterday’s liquidation. This comes alongside news questioning Evergrande’s ability to make good on its liabilities, as well as the Federal Reserve’s two-day policy meeting.

Ahead is data on building permits, housing starts, and the current account (8:30 AM ET).

Graphic updated 6:40 AM ET. Sentiment Risk-On if expected /ES open is above the prior day’s range. /ES levels are derived from the profile graphic at the bottom of the following section. SqueezeMetrics Dark Pool Index (DIX) and Gamma (GEX) calculations are based on where the prior day’s reading falls with respect to the MAX and MIN of all occurrences available. A higher DIX is bullish. At the same time, the lower the GEX, the more (expected) volatility. SHIFT data used for S&P 500 (INDEX: SPX) options activity. Note that options flow is sorted by the call premium spent; if more positive then more was spent on call options. Breadth reflects a reading of the prior day’s NYSE Advance/Decline indicator. VIX reflects a current reading of the CBOE Volatility Index (INDEX: VIX) from 0-100.

What To Expect: As of 6:40 AM ET, Tuesday’s regular session (9:30 AM – 4:00 PM EST) in the S&P 500 will likely open outside of prior-range and -value, suggesting a higher potential for immediate directional opportunity.

Gap Scenarios In Play: Gaps ought to fill quickly. Should they not, that’s a signal of strength; do not fade. Leaving value behind on a gap-fill or failing to fill a gap (i.e., remaining outside of the prior session’s range) is a go-with indicator.

Auctioning and spending at least 1-hour of trade back in the prior range suggests a lack of conviction; in such a case, do not follow the direction of the most recent initiative activity.

During the prior day’s regular trade, on weak intraday breadth and divergent market liquidity metrics, the worst-case outcome occurred, evidenced by trade below yesterday’s pivot, the $4,365.25 low volume area (LVNode). 

This trade is significant because it was an acceptance of the overnight gap, a willingness to transact at lower prices. We’re carrying forward the presence of emotional, multiple distribution structures left behind the initiative trade. Also, though the selling covered a lot of ground, it was measured and the CBOE Volatility Index (INDEX: VIX) is now down 20% from Monday’s peak. 

To note, coming into Monday’s liquidation, according to SqueezeMetrics, “the current combination of weak put flows and large customer vanna exposure” was fragile; “Historically, this means SPX down, VIX up.”

Adding, according to SpotGamma, it’s likely Monday’s liquidation was a combination of equity de-risking, combined with short gamma from options positioning. See definition below.

Analysts at JPMorgan Chase & Co (NYSE: JPM) support that belief: “The market sell-off that escalated overnight we believe is primarily driven by technical selling flows in an environment of poor liquidity, and overreaction of discretionary traders to perceived risks.”

Graphic: Tier1Alpha market research graphic via The Market Ear.

Coming into Tuesday’s regular trade, conditions have improved; now, the focus is the September 21-22 Federal Open Market Committee (FOMC) meeting ending Wednesday.

Moreover, for today, participants may make use of the following frameworks.

In the best case, the S&P 500 trades sideways or higher; activity above the $4,365.25 LVNode pivot puts in play the $4,393.75 high volume area (HVNode). Initiative trade beyond the HVNode could reach as high as the $4,425.00 untested point of control (VPOC) and $4,481.75 HVNode, or higher.

In the worst case, the S&P 500 trades lower; activity below the $4,365.25 LVNode puts in play the $4,346.75 HVNode. Initiative trade beyond the HVNode could reach as low as the $4,294.00 regular trade low (RTH Low) and $4,233.00 VPOC, or lower.

Graphic: 65-minute profile chart of the Micro E-mini S&P 500 Futures updated 6:40 AM ET.

Definitions

Gamma: To note, gamma is the sensitivity of an option to changes in the underlying price. Those that take the other side and warehouse these risks hedge their exposure by buying and selling the underlying. When dealers are short-gamma, they hedge by buying into strength and selling into weakness. When dealers are long-gamma, they hedge by selling into strength and buying into weakness. The former exacerbates volatility. The latter calms volatility.

Volume Areas: A structurally sound market will build on areas of high volume (HVNodes). Should the market trend for long periods of time, it will lack sound structure, identified as low volume areas (LVNodes). LVNodes denote directional conviction and ought to offer support on any test. 

If participants were to auction and find acceptance into areas of prior low volume (LVNodes), then future discovery ought to be volatile and quick as participants look to HVNodes for favorable entry or exit.

POCs: POCs are valuable as they denote areas where two-sided trade was most prevalent in a prior day session. Participants will respond to future tests of value as they offer favorable entry and exit.

News And Analysis

Megacap tech selloff hits $500B since Nasdaq 100 peak. 

Fintech SPACs pick up as revenue clarity allays concern.

J&J said a second COVID shot boosts protection to 94%.

Wall Street’s message on Evergrande: China has control.

What People Are Saying

About

After years of self-education, strategy development, and trial-and-error, Renato Leonard Capelj began trading full-time and founded Physik Invest to detail his methods, research, and performance in the markets. 

Additionally, Capelj is a finance and technology reporter. Some of his biggest works include interviews with leaders such as John Chambers, founder and CEO, JC2 Ventures, Kevin O’Leary, businessman and Shark Tank host, Catherine Wood, CEO and CIO, ARK Invest, among others.

Disclaimer

At this time, Physik Invest does not manage outside capital and is not licensed. In no way should the materials herein be construed as advice. Derivatives carry a substantial risk of loss. All content is for informational purposes only.
Categories
Commentary

Weekly Brief For September 19, 2021

Editor’s Note: Late today. So sorry! The main takeaway is that we’re in a window of volatility and participants should focus on leveraging rich skew and complex spreads to hedge or speculate on sideways to lower trade.

Market Commentary

  • SPX below balance, 50-day SMA.
  • Ahead is a 2-day FOMC meeting.
  • Concerns around the debt ceiling.
  • Rich skew makes hedging easier.
  • Post OPEX volatility likely in play.

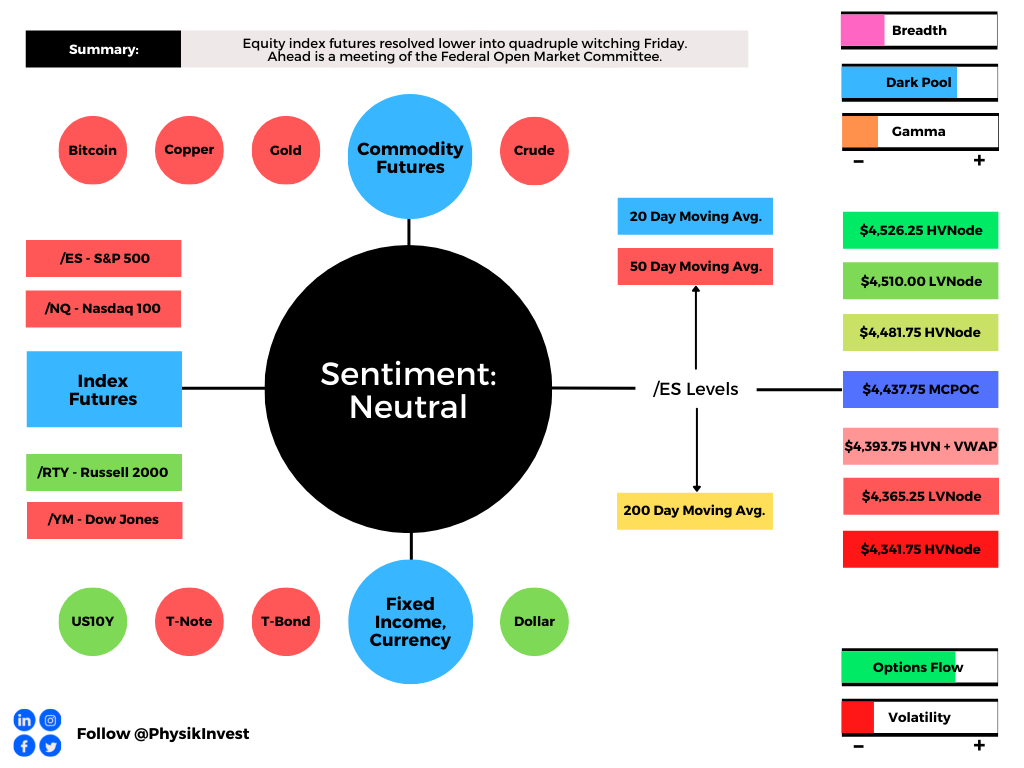
What Happened: U.S. stock index futures auctioned lower, last week, into Friday’s quadruple witching derivatives expiry. 

Of interest this week is a meeting of the Federal Open Market Committee (FOMC).

Graphic updated 5:30 PM ET Sunday. Sentiment Neutral if expected /ES open is inside of the prior day’s range. /ES levels are derived from the profile graphic at the bottom of the following section. SqueezeMetrics Dark Pool Index (DIX) and Gamma (GEX) calculations are based on where the prior day’s reading falls with respect to the MAX and MIN of all occurrences available. A higher DIX is bullish. At the same time, the lower the GEX, the more (expected) volatility. SHIFT data used for S&P 500 (INDEX: SPX) options activity. Note that options flow is sorted by the call premium spent; if more positive then more was spent on call options. Breadth reflects a reading of the prior day’s NYSE Advance/Decline indicator. VIX reflects a current reading of the CBOE Volatility Index (INDEX: VIX) from 0-100.

What To Expect: During the prior week’s trade, on weak breadth, the worst-case outcome occurred, evidenced by a balance-area breakout and separation of value below the S&P 500’s 50-day simple moving average (i.e., a visual level likely paid attention to by short-term, technically-driven market participants who generally are unable to defend retests).

Balance-Break Scenarios: A change in the market (i.e., the transition from two-time frame trade, or balance, to one-time frame trade, or trend) has occurred.

We now monitor for rejection (i.e., return inside of balance) which portends a move to the opposite end of the balance.

Further, the aforementioned trade is happening in the context of a waning economic recovery, heightened valuations in the face of strong EPS expectations, the prospects of stimulus reduction, non-seasonally aligned flows, impactful options and equity market dynamics, divergent sentiment, as well as fears of a mid-cycle transition.

In a Goldman Sachs Group Inc (NYSE: GS) note posted by The Market Ear, analysts “believe it is a critical period for many investors and companies that manage performance to calendar year-end. Such pressures boost volumes and volatility as investors observe earnings reports, analyst days and managements’ guidance for the following year.”

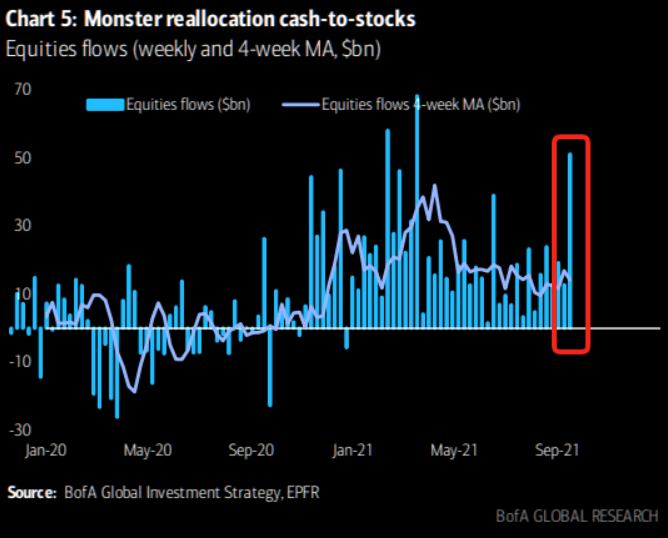
At the same time, inflows into equities are exploding to the upside as JPMorgan Chase & Co (NYSE: JPM) technicians “do not see a pattern on the [S&P 500] chart or any cross-market dynamics that would suggest the market is set for a lasting bearish reversal. The late-Aug systematic sell signals lose statistical significance into next week and the seasonal trends improve into early-Oct.”

Graphic: Bank of America Corporation (NYSE: BAC) charts equity flows, via The Market Ear.

That said, we hone in on risks.

If concerns like the debt ceiling are not resolved, some economists argue, according to Bloomberg, “that an announcement on tapering is likely to be delayed to December, and that Treasury yields could fall further as a result.”

We note that – as Goldman Sachs writes – “The upcoming debt limit deadline is beginning to look as risky as the 2011 debt limit showdown that led to Standard & Poor’s downgrade of the US sovereign rating and eventually to budget sequestration, or the 2013 deadline that overlapped with a government shutdown.”

On the other hand, according to SqueezeMetrics, “the current combination of weak put flows and large customer vanna exposure” is fragile; “people are [still] overexposed to changes in VIX, and will be hurt more than usual if VIX starts moving up. Historically, this means SPX down, VIX up.”

Following SqueezeMetrics’ remarks, SpotGamma adds that “over 50% of stocks [had] their largest gamma position” roll-off Friday. This suggests an increased potential for volatility heading into the September 21-22 FOMC event.

In this post-quad-witching window of non-strength, we may, as a result, use the rich skew to hedge (see below Weekly Trade Idea section).

Moreover, for today, given an increased potential for heightened volatility and initiative trade, participants may make use of the following frameworks.

In the best case, the S&P 500 trades sideways or higher; activity above the $4,437.75 micro-composite point of control (MCPOC) puts in play the $4,481.75 high volume area (HVNode). Initiative trade beyond the $4,481.75 HVNode could reach as high as the $4,510.00 low volume area (LVNode) and $4,526.25 HVNode, or higher.

In the worst case, the S&P 500 trades lower; activity below the $4,437.75 MCPOC puts in play the $4,393.75 HVNode. Initiative trade beyond the $4,393.75 HVNode could reach as low as the $4,365.25 LVNode and $4,341.00 untested point of control (VPOC), or lower.

We note that the $4,481.75 and $4,393.75 HVNodes intersect key anchored volume-weighted average price levels. These are metrics highly regarded by chief investment officers, among other participants, for quality of trade. Additionally, liquidity algorithms are benchmarked and programmed to buy and sell around VWAPs.

Graphic: 4-hour profile chart of the Micro E-mini S&P 500 Futures updated 5:30 PM ET Sunday.

Key Definitions

Volume Areas: A structurally sound market will build on areas of high volume (HVNodes). Should the market trend for long periods of time, it will lack sound structure, identified as low volume areas (LVNodes). LVNodes denote directional conviction and ought to offer support on any test. 

If participants were to auction and find acceptance into areas of prior low volume (LVNodes), then future discovery ought to be volatile and quick as participants look to HVNodes for favorable entry or exit.

POCs: POCs are valuable as they denote areas where two-sided trade was most prevalent in a prior day session. Participants will respond to future tests of value as they offer favorable entry and exit.

MCPOCs: POCs are valuable as they denote areas where two-sided trade was most prevalent over numerous day sessions. Participants will respond to future tests of value as they offer favorable entry and exit.

Weekly Trade Idea

Please Note: In no way is the below a trade recommendation. Derivatives carry a substantial risk of loss. All content is for informational purposes only.

Options offer an efficient way to gain directional exposure. 

If an option buyer was short (long) stock, he or she could buy a call (put) to hedge upside (downside) exposure. Additionally, one can spread, or buy (+) and sell (-) options together, strategically.

Commonly discussed spreads include credit, debit, ratio, back, and calendar.

  • Credit: Sell -1 option closer to the money. Buy +1 option farther out of the money.
  • Debit: Buy +1 option closer to the money. Sell -1 option farther out of the money.
  • Ratio: Buy +1 option closer to the money. Sell -2 options farther out of the money. 
  • Back: Sell -1 option closer to the money. Buy +2 options farther out of the money.
  • Calendar: Sell -1 option. Buy +1 option farther out in time, at the same strike.

Typically, if bullish (bearish), sell at-the-money put (call) credit spread and/or buy a call (put) debit/ratio spread structured around target price. Alternatively, if the expected directional move is great (small), opt for a back spread (calendar spread). Also, if credit spread, capture 50-75% of the premium collected. If debit spread, capture 2-300% of the premium paid.

Be cognizant of risk exposure to direction (delta), time (theta), and volatility (vega). 

  • Negative (positive) delta = synthetic short (long). 
  • Negative (positive) theta = time decay hurts (helps).
  • Negative (positive) vega = volatility hurts (helps).

Trade Idea: SELL -1 1/2 BACKRATIO SPX 100 (Weeklys) 29 SEP 21 4400/4300 PUT @.65 CREDIT LMT

I’m neutral to bearish on the S&P 500 and I think the index may slide toward $4,300. I will structure a spread below the current index price, expiring in about 2 weeks. I will buy the 4400 put option once (+1) and sell the 4300 put option twice (-2) for a $0.65 credit. Should the index not move to my target, I keep the $65 credit. Should it move to $4,300, I could make $10,065.00 at expiry. Should the index move past $4,200.00 or so, I may incur unlimited losses. My goal, with this spread, is to capture the initial credit and close for additional credit if the index moves lower. 

If necessary, I will hedge the position by either (A) selling futures, (B) widening strikes, (C) buying a far out-of-the-money put option to cap downside in case of an unpredictable move lower, or (D) roll strikes down in price and out in time.

News And Analysis

An essay on why you keep losing money as a trader.

August retail sales reflect strong consumer demand.

UBS: Resist temptation to time market despite highs.

U.S. debt ceiling fight could cause markets to tumble.

Nasdaq on whether Rule 605 works better in dollars.

Rally driven less by reflation prospects; TINA to stock.

Higher U.S. CGT proposal spurs a PE and M&A rush.

If a CEO talks like Kant, think twice before investing.

New vehicle prices surge amid global chip shortages.

Active managers’ performance disappointing in 2021.

DeFi is disrupting but not derailing traditional finance.

OpenSea admitted recent incident as insider trading.

SEC looks to greater oversight of the crypto markets.

Central bank digital currency; cash for the digital age.

White House to put forward three CFTC nominations.

Some key lessons from NYC’s first SALT conference. 

Let’s Hang Out

Salt Lake City, UT September 28-30

About

After years of self-education, strategy development, and trial-and-error, Renato Leonard Capelj began trading full-time and founded Physik Invest to detail his methods, research, and performance in the markets. 

Additionally, Capelj is a finance and technology reporter. Some of his biggest works include interviews with leaders such as John Chambers, founder and CEO, JC2 Ventures, Kevin O’Leary, businessman and Shark Tank host, Catherine Wood, CEO and CIO, ARK Invest, among others.

Disclaimer

At this time, Physik Invest does not manage outside capital and is not licensed. In no way should the materials herein be construed as advice. Derivatives carry a substantial risk of loss. All content is for informational purposes only.

Categories
Commentary

Weekly Brief For September 12, 2021

Editor’s Note: Keeping it light today; the main takeaway is that we’re in a window of volatility and participants should maintain a cautiously bullish stance, for the time being. Skew makes it so we can hedge for little-to-no cost using complex spreads (more on this below).

Please note that levels in the below graphics should only be relied upon as rough areas of resistance and support due to the December contract roll. Updated levels to come later this week, after daily commentaries resume Thursday, September 16.

Thank you and take care!

Market Commentary

Equity index futures trade lower, last week, resolving a multi-week consolidation area.

  • Narratives around slower recovery rising.
  • Equity indices falling; SPX above 50-day.
  • Positioning risks mount case for volatility.
  • A couple trade ideas for the week ahead.

What Happened: U.S. stock index futures resolved lower, last week, alongside the evolution of some important dynamics with respect to the pace of the pandemic recovery and trend growth, non-seasonally aligned flows and positioning risks, as well as divergent sentiment. 

Of interest this week is data on the consumer price index, industrial production, retail sales, and some Fed manufacturing surveys. 

Graphic updated 12:00 PM ET Saturday. Sentiment Neutral if expected /ES open is inside of the prior day’s range. SqueezeMetrics Dark Pool Index (DIX) and Gamma (GEX) calculations are based on where the prior day’s reading falls with respect to the MAX and MIN of all occurrences available. A higher DIX is bullish. At the same time, the lower the GEX, the more (expected) volatility. SHIFT data used for S&P 500 (INDEX: SPX) options activity approximation. Note that options flow is sorted by the call premium spent; if more positive then more was spent on call options. Breadth reflects a reading of the prior day’s NYSE Advance/Decline indicator. VIX reflects a current reading of the CBOE Volatility Index (INDEX: VIX) from 0-100.

What To Expect: During the prior week’s regular trade, on weak intraday breadth and mostly divergent market liquidity metrics, the worst-case outcome occurred, evidenced by trade below a key micro-composite high volume area (HVNode). 

This activity resolved a multi-week consolidation area (ie., balance). 

Volume Areas: A structurally sound market will build on past areas of high volume. Should the market trend for long periods of time, it will lack sound structure (identified as a low volume area which denotes directional conviction and ought to offer support on any test). 

If participants were to auction and find acceptance into areas of prior low volume, then future discovery ought to be volatile and quick as participants look to areas of high volume for favorable entry or exit.

Balance (Two-Timeframe Or Bracket): Rotational trade that denotes current prices offer favorable entry and exit. Balance-areas make it easy to spot a change in the market (i.e., the transition from two-time frame trade, or balance, to one-time frame trade, or trend). 

Modus operandi is responsive trade (i.e., fade the edges), rather than initiative trade (i.e., play the break).

To note, initially, participants had a tough time separating value and expanding range lower. 

This was evidenced by the minimal excess at Wednesday’s regular trade low (RTH Low), coupled with Thursday’s overnight response at the 20-day simple moving average (i.e., a visual level likely paid attention to by short-term, technically-driven market participants who generally are unable to defend retests). 

Graphic: S&P 500 loses the 20-day simple moving average. A loss of that level officially changes the tone; “We maintain a cautiously bullish stance.”

Given that action – the difficulty participants had in moving prices out and away from balance – the path of least resistance was not down; stronger sellers were not yet on board, I explained

Excess: A proper end to price discovery; the market travels too far while advertising prices. Responsive, other-timeframe (OTF) participants aggressively enter the market, leaving tails or gaps which denote unfair prices.

Value-Area Placement: Perception of value unchanged if value overlapping (i.e., inside day). Perception of value has changed if value not overlapping (i.e., outside day). Delay trade in the former case.
Graphic: 30-minute profile chart of the Micro E-mini S&P 500 Futures and market liquidity, via Bookmap, for the SPDR S&P 500 ETF Trust (NYSE: SPY) coming into Thursday’s regular trade. Notice the cumulative volume delta (CVD) or buying and selling power as calculated by the difference in volume traded at the bid and offer. So, coming into Friday’s trade, stronger sellers were likely not yet on board.

The tone changed Friday when selling intensified; the 20-day simple moving average was lost and the S&P 500 closed the session on a spike lower, away from value.

Spike Rules In Play: Spike’s mark the beginning of a break from value. Spikes higher (lower) are validated by trade at or above (below) the spike base (i.e., the origin of the spike). 

Further, the aforementioned trade is happening in the context of peak growth and a moderation in the economic recovery, heightened valuations, the prospects of stimulus reduction, as well as non-seasonally aligned inflows, impactful options market dynamics, divergent sentiment, and fears of a mid-cycle transition.

The implications of these themes on price are contradictory

To elaborate, Morgan Stanley (NYSE: MS), Citigroup Inc (NYSE: C), and Goldman Sachs Group Inc (NYSE: GS) cautioned investors about equity outlooks. Of concern, in particular, is a rise in cases of the delta variant, tensions between inflation expectations and yields, as well as seasonality. 

Among other risks, as SpotGamma notes, “markets are fast approaching a window of volatility which could produce some pretty sharp volatility: 9/15 VIX expiration, 9/17 Quarterly OPEX and the 9/22 FOMC. This lineup is particularly interesting as we believe that expiration leads to a pickup in volatility.” Read more on SpotGamma’s perspectives, here

Graphic: @pat_hennessy breaks down returns for the S&P 500, categorized by the week relative to OPEX. Based on his analysis, Pat sees that the “2 weeks prior to OPEX (e.g., 7/30/21 to 8/6/21 in this late-cycle) [have] been extremely bullish,” while “OPEX week returns peaked in 2016 and have trended lower since.”

SqueezeMetrics – which saw “the current combination of weak put flows and large customer vanna exposure” as fragile – echoes the risks of volatility adding “people are overexposed to changes in VIX, and will be hurt more than usual if VIX starts moving up. Historically, this means SPX down, VIX up.”

Moreover, for early trade next week, given an increased potential for heightened volatility and Friday’s end-of-day spike from value, participants may make use of the following framework.

If participants manage to find acceptance (i.e., spend multiple hours of trade) above the $4,467.00 spike base, then the odds of downside follow-through are lower. We’d look to maintain a cautiously bullish stance.

On the other hand, should participants have trouble maintaining prices above the $4,467.00 spike base, then the focus ought to be on big-picture risk management levels like the August 19, 2021 swing low and 50-day simple moving average.

Graphic: 65-minute profile chart of the Micro E-mini S&P 500 Futures updated 12:00 PM ET Saturday. Note that the roll to the December contract occurred on September 9, 2021. Therefore, levels in the above graphic should only be relied upon as rough areas of resistance and support. Updated levels to come Thursday, September 16, 2021.

Weekly Trade Idea

Please Note: In no way is the below a trade recommendation. Derivatives carry a substantial risk of loss. All content is for informational purposes only.
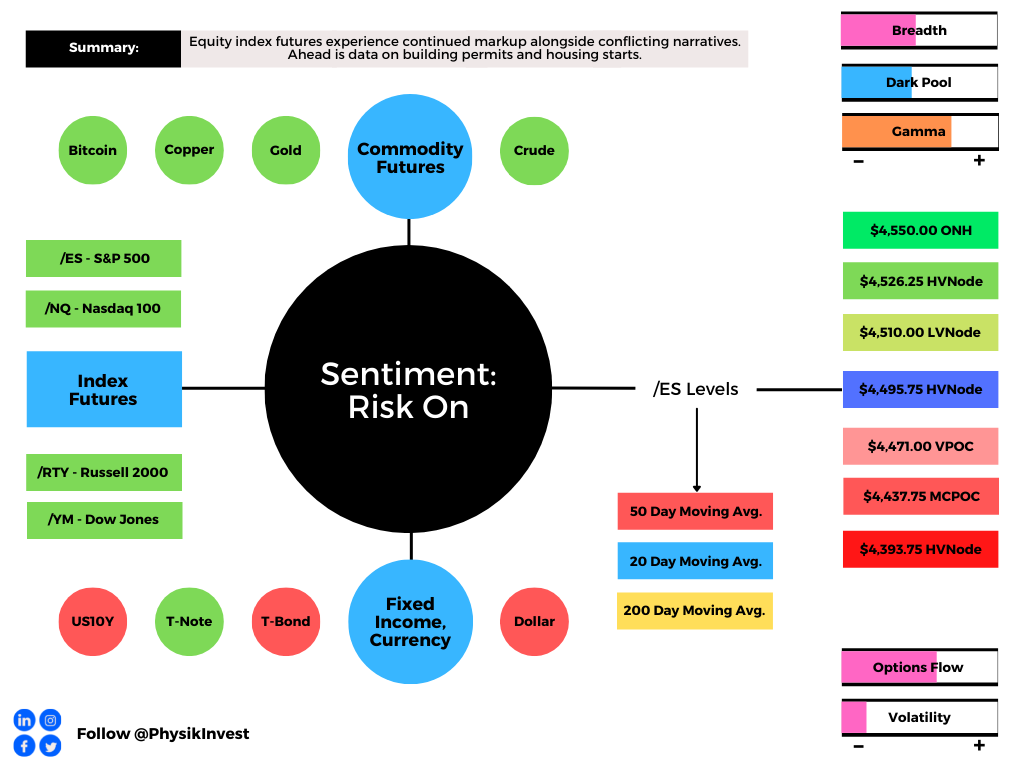
Options offer an efficient way to gain directional exposure. 

If an option buyer was short (long) stock, he or she could buy a call (put) to hedge upside (downside) exposure. Additionally, one can spread, or buy (+) and sell (-) options together, strategically.
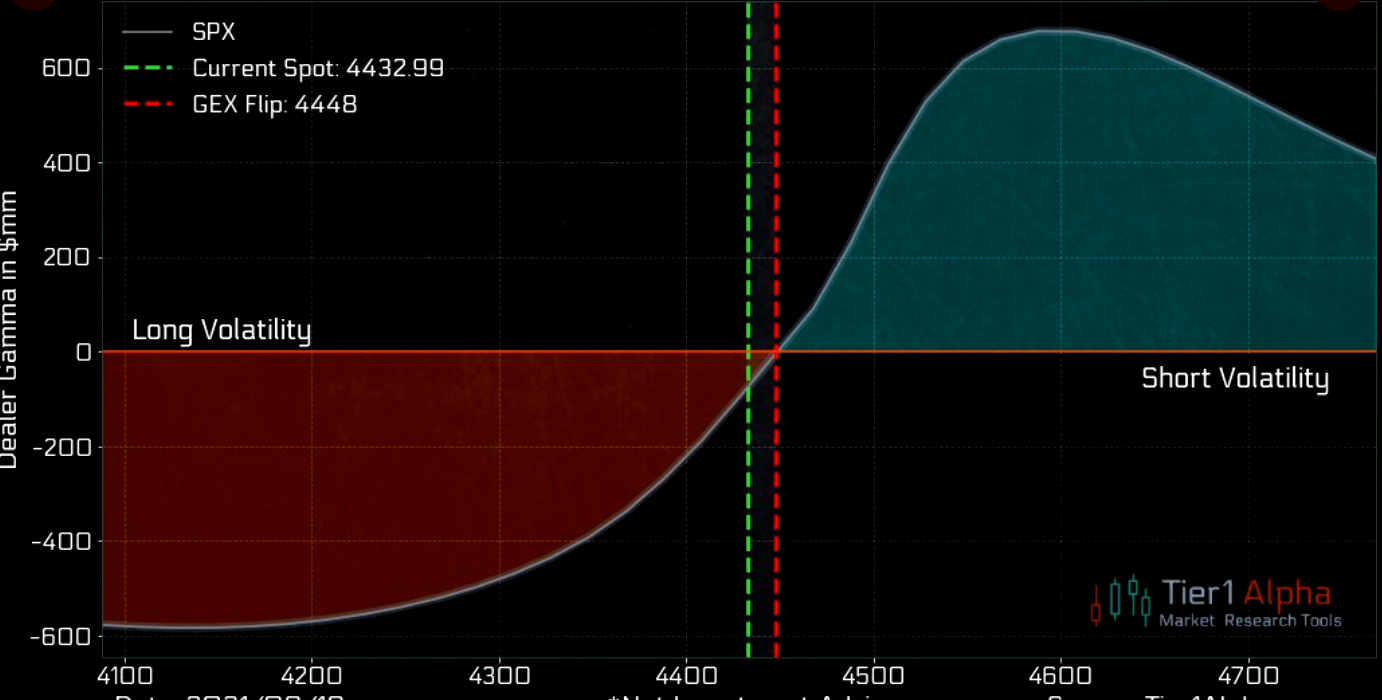
Commonly discussed spreads include credit, debit, ratio, back, and calendar.

  • Credit: Sell -1 option closer to the money. Buy +1 option farther out of the money.
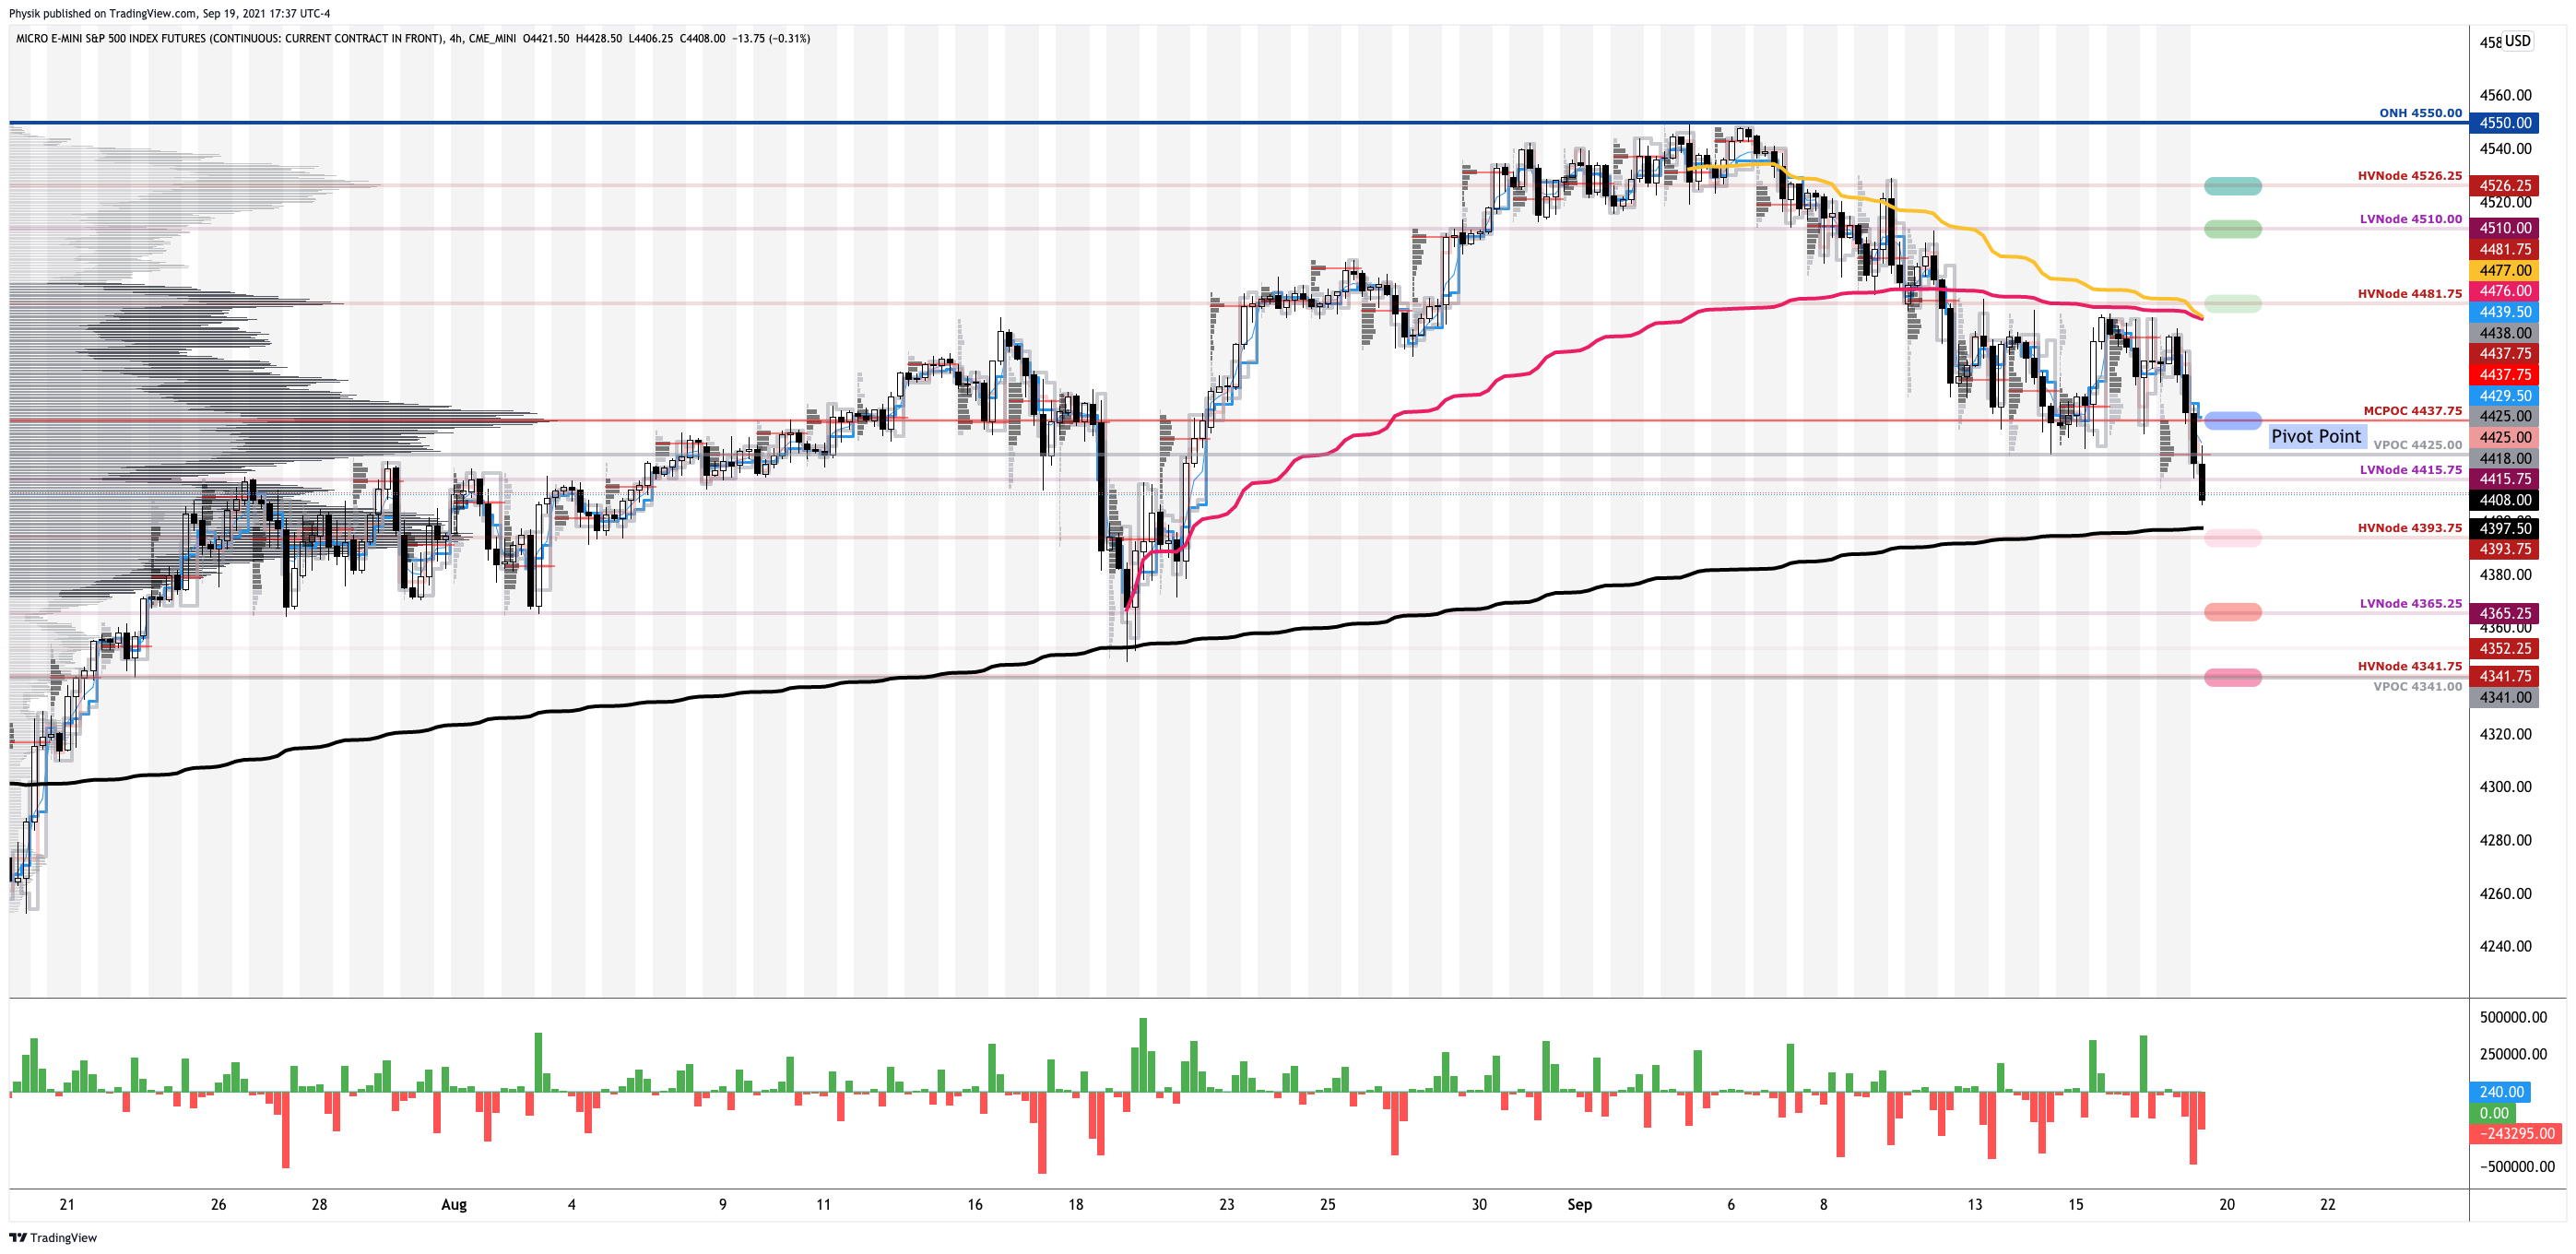
  • Debit: Buy +1 option closer to the money. Sell -1 option farther out of the money.
  • Ratio: Buy +1 option closer to the money. Sell -2 options farther out of the money. 
  • Back: Sell -1 option closer to the money. Buy +2 options farther out of the money.
  • Calendar: Sell -1 option. Buy +1 option farther out in time, at the same strike.

Typically, if bullish (bearish), sell at-the-money put (call) credit spread and/or buy a call (put) debit/ratio spread structured around target price. Alternatively, if the expected directional move is great (small), opt for a back spread (calendar spread). Also, if credit spread, capture 50-75% of the premium collected. If debit spread, capture 2-300% of the premium paid.

Be cognizant of risk exposure to direction (delta), time (theta), and volatility (vega). 

  • Negative (positive) delta = synthetic short (long). 
  • Negative (positive) theta = time decay hurts (helps).
  • Negative (positive) vega = volatility hurts (helps).

Trade Idea 1: SELL -1 1/2 BACKRATIO SPX 100 (Weeklys) 17 SEP 21 4350/4250 PUT @3.80 LMT

I’m neutral-to-bearish on the S&P 500 and I think the index may travel sideways to lower over the next week, past its key moving averages. I will structure a spread below the current index price, expiring in 1 week. I will buy the 4350 put option once (+1) and sell the 4250 put option twice (-2) for a $3.80 credit. Should the index not move to my target, I keep the $380 credit. Should it move to $4,250.00, past the 50-day simple moving average, I could make $10,380.00 at expiry. Should the index move past $4,150.00 or so, I may incur unlimited losses. My goal, with this spread, is to capture the initial credit and close for additional credit if the index moves lower.

If necessary, I will hedge the position by either (A) selling futures, (B) widening strikes, (C) buying a far out-of-the-money put option to cap downside in case of an unpredictable move lower, or (D) roll strikes down in price and out in time.

Trade Idea 2: SELL -1 1/2 BACKRATIO GOOGL 100 17 SEP 21 2775/2700 PUT @.90 LMT

I’m neutral-to-bearish on Alphabet Inc and I think the stock may travel sideways to lower over the next week, past its key moving averages. I will structure a spread below the current stock price, expiring in 1 week. I will buy the 2775 put option once (+1) and sell the 2700 put option twice (-2) for a $0.90 credit. Should the stock not move to my target, I keep the $90 credit. Should it move to $2,700.00, toward the 50-day simple moving average, I could make $7,500.00 at expiry. Should the stock move past $2,625.00 or so, I may incur unlimited losses. My goal, with this spread, is to capture the initial credit and close for additional credit if the stock moves lower.

If necessary, I will hedge the position by either (A) selling stock, (B) widening strikes, (C) buying a far out-of-the-money put option to cap downside in case of an unpredictable move lower, or (D) roll strikes down in price and out in time.

News And Analysis

Lenders continue to expect falling profits, refinancing demand.

Manchin seeing delay in Congress for vote on Biden’s agenda.

Massive decline in forbearances, down nearly 67% from peak. 

Oil prices continuing to fall as pandemic worries slow demand.

Moody’s: Democrats are at a fork in the road, may not take it.

COVID-19 and China risks won’t pass for years, some project.

Nasdaq talks market infrastructure, the real trends in volumes.

Bonds turning hot; European Central Bank redefines tapering.

What People Are Saying

Let’s Hang Out

Los Angeles, CA September 10-12

New York, NY September 12-15

Salt Lake City, UT September 28-30

About

After years of self-education, strategy development, and trial-and-error, Renato Leonard Capelj began trading full-time and founded Physik Invest to detail his methods, research, and performance in the markets. 

Additionally, Capelj is a finance and technology reporter. Some of his biggest works include interviews with leaders such as John Chambers, founder and CEO, JC2 Ventures, Kevin O’Leary, businessman and Shark Tank host, Catherine Wood, CEO and CIO, ARK Invest, among others.

Disclaimer

At this time, Physik Invest does not manage outside capital and is not licensed. In no way should the materials herein be construed as advice. Derivatives carry a substantial risk of loss. All content is for informational purposes only.