Editor’s Note: Daily market commentaries to pause until Thursday, September 16, 2021, due to travel commitments. A weekend commentary will be in your inbox earlier this week.
All the best,
Renato
Market Commentary
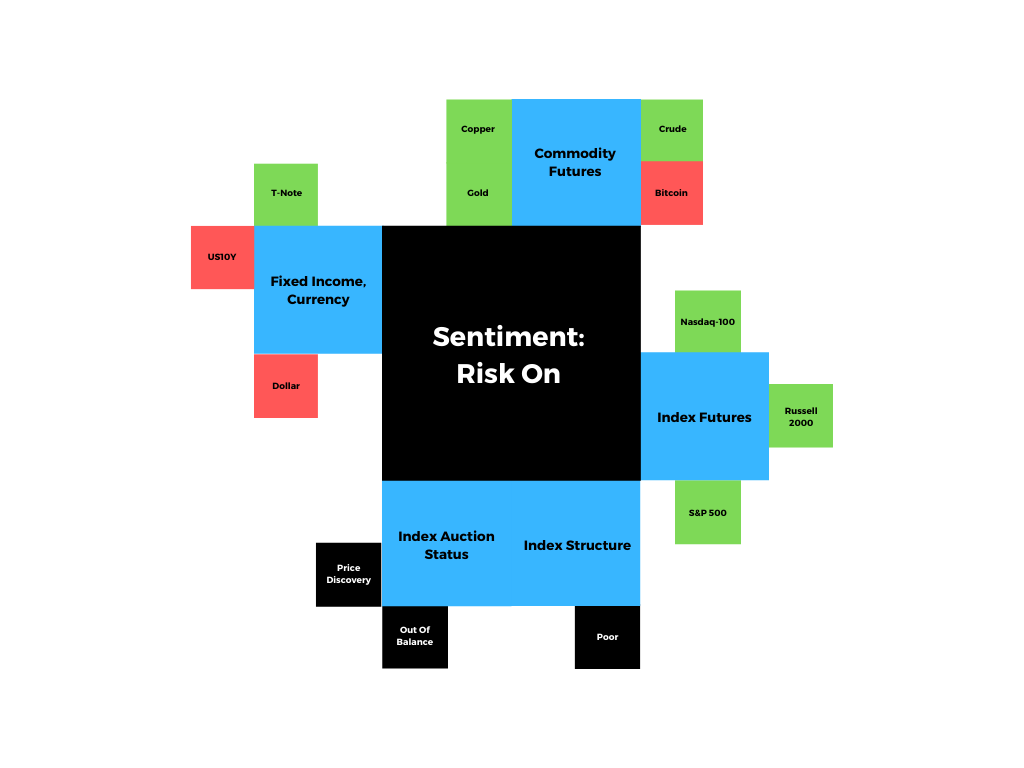
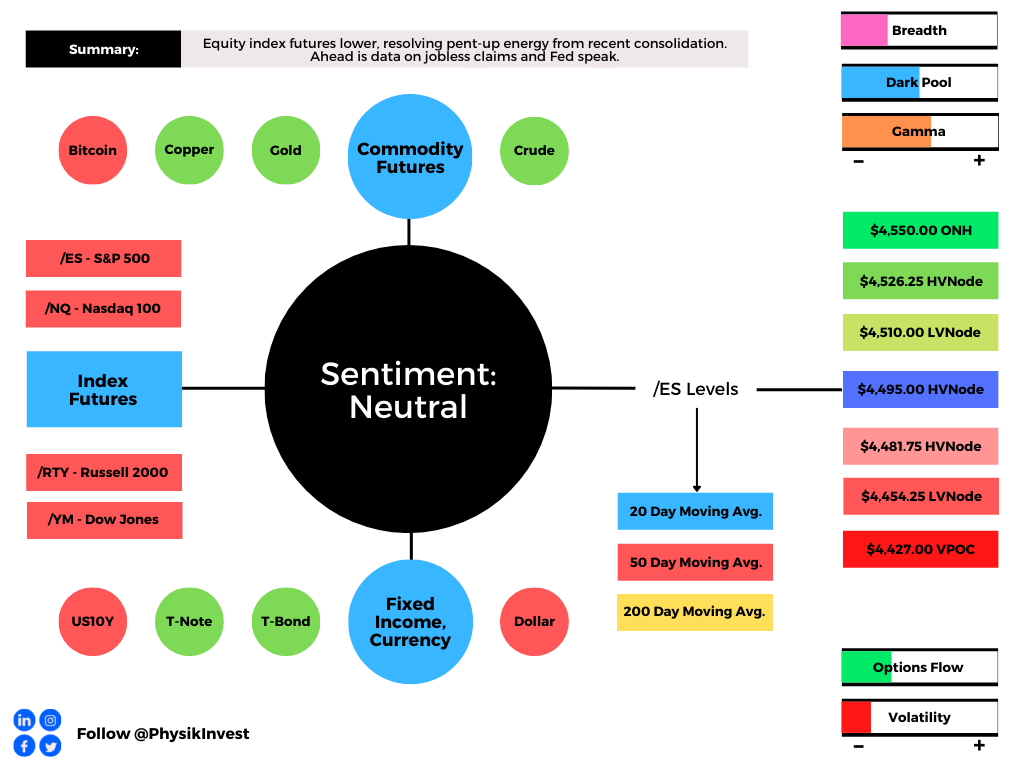
Equity index futures trade lower with yields, dollar, and bitcoin. Most commodities were green.
- Narratives around slower recovery rising.
- Ahead is jobless claims data, Fed speak.
- Positioning risks mounting case for lower.
What Happened: U.S. stock index futures auctioned lower overnight alongside narratives surrounding a slowed economic recovery and stimulus reductions.
Ahead is data on jobless claims (8:30 AM ET), as well as Fed-speak by Bowman (1:00 PM ET) and Williams (2:00 PM ET).
What To Expect: As of 6:30 AM ET, Thursday’s regular session (9:30 AM – 4:00 PM EST) in the S&P 500 will likely open inside of prior-range and -value, suggesting a limited potential for immediate directional opportunity.
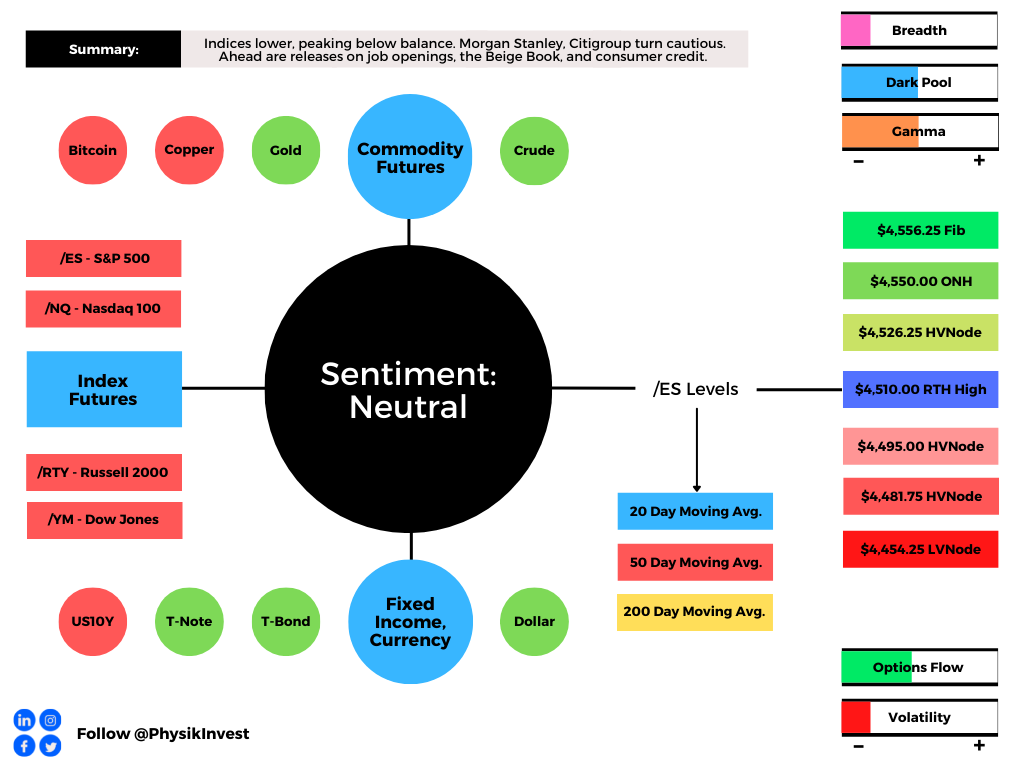
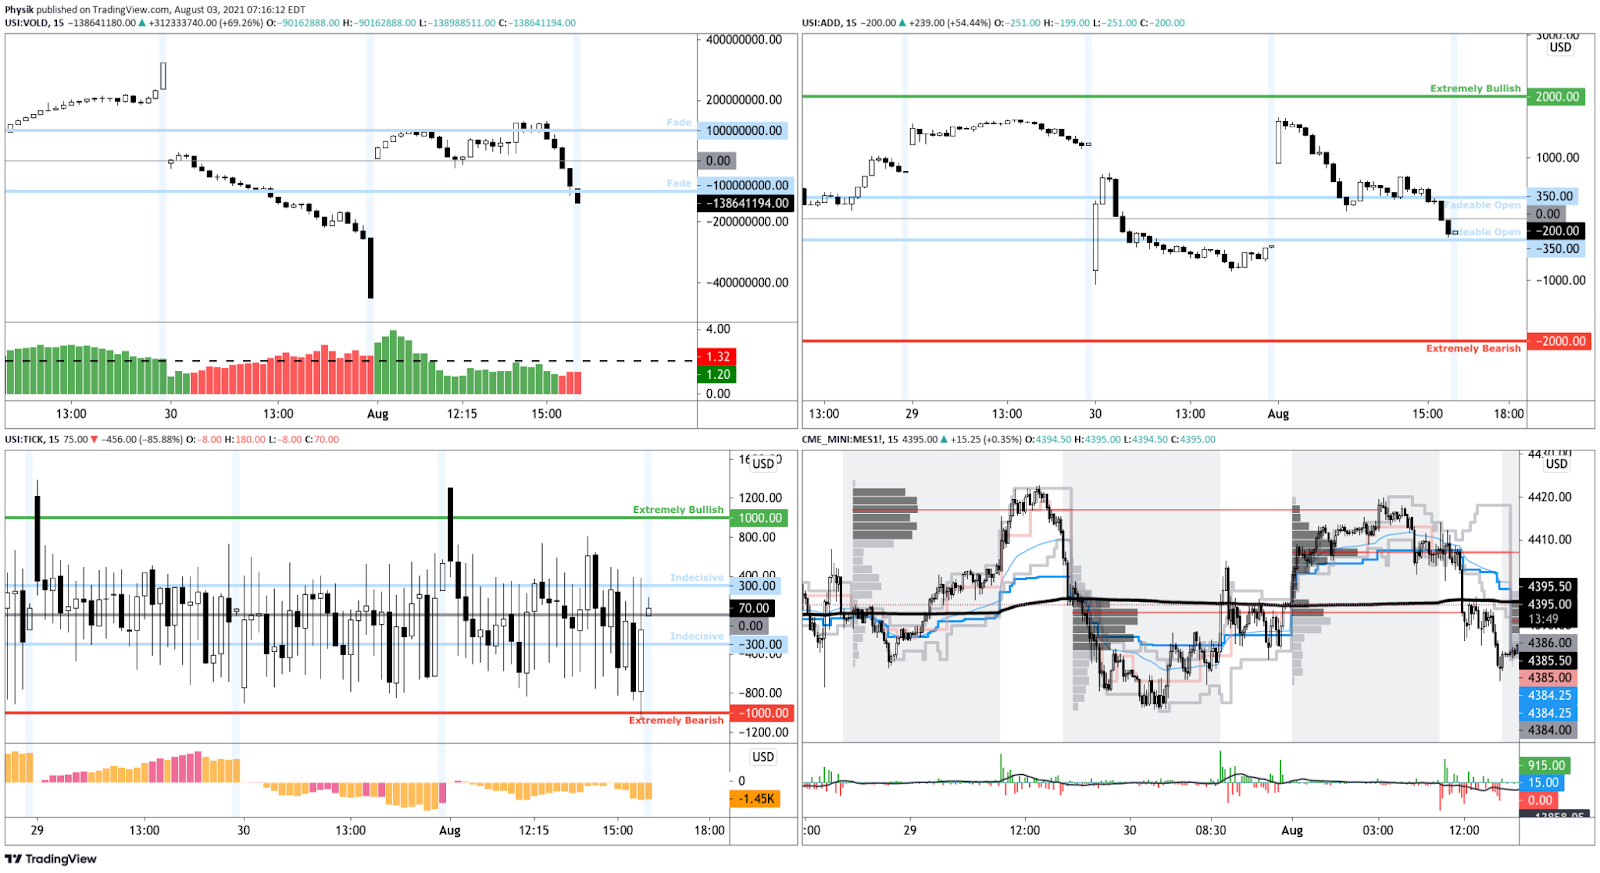
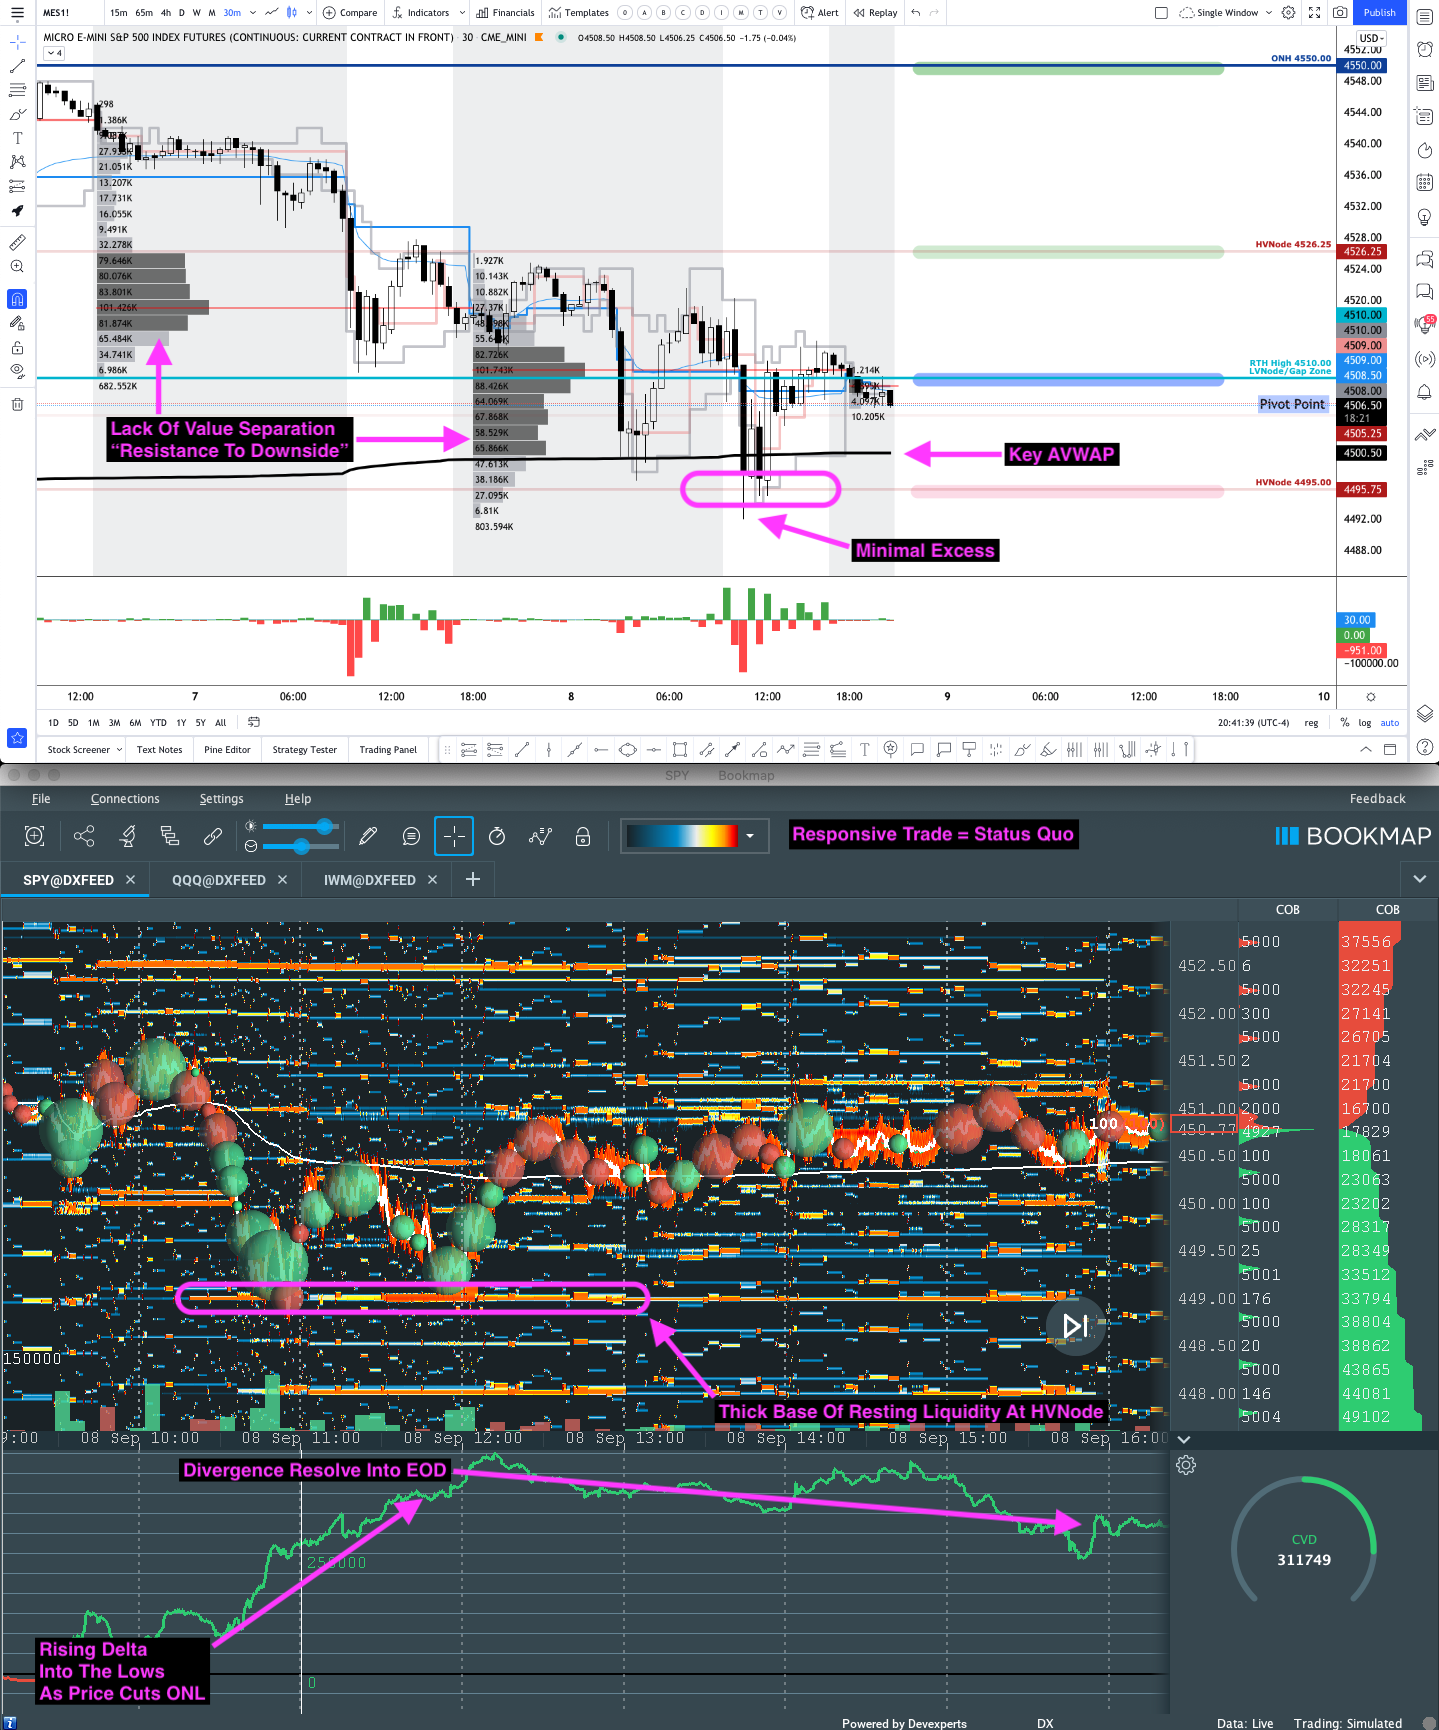
Adding, during the prior day’s regular trade, on weak intraday breadth and divergent market liquidity metrics, the best case outcome occurred, evidenced by sideways trade at the $4,510.00 pivot, the low end of a recent consolidation (i.e., balance) area.
Balance (Two-Timeframe Or Bracket): Rotational trade that denotes current prices offer favorable entry and exit. Balance-areas make it easy to spot a change in the market (i.e., the transition from two-time frame trade, or balance, to one-time frame trade, or trend).

Modus operandi is responsive trade (i.e., fade the edges), rather than initiative trade (i.e., play the break).
To note, participants had a tough time separating value and expanding range lower.
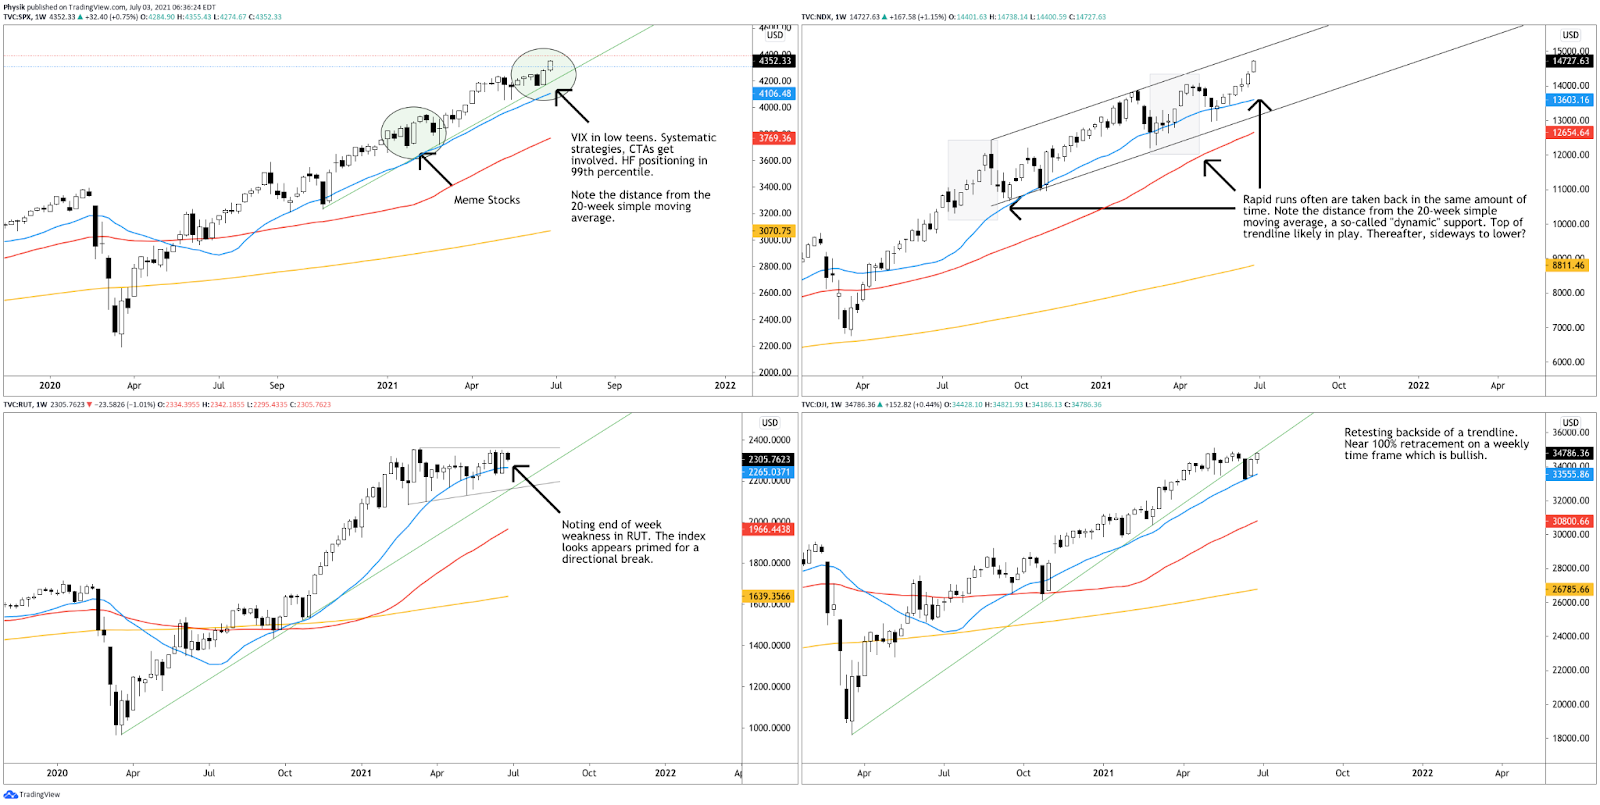
This is evidenced by the minimal excess at yesterday’s regular trade low (RTH Low), coupled with an overnight response at the 20-day simple moving average (i.e., a visual level likely paid attention to by short-term, technically-driven market participants).
In other words, we’re carrying forward the difficulty participants had, in days prior, to moving prices out and away from balance. The path of least resistance – at least in prior trade – was not down; stronger sellers are not yet on board.
Excess: A proper end to price discovery; the market travels too far while advertising prices. Responsive, other-timeframe (OTF) participants aggressively enter the market, leaving tails or gaps which denote unfair prices.

Value-Area Placement: Perception of value unchanged if value overlapping. Perception of value has changed if value not overlapping (i.e., outside day). Delay action in the former case.
Balance-Break Scenarios In Play: A change in the market (i.e., the transition from two-time frame trade, or balance, to one-time frame trade, or trend) has occurred.

Though we expect sideways to lower trade – for the time being – we monitor for rejection (i.e., return inside of balance) which portends a move higher, to the opposite end of the balance.
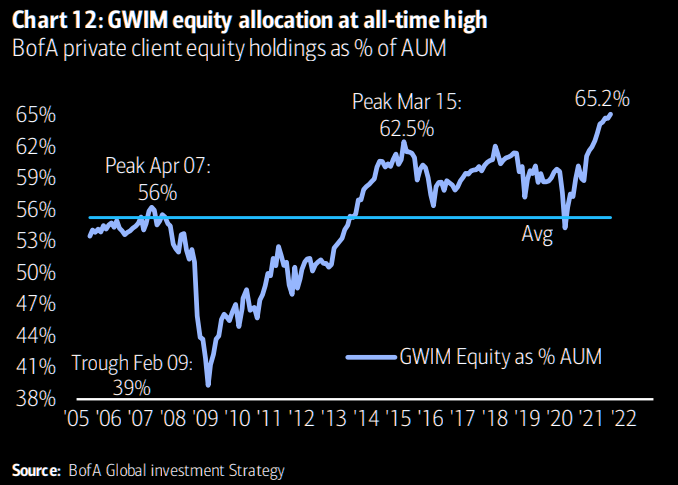
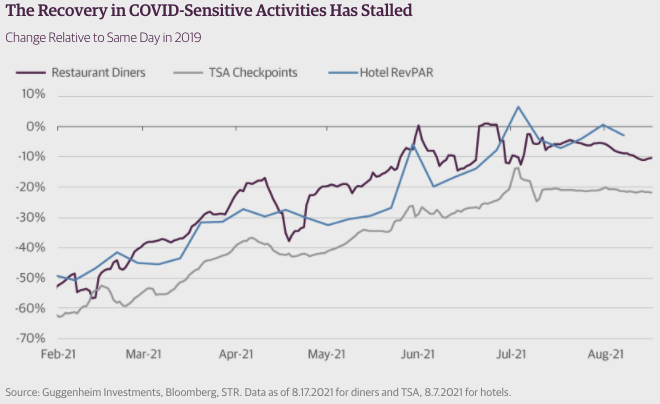
Further, the aforementioned trade is happening in the context of peak growth and a moderation in the economic recovery, as well as non-seasonally aligned inflows, impactful options market dynamics, divergent sentiment, and fears of a mid-cycle transition.
The implications of these themes on price are contradictory.
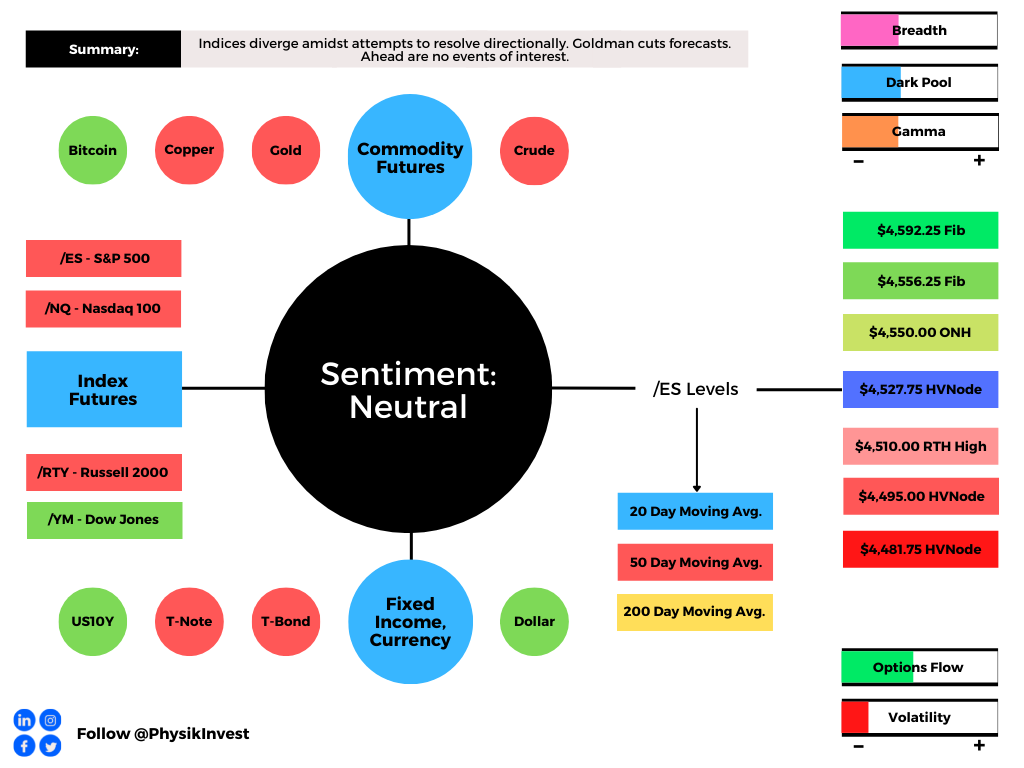
To elaborate, Morgan Stanley (NYSE: MS), Citigroup Inc (NYSE: C), and Goldman Sachs Group Inc (NYSE: GS) cautioned investors about equity outlooks. Of concern, in particular, is a rise in cases of the delta variant, tensions between inflation expectations and yields, as well as seasonality.
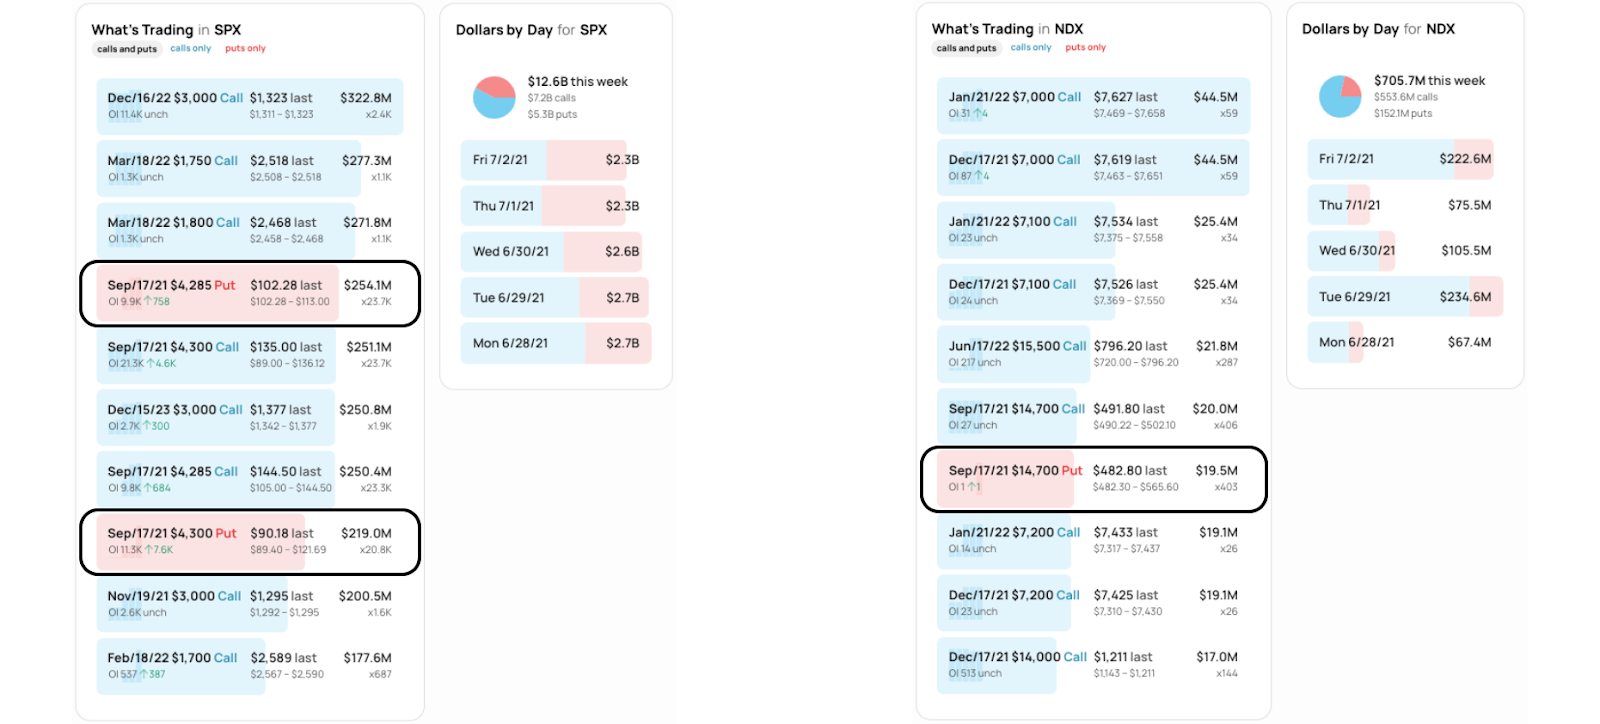
Among other risks, as SqueezeMetrics summarizes, “[p]eople pretty much stopped buying S&P 500 puts [last] week. At the same time, people are overexposed to changes in VIX, and will be hurt more than usual if VIX starts moving up. Historically, this means SPX down, VIX up.”
Moreover, for today, given an increased potential for moderate volatility and responsive trade, participants may make use of the following frameworks.
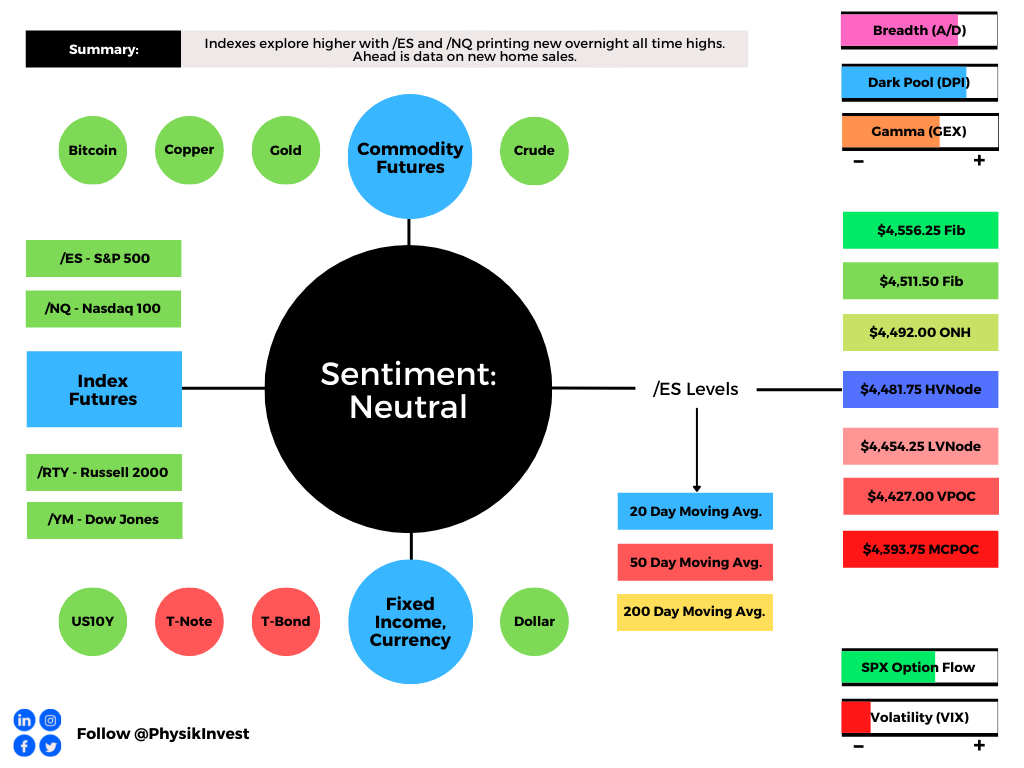
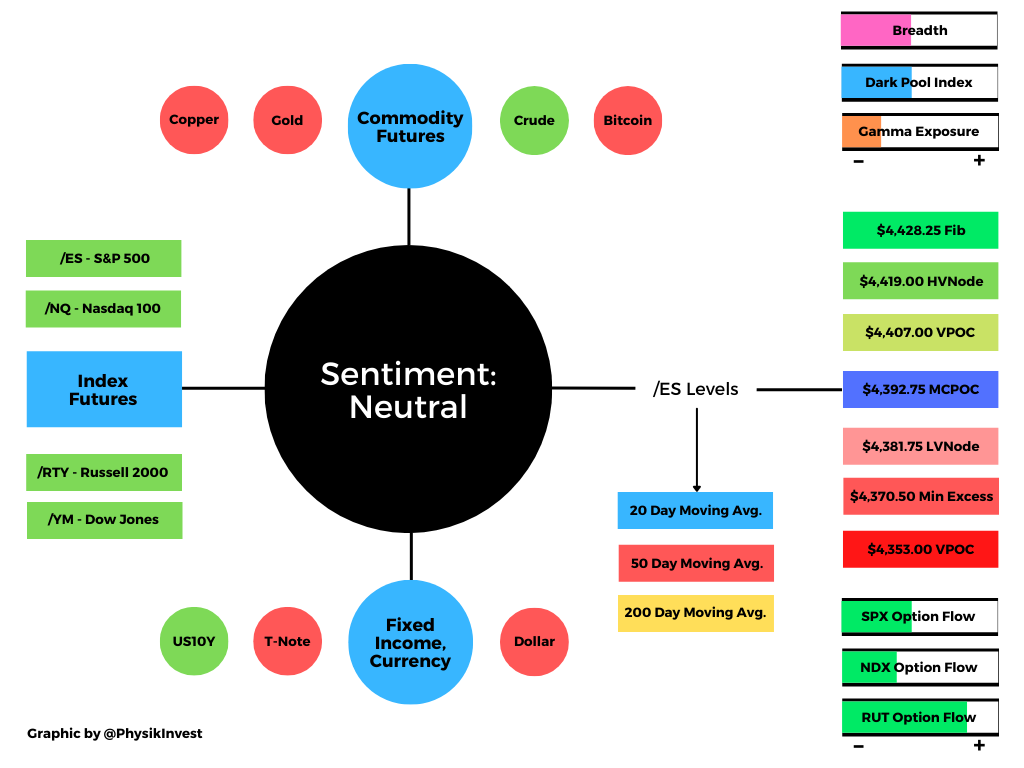
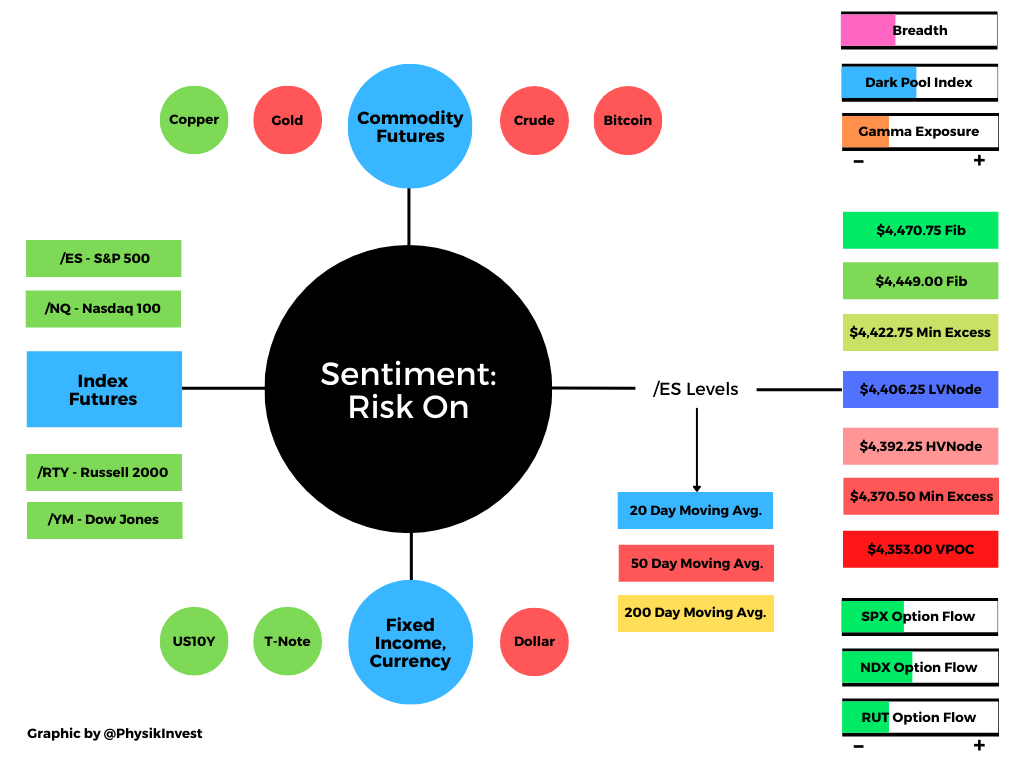
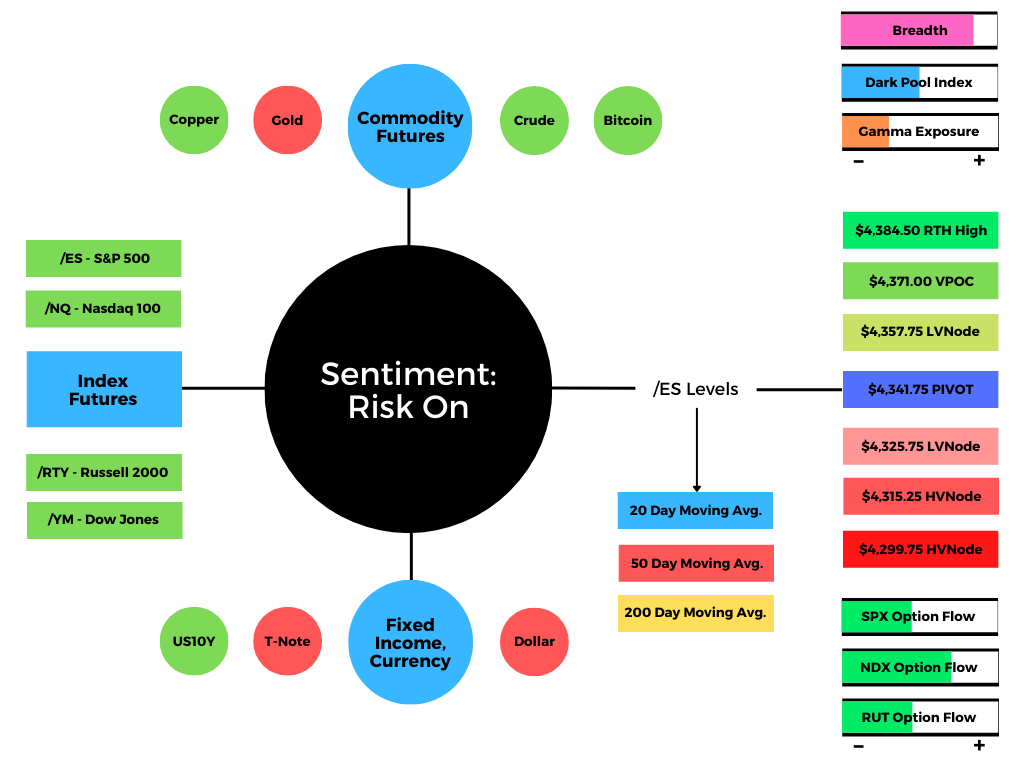
In the best case, the S&P 500 trades sideways or higher; activity above the $4,495.00 high volume area (HVNode) pivot puts in play the $4,510.00 low volume area (LVNode). Initiative trade beyond the LVNode could reach as high as the $4,526.25 HVNode and $4,550.00 overnight high (ONH).
In the worst case, the S&P 500 trades lower; activity below the $4,495.00 HVNode puts in play the $4,481.75 HVNode. Initiative trade beyond the $4,481.75 HVNode could reach as low as the $4,454.25 LVNode and $4,427.00 untested point of control (VPOC).
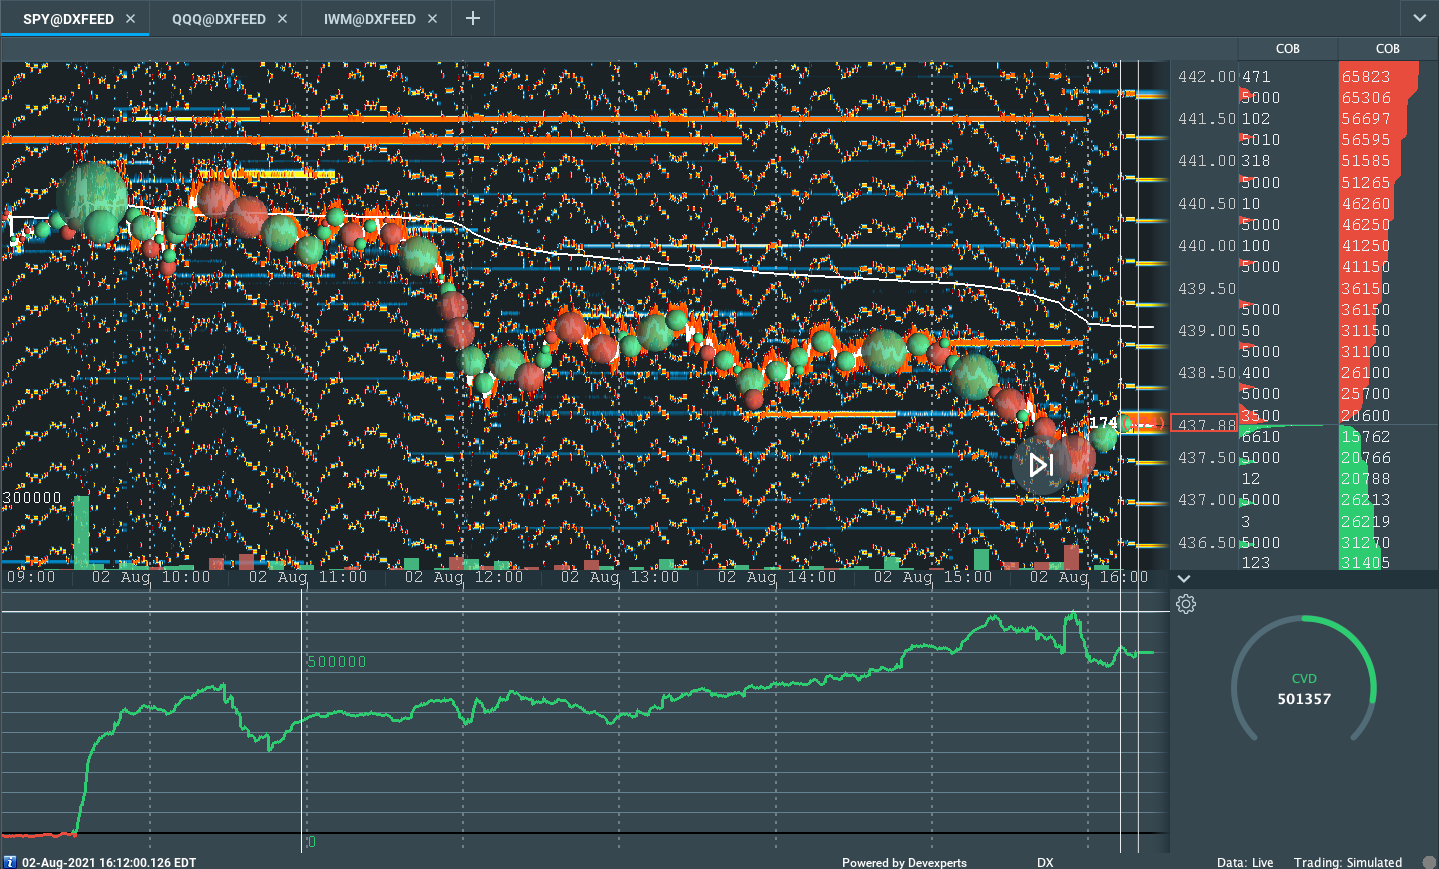
Note the developing volume-weighted average price (VWAP) pinch. VWAP is a metric highly regarded by chief investment officers, among other participants, for quality of trade. Additionally, liquidity algorithms are benchmarked and programmed to buy and sell around VWAPs. We look to buy above a flat/rising VWAP pinch. Sell below a flat/declining VWAP pinch.
Overnight Rally Highs (Lows): Typically, there is a low historical probability associated with overnight rally-highs (lows) ending the upside (downside) discovery process.

Volume Areas: A structurally sound market will build on past areas of high volume. Should the market trend for long periods of time, it will lack sound structure (identified as a low volume area which denotes directional conviction and ought to offer support on any test).

If participants were to auction and find acceptance into areas of prior low volume, then future discovery ought to be volatile and quick as participants look to areas of high volume for favorable entry or exit.

POCs: POCs are valuable as they denote areas where two-sided trade was most prevalent. Participants will respond to future tests of value as they offer favorable entry and exit.

News And Analysis
Traders rush to dump China tech stocks as gaming targeted again.
Decision Guide: The ECB counts risks in setting bond-buying pace.
Aluminum notches fresh 13-year high on supply woes and demand.
China’s zero-COVID approach will aggravate rising corporate risks.
Fauci: We don’t even have “modestly good control” over COVID-19.
Coinbase threat shows there’s a new cryptocurrency sheriff in town.
White House eyeing increased hacking around the coming holidays.
What People Are Saying
About
After years of self-education, strategy development, and trial-and-error, Renato Leonard Capelj began trading full-time and founded Physik Invest to detail his methods, research, and performance in the markets.
Additionally, Capelj is a finance and technology reporter. Some of his biggest works include interviews with leaders such as John Chambers, founder and CEO, JC2 Ventures, Kevin O’Leary, businessman and Shark Tank host, Catherine Wood, CEO and CIO, ARK Invest, among others.
Disclaimer
At this time, Physik Invest does not manage outside capital and is not licensed. In no way should the materials herein be construed as advice. Derivatives carry a substantial risk of loss. All content is for informational purposes only.