
What Happened
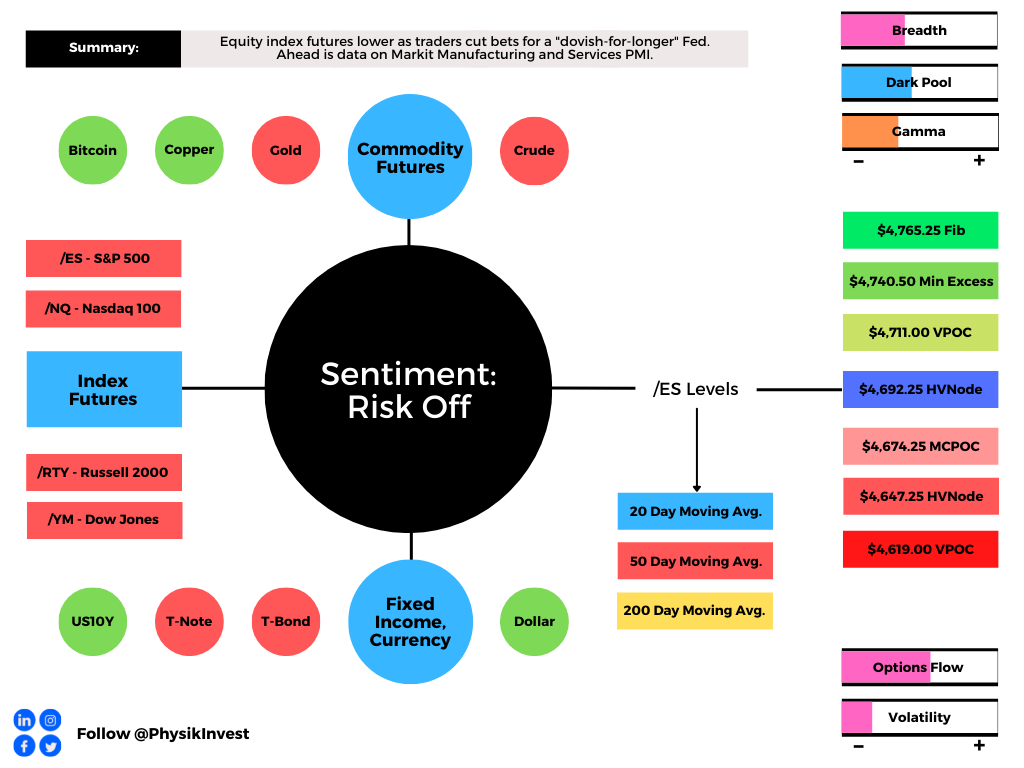
Overnight, yesterday’s knee-jerk sellers were emboldened by equity index futures auctioning sideways to lower with other products – from commodities to bonds – following suit.
The prevailing narrative is that “[I]nvestors are reducing expectations for a deeper dovish stance by the Fed after Powell got a second term.” Meaningless headlines, like this, are precisely why we, as participants, should opt to avoid making short-term decisions based on the news!
Anyways, ahead is data on Markit Manufacturing and Services PMI (9:45 AM ET).
What To Expect
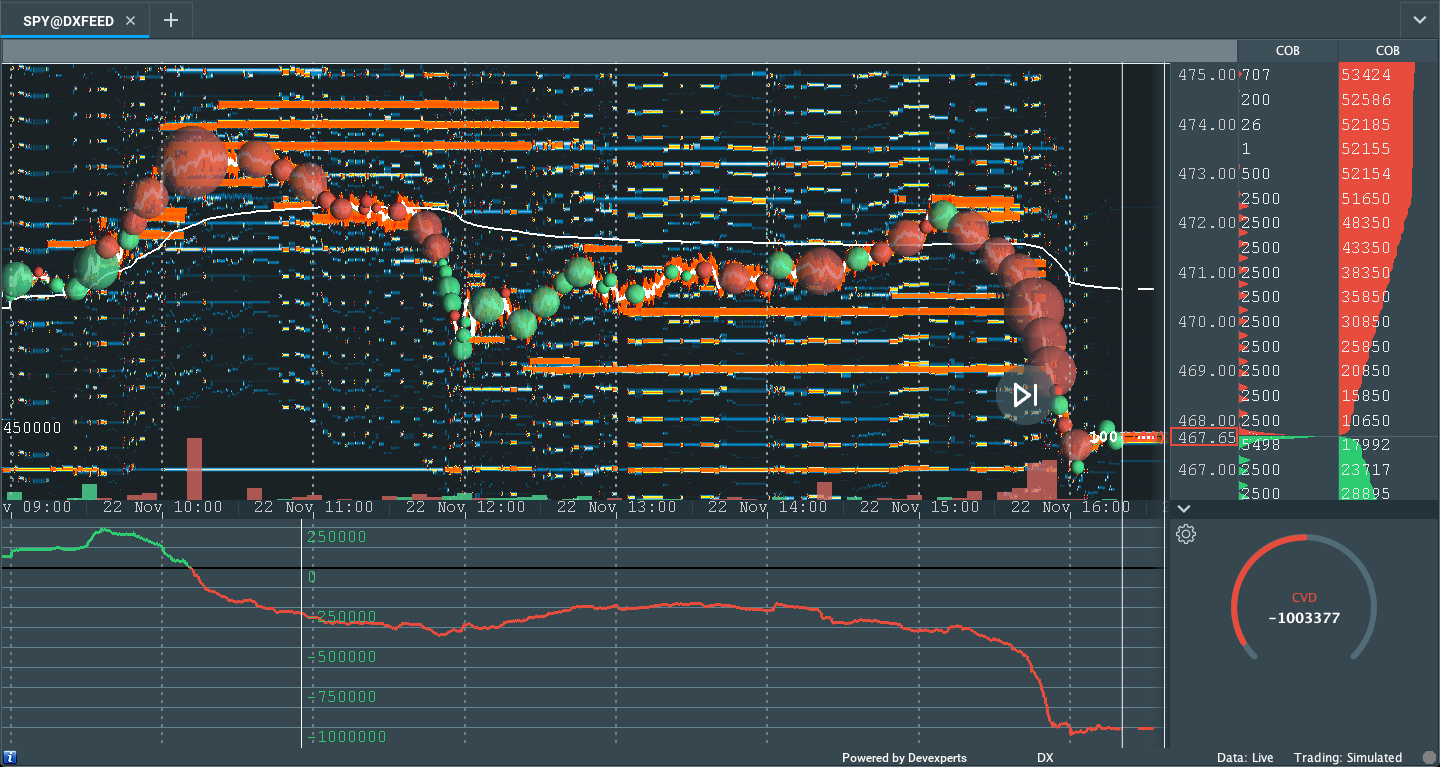
On weak intraday breadth and market liquidity metrics, the worst-case outcome occurred, evidenced by a spike below prices most recently accepted by S&P 500 traders.
Such activity denotes an obvious change in tone, as well as a potential willingness to start a trend in the opposite direction.
To note, however, yesterday’s price action came alongside a few dynamics: (1) an increase in tempo after a failure to solicit more involvement on an initial attempt higher; (2) a volume delta that was in line with price action; (3) breadth (i.e., volume into stocks that are up versus those that are down) on the Nasdaq was negative, divergent from the positive breadth on the NYSE.
Adding, the knee-jerk selling and associated price action left behind poor structure (i.e., participants will look to validate [or invalidate] the move, spending time below [or above] the $4,697.50 spike base). Caution warranted on validation of the spike.
Context: The aforementioned trade is happening in the context of what was an unstable environment after Friday’s monthly options expiration (OPEX).
To recap, heading into OPEX, activity in options tied to the S&P 500 was concentrated in time and price.
During this time – which I, alongside data and analytics providers like SpotGamma (go follow), surmise participants were betting the market would not move, selling-to-open call exposure – dealers/counterparties were left warehousing increased exposure to positive options gamma.
In hedging risks, dealers sold to open (bought to open) the underlying as the price rose (fell).
This responsive buying and selling are what causes the market to balance (i.e., trade sideways) in a tight range. It was expected to end after OPEX, as that options exposure rolled off.
Monday, finally, there was an increase in range; the S&P 500, in particular, closed over 1.00% lower from its intraday high, weighed down by the Nasdaq 100 heavyweights and high flyers of the past weeks.
Moreover, I was focused on two dynamics, primarily: (1) after OPEX, the absence of sticky and supportive hedging flows freed the market for directional resolve, and (2) according to SpotGamma, in light of recent exuberance, “participants [were] underexposed to downside put protection.”
The second part is slightly more important with regards to where we are today.
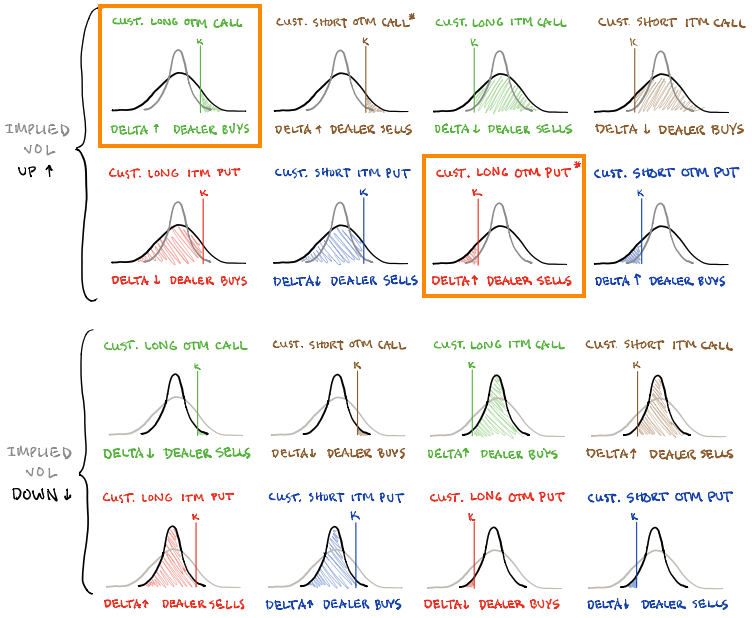
As the exuberance in individual stocks fed into the stock indices themselves – the place where the world comes to hedge – participants weren’t as quick to add downside protection. No! Instead, they were more so selling to open (buying to open) downside (upside) protection.
Without getting too much into the dynamics of the exuberant positioning, the implications of this, nonetheless, are staggering.
In short, should volatility continue to pick up, those participants (who were once exuberant) are likely to reach for protection forcing dealers to reflexively hedge in a destabilizing manner.
As volatility rises and customers demand out-of-the-money put protection, counterparties are to hedge by selling into weakness. The conditions worsen when much of the activity is in shorter-dated tenors where options gamma is more sensitive if we will.
Now, here is the kicker.
If indices turn, and participants start reaching for out-of-the-money protection with positive exposure to gamma (i.e., buy put, market down, put rises in value), especially in shorter-dated expiries, then yes, there may be some near-term instability.
Note that I said shorter-dated.
Once that exposure rolls off the table (and/or is monetized), dealers/counterparties will reverse and support the market, buying-to-close existing stock/futures hedges to negative gamma positions. This flow is stabilizing and maybe the start of what is a seasonally-aligned rally into Christmas.
This last part is educated conjecture. It’s what I also feel as though would frustrate the most amount of participants. Basically, a quick wash (or sideways to lower), followed by a move higher into year-end. Be nimble and responsive!
Expectations: As of 6:30 AM ET, Tuesday’s regular session (9:30 AM – 4:00 PM ET), in the S&P 500, will likely open in the middle part of a negatively skewed overnight inventory, outside of prior-range and -value, suggesting a potential for immediate directional opportunity.
Spike Scenario In Play: A spike marks the beginning of a break from value. Spikes higher (lower) are validated by trade at or above (below) the spike base (i.e., the origin of the spike).

The spike may also be looked at as a pivot; in today’s case, the spike base is $4,697.50.
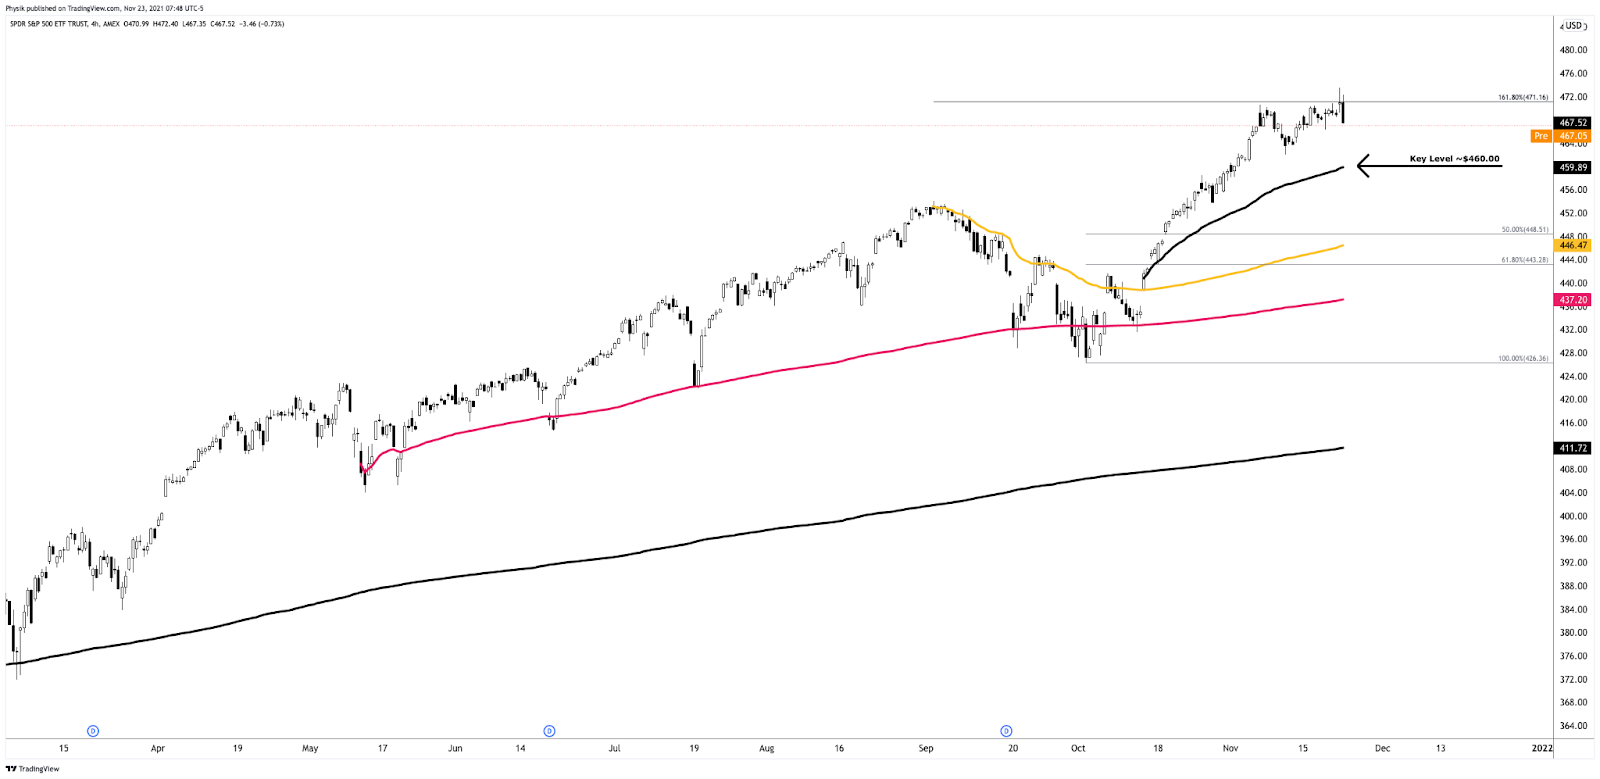
In the best case, the S&P 500 trades sideways or higher; activity above the $4,692.25 micro composite point of control (MCPOC) puts in play the $4,711.00 untested point of control (VPOC). Initiative trade beyond the VPOC could reach as high as the $4,740.50 minimal excess high and $4,765.25 Fibonacci, or higher.
In the worst case, the S&P 500 trades lower; activity below the $4,692.25 MCPOC puts in play the $4,674.25 high volume node. Initiative trade beyond the HVNode could reach as low as the $4,647.25 HVNode and $4,619.00 VPOC, or lower.
Click here to load today’s updated key levels into the web-based TradingView charting platform. Note that all levels are derived using the 65-minute timeframe. New links are produced, daily.

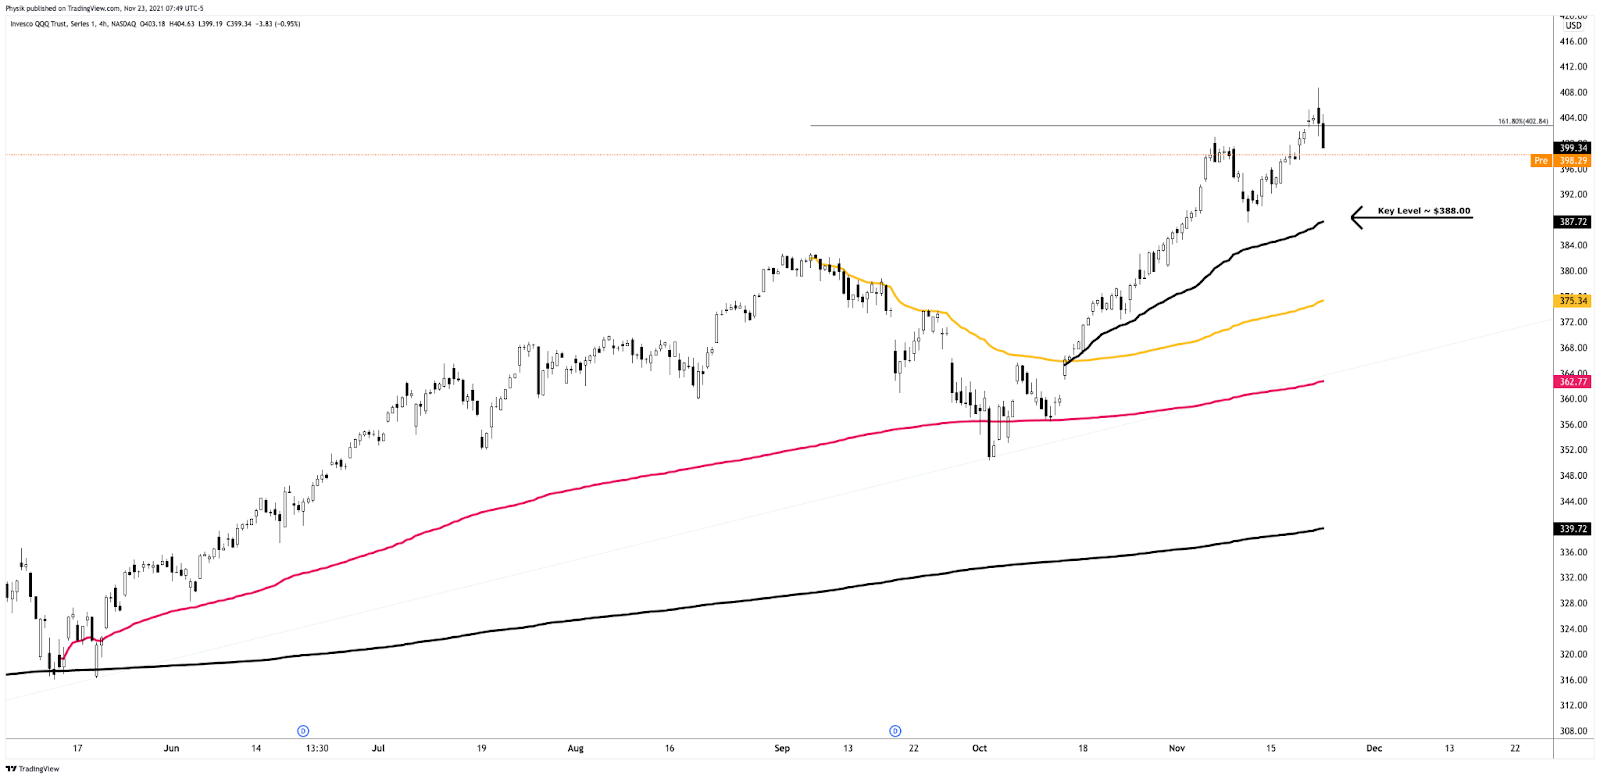
Charts To Watch
What People Are Saying
Definitions
Volume Areas: A structurally sound market will build on areas of high volume (HVNodes). Should the market trend for long periods of time, it will lack sound structure, identified as low volume areas (LVNodes). LVNodes denote directional conviction and ought to offer support on any test.
If participants were to auction and find acceptance into areas of prior low volume (LVNodes), then future discovery ought to be volatile and quick as participants look to HVNodes for favorable entry or exit.
DIX: For every buyer is a seller (usually a market maker). Using DIX — which is derived from short sales (i.e., liquidity provision on the market-making side) — we can measure buying pressure.
POCs: POCs are valuable as they denote areas where two-sided trade was most prevalent in a prior day session. Participants will respond to future tests of value as they offer favorable entry and exit.
MCPOCs: POCs are valuable as they denote areas where two-sided trade was most prevalent over numerous day sessions. Participants will respond to future tests of value as they offer favorable entry and exit.
Options Expiration (OPEX): Traditionally, option expiries mark an end to pinning (i.e, the theory that market makers and institutions short options move stocks to the point where the greatest dollar value of contracts will expire) and the reduction dealer gamma exposure.
Excess: A proper end to price discovery; the market travels too far while advertising prices. Responsive, other-timeframe (OTF) participants aggressively enter the market, leaving tails or gaps which denote unfair prices.
About
After years of self-education, strategy development, and trial-and-error, Renato Leonard Capelj began trading full-time and founded Physik Invest to detail his methods, research, and performance in the markets.
Additionally, Capelj is a Benzinga finance and technology reporter interviewing the likes of Shark Tank’s Kevin O’Leary, JC2 Ventures’ John Chambers, and ARK Invest’s Catherine Wood, as well as a SpotGamma contributor, developing insights around impactful options market dynamics.
Disclaimer
At this time, Physik Invest does not manage outside capital and is not licensed. In no way should the materials herein be construed as advice. Derivatives carry a substantial risk of loss. All content is for informational purposes only.