
Abstract
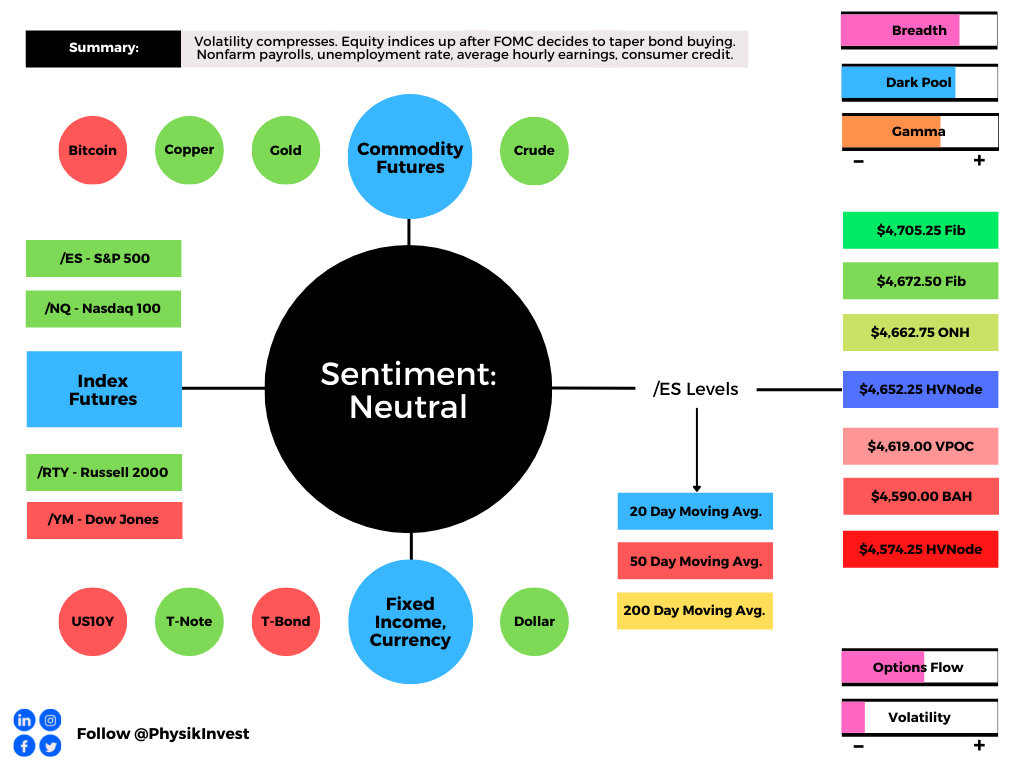
Equity index futures higher. Commodities were mostly higher. Bonds mixed. Volatility compressed.
Ahead is a heavier day of economic releases, in the face of fundamental narratives and positioning metrics that support intraday price stability.
What Happened
Overnight, equity index futures auctioned sideways to higher alongside the Federal Open Market Committee’s decision to taper bond buying and hold rate hikes.
Ahead is data on nonfarm payrolls, unemployment rate, and average hourly earnings (8:30 AM ET), as well as consumer credit (3:00 PM ET).
What To Expect
Action: On supportive intraday breadth and market liquidity metrics, the best case outcome occurred, evidenced by a spike away from an area of balanced, sideways trade in S&P 500 (INDEX: SPX) (ETF: SPY) (FUTURE: /ES).
Intent: As also evidenced by the separation of value (i.e., the area where 70% of the day’s trade occurred), the spike marks a potential willingness to continue the trend.
Validation: Continued sideways to higher trade, above the $4,627.00 level (a prior all-time high), validates the market’s prevailing intent to markup in the face of new information.
Consideration: Poor structure left behind prior initiative trade (as evidenced by the presence of numerous gaps and p-shaped emotional, multiple-distribution profile structures which denote short-covering and a lack of material, new-money buying) adds to technical instability.
This is a remark, which has been made in the last several commentaries, remains valid; post-FOMC, should the market crack, participants will likely look to check old value (i.e., revisit, repair, and strengthen) these pockets of low-volume, feverishly.

Context: The aforementioned trade is happening in the context of the FOMC’s decision to taper bond purchases and not raise interest rates.
The implications of this are, as evidenced by a near-vertical price rise, seen as positive.
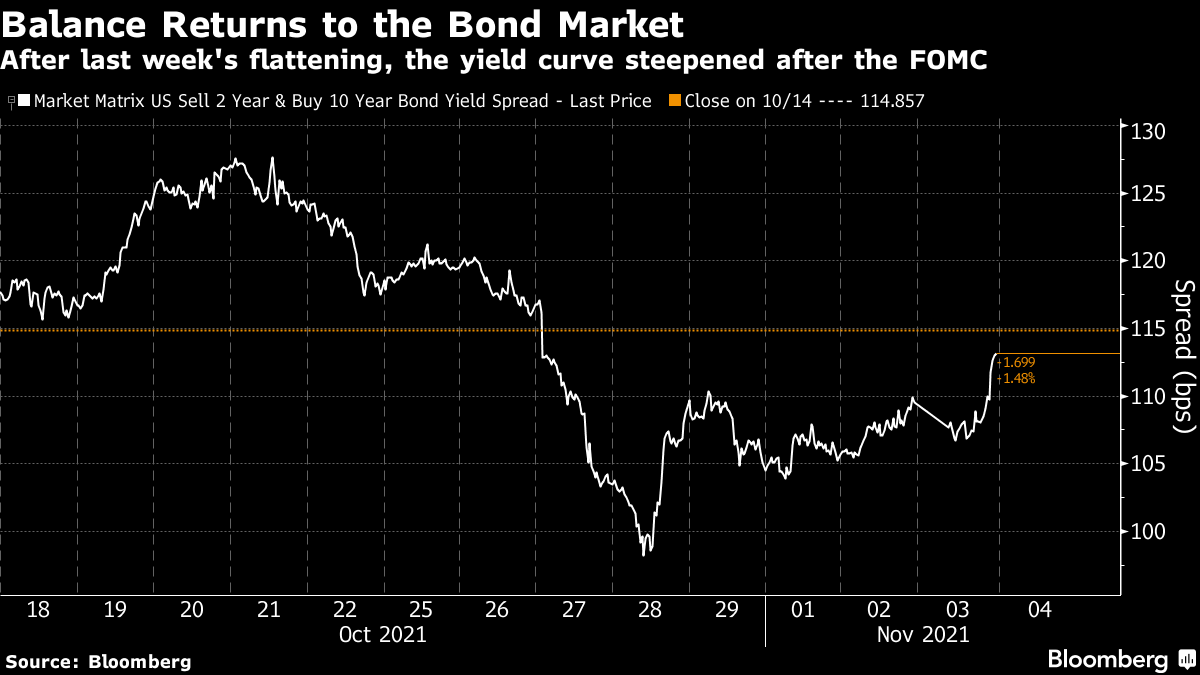
To elaborate, Bloomberg’s John Authers writes: “In 2013, the bond market threw a tantrum at the mere mention of a taper. Real financial conditions had sharply tightened before the Fed could eventually start withdrawing stimulus. This time, real yields are no higher than they were on New Year’s Day. People are still prepared to lend money to the government on the assumption that they will get a return a full percentage point below the inflation rate.”
On the topic of interest rates, “the Fed will warn us in advance – which in effect means that a rate rise should be penciled in for next July’s meeting, or June at the earliest.”
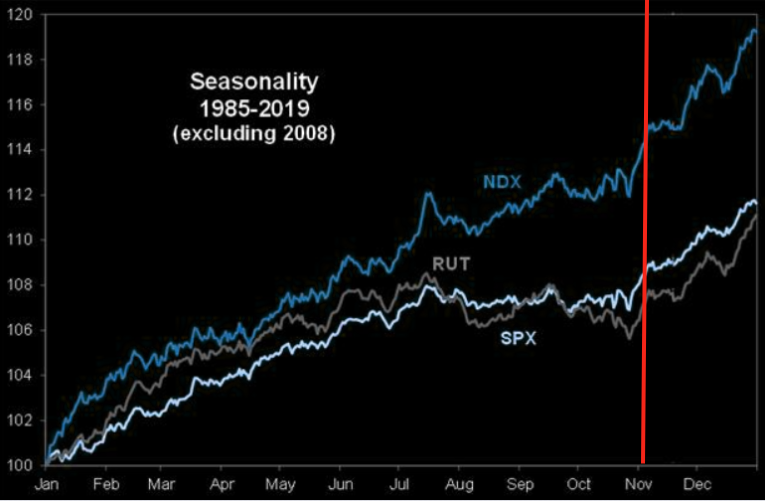
In terms of positioning, the CBOE Volatility Index (INDEX: VIX) was lower, while the VIX futures term structure came in a bit. To put it simply, participants were assuaged of their fears; the post-FOMC compression in volatility plays into an end-of-year, seasonally-aligned, rally supported by the flows typically associated with decaying, options hedges, according to SpotGamma.
Expectations: As of 6:30 AM ET, Thursday’s regular session (9:30 AM – 4:00 PM ET), in the S&P 500, will likely open near the middle part of a positively skewed overnight inventory, just outside of prior-range and -value, suggesting a potential for directional opportunity.
Spike Scenarios Apply: Spikes mark the beginning of a break from value. Spikes higher (lower) are validated by trade at or above (below) the spike base (i.e., the origin of the spike). The spike reference to go by is $4,627.00, a prior all-time high.
In the best case, the S&P 500 trades sideways or higher; activity above the $4,652.25 high volume area (HVNode) puts in play the $4,662.75 overnight high (ONH). Initiative trade beyond the ONH could reach as high as the $4,672.50 and $4,705.25 Fibonacci, or higher.
In the worst case, the S&P 500 trades lower; activity below the $4,652.25 HVNode puts in play the $4,619.00 untested point of control (VPOC). Initiative trade beyond the VPOC could reach as low as the $4,590.00 balance area high (BAH) and $4,574.25 HVNode, or lower.
Click here to load today’s updated key levels into the web-based TradingView charting platform. Note that all levels are derived using the 65-minute timeframe. New links are produced, daily.

What People Are Saying
Definitions
Overnight Rally Highs (Lows): Typically, there is a low historical probability associated with overnight rally-highs (lows) ending the upside (downside) discovery process.
Volume Areas: A structurally sound market will build on areas of high volume (HVNodes). Should the market trend for long periods of time, it will lack sound structure, identified as low volume areas (LVNodes). LVNodes denote directional conviction and ought to offer support on any test.
If participants were to auction and find acceptance into areas of prior low volume (LVNodes), then future discovery ought to be volatile and quick as participants look to HVNodes for favorable entry or exit.
POCs: POCs are valuable as they denote areas where two-sided trade was most prevalent in a prior day session. Participants will respond to future tests of value as they offer favorable entry and exit.
Balance (Two-Timeframe Or Bracket): Rotational trade that denotes current prices offer favorable entry and exit. Balance-areas make it easy to spot a change in the market (i.e., the transition from two-time frame trade, or balance, to one-time frame trade, or trend).
Modus operandi is responsive trade (i.e., fade the edges), rather than initiative trade (i.e., play the break).
Value-Area Placement: Perception of value unchanged if value overlapping (i.e., inside day). Perception of value has changed if value not overlapping (i.e., outside day). Delay trade in the former case.
About
After years of self-education, strategy development, and trial-and-error, Renato Leonard Capelj began trading full-time and founded Physik Invest to detail his methods, research, and performance in the markets.
Additionally, Capelj is a Benzinga finance and technology reporter interviewing the likes of Shark Tank’s Kevin O’Leary, JC2 Ventures’ John Chambers, and ARK Invest’s Catherine Wood, as well as a SpotGamma contributor, developing insights around impactful options market dynamics.
Disclaimer
At this time, Physik Invest does not manage outside capital and is not licensed. In no way should the materials herein be construed as advice. Derivatives carry a substantial risk of loss. All content is for informational purposes only.