Categories
Commentary

Daily Brief For February 27, 2023

Physik Invest’s Daily Brief is read free by thousands of subscribers. Join this community to learn about the fundamental and technical drivers of markets.
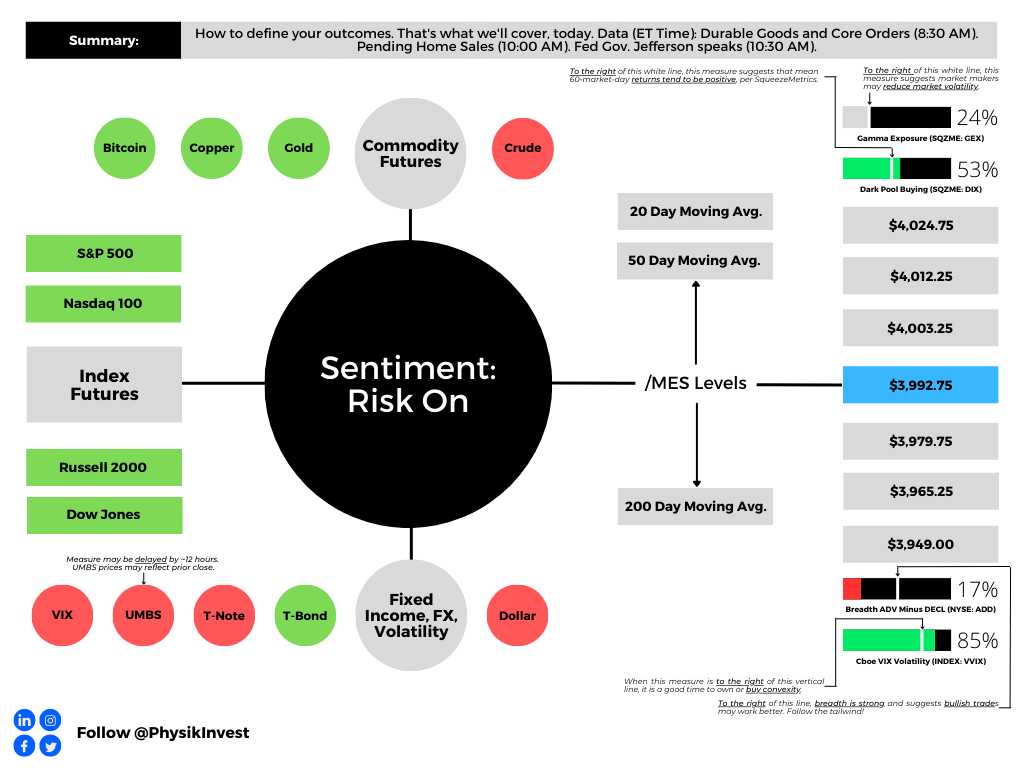
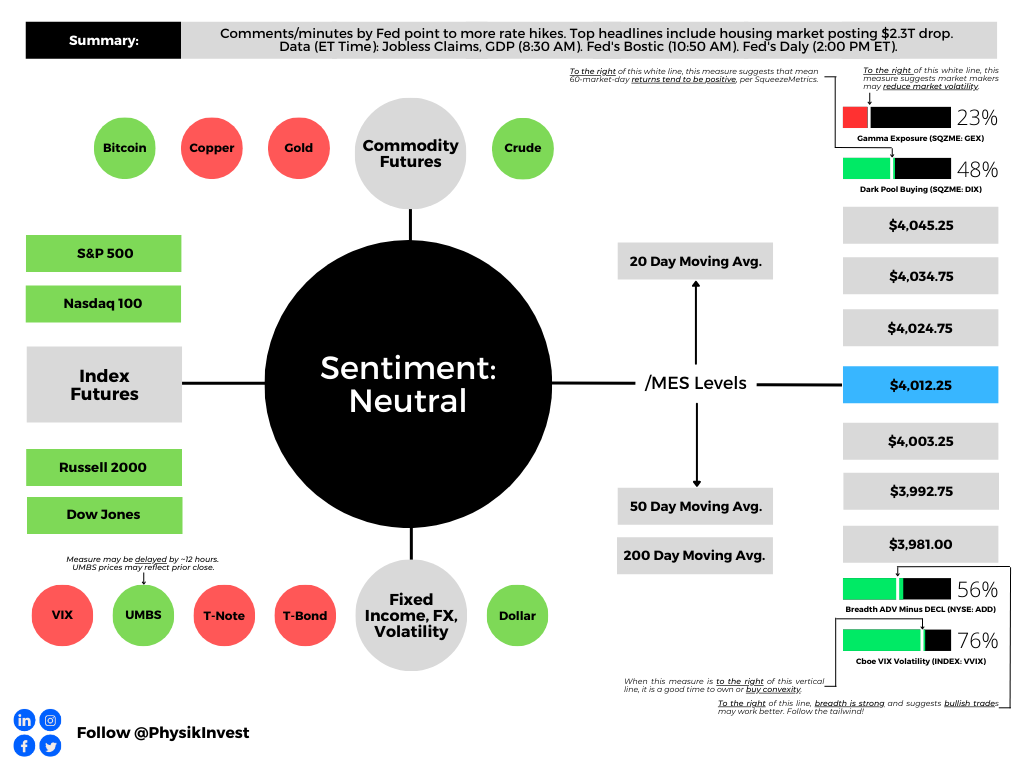
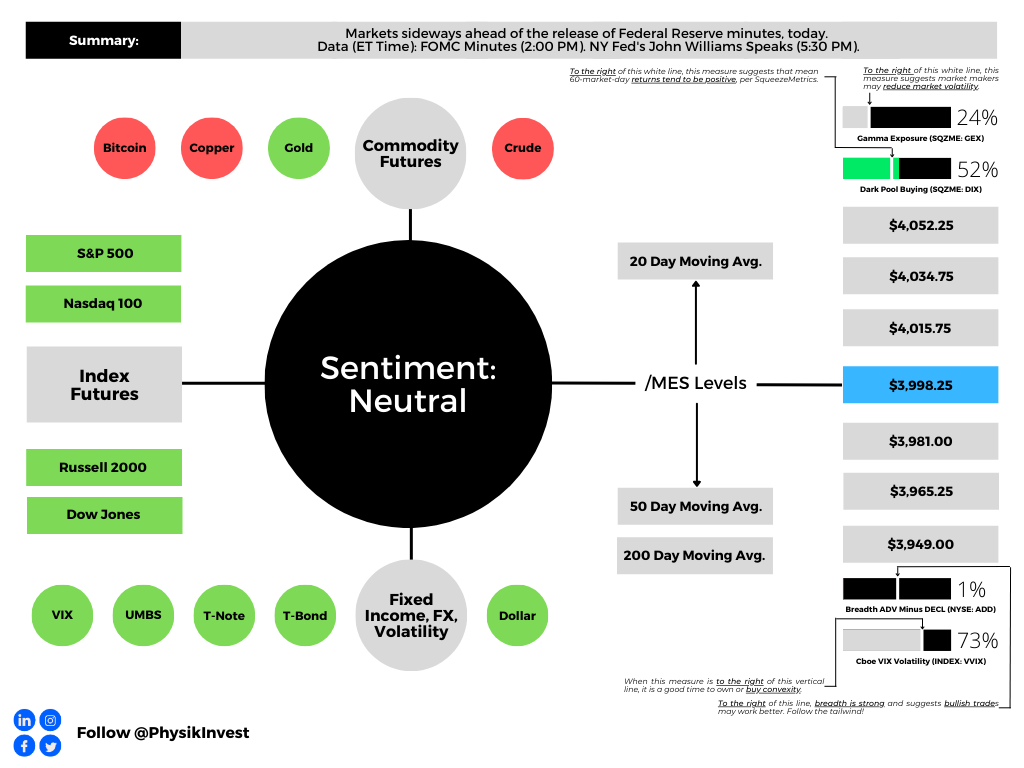
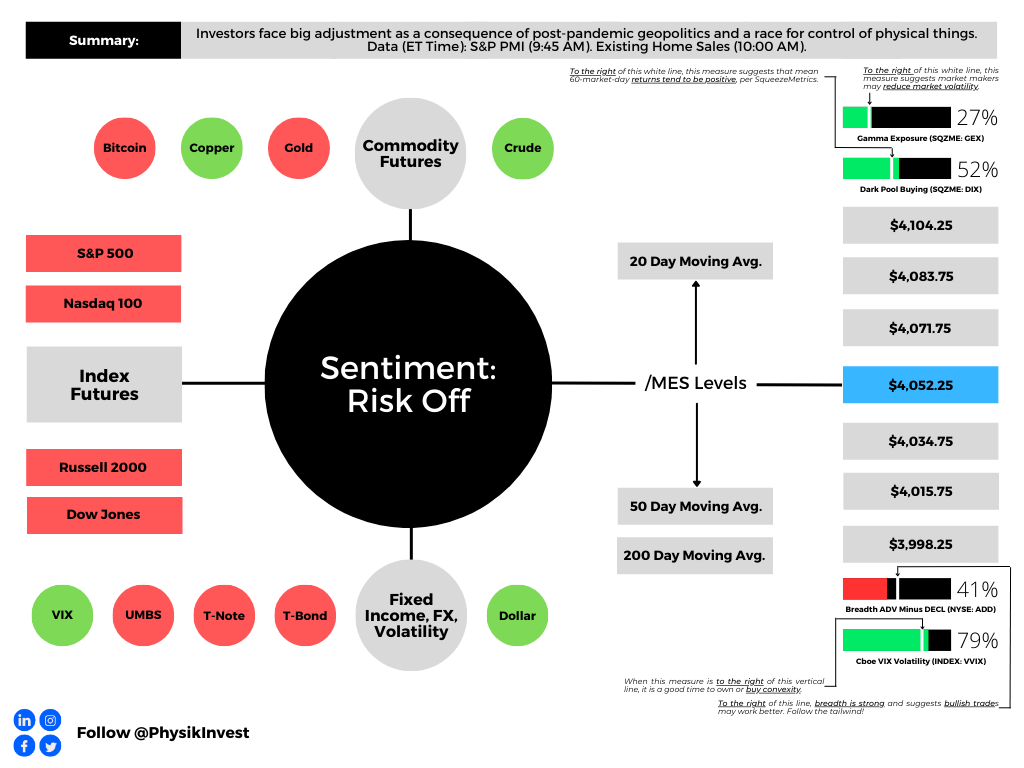
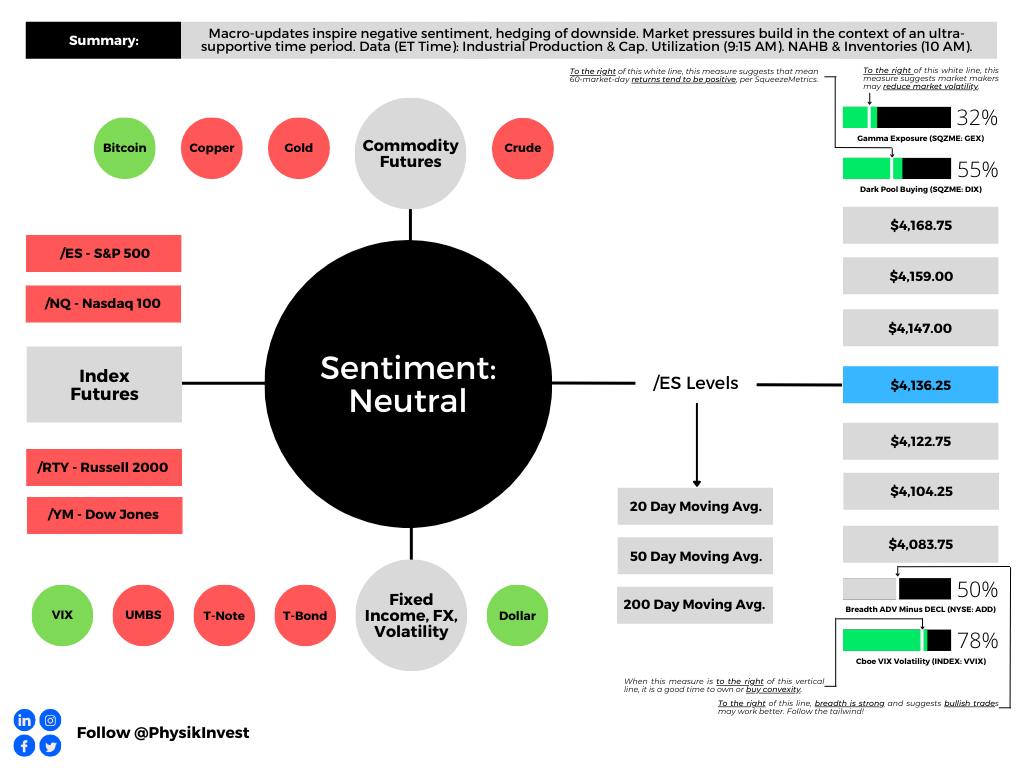
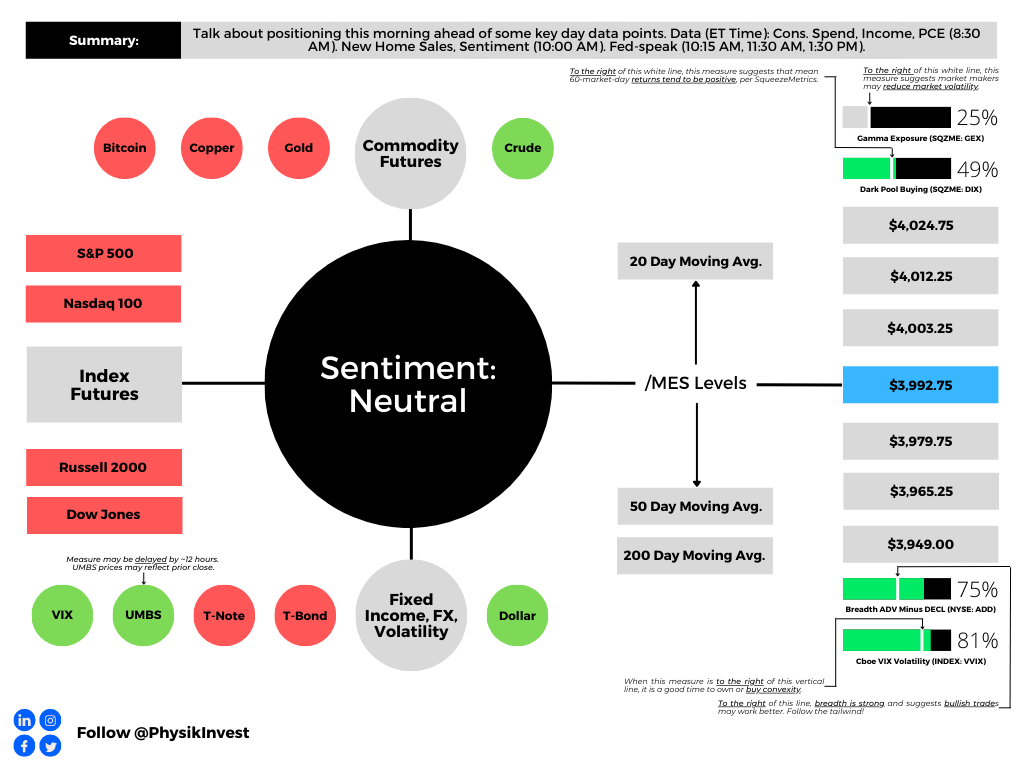
Graphic updated 7:45 AM ET. Sentiment Risk-On if expected /MES open is above the prior day’s range. /MES levels are derived from the profile graphic at the bottom of this letter. Click here for the latest levels. SqueezeMetrics Dark Pool Index (DIX) and Gamma (GEX) with the latter calculated based on where the prior day’s reading falls with respect to the MAX and MIN of all occurrences available. A higher DIX is bullish. The lower the GEX, the more (expected) volatility. Click to learn the implications of volatility, direction, and moneyness. Breadth reflects a reading of the prior day’s NYSE Advance/Decline indicator. The CBOE VIX Volatility Index (INDEX: VVIX) reflects the attractiveness of owning volatility. UMBS prices via MNDClick here for the economic calendar.

Positioning

In The Second Leg Down: Strategies For Profiting After A Market Sell-Off, there is one passage on the inaccuracy of normal distributions in markets and serial correlation, as well as the underpricing of rare events. In that same passage, Nassim Nicholas Taleb is credited for his advocacy on portfolio allocations to safe short-term government bonds and high-risk speculative bets through which “you could lose no more than your initial investment.”

Naturally, this leads to Exotic Options and Hybrids. Structured notes, to quote chapter two, are “composed of a non-risky asset providing a percentage of protected capital and a risky asset offering leverage potential.”

The structure, as a whole, is not risky in the absence of defaults. The bond, which is bought at a discount, increases in value until maturity. The difference between the initial value to allocate (100% of notional) and the bond purchase price is allocated to the leverage (e.g., options) component of the structure.

Graphic: Retrieved from Exotic Options and Hybrids.

This type of capital-protected structure is particularly attractive right now, given the interest rate environment. That’s because high-interest rates decrease the initial value of the bond. This means we can allocate more to leveraged bets, for example.

During the life of the structured note, the value of the non-risky part increases when interest rates decrease. At maturity, the value of the bond component is equal to 100% of the notional while the value of the riskier part of the note is “non-linear and fluctuates depending on many market parameters such as the underlying’s spot, interest rates, borrowing costs, dividend yield or volatility.”

Graphic: Retrieved from Exotic Options and Hybrids. For illustration only.

Last week, IPS Strategic Capital’s Pat Hennessy wrote a thread on how to apply this information. 

Basically, with interest rates near 5% at the front of the yield curve, and traditional portfolio constructions performing poorly, defined-outcome investing is attractive. 

With $1,000,000 to invest and rates at ~5% (i.e., $50,000 is 5% of $1,000,000), one could “purchase 1000 USTs [or S&P 500 (INDEX: SPX) Box Spreads] which will have a value of $1 million at maturity for the price of $950,000.”
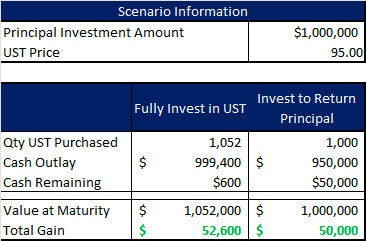
Graphic: Retrieved from IPS Strategic Capital’s Pat Hennessy.

With $50,000 left in cash, one can use options for leveraged exposure to an asset of their choosing, Hennessy explained. Should these options expire worthless, the $50,000 gain from USTs, at maturity, provides “a full return of principal.”

In an example, Hennessy presented a structure providing 60% of the upside gain of the S&P 500 with full principal protection should markets fall. Though “you may initially scoff at 60%, [] keep in mind that historically 60/40 has captured between 60-70% of the upside of equities.”
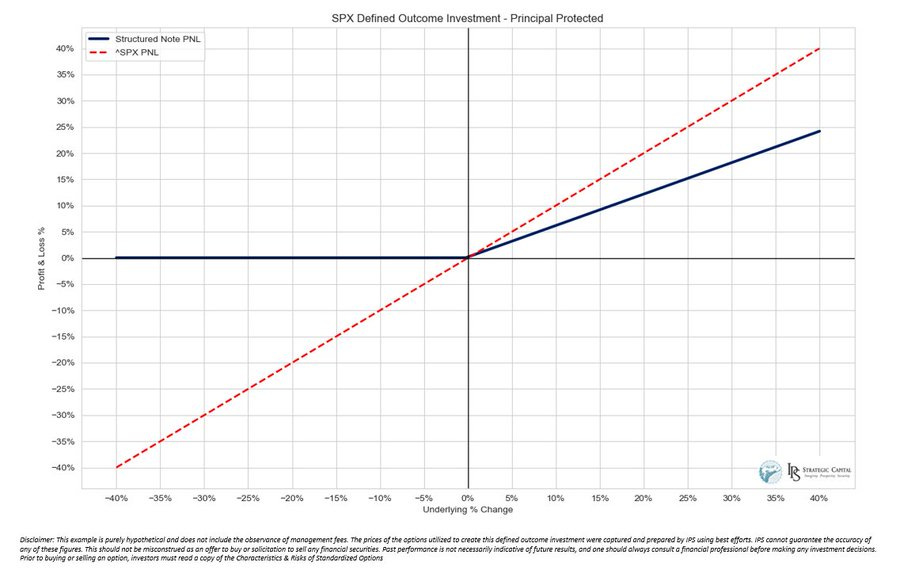
Image
Graphic: Retrieved from IPS Strategic Capital’s Pat Hennessy.

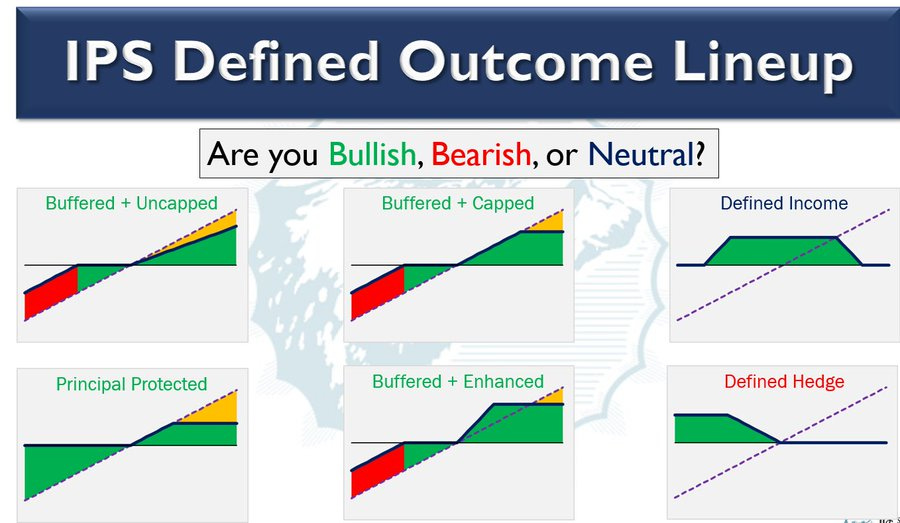
If you’re bearish or unopinionated, Hennessy presented capital-protected structures that make money if the market moves lower (e.g., instead of buying a call option on the SPX, buy put options or a put options spread) or sideways (e.g., sell defined-risk option condor structures).
Image
Graphic: Retrieved from IPS Strategic Capital’s Pat Hennessy.

Markets have a tendency to move big and continue moving big in the same direction, over the very short term, hence the “fat tails in the distribution over short horizons,” to quote The Second Leg Down. Given this, your letter writer can use his analyses to capitalize big on underpricing and participate in upside or downside through a series of short-dated options bets (e.g., butterflies, broken-wing butterflies, ratio spreads, back spreads, and beyond) that, in time, may return in excess of ~10 times the initial investment. Should nothing happen, then he walks away with his principal. That’s trading made less stressful.

Have a great day. If you enjoyed today’s letter, consider sharing it with your friends!
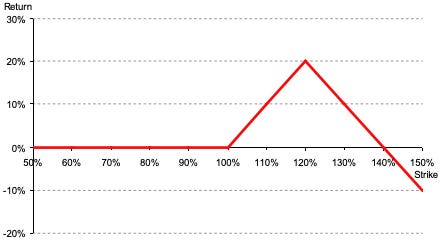
Graphic: Via Banco Santander SA (NYSE: SAN) research, the return profile, at expiry, of a classic 1×2 (long 1, short 2 further away) ratio spread.

Technical

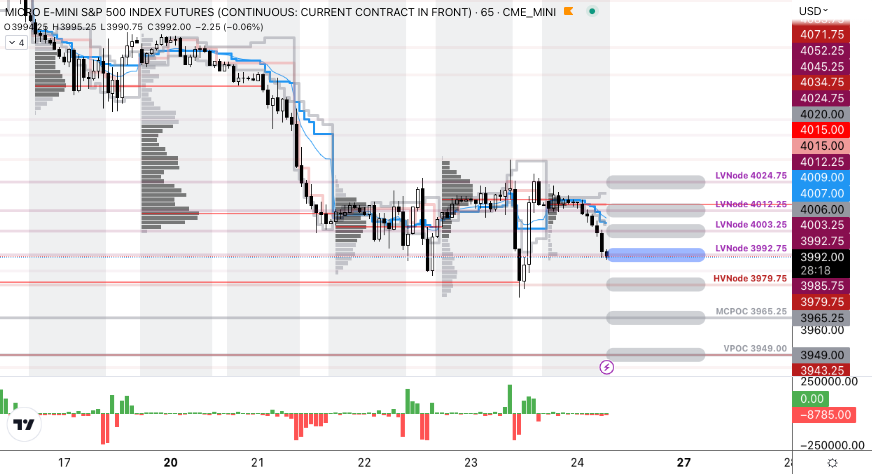
As of 7:40 AM ET, Monday’s regular session (9:30 AM – 4:00 PM ET), in the S&P 500, is likely to open in the upper part of a positively skewed overnight inventory, outside of the prior day’s range, suggesting a potential for immediate directional opportunity.

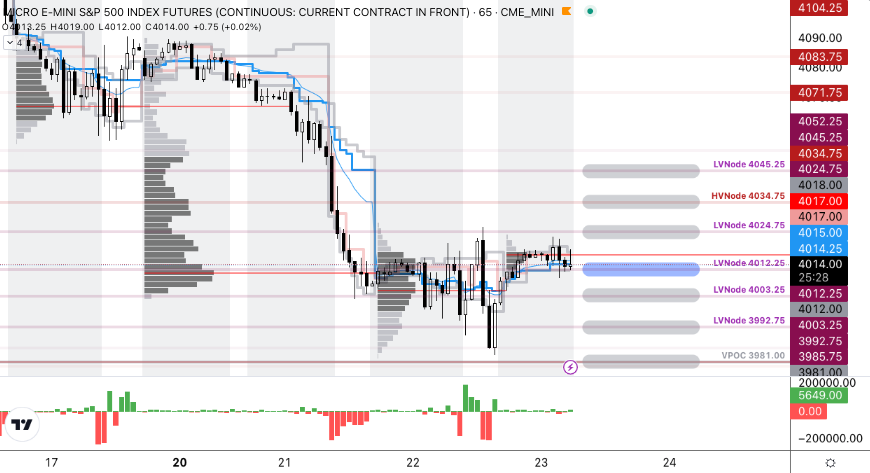
The S&P 500 pivot for today is $3,992.75. 

Key levels to the upside include $4,003.25, $4,012.25, and $4,024.75.

Key levels to the downside include $3,979.75, $3,965.25, and $3,949.00.

Disclaimer: Click here to load the updated key levels via the web-based TradingView platform. New links are produced daily. Quoted levels likely hold barring an exogenous development.
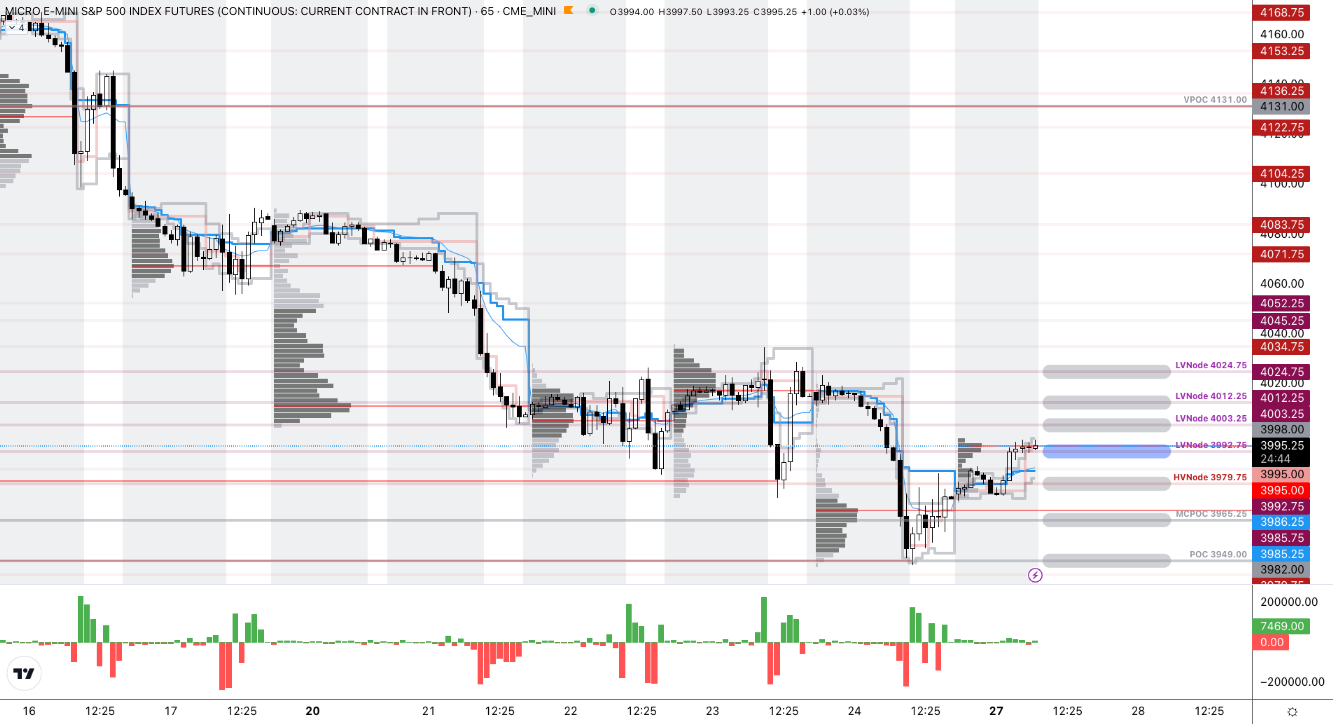
Graphic: 65-minute profile chart of the Micro E-mini S&P 500 Futures.

Definitions

Volume Areas: Markets will build on areas of high-volume (HVNodes). Should the market trend for a period of time, this will be identified by a low-volume area (LVNodes). The LVNodes denote directional conviction and ought to offer support on any test.

If participants auction and find acceptance in an area of a prior LVNode, then future discovery ought to be volatile and quick as participants look to the nearest HVNodes for more favorable entry or exit.

POCs: Areas where two-sided trade was most prevalent in a prior day session. Participants will respond to future tests of value as they offer favorable entry and exit.

MCPOCs: Denote areas where two-sided trade was most prevalent over numerous sessions. Participants will respond to future tests of value as they offer favorable entry and exit.


About

The author, Renato Leonard Capelj, works in finance and journalism.

Capelj spends the bulk of his time at Physik Invest, an entity through which he invests and publishes free daily analyses to thousands of subscribers. The analyses offer him and his subscribers a way to stay on the right side of the market. Separately, Capelj is an options analyst at SpotGamma and an accredited journalist.

Capelj’s past works include conversations with investor Kevin O’Leary, ARK Invest’s Catherine Wood, FTX’s Sam Bankman-Fried, North Dakota Governor Doug Burgum, Lithuania’s Minister of Economy and Innovation Aušrinė Armonaitė, former Cisco chairman and CEO John Chambers, and persons at the Clinton Global Initiative.

Connect

Direct queries to renato@physikinvest.com. Find Physik Invest on TwitterLinkedInFacebook, and Instagram. Find Capelj on TwitterLinkedIn, and Instagram. Only follow the verified profiles.

Calendar

You may view this letter’s content calendar at this link.

Disclaimer

Do not construe this newsletter as advice. All content is for informational purposes. Capelj and Physik Invest manage their own capital and will not solicit others for it.

Categories
Commentary

Daily Brief For February 24, 2023

Physik Invest’s Daily Brief is read free by thousands of subscribers. Join this community to learn about the fundamental and technical drivers of markets.

Graphic updated 8:25 AM ET. Sentiment Neutral if expected /MES open is inside of the prior day’s range. /MES levels are derived from the profile graphic at the bottom of this letter. Click here for the latest levels. SqueezeMetrics Dark Pool Index (DIX) and Gamma (GEX) with the latter calculated based on where the prior day’s reading falls with respect to the MAX and MIN of all occurrences available. A higher DIX is bullish. The lower the GEX, the more (expected) volatility. Click to learn the implications of volatility, direction, and moneyness. Breadth reflects a reading of the prior day’s NYSE Advance/Decline indicator. The CBOE VIX Volatility Index (INDEX: VVIX) reflects the attractiveness of owning volatility. UMBS prices via MNDClick here for the economic calendar.

Positioning

Traders continue to balance the risks of owning risk assets versus less-risky bonds, for instance. In what can be construed as a fear-of-missing-out (FOMO), some have sought upside equity exposure in a way that limits downside: call options.

Consequently, implied volatility (IVOL) on the call side, particularly in options with less time to expiration, continues to be elevated by upwards of 10.00% or more.

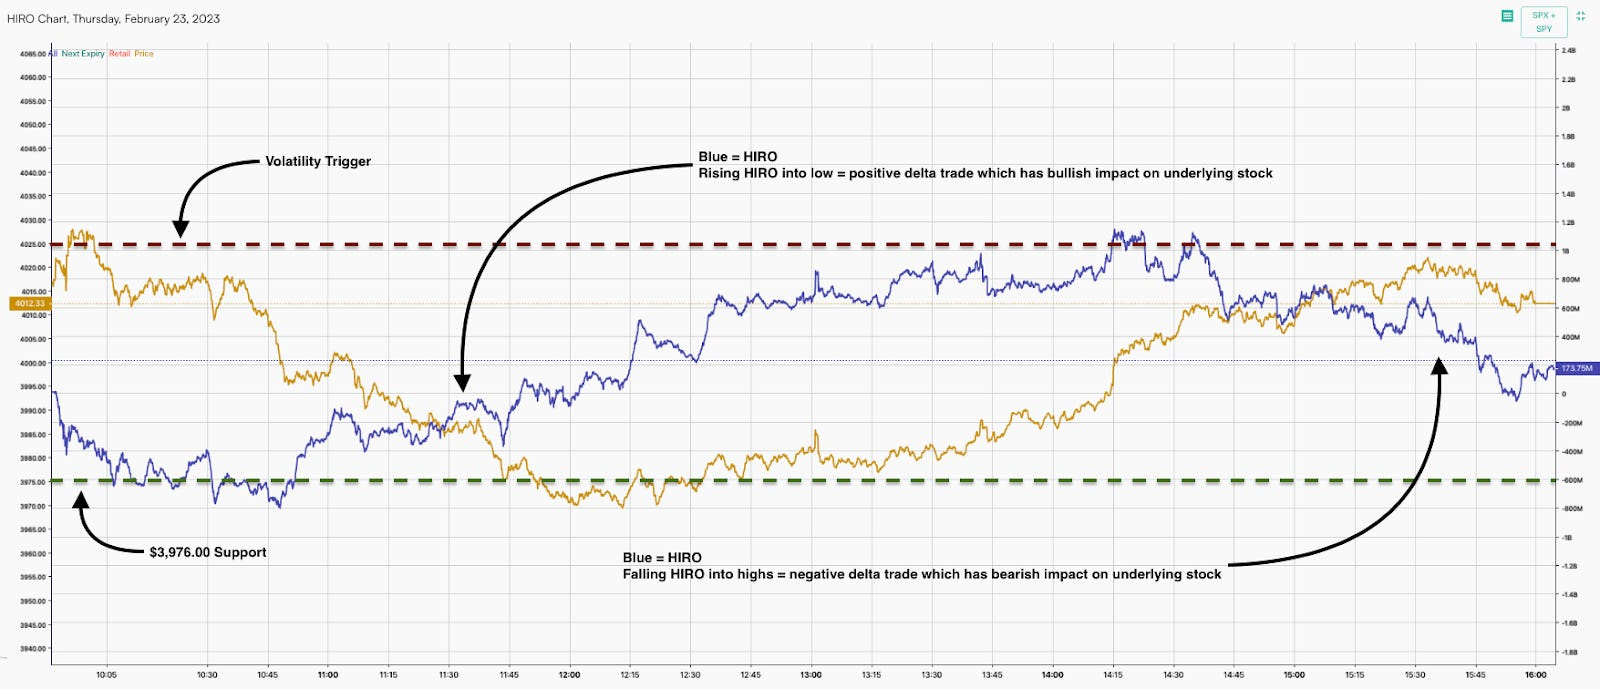
Further, this week’s trading has been dominated by the expected post-options expiry (OpEx) weakness, as well as short-term catalysts and trading. Take yesterday, for example, the market opened higher signaling a potential trend change on upbeat earnings reports, as I detailed in a SpotGamma note. Under the hood, however, there was little optimism. The S&P 500 (INDEX: SPX) succumbed to this weakness before reversing at a key support SpotGamma’s modeling established and rising toward a key resistance into session-end. Noteworthy was the options activity heading into the decline. We observe this activity with tools including SpotGamma’s HIRO indicator measuring the real-time hedging impact of traders’ options activities. 

As the SPX traded lower, ultra-short-dated call buyers and put sellers synthetically bought the market. The hedging of this ultra-sensitive exposure portended a turn at the low. As the SPX resolved higher, this activity traded out, so to speak, as evidenced by ultra-short-dated call selling and put buying, hence mean-reversion into the close.

Graphic: Retrieved from SpotGamma.

SpotGamma’s founder said these “head-fakes” were to be expected. “Traders are uncertain and still are not committed to demanding longer-dated protection,” hence lower longer-dated IVOL.

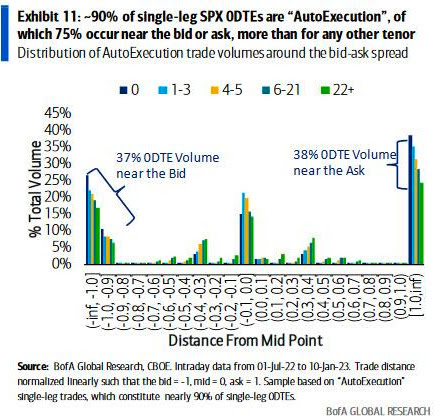
In a Bank of America Corporation (NYSE: BAC) response to JPMorgan Chase & Co’s (NYSE: JPM) note on an ultra-short-dated options trading catastrophe looming, we learn that mean-reversion is, in part, a result of “traders buying short-dated options at the beginning of the day and unwinding those same positions late in the day,” I put in a SpotGamma note.

To quote BAC directly, half of all SPX ultra-short-dated options activity is “single-leg auto-execution.” Options IVOL is “at levels that are likely inconsistent with a market that has been overrun by option sellers,” contrary to JPM’s opinion, ZeroHedge said in one recap. “75% of trades occur near the bid or the ask – more than for any other tenor, and volume is uniquely skewed towards the ask early in the day but towards the bid later in the day.”

Consequently, a takeaway is that, as this letter has put forth in the past, ultra-short-dated options activity does not have a long-lasting impact. Rather, what is impactful is participants’ desire to carry exposure to options/protection that are farther-dated.

Graphic: Retrieved from Bank of America Corporation (NYSE: BAC) via SpotGamma.

As put in yesterday’s letter, the contexts for a far-reaching rally are weak. A change in the bearish context is likely to coincide with charged options values (i.e., wound IVOL or big put delta) or some fundamental, macro-type catalyst. In the latter, a caveat is that IVOL compression, alone, likely does little to inspire a far-reaching rally.

Technical

As of 7:30 AM ET, Friday’s regular session (9:30 AM – 4:00 PM ET), in the S&P 500, is likely to open in the lower part of a negatively skewed overnight inventory, inside of the prior day’s range, suggesting a limited potential for immediate directional opportunity.

The S&P 500 pivot for today is $3,992.75. 

Key levels to the upside include $4,003.25, $4,012.25, and $4,024.75.

Key levels to the downside include $3,979.75, $3,965.25, and $3,949.00.

Disclaimer: Click here to load the updated key levels via the web-based TradingView platform. New links are produced daily. Quoted levels likely hold barring an exogenous development.

Graphic: 65-minute profile chart of the Micro E-mini S&P 500 Futures.

Definitions

Volume Areas: Markets will build on areas of high-volume (HVNodes). Should the market trend for a period of time, this will be identified by a low-volume area (LVNodes). The LVNodes denote directional conviction and ought to offer support on any test.

If participants auction and find acceptance in an area of a prior LVNode, then future discovery ought to be volatile and quick as participants look to the nearest HVNodes for more favorable entry or exit.

POCs: Areas where two-sided trade was most prevalent in a prior day session. Participants will respond to future tests of value as they offer favorable entry and exit.

MCPOCs: Denote areas where two-sided trade was most prevalent over numerous sessions. Participants will respond to future tests of value as they offer favorable entry and exit.


About

The author, Renato Leonard Capelj, works in finance and journalism.

Capelj spends the bulk of his time at Physik Invest, an entity through which he invests and publishes free daily analyses to thousands of subscribers. The analyses offer him and his subscribers a way to stay on the right side of the market. Separately, Capelj is an options analyst at SpotGamma and an accredited journalist.

Capelj’s past works include conversations with investor Kevin O’Leary, ARK Invest’s Catherine Wood, FTX’s Sam Bankman-Fried, North Dakota Governor Doug Burgum, Lithuania’s Minister of Economy and Innovation Aušrinė Armonaitė, former Cisco chairman and CEO John Chambers, and persons at the Clinton Global Initiative.

Connect

Direct queries to renato@physikinvest.com. Find Physik Invest on TwitterLinkedInFacebook, and Instagram. Find Capelj on TwitterLinkedIn, and Instagram. Only follow the verified profiles.

Calendar

You may view this letter’s content calendar at this link.

Disclaimer

Do not construe this newsletter as advice. All content is for informational purposes. Capelj and Physik Invest manage their own capital and will not solicit others for it.

Categories
Commentary

Daily Brief For February 23, 2023

Physik Invest’s Daily Brief is read free by thousands of subscribers. Join this community to learn about the fundamental and technical drivers of markets.

Graphic updated 6:30 AM ET. Sentiment Neutral if expected /MES open is inside of the prior day’s range. /MES levels are derived from the profile graphic at the bottom of this letter. Click here for the latest levels. SqueezeMetrics Dark Pool Index (DIX) and Gamma (GEX) with the latter calculated based on where the prior day’s reading falls with respect to the MAX and MIN of all occurrences available. A higher DIX is bullish. The lower the GEX, the more (expected) volatility. Click to learn the implications of volatility, direction, and moneyness. Breadth reflects a reading of the prior day’s NYSE Advance/Decline indicator. The CBOE VIX Volatility Index (INDEX: VVIX) reflects the attractiveness of owning volatility. UMBS prices via MNDClick here for the economic calendar.

Fundamental

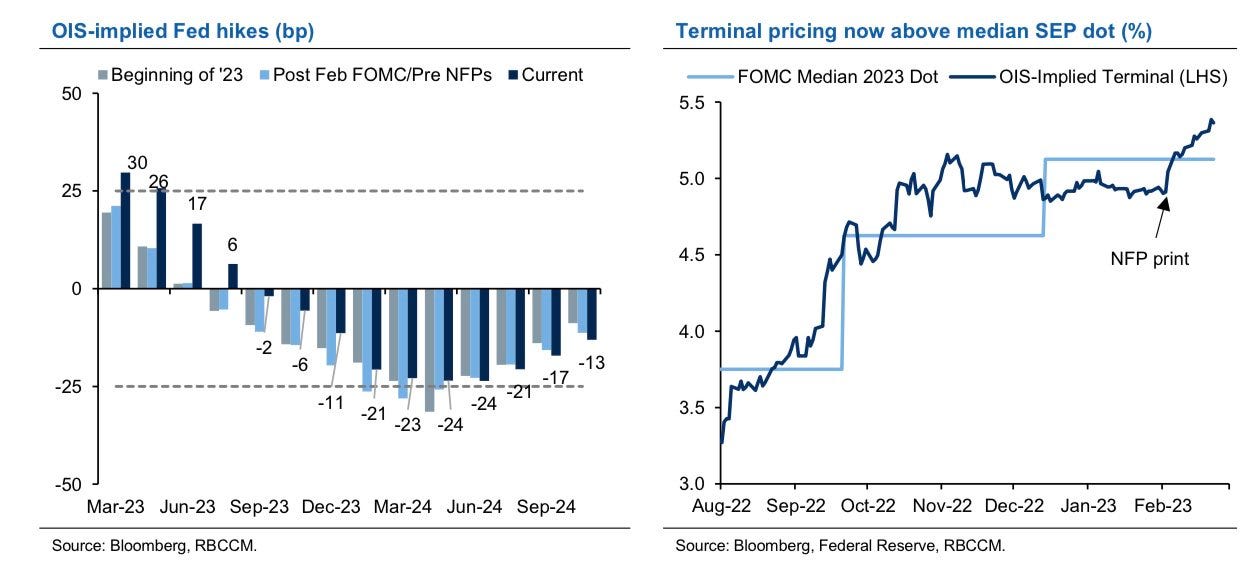
Bloomberg’s John Authers summarized well the release of the Federal Open Market Committee (FOMC) meeting minutes. He said that almost all officials “supported a step down in the pace of tightening by 25 basis points, while a ‘few’ favored or could have supported a bigger 50 basis-point hike. Nobody wanted to stop straightaway.”

“Participants observed that a restrictive policy stance would need to be maintained until the incoming data provided confidence that inflation was on a sustained downward path to 2%, which was likely to take some time,” the minutes said.

Graphic: Retrieved from Royal Bank of Canada (NYSE: RY). 

Notwithstanding hits to markets like housing, which news has concentrated on, the S&P 500 (INDEX: SPX) is trading about 18x forward price-to-earnings, Bank of America Corporation (NYSE: BAC) said, the highest since March 2022 and 20% above the last decade’s average P/E

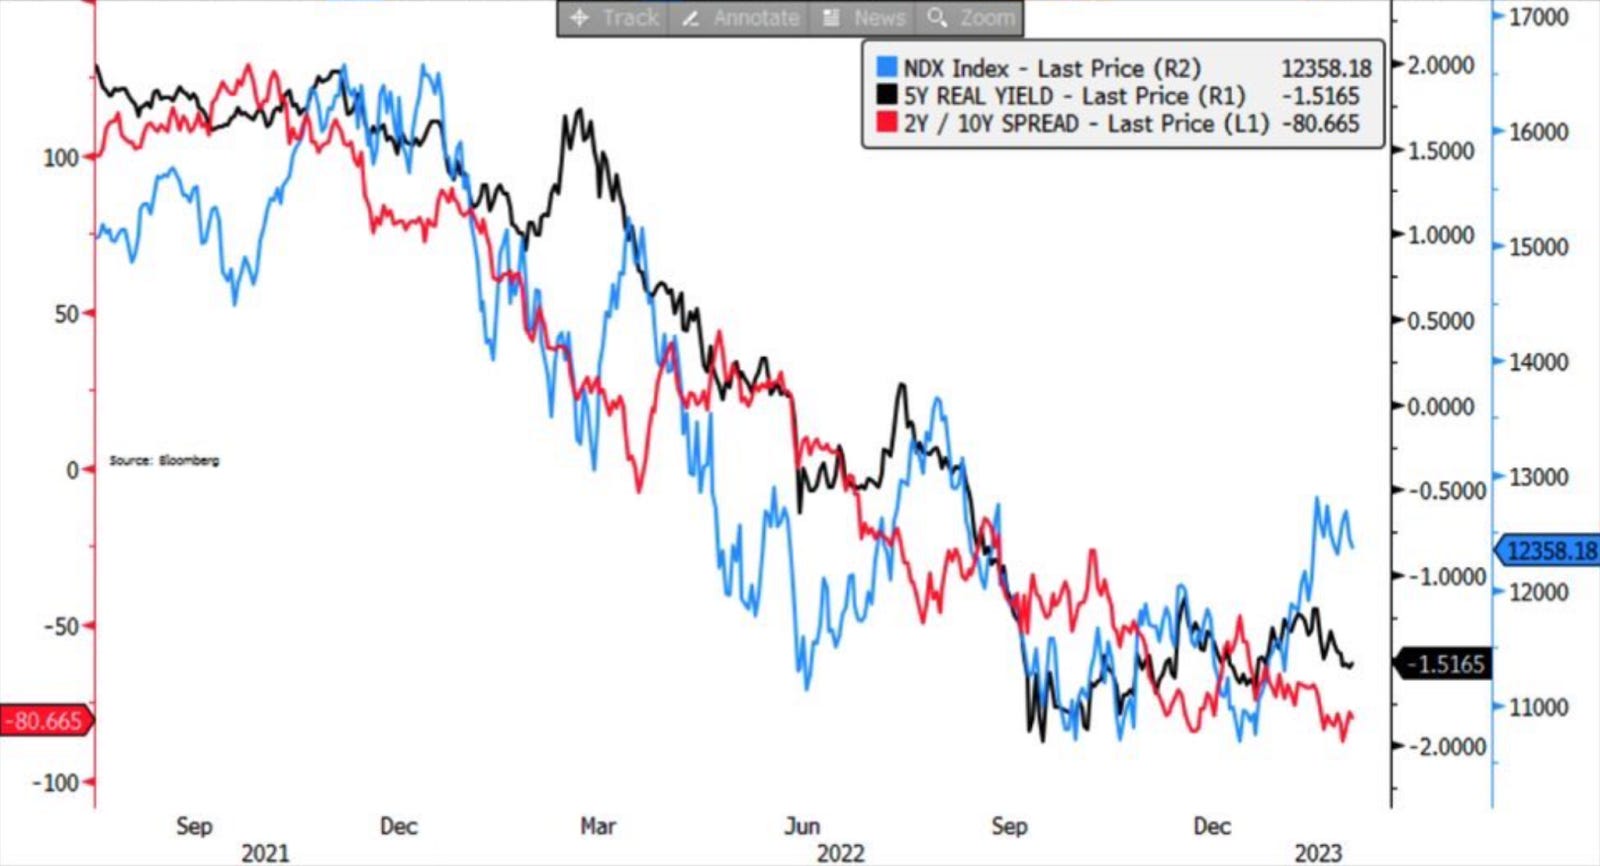
Graphic: Retrieved from Bloomberg.

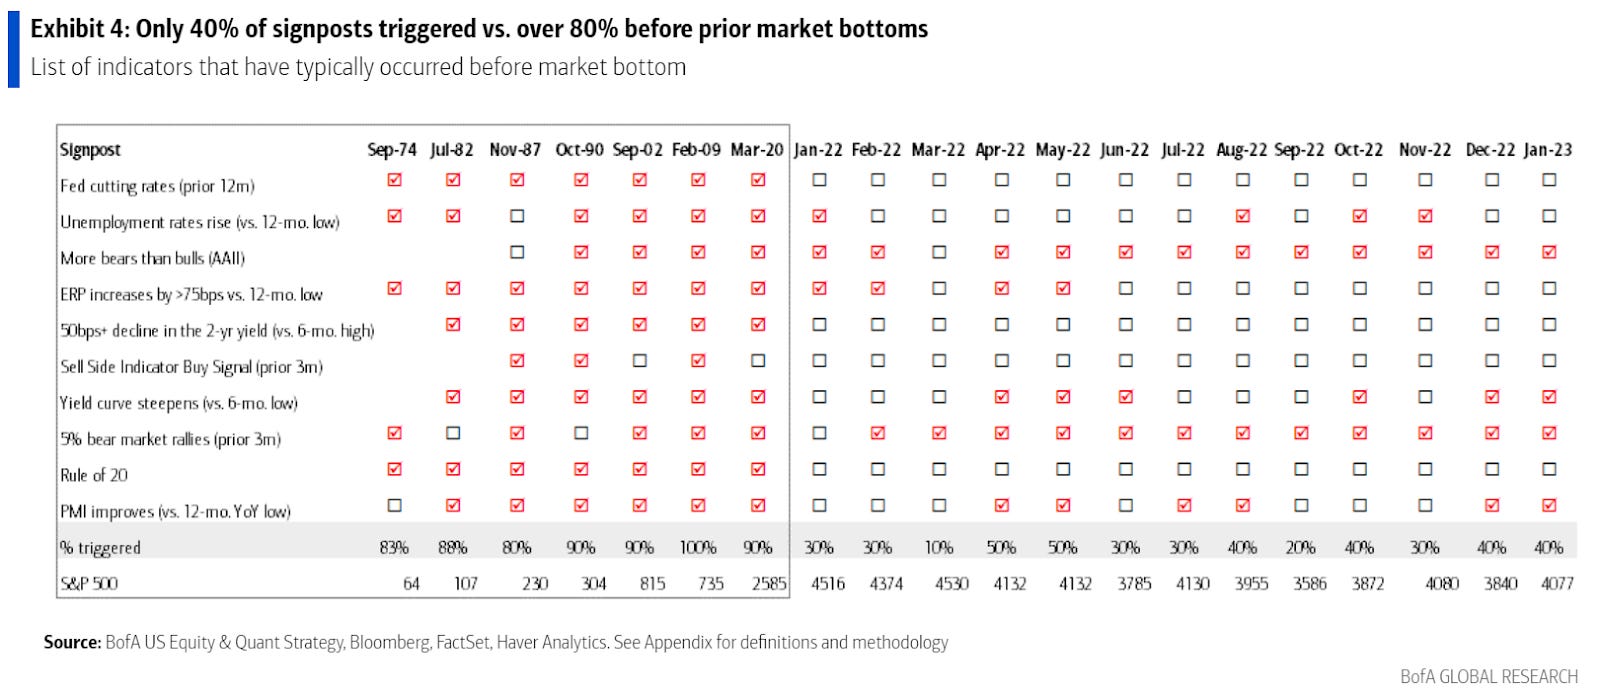
Per Savita Subramanian, “the traditional Rule of 20 … holds that the multiple should be whatever number results by subtracting the inflation rate from 20 — which with inflation at 6.4% would imply that the P/E needs to fall to 13.6.”

Graphic: Retrieved from Bank of America Corporation (NYSE: BAC) via Bloomberg.

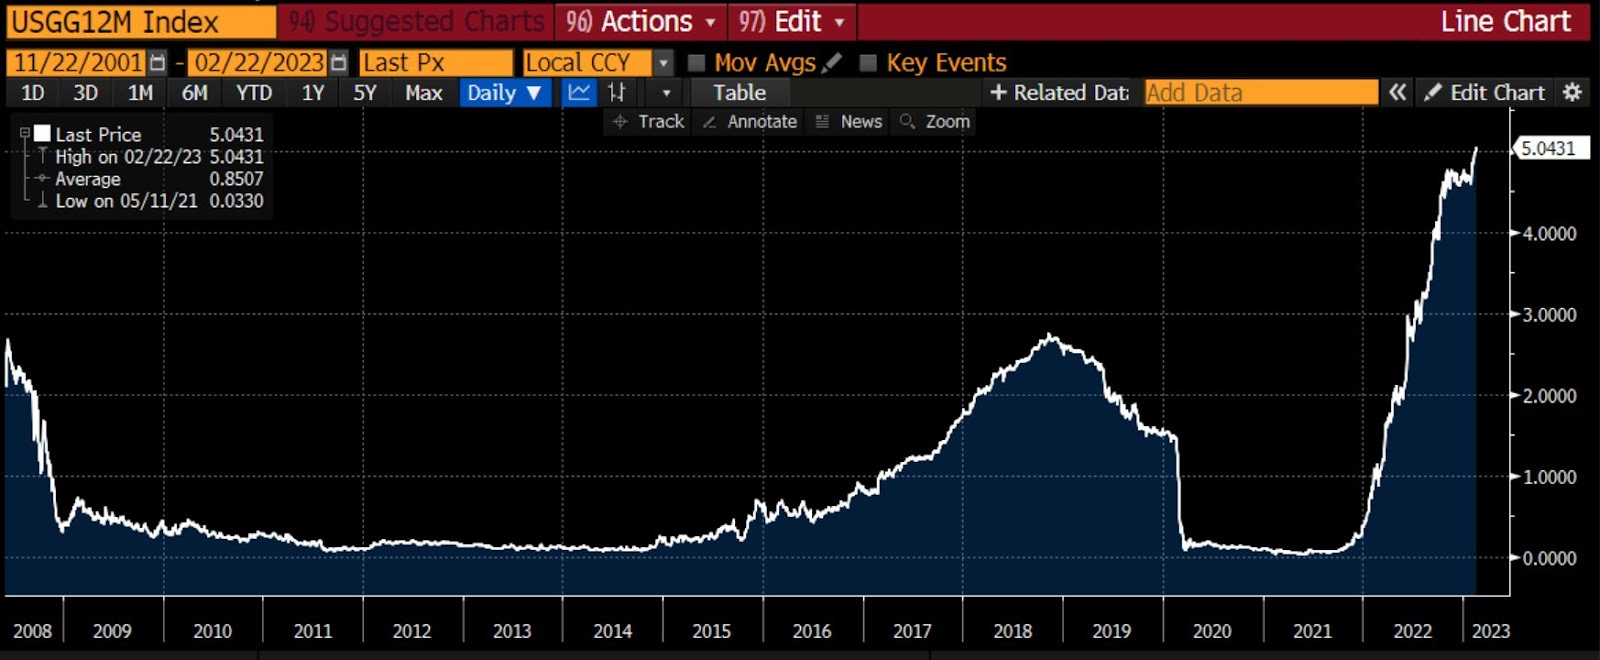
Recall yesterday’s letter discussing the “risk-reward of holding bonds [looking] better than equity (earnings yield).”

Graphic: Retrieved from Bloomberg’s Lisa Abramowicz. “Yields on 12-month T-bills have risen to their highest since 2001. Most of this has to do with Fed rate hike expectations.”

Positioning

The SPX’s decline is orderly and contained. 

However, the break below $4,000.00 SPX did open the door to a “liquidity hole,” SpotGamma explained. New information has traders anticipating more equity market downside; traders are “reset[ing] to lower equity valuations” on the higher-for-longer rate narrative all the while “vanna and gamma hedging serve to pull markets lower.”

The contexts for a far-reaching rally are weakA change in the context is likely to coincide with charged options values (i.e., wound implied volatility or big put delta).

Technical

As of 6:30 AM ET, Thursday’s regular session (9:30 AM – 4:00 PM ET), in the S&P 500, is likely to open in the middle part of a positively skewed overnight inventory, inside of the prior day’s range, suggesting a limited potential for immediate directional opportunity.

The S&P 500 (FUTURE: /MES) pivot for today is $4,012.25. 

Key levels to the upside include $4,024.75, $4,034.75, and $4,045.25.

Key levels to the downside include $4,003.25, $3,992.75, and $3,981.00.

Disclaimer: Click here to load the updated key levels via the web-based TradingView platform. New links are produced daily. Quoted levels likely hold barring an exogenous development.

Graphic: 65-minute profile chart of the Micro E-mini S&P 500 Futures.

Definitions

Volume Areas: Markets will build on areas of high-volume (HVNodes). Should the market trend for a period of time, this will be identified by a low-volume area (LVNodes). The LVNodes denote directional conviction and ought to offer support on any test.

If participants auction and find acceptance in an area of a prior LVNode, then future discovery ought to be volatile and quick as participants look to the nearest HVNodes for more favorable entry or exit.

Delta: An option’s exposure to the direction or underlying asset movement.

Gamma: The sensitivity of an option’s delta to changes in the underlying asset’s price.

Vanna: The rate at which the delta of an option changes with respect to implied volatility.

POCs: Areas where two-sided trade was most prevalent in a prior day session. Participants will respond to future tests of value as they offer favorable entry and exit.


About

The author, Renato Leonard Capelj, works in finance and journalism.

Capelj spends the bulk of his time at Physik Invest, an entity through which he invests and publishes free daily analyses to thousands of subscribers. The analyses offer him and his subscribers a way to stay on the right side of the market. Separately, Capelj is an options analyst at SpotGamma and an accredited journalist.

Capelj’s past works include conversations with investor Kevin O’Leary, ARK Invest’s Catherine Wood, FTX’s Sam Bankman-Fried, North Dakota Governor Doug Burgum, Lithuania’s Minister of Economy and Innovation Aušrinė Armonaitė, former Cisco chairman and CEO John Chambers, and persons at the Clinton Global Initiative.

Connect

Direct queries to renato@physikinvest.com. Find Physik Invest on TwitterLinkedInFacebook, and Instagram. Find Capelj on TwitterLinkedIn, and Instagram. Only follow the verified profiles.

Calendar

You may view this letter’s content calendar at this link.

Disclaimer

Do not construe this newsletter as advice. All content is for informational purposes. Capelj and Physik Invest manage their own capital and will not solicit others for it.

Categories
Commentary

Daily Brief For February 22, 2023

Physik Invest’s Daily Brief is read free by thousands of subscribers. Join this community to learn about the fundamental and technical drivers of markets.

Graphic updated 7:15 AM ET. Sentiment Neutral if expected /MES open is inside of the prior day’s range. /MES levels are derived from the profile graphic at the bottom of this letter. Click here for the latest levels. SqueezeMetrics Dark Pool Index (DIX) and Gamma (GEX) with the latter calculated based on where the prior day’s reading falls with respect to the MAX and MIN of all occurrences available. A higher DIX is bullish. The lower the GEX, the more (expected) volatility. Click to learn the implications of volatility, direction, and moneyness. Breadth reflects a reading of the prior day’s NYSE Advance/Decline indicator. The CBOE VIX Volatility Index (INDEX: VVIX) reflects the attractiveness of owning volatility. UMBS prices via MNDClick here for the economic calendar.

Fundamental

We look beyond all the doom-and-gloom narrative to the bond-equity divergence which JPMorgan Chase & Co’s (NYSE: JPM) Marko Kolanovic wrote about recently.

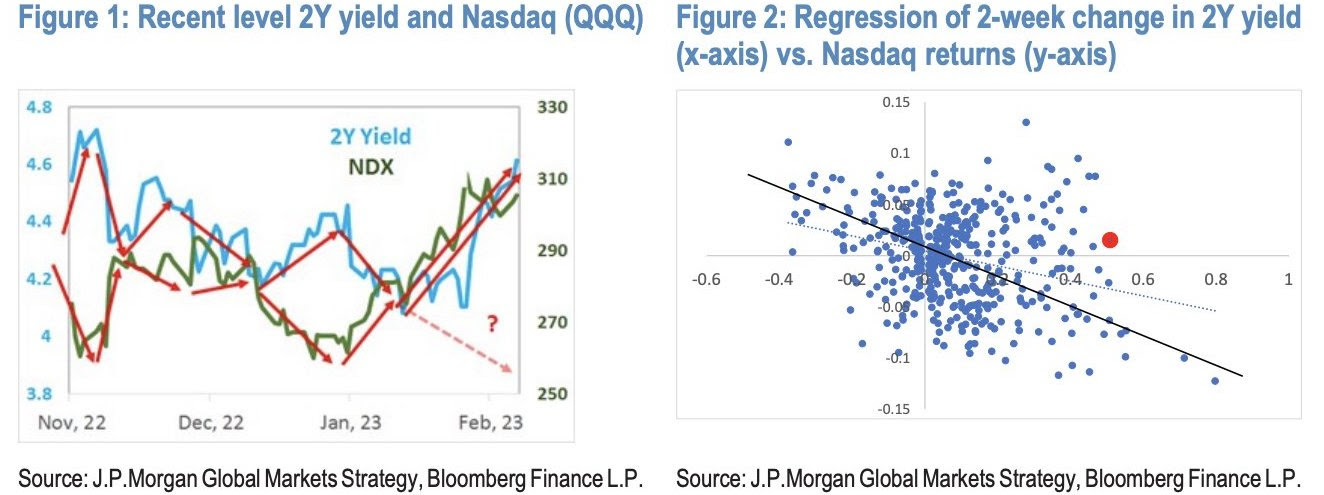
Essentially, regressions suggest the move in interest rates since the Federal Reserve’s (Fed) meeting earlier this month should have resulted in a 5-10% sell-off in the rate-sensitive Nasdaq. It didn’t. Per Kolanovic, “this divergence cannot go much further.”

Recall interest rates matter to discounted future cash flows. The higher rates are the, worse that is for equities, says Damped Spring’s Andy Constan well in an interview. 

Interest rates matter elsewhere as well. When interest rates increase, “a mortgage goes down in price by a greater amount than the bond because the expected maturity of the mortgage becomes longer. The magnitude of this unbalanced price volatility characteristic is measured by a financial statistic called ‘convexity.’” Managing this convexity can be problematic and force feedback loops, just as we talk about with options per the below. See here for more.

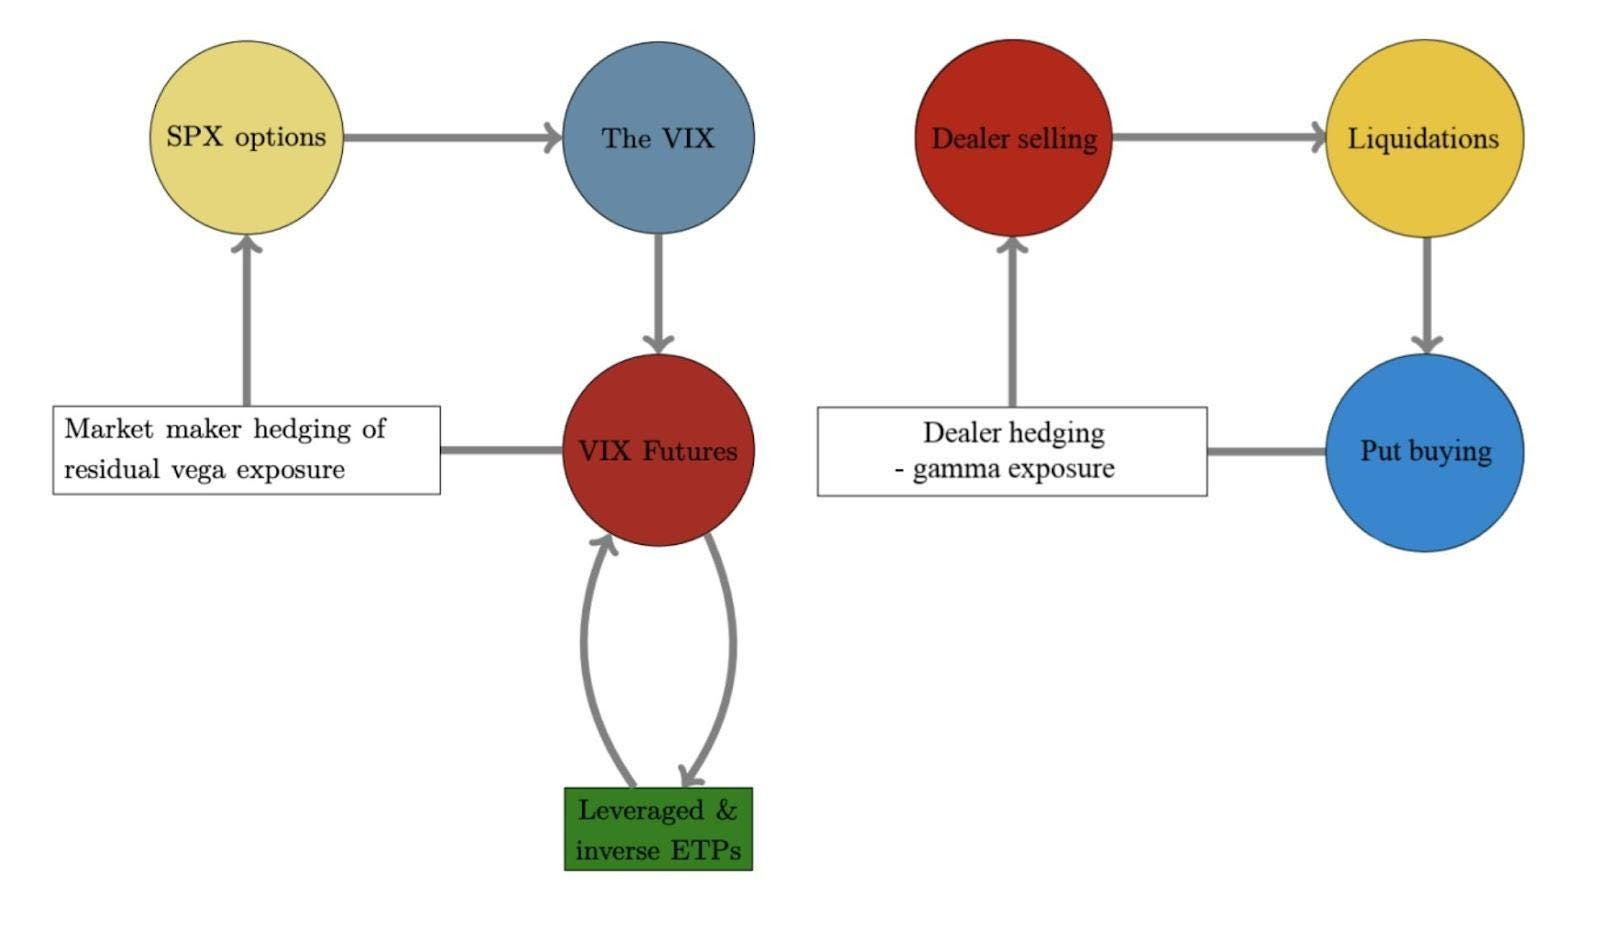
Graphic: The “Biggest tail risk to SPX isn’t any macro data/virus/war but its own options market.”

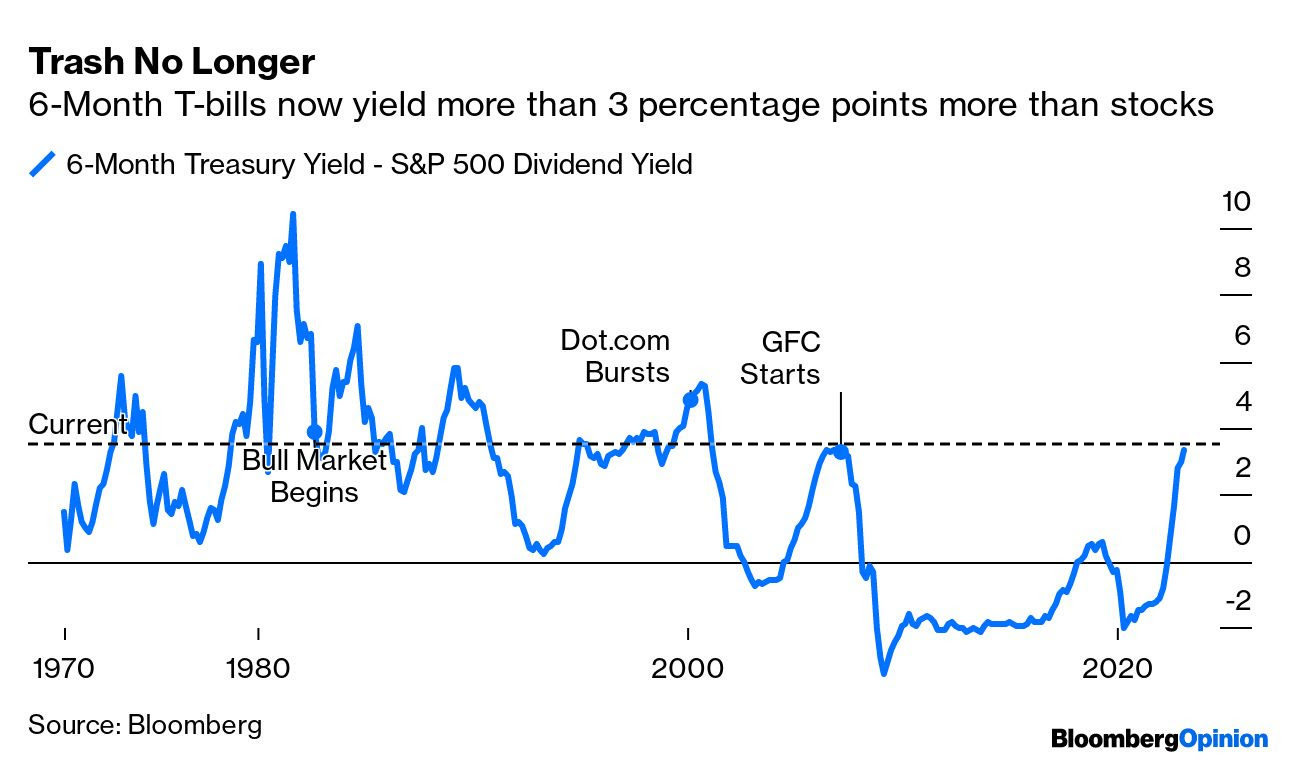
Kolanvoic ends: The “risk-reward of holding bonds at this level of short-term yields looks better than equity (earnings yield) than any time since the great financial crisis (i.e., the spread between 2y and equity earnings yield is at the lowest point since 2007).”

Graphic: Retrieved from JPMorgan Chase & Co (NYSE: JPM).

Positioning

This letter said there would be movement after last week’s options expirations (OpEx). 

To quote the February 15 letter, ignoring the “excellent” liquidity and traders buying S&P 500 (INDEX: SPX) “hand over fist,” OpEx would result in a decline in counterparty exposure to positive gamma (i.e., positive exposure to movement). Support from an options positioning perspective would decline, and counterparties would “do less to disrupt and more to bolster movement.”

That’s along the lines of what’s happening, though the movement appears orderly.

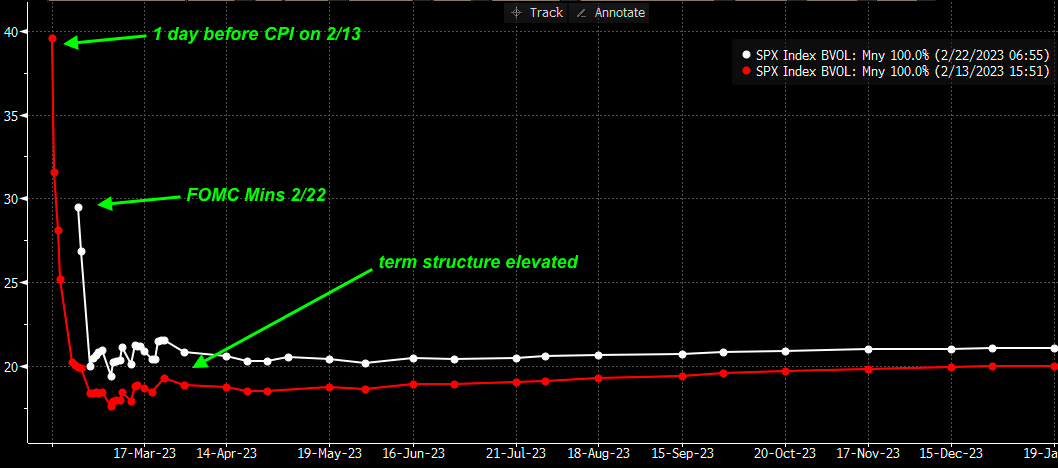
Per SpotGamma, “The selling appears contained, as evidenced by an upward trending [implied volatility or IVOL] term structure and light bid in topline measures of [IVOL] like the [Cboe Volatility Index (INDEX: VIX)].” Notwithstanding this light bid at the front of the term structure, there is no rush to protect, as would be evidenced by longer-dated IVOL shifting “materially higher as traders reset to lower equity valuations.”

Graphic: Retrieved from SpotGamma. “SPX term structure today vs 2/13 (day prior to CPI). Traders had higher vol expectations for CPI vs today’s FOMC minutes, but [the] term structure is now more elevated. Makes sense as SPX [is] -3% lower. However, the loss of stabilizing OPEX positioning, elevated IV, & flat gamma may lead to higher relative vol today.”

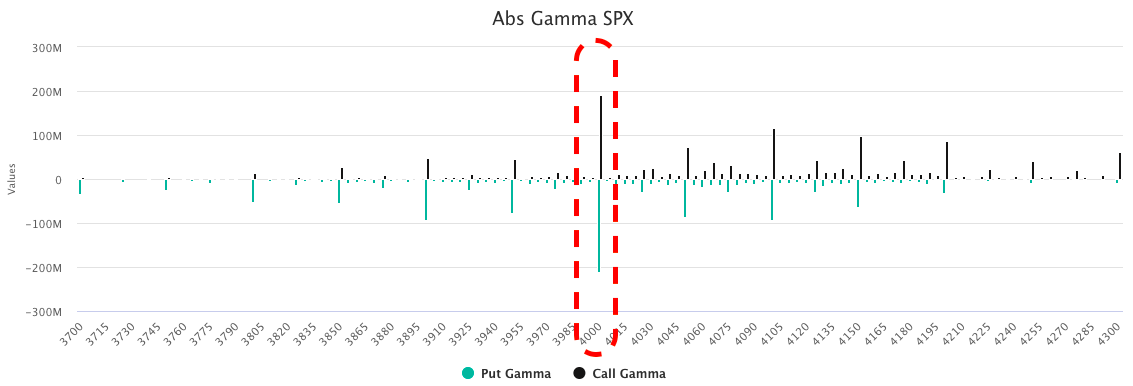
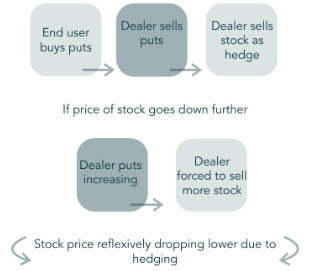
With there being many options positions concentrated near the $4,000.00 SPX area, markets may be at risk of accelerated selling. Below $4,000.00 traders desire to own predominantly puts, and this leaves counterparties “short puts and [] positive delta, as well as negative gamma and vega, meaning they lose money in an increasing way as the market trades lower and volatility increases.” To hedge, counterparties could sell futures or stocks into the decline. This accelerates selling.

Graphic: Retrieved from SpotGamma.

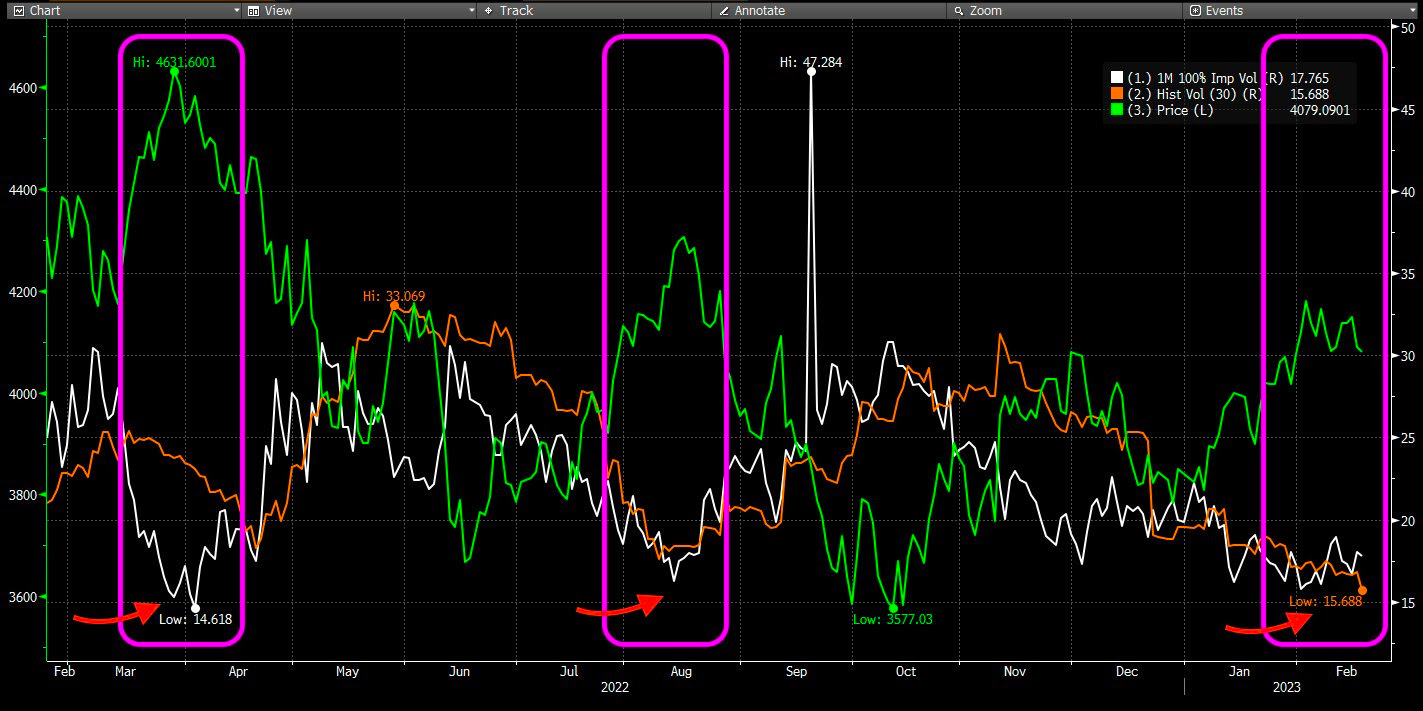
So, with a break of that big $4,000.00 level increasing risk that selling accelerates, the desire to protect will bid IVOL and the marginal impact of its expansion can do more damage than good that any marginal compression can do.

Graphic: Retrieved from SpotGamma. “IV has now compressed to levels associated with recent market tops. If realized vol (RV) declined, then IV could go lower. But, realized isn’t declining.”

In light of this, your letter writer leans negative delta, as well as positive gamma and vega. If the market trades lower, such a setup would make money in short.

Technical

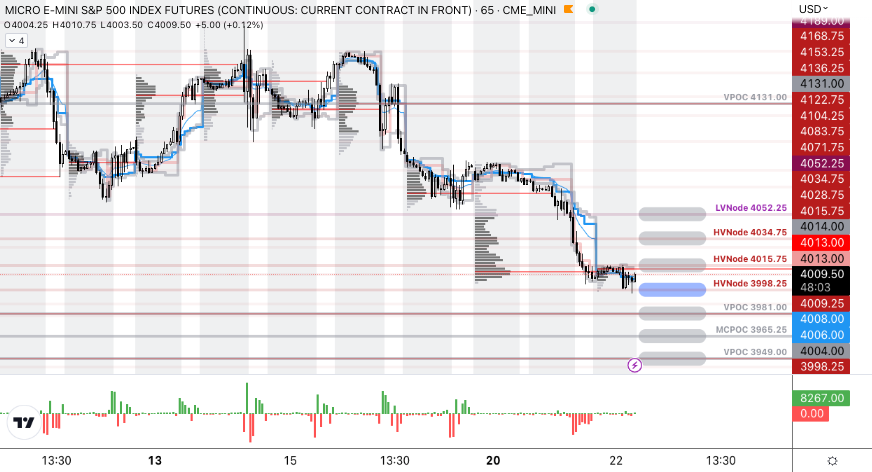
As of 7:15 AM ET, Wednesday’s regular session (9:30 AM – 4:00 PM ET), in the S&P 500, is likely to open in the middle part of a negatively skewed overnight inventory, inside of the prior day’s range, suggesting a limited potential for immediate directional opportunity.

The S&P 500 pivot for today is $3,998.25. 

Key levels to the upside include $4,015.75, $4,034.75, and $4,052.25.

Key levels to the downside include $3,981.00, $3,965.25, and $3,949.00.

Disclaimer: Click here to load the updated key levels via the web-based TradingView platform. New links are produced daily. Quoted levels likely hold barring an exogenous development.

Graphic: 65-minute profile chart of the Micro E-mini S&P 500 Futures.

Definitions

Volume Areas: Markets will build on areas of high-volume (HVNodes). Should the market trend for a period of time, this will be identified by a low-volume area (LVNodes). The LVNodes denote directional conviction and ought to offer support on any test.

If participants auction and find acceptance in an area of a prior LVNode, then future discovery ought to be volatile and quick as participants look to the nearest HVNodes for more favorable entry or exit.

Gamma: The sensitivity of an option’s Delta to changes in the underlying asset’s price.

CPOCs: Denote areas where two-sided trade was most prevalent over all sessions. Participants will respond to future tests of value as they offer favorable entry and exit.

POCs: Areas where two-sided trade was most prevalent in a prior day session. Participants will respond to future tests of value as they offer favorable entry and exit.

MCPOCs: Denote areas where two-sided trade was most prevalent over numerous sessions. Participants will respond to future tests of value as they offer favorable entry and exit.

Inversion Of VIX Futures Term Structure: Longer-dated VIX expiries are less expensive; is a warning of elevated near-term risks for equity market stability.


About

The author, Renato Leonard Capelj, works in finance and journalism.

Capelj spends the bulk of his time at Physik Invest, an entity through which he invests and publishes free daily analyses to thousands of subscribers. The analyses offer him and his subscribers a way to stay on the right side of the market. Separately, Capelj is an options analyst at SpotGamma and an accredited journalist.

Capelj’s past works include conversations with investor Kevin O’Leary, ARK Invest’s Catherine Wood, FTX’s Sam Bankman-Fried, North Dakota Governor Doug Burgum, Lithuania’s Minister of Economy and Innovation Aušrinė Armonaitė, former Cisco chairman and CEO John Chambers, and persons at the Clinton Global Initiative.

Connect

Direct queries to renato@physikinvest.com. Find Physik Invest on TwitterLinkedInFacebook, and Instagram. Find Capelj on TwitterLinkedIn, and Instagram. Only follow the verified profiles.

Calendar

You may view this letter’s content calendar at this link.

Disclaimer

Do not construe this newsletter as advice. All content is for informational purposes. Capelj and Physik Invest manage their own capital and will not solicit others for it.

Categories
Commentary

Daily Brief For February 21, 2023

Physik Invest’s Daily Brief is read free by thousands of subscribers. Join this community to learn about the fundamental and technical drivers of markets.

Graphic updated 9:05 AM ET. Sentiment Risk-Off if expected /MES open is below the prior day’s range. /MES levels are derived from the profile graphic at the bottom of this letter. Click here for the latest levels. SqueezeMetrics Dark Pool Index (DIX) and Gamma (GEX) with the latter calculated based on where the prior day’s reading falls with respect to the MAX and MIN of all occurrences available. A higher DIX is bullish. The lower the GEX, the more (expected) volatility. Click to learn the implications of volatility, direction, and moneyness. Breadth reflects a reading of the prior day’s NYSE Advance/Decline indicator. The CBOE VIX Volatility Index (INDEX: VVIX) reflects the attractiveness of owning volatility. UMBS prices via MNDClick here for the economic calendar.

Fundamental

Some big ideas/themes to mull as we leg into this week’s letters. Have a great day!


Investors are facing a big adjustment as a consequence of post-pandemic geopolitics and the race for control of physical things. Typical responses, like adjusting demands structurally to meet supply, are no longer optimal. Bailouts and zero-interest policies are what entered us into this cycle of inflation and geopolitical instability. What’s more optimal are fiscally-funded policies.

“The outcome of [quantitative easing or QE] was obvious and inevitable,” economist Dr. Pippa Malmgren explained in a letter. “The decline of interest rates to nothing and the return of inflation … destabilize[d] emerging markets and cause[d] governments to race for control over supply chains of food and energy.” As Credit Suisse Group’s (NYSE: CS) Zoltan Pozsar said in December, “whoever encumbers commodities and controls the factories rules inflation, whoever rules inflation controls interest rates, and whoever controls interest rates controls the level of the stock market and financial wealth more generally.”

Accordingly, policymakers’ new way to push cash into the economy is defense spending. Malmgren explained that this new fiscally funded QE if we will, is not subject to audits and falls under the guise of “civilian tech” innovation which “we are seeing the results of” in the air, space, and sea. Take, for instance, headlines on undersea internet cable and gas line disruptions, as well as the likes of Amazon Inc (NASDAQ: AMZN) and Starlink heading to space to provide satellite-based WiFi (which can be used for “strategic support” during operations), and China pulling satellites out of orbit.

“[W]e cannot see what’s going on in the graveyard of space,” Malmgren added, noting that the 200-foot balloons drifting over the West reveal the US is “already at war” and knocks the notion leaders “could be at war without the public needing to know about it.” China understands what Malmgren called leverage ratios. Flyovers with jets may work in Taiwan but not in the US. It “would invite an overwhelming response, … [while] balloons seem so innocuous,” just as the Japanese Sky Lanterns appeared during WWII, Malmgren detailed in another letter. In the Sky Lantern case, though many of the balloons “were found unexploded,” some blew; one took out power to “the very nuclear reactor that happened to generate the plutonium that would later be used in the Nagasaki nuclear bomb.”

Perhaps the Chinese balloons are intended to deliver payloads and, “like in the 1940s, we are already at such an advanced stage of confrontation amongst the superpowers that the job of the military is not so much to respond to the balloons as it is to prevent public panic.” As validation, one may look to the very little alarm over military activities in the Pacific, as well as “China and the US … trying to move on from the [balloon] dispute,” Bloomberg reported last week.

“It is as if the Western military establishment learned a great lesson from having underestimated President Putin” who just suspended the New START treaty with the US. Now, with reports that China is readying for an attack on Taiwan by 2027, the US “has shifted from holding exercises to engaging in mission rehearsals … [which] increase confidence in the twenty-year-olds who will be actually conducting warfighting.”

Anyways, a product of “The Invisible War,” as Malmgren calls it, is this painful divorce and will intensify the decoupling after the world hit a “limit of economic integration in 2006 or 2007,” Noah Smith put in a recent letter. With estimates that two years of global GDP growth could be wiped by a decoupling, Smith added, “we should be thinking about how to shape the next wave of globalization in a way that encourages global economic growth while also providing security to ourselves and our allies.” Malmgren ends: “The markets won’t like all this.”

Though there may be a dip in inflation in the interim resulting in a pivot and relief in markets, the prospects of inflation resurfacing, potentially with vengeance, are up, and this has negative implications on traditional portfolio constructions as this letter started with, today. Therefore, investors should consider adding exposure to cash, bonds, and commodities, as this letter quoted Pozsar explaining before.

Technical

As of 9:00 AM ET, Tuesday’s regular session (9:30 AM – 4:00 PM ET), in the S&P 500, is likely to open in the lower part of a negatively skewed overnight inventory, outside of the prior day’s range, suggesting a potential for immediate directional opportunity.

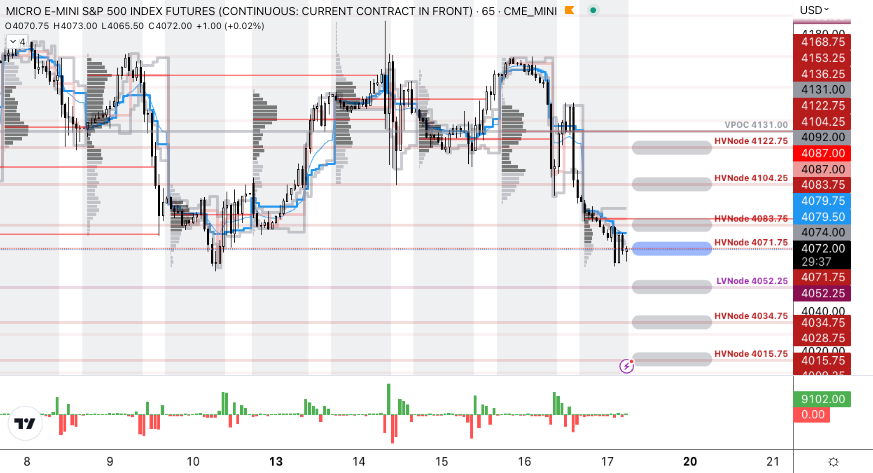
The S&P 500 pivot for today is $4,052.25. 

Key levels to the upside include $4,071.75, $4,083.75, and $4,104.25.

Key levels to the downside include $4,034.75, $4,015.75, and $3,998.25.

Disclaimer: Click here to load the updated key levels via the web-based TradingView platform. New links are produced daily. Quoted levels likely hold barring an exogenous development.

Graphic: 65-minute profile chart of the Micro E-mini S&P 500 Futures.

Definitions

Volume Areas: Markets will build on areas of high-volume (HVNodes). Should the market trend for a period of time, this will be identified by a low-volume area (LVNodes). The LVNodes denote directional conviction and ought to offer support on any test.

If participants auction and find acceptance in an area of a prior LVNode, then future discovery ought to be volatile and quick as participants look to the nearest HVNodes for more favorable entry or exit.


About

The author, Renato Leonard Capelj, works in finance and journalism.

Capelj spends the bulk of his time at Physik Invest, an entity through which he invests and publishes free daily analyses to thousands of subscribers. The analyses offer him and his subscribers a way to stay on the right side of the market. Separately, Capelj is an options analyst at SpotGamma and an accredited journalist.

Capelj’s past works include conversations with investor Kevin O’Leary, ARK Invest’s Catherine Wood, FTX’s Sam Bankman-Fried, North Dakota Governor Doug Burgum, Lithuania’s Minister of Economy and Innovation Aušrinė Armonaitė, former Cisco chairman and CEO John Chambers, and persons at the Clinton Global Initiative.

Connect

Direct queries to renato@physikinvest.com. Find Physik Invest on TwitterLinkedInFacebook, and Instagram. Find Capelj on TwitterLinkedIn, and Instagram. Only follow the verified profiles.

Calendar

You may view this letter’s content calendar at this link.

Disclaimer

Do not construe this newsletter as advice. All content is for informational purposes. Capelj and Physik Invest manage their own capital and will not solicit others for it.
Categories
Commentary

Daily Brief For February 17, 2023

Physik Invest’s Daily Brief is read by thousands of subscribers. You, too, can join this community to learn about the fundamental and technical drivers of markets.

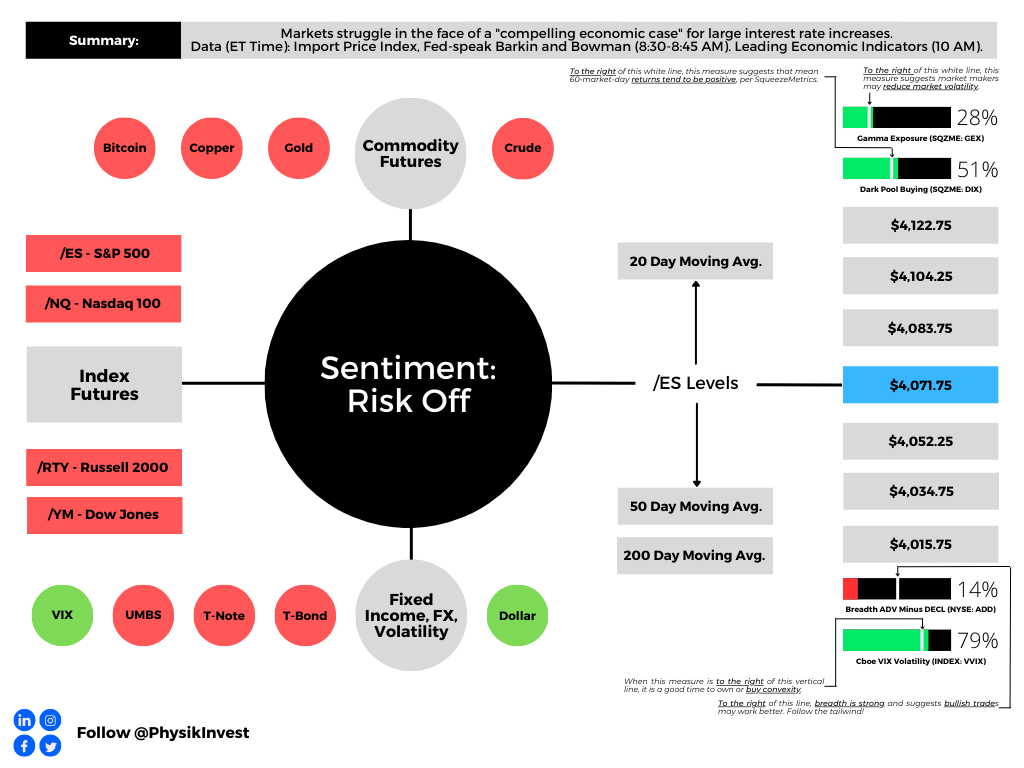
Graphic updated 6:30 AM ET. Sentiment Risk-Off if expected /ES open is below the prior day’s range. /ES levels are derived from the profile graphic at the bottom of this letter. Click here for the latest levels. SqueezeMetrics Dark Pool Index (DIX) and Gamma (GEX) with the latter calculated based on where the prior day’s reading falls with respect to the MAX and MIN of all occurrences available. A higher DIX is bullish. At the same time, the lower the GEX, the more (expected) volatility. Click to learn the implications of volatility, direction, and moneyness. Breadth reflects a reading of the prior day’s NYSE Advance/Decline indicator. The CBOE VIX Volatility Index (INDEX: VVIX) reflects the attractiveness of owning volatility. UMBS via MNDClick here for the calendar.

Administrative

The plan was to have a talk about big geopolitical themes but, in tying some loose ends and keeping with the spirit of the options-induced armageddon narrative, we push this to next week. Have a great weekend!

Positioning

Despite maintaining that markets are potentially due for weakness, Kai Volatility’s Cem Karsan brought up some interesting points, yesterday.

Essentially, despite liquidity coming off the table and increased competition between equities and fixed income, hence big bond inflows and equity outflows, if the “market consolidates and doesn’t break,” the delta buy-back with respect to dropping implied volatility (IVOL) or vanna and buy-back with respect to the passage of time or charm could build a platform for a FOMO-driven call buying rally that ends in a blow-off.

Graphic: Retrieved from Bloomberg. “US stocks have a new competitor: cash. For more than a decade, the only real virtue of leaving money on deposit has been optionality. It means you can jump quickly on opportunities as they arise. But now it offers a competitive yield.”

The signs of this “more combustible situation” would likely show when “volatility is sticky into a rally,” adds Karsan. To gauge combustibility, look to the options market.

Remember calls trade at a lower IVOL than puts. As the market trades higher, it slides to a lower IVOL, and that’s reflected by broad IVOL measures. If broad IVOL measures are sticky/bid, “that’s an easy way to say that fixed-strike volatility is coming up and, if that can happen for days, that can unpin volatility and create a situation where dealers themselves are no longer [own] a ton of volatility; they start thinning out on volatility themselves, and that creates a more combustible situation.”

To explain the “thinning out” part of the last paragraph, recall participants often opt to own equity and downside (put) protection financed, in part, with sales of upside (call) protection. If there’s more demand for calls, that will result in counterparties taking on more exposure against movement (i.e., negative gamma) hedged via purchases of the underlying. Once that exposure expires and/or decays, that dealer-based support will be withdrawn. If the assumption is that equity markets are expensive now, then, after another rally, there may be more room to fall, all else equal (a simplistic way to look at this), hence the increased precariousness and combustibility.

Technical

As of 6:30 AM ET, Friday’s regular session (9:30 AM – 4:00 PM ET), in the S&P 500, is likely to open in the lower part of a negatively skewed overnight inventory, far outside of the prior day’s range (i.e., a lot of shock and range expansion already happened), suggesting a higher than normal potential for immediate directional opportunity.

The S&P 500 pivot for today is $4,071.75. 

Key levels to the upside include $4,083.75, $4,104.25, and $4,122.75.

Key levels to the downside include $4,052.25, $4,034.75, and $4,015.75.

Disclaimer: Click here to load the updated key levels via the web-based TradingView platform. New links are produced daily. Quoted levels likely hold barring an exogenous development.

Graphic: 65-minute profile chart of the Micro E-mini S&P 500 Futures.

Definitions

Volume Areas: Markets will build on areas of high-volume (HVNodes). Should the market trend for a period of time, this will be identified by a low-volume area (LVNodes). The LVNodes denote directional conviction and ought to offer support on any test.

If participants auction and find acceptance in an area of a prior LVNode, then future discovery ought to be volatile and quick as participants look to the nearest HVNodes for more favorable entry or exit.

Gamma: The sensitivity of an option’s Delta to changes in the underlying asset’s price.

Vanna: The rate at which the Delta of an option changes with respect to implied volatility.

Charm: The rate at which the Delta of an option changes with respect to time.


About

The author, Renato Leonard Capelj, works in finance and journalism.

Capelj spends the bulk of his time at Physik Invest, an entity through which he invests and publishes free daily analyses to thousands of subscribers. The analyses offer him and his subscribers a way to stay on the right side of the market. Separately, Capelj is an options analyst at SpotGamma and an accredited journalist.

Capelj’s past works include conversations with investor Kevin O’Leary, ARK Invest’s Catherine Wood, FTX’s Sam Bankman-Fried, Lithuania’s Minister of Economy and Innovation Aušrinė Armonaitė, former Cisco chairman and CEO John Chambers, and persons at the Clinton Global Initiative.

Connect

Direct queries to renato@physikinvest.com or find Physik Invest on TwitterLinkedInFacebook, and Instagram.

Calendar

You may view this letter’s content calendar at this link.

Disclaimer

Do not construe this newsletter as advice. All content is for informational purposes.

Categories
Commentary

Daily Brief For February 16, 2023

Physik Invest’s Daily Brief is read by thousands of subscribers. You, too, can join this community to learn about the fundamental and technical drivers of markets.

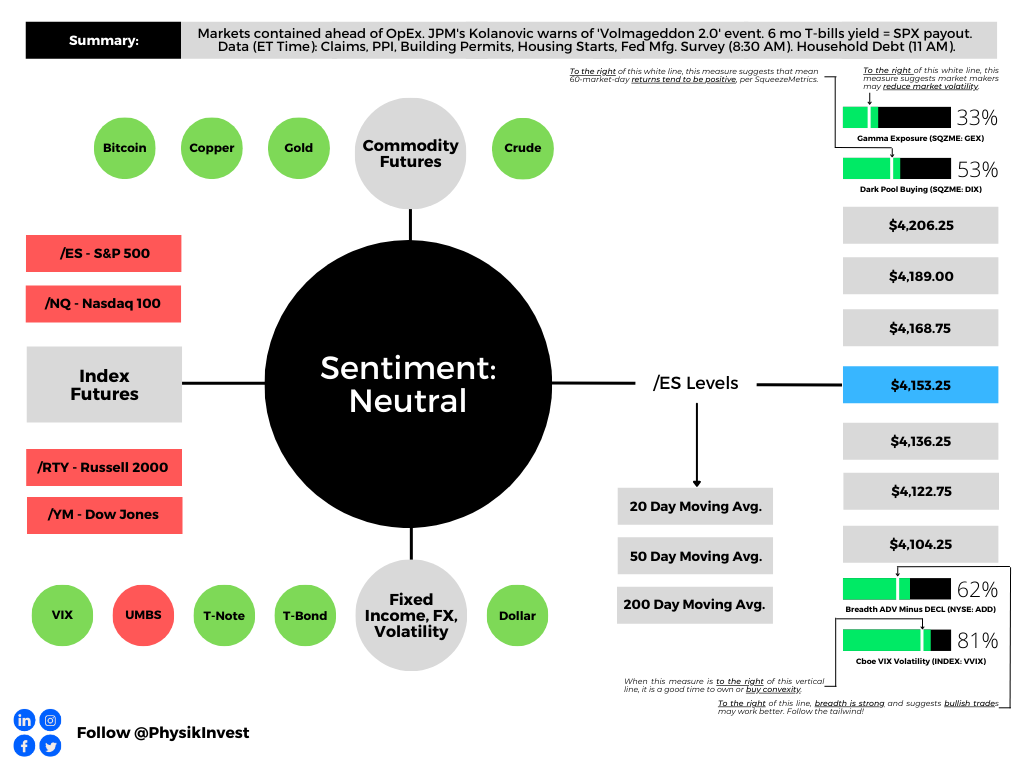
Graphic updated 6:15 AM ET. Sentiment Neutral if expected /ES open is inside of the prior day’s range. /ES levels are derived from the profile graphic at the bottom of this letter. Click here for the latest levels. SqueezeMetrics Dark Pool Index (DIX) and Gamma (GEX) with the latter calculated based on where the prior day’s reading falls with respect to the MAX and MIN of all occurrences available. A higher DIX is bullish. At the same time, the lower the GEX, the more (expected) volatility. Click to learn the implications of volatility, direction, and moneyness. Breadth reflects a reading of the prior day’s NYSE Advance/Decline indicator. The CBOE VIX Volatility Index (INDEX: VVIX) reflects the attractiveness of owning volatility. UMBS price via MNDClick here for the calendar.

Positioning

In the news is quite a bit of noise surrounding ultra-short-dated options with little time to expiry. To quote Nomura Holdings Inc’s (NYSE: NMR) Charlie McElligott, the trading of these options is adding noise; “US equities are such an untradable mess right now.” 

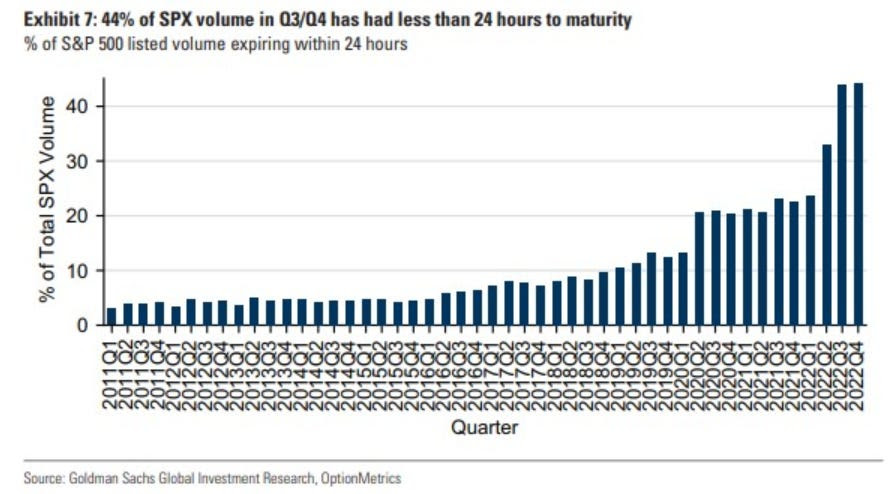
However, your letter writer, who mainly trades complex spreads on the cash-settled indexes, thinks there has never been a better time to trade. Ultra-short-dated options enable you to express your opinion in more efficient ways. Additionally, the trade of these options, in the aggregate, can influence market movements, and this is added opportunity if you understand it.
Graphic: Retrieved from Goldman Sachs Group Inc (NYSE: GS) via Bloomberg.

Darrin Johnson, a volatility trader, recently discussed sharp ways to use these options.

Heading into some big events this week, John noted S&P 500 (INDEX: SPX) implied volatility (IVOL) was trading at ~25% on a five-day straddle. Traders could buy this structure while, in the interim, selling other structures like it “against CPI, Retail Sales, and PPI” where IVOL was higher. This would enable you to lower the cost of having positive exposure to movement or positive gamma via the five-day straddle, though this is operating on the premise “that Friday’s volatility will hold mostly steady, while the other 3 deflate.”

Moreover, the ultra-short-dated options are palatable if we will, and other traders, potentially much bigger in size, are observant of this too. The growing interest in these products (e.g., in the second half of last year, ultra-short-dated options made up more than 40% of the S&P 500’s trading volume) is growing in impact on underlying products like the SPX.

In fact, JPMorgan Chase & Co’s (NYSE: JPM) Peng Cheng found these options have an impact that “can vary from a drag of as much as 0.6% to a boost of up to 1.1%.” 

To explain, though as of late options counterparties may be playing a smaller role as “customers have taken equal and opposite sides” of positions, per SqueezeMetrics, we can naively look at there being a pool of liquidity to absorb the demand for these ultra-short-dated options which are very sensitive to time, price, and volatility. These increased sensitivities are hedged in a way that impacts this available pool of liquidity. If the trade or impact is large enough, it is transmitted onto underlying market prices. 

For instance, consider so-called meme mania and stocks like GameStop Corporation (NYSE: GME) that rocketed as traders’ interest in short-dated options demands rose. To hedge increased demand in call options, for instance, counterparties must buy the underlying stock. This demand boosts the stock.

Likewise, if traders’ consensus is that markets won’t move much until some large macroeconomic events, then their bets against market movement (i.e., sell ultra-short-dated options) will result in counterparties having more exposure to bets on market movement (i.e., positive gamma) which they will hedge in a way that reduces market movement (i.e., buy weakness or sell strength in the underlying stock). So, if traders bet against the movement, resulting in more counterparty positive gamma, then market movement is reduced due to the reaction to this positioning.

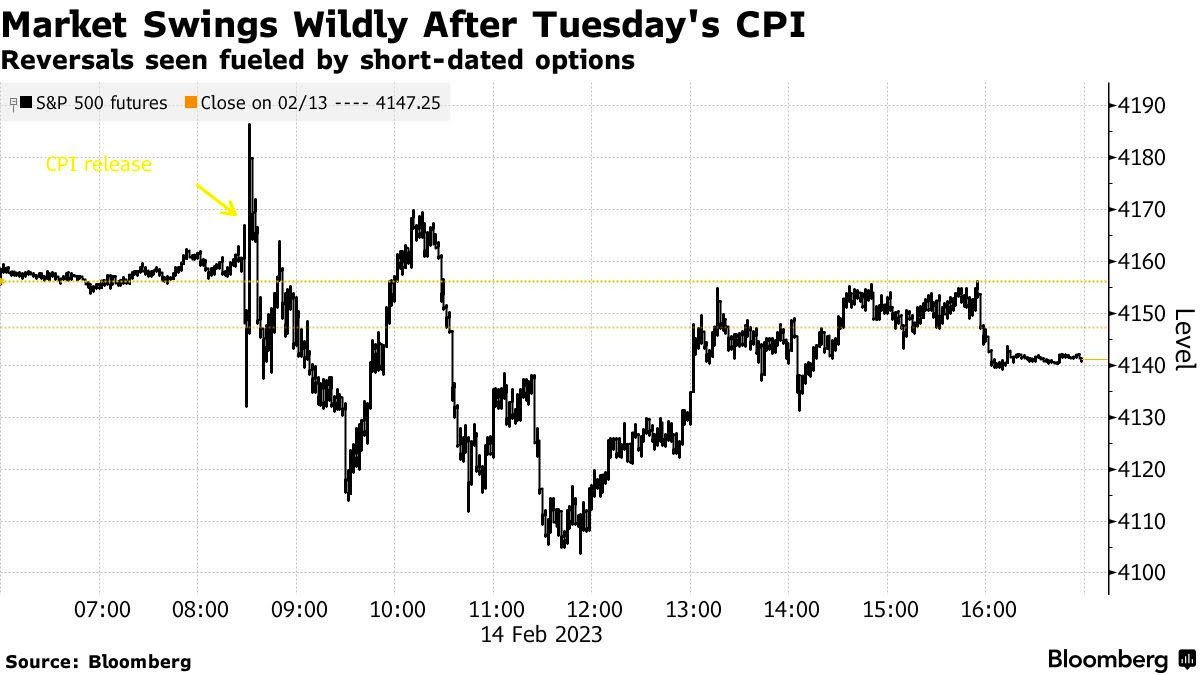
On the other hand, if traders’ consensus is that markets may move a lot, particularly to the downside, their bets on market movement (e.g., buy ultra-short-dated put) will result in counterparties having more exposure to bets against market movement (i.e., negative gamma). This demand for protection will bid options prices, particularly at the front-end of the IVOL term structure as counterparties price this demand in, and the counterparty will sell underlying to hedge. If fears are assuaged and traders no longer demand these bets on market movements, the counterparty can unwind their hedge which, in the put buying example provided, may provide a market boost, such as that which we saw immediately following the release of consumer price updates (CPI) this week; to quote Bloomberg, “[w]hen the worst didn’t happen, these hedges were unwound, helping propel a recovery in futures. It’s partly why the Cboe Volatility Index, or VIX, dropped 7% in a seemingly outsize reaction in a market when the S&P 500 ended the session basically flat.”

Graphic: Retrieved from Bloomberg.

Additionally, the re-hedging-inspired recovery was short-lived as well; the impact of ultra-short-dated options, as this letter has stated before, is short-dated. It, too, does much less to influence measures like the Cboe Volatility Index (INDEX: VIX), a floating measure of ~30 day-to-expiry SPX options trading at a fixed-strike IVOL, though it does have an impact. Thus, the dis-interest to hedge stocks traders do not own (or hedge further stocks that may be hedged) out in time, does less to boost the VIX.

Anyways, in January, your letter writer interviewed The Ambrus Group’s co-CIO Kris Sidial about major risks to markets in 2023, as well as reasons why volatility could outperform in 2023 and beyond. Some of the information in that Benzinga interview made it into this newsletter in the days following its release. 

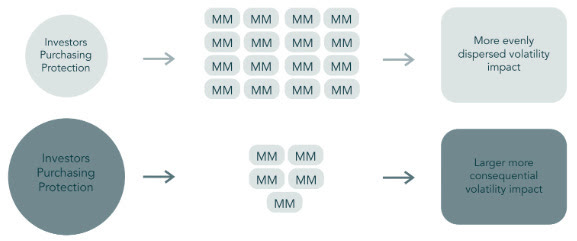
Basically, the SPX and VIX complexes are growing and, on the other side, are a small concentrated group of market makers taking on far more exposure to risk. 

Graphic: Retrieved from Ambrus’ publicly available research.

During moments of stress, as we’ve seen in the past with GME for example, options counterparties may be unable to keep up with the demands of investors, so you get a reflexive dynamic that helps push the stock higher. “That same dynamic can happen on the way down”; counterparties will mark up options prices during intense selling. As the options prices rise, options deltas (i.e., their exposure to direction) rise and this prompts so-called bearish vanna counterparty hedging flows in the underlying.

“Imagine a scenario where [some disaster happens] and everybody starts buying 0 DTE puts. That’s going to reflexively drive the S&P lower,” Sidial said. “Take, for example, the JPMorgan collar position that clearly has an effect on the market, and people are starting to understand that effect. That’s just one fund. Imagine the whole derivative ecosystem” leaning one way.

Graphic: Retrieved from Ambrus’ publicly available research.

Well, that’s what JPM’s Marko Kolanovic just said is a major risk and could exacerbate market volatility. “While history doesn’t repeat, it often rhymes,” he explained, noting that the trade of ultra-short-dated options portends a Volmageddon 2.0. If you recall, in 2018, Volmageddon 1.0 turned successful long-running short-volatility trades on their head when traders who were betting against big movements in the market saw their profits erode in days.

Further, to conclude this section since your letter writer is running short on time, as Sidial said, “if you’re trading volatility, let there be an underlying catalyst for doing so.” From a “risk-to-reward perspective, … it’s a better bet to be on the long volatility side,” given “that there are so many things that … keep popping up” from a macro perspective. Check out our letters from the past weeks where we talked about protecting profits (e.g., sell call vertical to finance and buy a put vertical with a lot of time to expiry).

For Ambrus’ publicly available research, click here. Also, follow Sidial on Twitter, here. Consider reading your letter writer’s past two conversations with Sidial, as well. Here is an article on 2021 and the meme stock debacle. Here is another article talking more about Ambrus’ processes.

Technical

As of 6:15 AM ET, Thursday’s regular session (9:30 AM – 4:00 PM ET), in the S&P 500, is likely to open in the lower part of a balanced overnight inventory, inside of the prior day’s range, suggesting a limited potential for immediate directional opportunity.

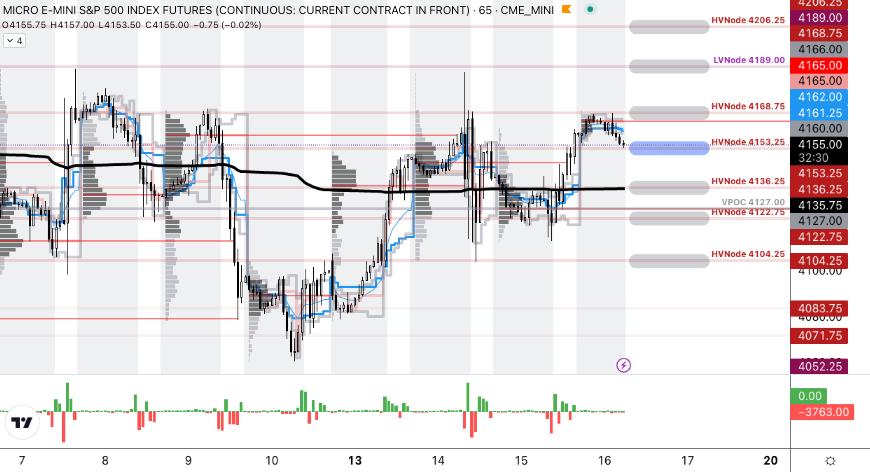
The S&P 500 pivot for today is $4,153.25. 

Key levels to the upside include $4,168.75, $4,189.00, and $4,206.25.

Key levels to the downside include $4,136.25, $4,122.75, and $4,104.25.

Disclaimer: Click here to load the updated key levels via the web-based TradingView platform. New links are produced daily. Quoted levels likely hold barring an exogenous development.

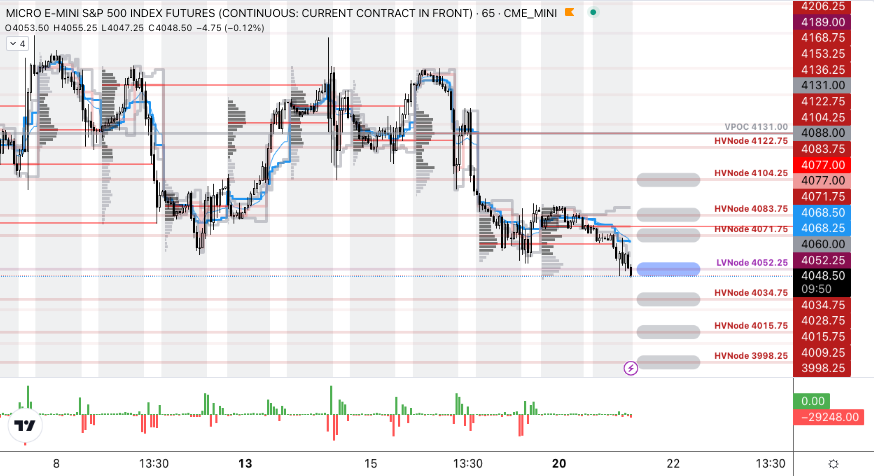
Graphic: 65-minute profile chart of the Micro E-mini S&P 500 Futures.

Definitions

Volume Areas: Markets will build on areas of high-volume (HVNodes). Should the market trend for a period of time, this will be identified by a low-volume area (LVNodes). The LVNodes denote directional conviction and ought to offer support on any test.

If participants auction and find acceptance in an area of a prior LVNode, then future discovery ought to be volatile and quick as participants look to the nearest HVNodes for more favorable entry or exit.
POCs: Areas where two-sided trade was most prevalent in a prior day session. Participants will respond to future tests of value as they offer favorable entry and exit.


About

The author, Renato Leonard Capelj, works in finance and journalism.

Capelj spends the bulk of his time at Physik Invest, an entity through which he invests and publishes free daily analyses to thousands of subscribers. The analyses offer him and his subscribers a way to stay on the right side of the market. Separately, Capelj is an options analyst at SpotGamma and an accredited journalist.

Capelj’s past works include conversations with investor Kevin O’Leary, ARK Invest’s Catherine Wood, FTX’s Sam Bankman-Fried, Lithuania’s Minister of Economy and Innovation Aušrinė Armonaitė, former Cisco chairman and CEO John Chambers, and persons at the Clinton Global Initiative.

Connect

Direct queries to renato@physikinvest.com or find Physik Invest on TwitterLinkedInFacebook, and Instagram.

Calendar

You may view this letter’s content calendar at this link.

Disclaimer

Do not construe this newsletter as advice. All content is for informational purposes.

Categories
Commentary

Daily Brief For February 15, 2023

Physik Invest’s Daily Brief is read by thousands of subscribers. You, too, can join this community to learn about the fundamental and technical drivers of markets.

Graphic updated 8:30 AM ET. Sentiment Neutral if expected /ES open is inside of the prior day’s range. /ES levels are derived from the profile graphic at the bottom of this letter. Click here for the latest levels. SqueezeMetrics Dark Pool Index (DIX) and Gamma (GEX) with the latter calculated based on where the prior day’s reading falls with respect to the MAX and MIN of all occurrences available. A higher DIX is bullish. At the same time, the lower the GEX, the more (expected) volatility. Click to learn the implications of volatility, direction, and moneyness. Breadth reflects a reading of the prior day’s NYSE Advance/Decline indicator. The CBOE VIX Volatility Index (INDEX: VVIX) reflects the attractiveness of owning volatility. UMBS price via MNDClick here for the calendar.

Fundamental

Consumer price updates (CPI) have traders pricing (even) higher rates for longer.

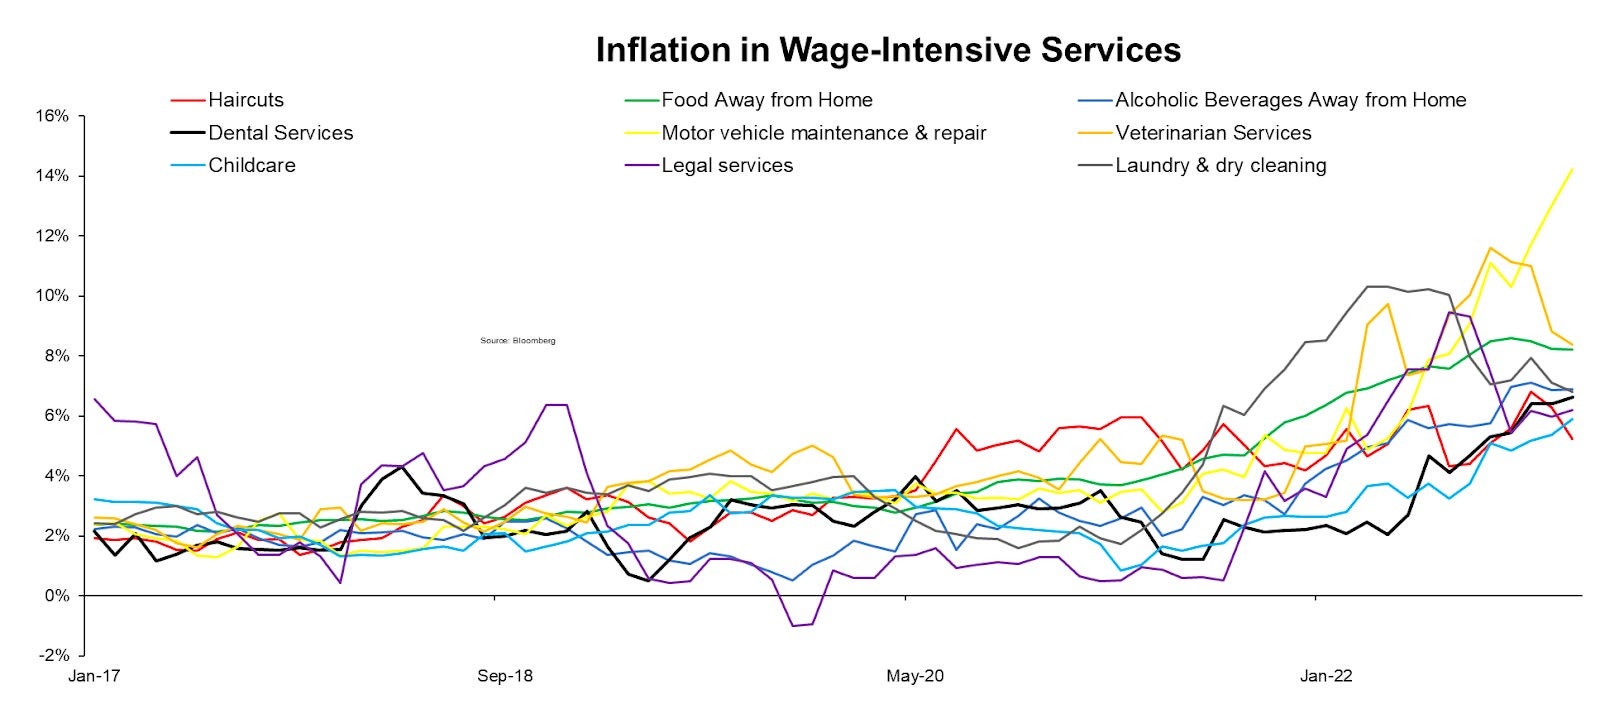
Yesterday’s data showed goods deflation is underway while services inflation persists. Per Unlimited’s Bob Elliott, “the picture of inflation for the Fed today is considerably less sanguine than at the last meeting.”

Graphic: Retrieved from @VincentDeluard. “The most important indices are the prices of wage-intensive services: haircuts, childcare, dentists, lawyers. With the exception of garages (crazy inflation), they all converge towards  6.5 – 7% YoY and 0.4%-0.5% MoM. That is the true long-term inflation.”

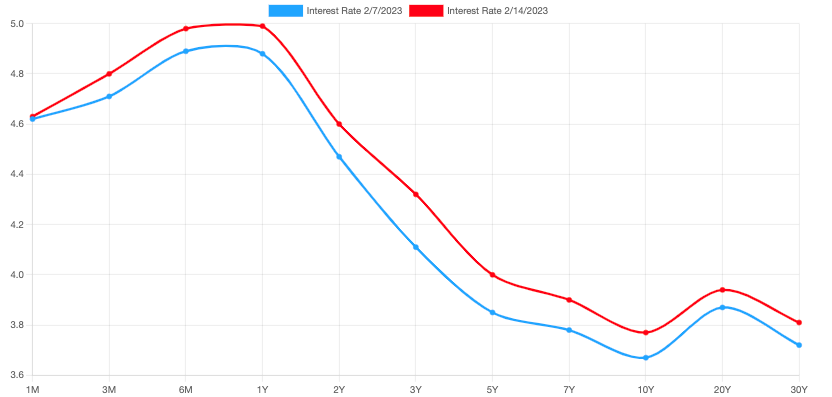
This new data confirms the hawkishness expressed by the Federal Reserve’s (Fed) Jerome Powell last week. US Treasury interest rates shifted higher, accordingly.

Graphic: Retrieved from ustreasuryyieldcurve.com.

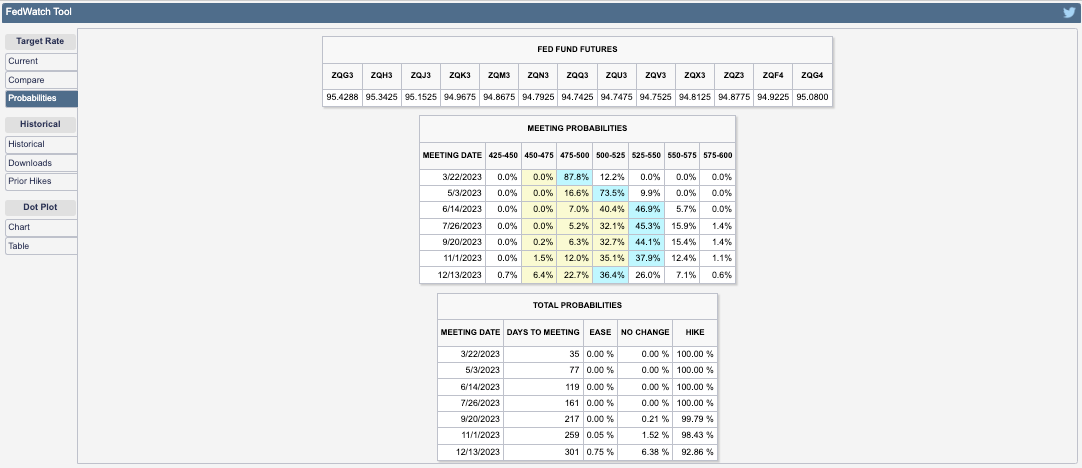
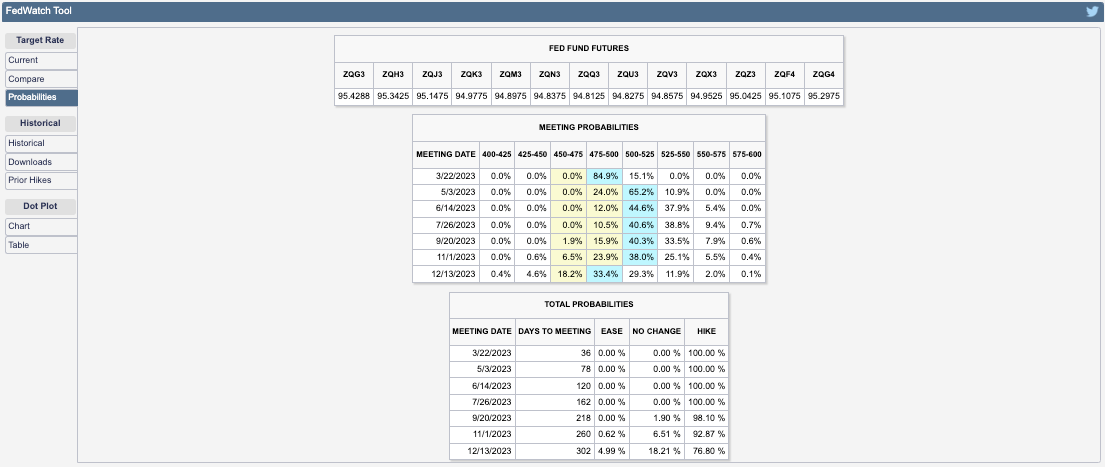
CME Group Inc’s (NASDAQ: CME) FedWatch Tool places the terminal rate at 5.25-5.50%, up from 5.00-5.25% on Tuesday before the CPI release. Easing is set to happen this year still in the November-December timeframe.

Graphic: Retrieved from CME Group Inc’s (NASDAQ: CME) website.

Recall “a higher interest rate environment implies a more potent” monetary tightening and heavier flow of capital out of capital markets (i.e., quantitative tightening or QT), to quote former Fed trader Joseph Wang.

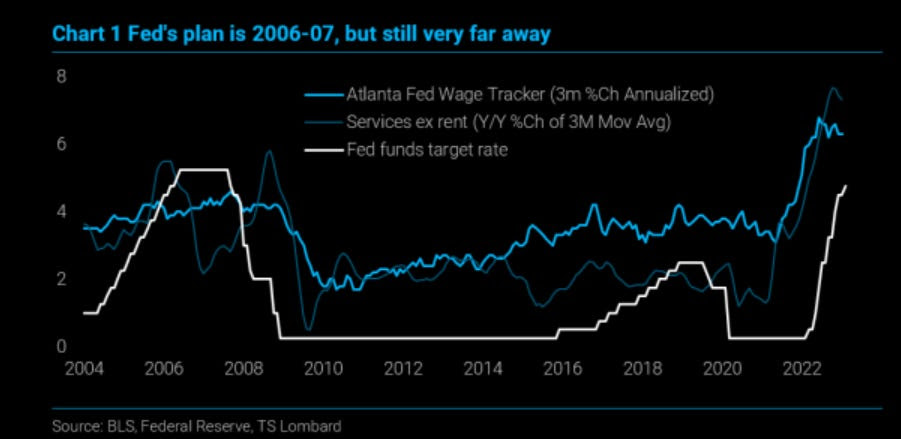
The pressure from the sale of assets (e.g., USTs, MBSs) will increase interest rates and move yield-seeking market participants out of risk, hence the expectation that pressure persists on equities in 2023

Graphic: Retrieved from TS Lombard. “Without a recession, the disinflation from the 2021 slowdown ends sometime soon, setting up for a re-acceleration later this year. Not to 8%, but high enough for the Fed to rue its choice of slowing rate hikes when it did.”

In other words, processes like QT manifest themselves as less demand for assets. Per Fabian Wintersberger, central bankers must “recycle bonds into the markets on an unprecedented scale, which could easily lead to lower bond prices/higher yields” causing a “reflux of capital to safe-haven assets, like treasuries.” 

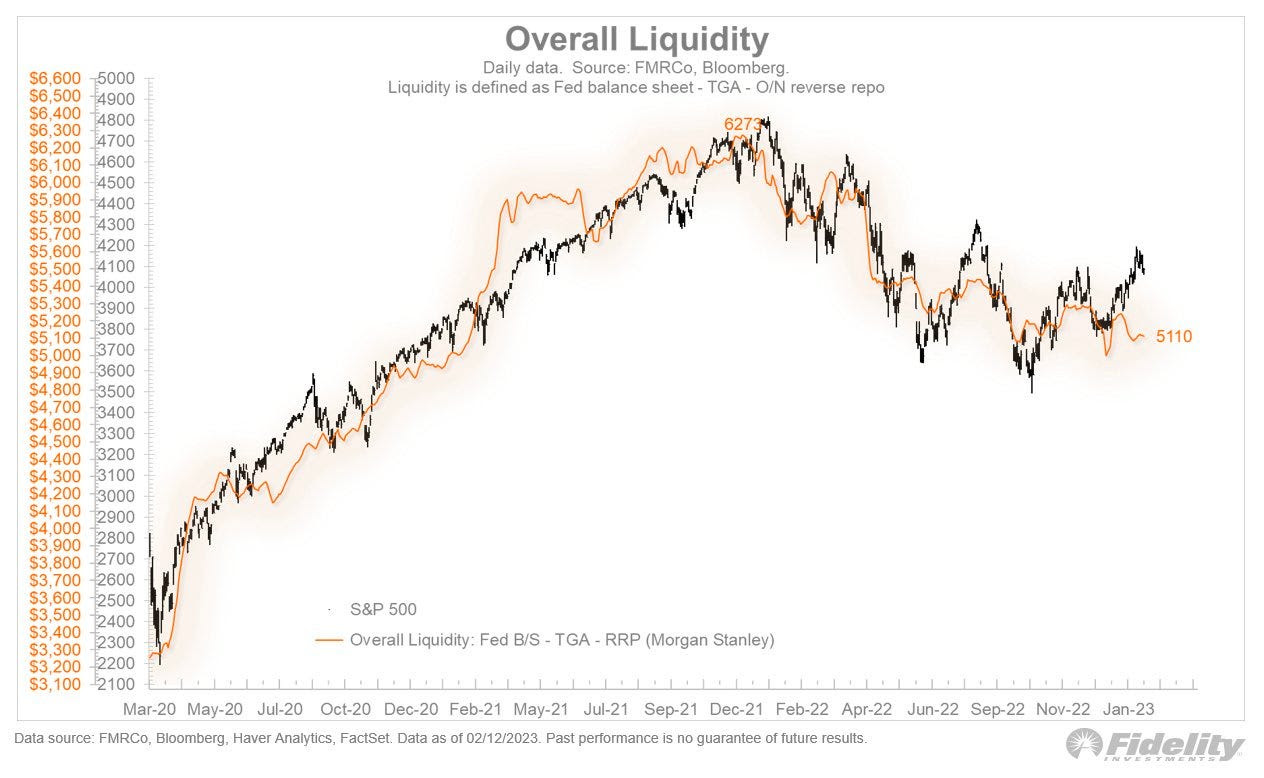
Graphic: Retrieved from Fidelity Investments. “The recent rally in stocks deviated from liquidity conditions, which have held steady but have not improved. This is just one reason to question whether there is an adequate foundation to support a new bull market.”

You can produce the above chart yourself. Fed Balance Sheet data, here. Treasury General Account Data, here. Reverse Repo data, here. NL = BS – TGA – RRP.

Moreover, the above chart which this letter has produced for you in the past and some would say is naive, shows so-called net liquidity.

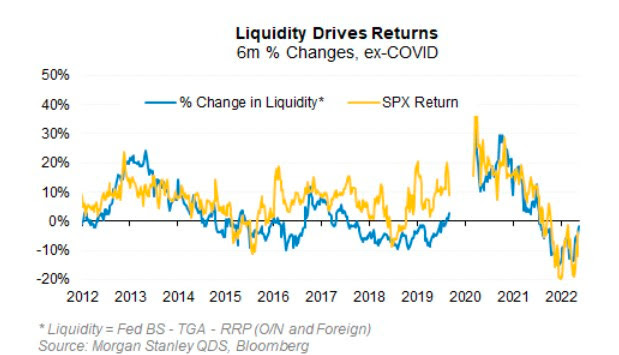
But, according to Morgan Stanley (NYSE: MS), the correlation between net liquidity and the S&P 500 (INDEX: SPX), over the past ten years is about ~0.70 and explains more than half of the movement in price-earings multiples over the past decade. 

Graphic: Retrieved from Bloomberg.

Positioning

After CPI, there was short-lived relief, as this letter expected. Following CPI, weakness surfaced and measures of traders’ activity in options markets showed a bearish tilt.

Big trades that fired off include the purchase of put options expiring in March on the S&P 500 and call options expiring in May on the Cboe Volatility Index (INDEX: VIX).

The net effect is pressure on the indexes that remain well-supported and compressed heading into big options expirations (OpEx) this week, after which the door may open to enable them to move freely and in sync with their constituents, some of which, like Alphabet Inc (NASDAQ: GOOGL) (NASDAQ: GOOG), are trading rather weak. 

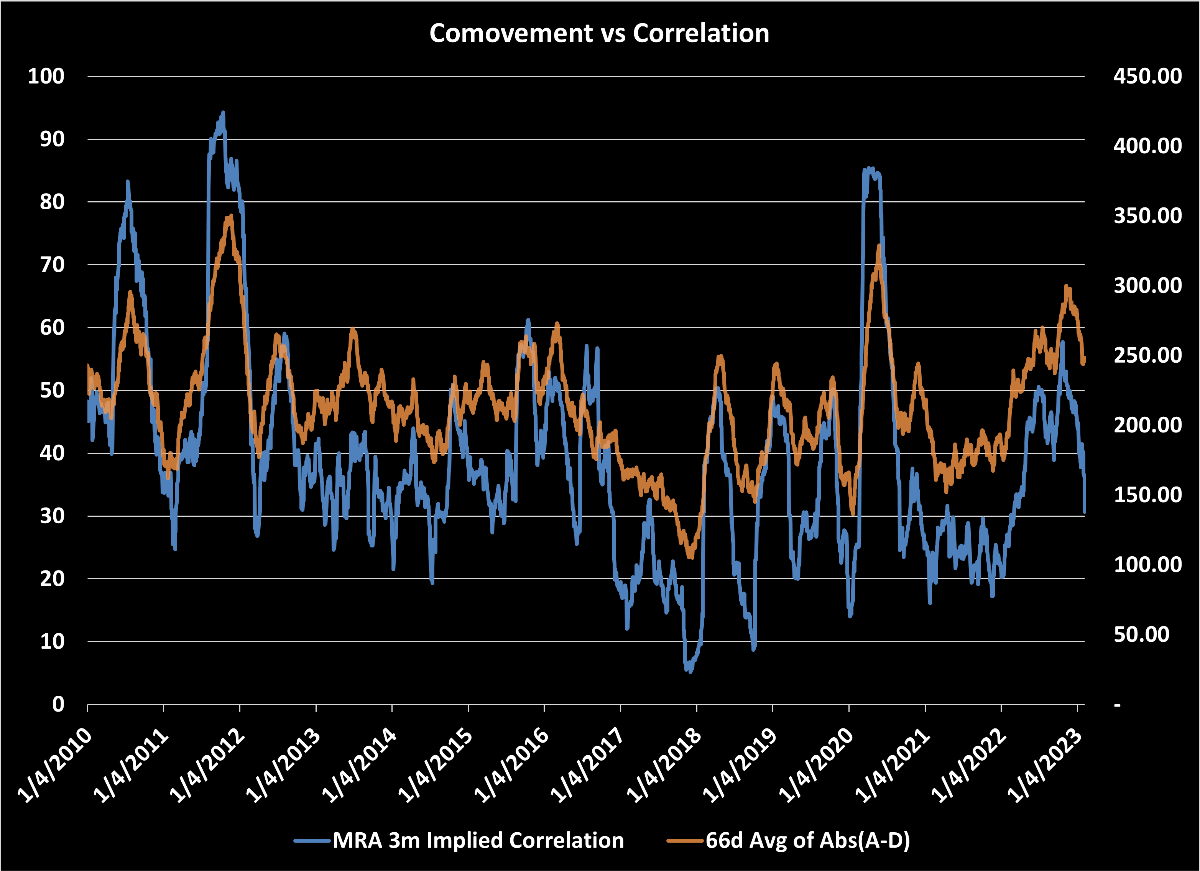
Graphic: Retrieved from Tier1Alpha. “With implied correlation having fallen back to levels not seen since 2021, it’s notable that realized comovement shows no such improvement and instead sits near record highs. Whether this presages a violent snapback is unknowable, but certainly the conditions are in place.”

To explain, after OpEx, counterparty exposure to positive gamma (i.e., positive exposure to movement hedged in a way that reduces movement) will decline and “leave markets more at the whim of macro-type repositioning”; counterparties will do less to disrupt and more to bolster (i.e., add to movement). For how to trade (or how these events impact trades), see this case study by Physik Invest.

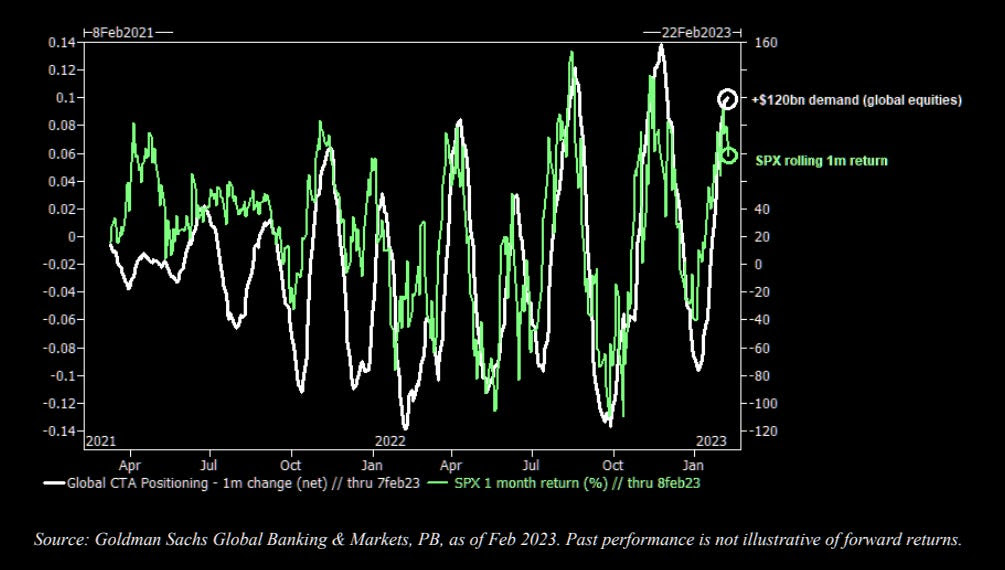
Should there be a large break lower, then “convexity could become an issue,” The Market Ear explained in a statement quoting Goldman Sachs Group Inc (NYSE: GS). “Inflecting CTA flow could translate to an approximately 20% sell-off in US equities over a month in a down-tape scenario.”

Graphic: Retrieved from Goldman Sachs Group Inc (NYSE: GS).

Technical

As of 7:30 AM ET, Wednesday’s regular session (9:30 AM – 4:00 PM ET), in the S&P 500, is likely to open in the lower part of a negatively skewed overnight inventory, inside of the prior day’s range, suggesting a limited potential for immediate directional opportunity.

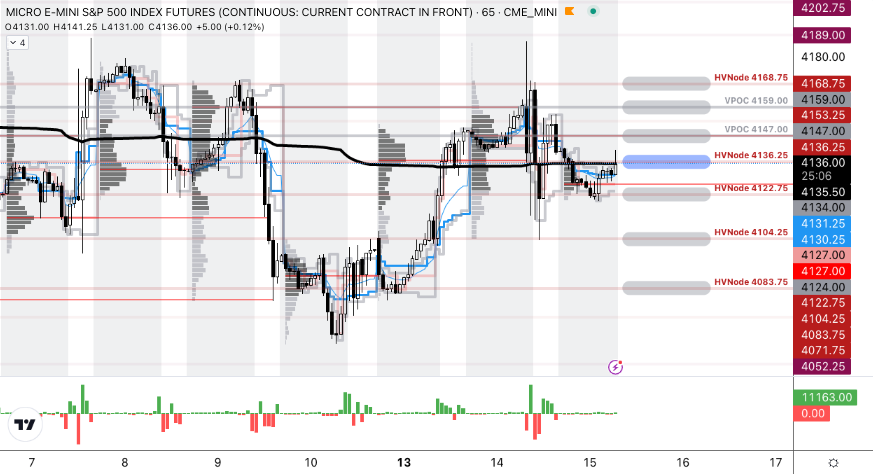
The S&P 500 pivot for today is $4,136.25. 

Key levels to the upside include $4,147.00, $4,159.00, and $4,168.75.

Key levels to the downside include $4,122.75, $4,104.25, and $4,083.75.

Disclaimer: Click here to load the updated key levels via the web-based TradingView platform. New links are produced daily. Quoted levels likely hold barring an exogenous development.

Graphic: 65-minute profile chart of the Micro E-mini S&P 500 Futures.

Definitions

Volume Areas: Markets will build on areas of high-volume (HVNodes). Should the market trend for a period of time, this will be identified by a low-volume area (LVNodes). The LVNodes denote directional conviction and ought to offer support on any test.

If participants auction and find acceptance in an area of a prior LVNode, then future discovery ought to be volatile and quick as participants look to the nearest HVNodes for more favorable entry or exit.

POCs: Areas where two-sided trade was most prevalent in a prior day session. Participants will respond to future tests of value as they offer favorable entry and exit.


About

The author, Renato Leonard Capelj, works in finance and journalism.

Capelj spends the bulk of his time at Physik Invest, an entity through which he invests and publishes free daily analyses to thousands of subscribers. The analyses offer him and his subscribers a way to stay on the right side of the market. Separately, Capelj is an options analyst at SpotGamma and an accredited journalist.

Capelj’s past works include conversations with investor Kevin O’Leary, ARK Invest’s Catherine Wood, FTX’s Sam Bankman-Fried, Lithuania’s Minister of Economy and Innovation Aušrinė Armonaitė, former Cisco chairman and CEO John Chambers, and persons at the Clinton Global Initiative.

Connect

Direct queries to renato@physikinvest.com or find Physik Invest on TwitterLinkedInFacebook, and Instagram.

Calendar

You may view this letter’s content calendar at this link.

Disclaimer

Do not construe this newsletter as advice. All content is for informational purposes.

Categories
Commentary

Daily Brief For February 14, 2023

Physik Invest’s Daily Brief is read by thousands of subscribers. You, too, can join this community to learn about the fundamental and technical drivers of markets.

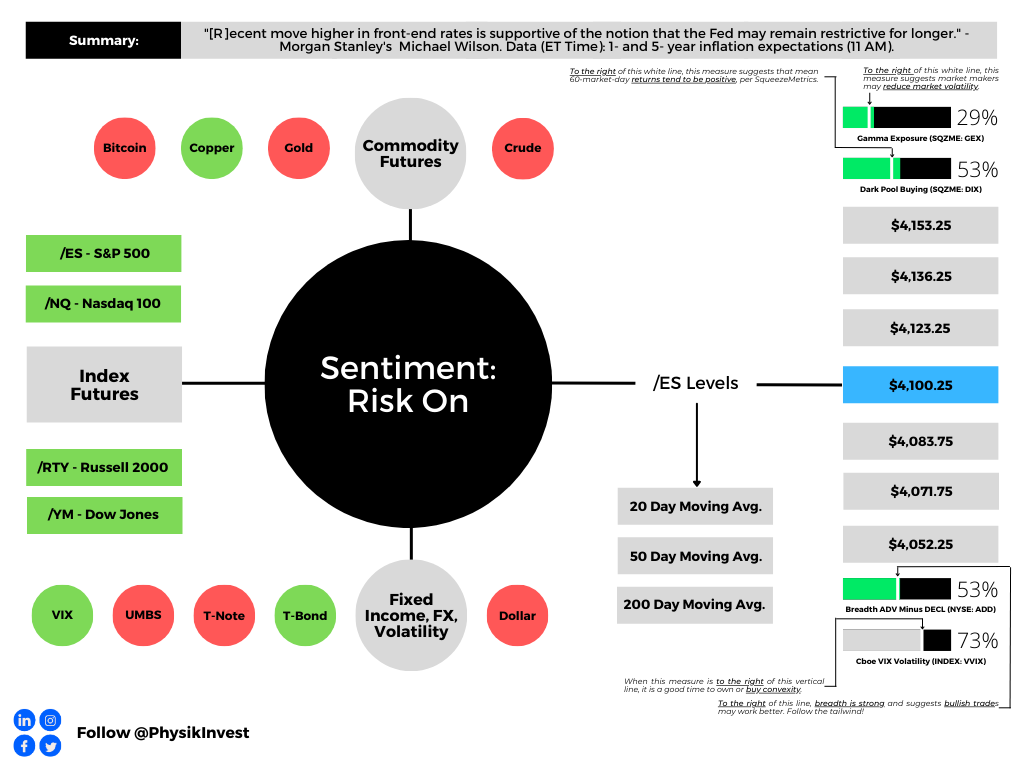
Graphic updated 8:05 AM ET. Sentiment Risk-On if expected /ES open is above the prior day’s range. Click here for the latest levels. SqueezeMetrics Dark Pool Index (DIX) and Gamma (GEX) with the latter calculated based on where the prior day’s reading falls with respect to the MAX and MIN of all occurrences available. A higher DIX is bullish. At the same time, the lower the GEX, the more (expected) volatility. Click to learn the implications of volatility, direction, and moneyness. Breadth reflects a reading of the prior day’s NYSE Advance/Decline indicator. The CBOE VIX Volatility Index (INDEX: VVIX) reflects the attractiveness of owning volatility. UMBS price via MNDClick here for the calendar.

Fundamental

Companies are slowing price increases, 

The Transcript, quoting earnings calls, shared with subscribers. Notwithstanding, consumer spending still reads strong. Mastercard Inc (NYSE: MA) measured ~9% growth in spending last month, and this points to the presence of inflation in the system that needs to be worked out. 

Consequently, Federal Reserve (Fed) officials maintain that “more needs to be done”, and this is evident in traders’ guesses as to where rates peak (i.e., terminal rate), and when the eventual reduction in rates is set to occur (i.e., easing). 

The free CME Group Inc (NASDAQ: CME) FedWatch Tool shows rates peaking in the 5.00-5.25% range through November. Then, in December, traders price a move back to the 4.75-5.00% range where we are now.

Graphic: Retrieved from CME Group Inc’s (NASDAQ: CME) Fedwatch Tool.

This is the pricing is in anticipation of rising consumer prices; the Consumer Price Index (CPI) due at 8:30 AM ET, is set to rise 0.5% in January, the most in a few months. Core CPI, which matters a lot to the Fed, is set to advance by about 0.4%.

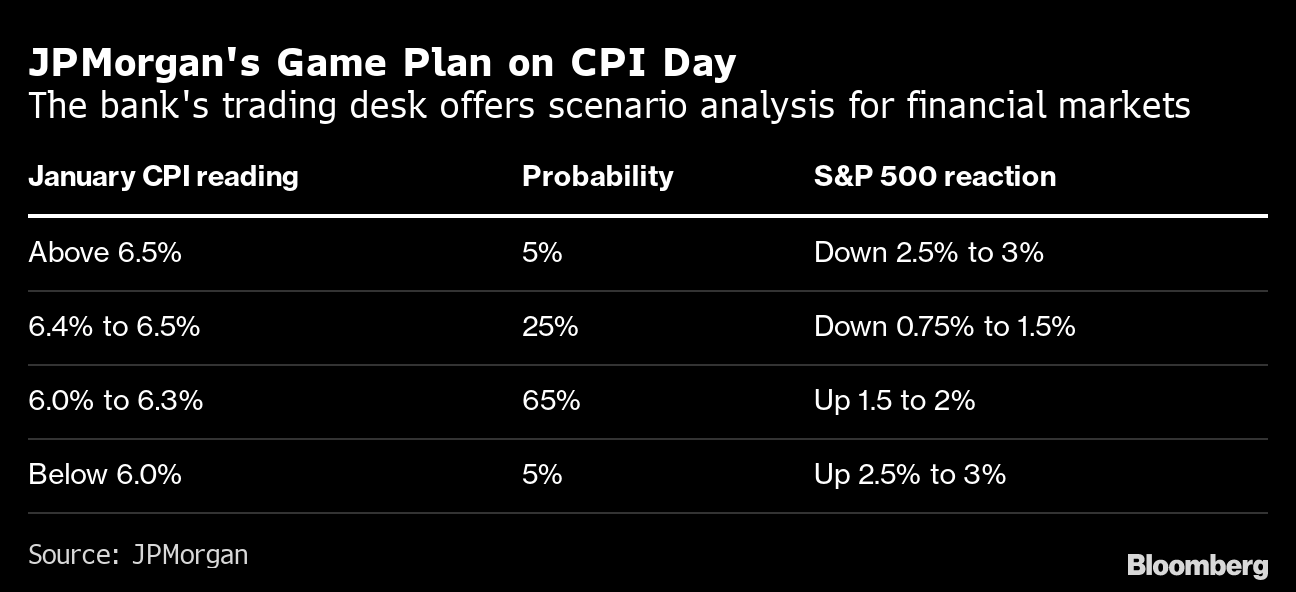
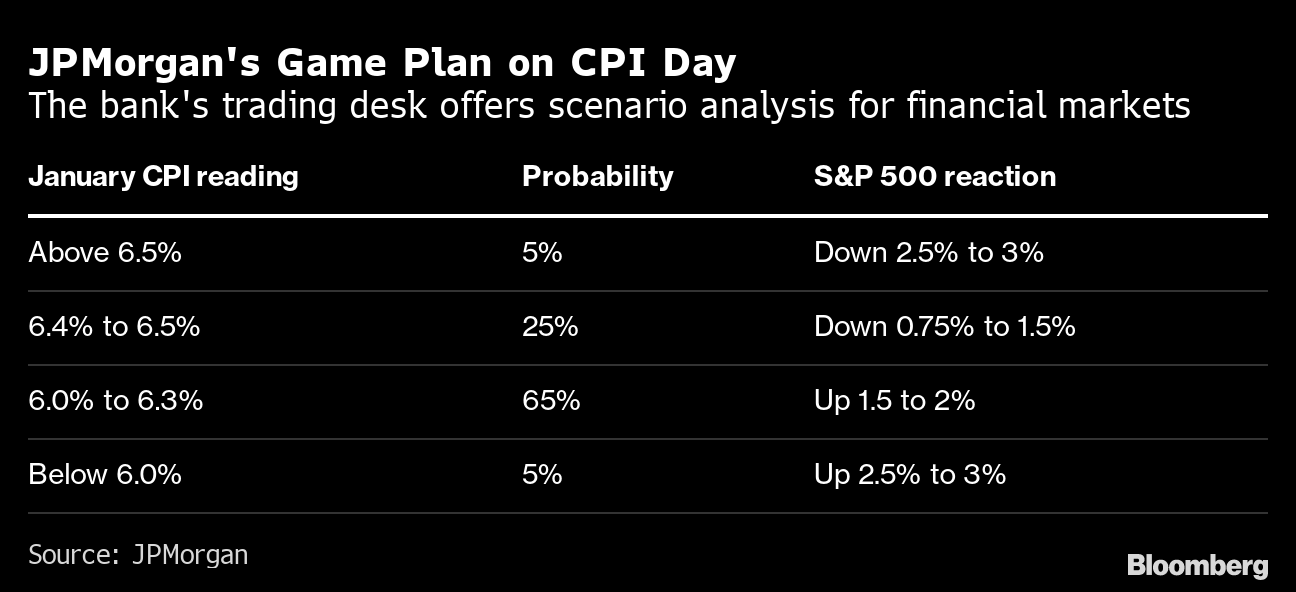
JPMorgan Chase & Co (NYSE: JPM) thinks that “data close to estimates would be treated as confirming a continued cooling in inflation, which would imply a fall for bond yields and the dollar, while tech shares would lead an advance for US stocks.”

But, any equity gains are likely to fade, [JPM] warned, ‘once investors shift attention to a relatively slower pace of disinflation than the previous two months, where each CPI print saw a decrease of 60 basis points.’”

Graphic: Retrieved from Bloomberg.

So in-line CPI, coupled with a strong January jobs report, will “corroborate recent comments from Fed officials that further interest-rate hikes are likely forthcoming,” Bloomberg adds. In a post by Joseph Wang, a former Fed trader, “a higher interest rate environment implies a more potent [quantiative tightening or] QT.”

“The Fed’s aggressive hikes have yet to reach the bulk of bank deposits, which is the foundational financial asset for many households. These deeply negative real yields may be extending the portfolio rebalancing impact of QE. Some households have escaped financial repression by moving into Treasury bills or money market funds, but that is not the only refuge. The perceived return of risk assets likely remains high for many, as the memory of the 2021 boom is still fresh.” Further, a “sizable yield upgrade being forced onto the market may indicate a more impactful QT.”

QT, to put it simply, is the flow of capital out of capital markets. Higher rates for longer and more QT are not good for risk assets. Though money is flowing from other parts of the world, which, in part, has bolstered buying of assets over the past months, accelerating “QT shifts the composition of financial assets towards those that better reflect the Fed’s restrictive stance.”

Positioning

In the post-CPI expirations, implied volatility (IVOL), a demonstration of traders’ fears and demands for protection, is wound and is likely to serve as a catalyst for a fast move after CPI. Should fears be assuaged (i.e., barring the unexpected), wound volatility is likely to compress and this may result in a short-term market boost.

However, the sale and expiry of protection, after CPI and particularly the coming options expiration (OpEx), is likely to put the market in a precarious position.

According to SpotGamma, “current positioning, a result of re-grossing over the past weeks and months, has boosted dealer exposure to positive gamma.” This means counterparties (i.e., dealers) make money when the market moves and hedge in a manner that reduces volatility, “hence more rangebound trade as we have seen.”

Following OpEx, counterparty exposure to positive gamma will decline and “leave markets more at the whim of macro-type repositioning” which counterparties will do less to disrupt and more to bolster (i.e., add to movement).

Therefore, as SpotGamma summarizes, “[b]e prepared for potential relief immediately after CPI. However, across a longer time horizon, there is potential for weakness and that weakness may be exacerbated by dealer hedging.”

Technical

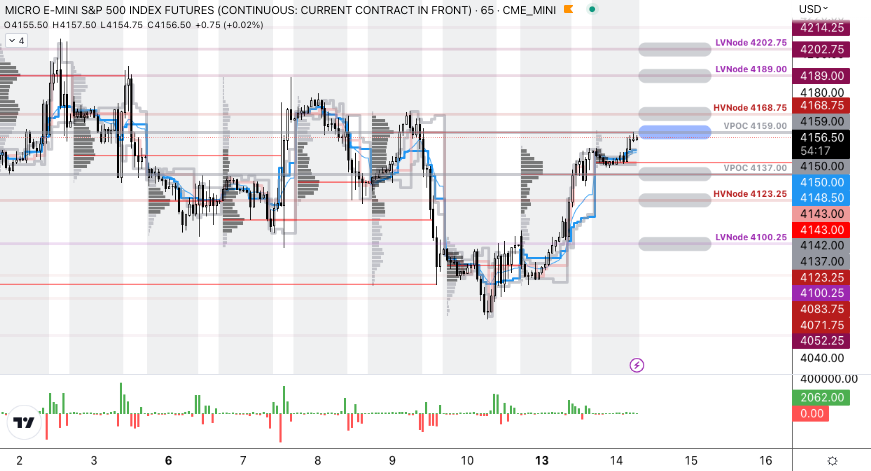
As of 7:15 AM ET, Tuesday’s regular session (9:30 AM – 4:00 PM ET), in the S&P 500, is likely to open in the upper part of a balanced overnight inventory, outside of the prior day’s range, suggesting a potential for immediate directional opportunity.

The S&P 500 pivot for today is $4,159.00. 

Key levels to the upside include $4,168.75, $4,189.00, and $4,202.75.

Key levels to the downside include $4,137.00, $4,123.25, and $4,100.25.

Disclaimer: Click here to load the updated key levels via the web-based TradingView platform. New links are produced daily. Quoted levels likely hold barring an exogenous development.

Graphic: 65-minute profile chart of the Micro E-mini S&P 500 Futures.

Definitions

Volume Areas: Markets will build on areas of high-volume (HVNodes). Should the market trend for a period of time, this will be identified by a low-volume area (LVNodes). The LVNodes denote directional conviction and ought to offer support on any test.

If participants auction and find acceptance in an area of a prior LVNode, then future discovery ought to be volatile and quick as participants look to the nearest HVNodes for more favorable entry or exit.

POCs: Areas where two-sided trade was most prevalent in a prior day session. Participants will respond to future tests of value as they offer favorable entry and exit.


About

The author, Renato Leonard Capelj, works in finance and journalism.

Capelj spends the bulk of his time at Physik Invest, an entity through which he invests and publishes free daily analyses to thousands of subscribers. The analyses offer him and his subscribers a way to stay on the right side of the market. Separately, Capelj is an options analyst at SpotGamma and an accredited journalist.

Capelj’s past works include conversations with investor Kevin O’Leary, ARK Invest’s Catherine Wood, FTX’s Sam Bankman-Fried, Lithuania’s Minister of Economy and Innovation Aušrinė Armonaitė, former Cisco chairman and CEO John Chambers, and persons at the Clinton Global Initiative.

Connect

Direct queries to renato@physikinvest.com or find Physik Invest on TwitterLinkedInFacebook, and Instagram.

Calendar

You may view this letter’s content calendar at this link.

Disclaimer

Do not construe this newsletter as advice. All content is for informational purposes.

Categories
Commentary

Daily Brief For February 13, 2023

Physik Invest’s Daily Brief is read by thousands of subscribers. You, too, can join this community to learn about the fundamental and technical drivers of markets.

Graphic updated 7:50 AM ET. Sentiment Risk-On if expected /ES open is above the prior day’s range. /ES levels are derived from the profile graphic at the bottom of this letter. Click here for the latest levels. SqueezeMetrics Dark Pool Index (DIX) and Gamma (GEX) with the latter calculated based on where the prior day’s reading falls with respect to the MAX and MIN of all occurrences available. A higher DIX is bullish. The lower the GEX, the more (expected) volatility. Click for the implications of volatility, direction, and moneyness. Breadth reflects a reading of the prior day’s NYSE Advance/Decline indicator. The CBOE VIX Volatility Index (INDEX: VVIX) reflects the attractiveness of owning volatility. UMBS price via MNDClick here for the calendar.

Administrative

Improving the dashboard, above, per subscribers’ requests. The newest addition is the price of the 30-year Uniform Mortgage-Backed Security (UMBS); the trading of MBSs moves mortgage rates.

If any recommendations on what you would like to see in the above dashboard, please comment below. Have a great day!

Fundamental

This a brief letter while, in the background, your letter writer works on something substantial to provide you in the coming days.

In the meantime, let’s look past the doom and gloom. In short, this week is set to be pivotal, particularly a day or two after the release of consumer price updates. In the meantime, there will be breaks that are likely to fail. Caution on commitment.

Technical

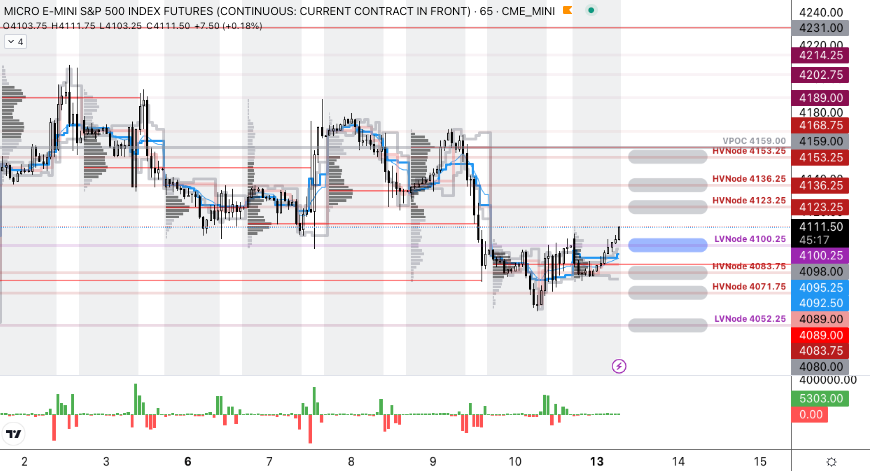
As of 7:20 AM ET, Monday’s regular session (9:30 AM – 4:00 PM ET), in the S&P 500, is likely to open in the upper part of a negatively skewed overnight inventory, outside of the prior day’s, suggesting a potential for immediate directional opportunity.

The S&P 500 pivot for today is $4,100.25. 

Key levels to the upside include $4,123.25, $4,136.25, and $4,153.25.

Key levels to the downside include $4,083.75, $4,071.75, and $4,052.25.

Disclaimer: Click here to load the updated key levels via the web-based TradingView platform. New links are produced daily. Quoted levels likely hold barring an exogenous development.

Graphic: 65-minute profile chart of the Micro E-mini S&P 500 Futures.

Definitions

Volume Areas: Markets will build on areas of high-volume (HVNodes). Should the market trend for a period of time, this will be identified by a low-volume area (LVNodes). The LVNodes denote directional conviction and ought to offer support on any test.

If participants auction and find acceptance in an area of a prior LVNode, then future discovery ought to be volatile and quick as participants look to the nearest HVNodes for more favorable entry or exit.


About

The author, Renato Leonard Capelj, works in finance and journalism.

Capelj spends the bulk of his time at Physik Invest, an entity through which he invests and publishes free daily analyses to thousands of subscribers. The analyses offer him and his subscribers a way to stay on the right side of the market. Separately, Capelj is an options analyst at SpotGamma and an accredited journalist.

Capelj’s past works include conversations with investor Kevin O’Leary, ARK Invest’s Catherine Wood, FTX’s Sam Bankman-Fried, Lithuania’s Minister of Economy and Innovation Aušrinė Armonaitė, former Cisco chairman and CEO John Chambers, and persons at the Clinton Global Initiative.

Connect

Direct queries to renato@physikinvest.com or find Physik Invest on TwitterLinkedInFacebook, and Instagram.

Calendar

You may view this letter’s content calendar at this link.

Disclaimer

Do not construe this newsletter as advice. All content is for informational purposes.