Editor’s Note: The newsletter schedule has changed.
From now on, you can expect to see Daily Briefs only – Monday through Friday – posted shortly before 8:00 AM ET. The Weekly Trade Idea will be packaged into Monday’s commentary, also.
Thanks again for your continued support. I strive to simplify and add value, as best I can.
Market Commentary
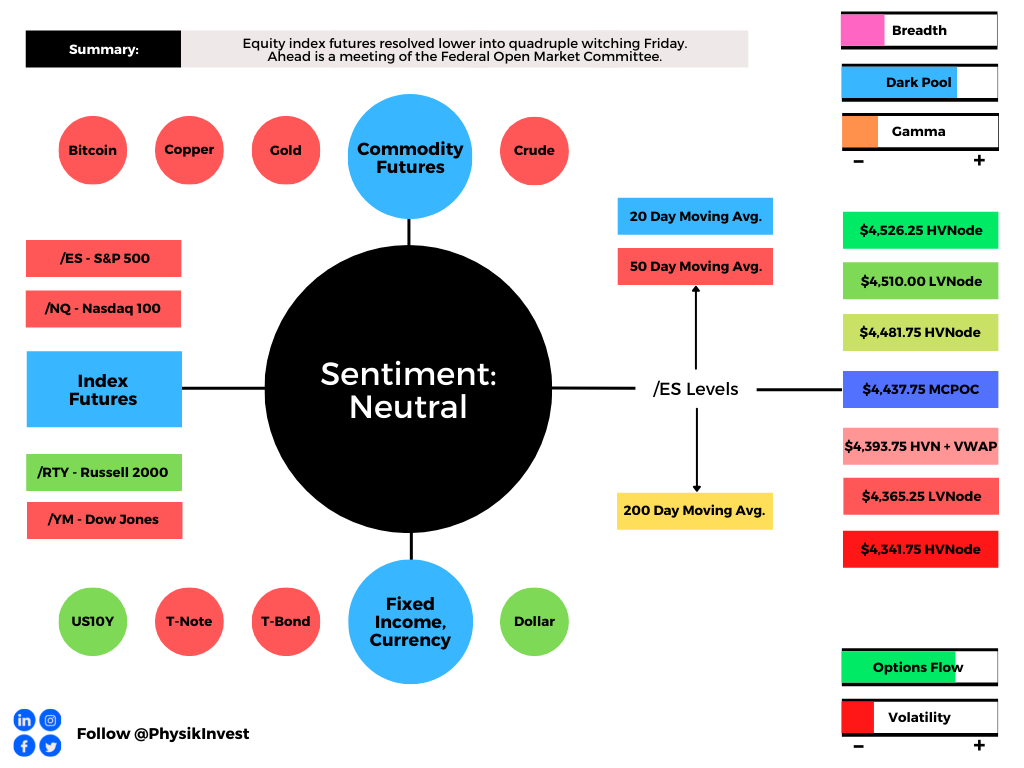
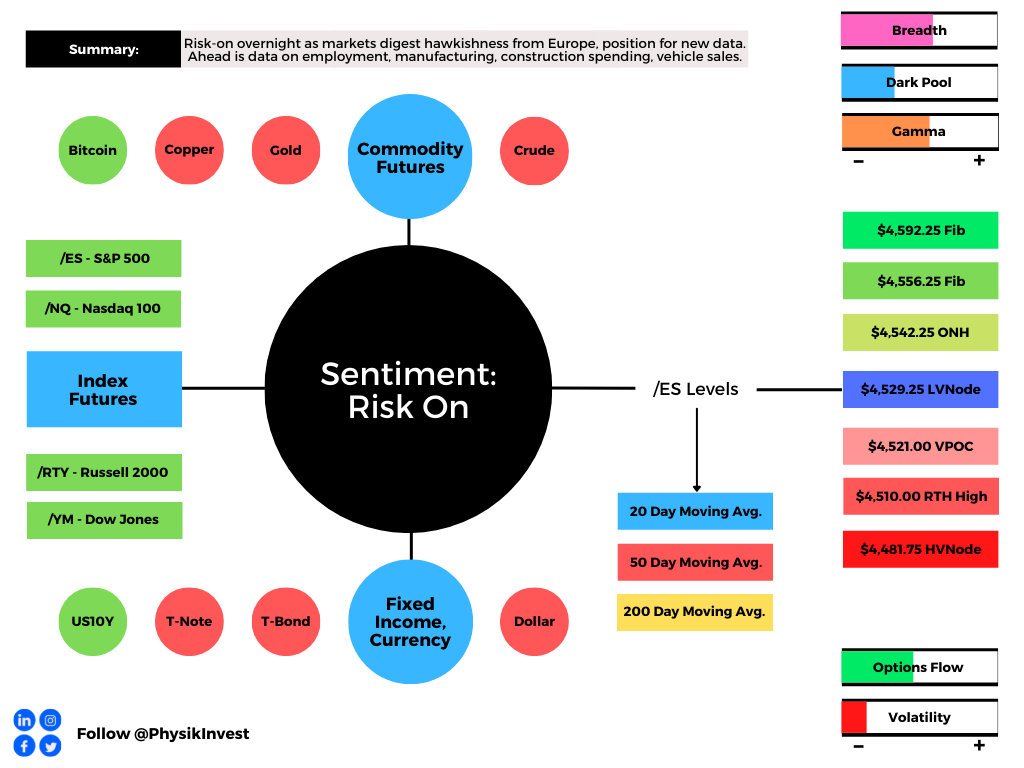
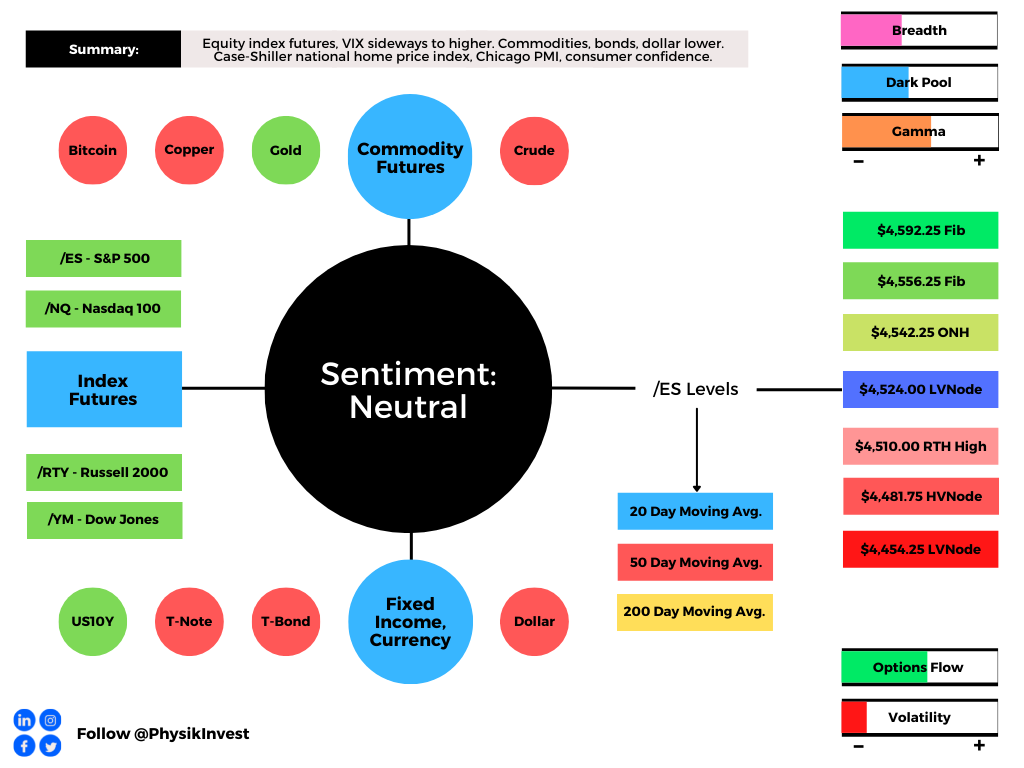
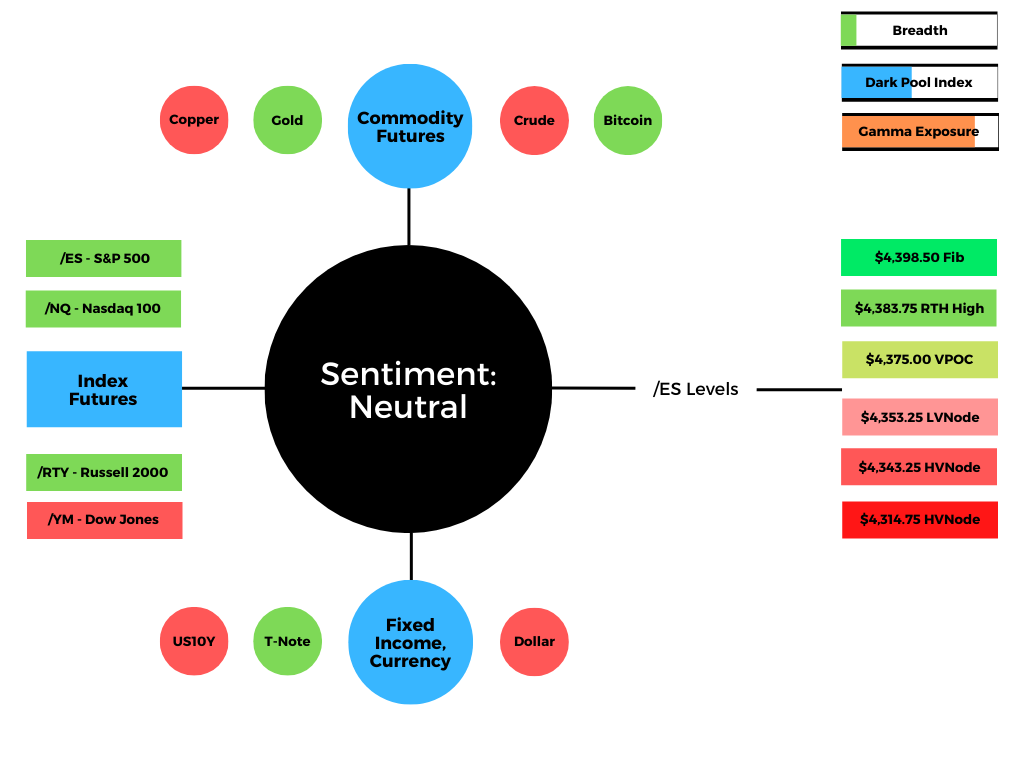
Equity index futures trade sideways to lower with bonds. Commodities were mixed.
- October bottom; a rip up into EOY?
- Ahead: No economic reports today.
What Happened: Ahead of a busy start to the third-quarter earnings season, this week, U.S. stock index futures auctioned sideways to lower overnight alongside some mixed narratives.
Last night, it was revealed that Goldman Sachs Group (NYSE: GS) cut its U.S. growth forecast on consumption and a fiscal slowdown. Not even a day later, there is news that Goldman, alongside JPMorgan Chase & Co (NYSE: JPM) strategists, suggests the recent dip is a buy.
Given the Columbus Day holiday, today, no economic reports are scheduled.
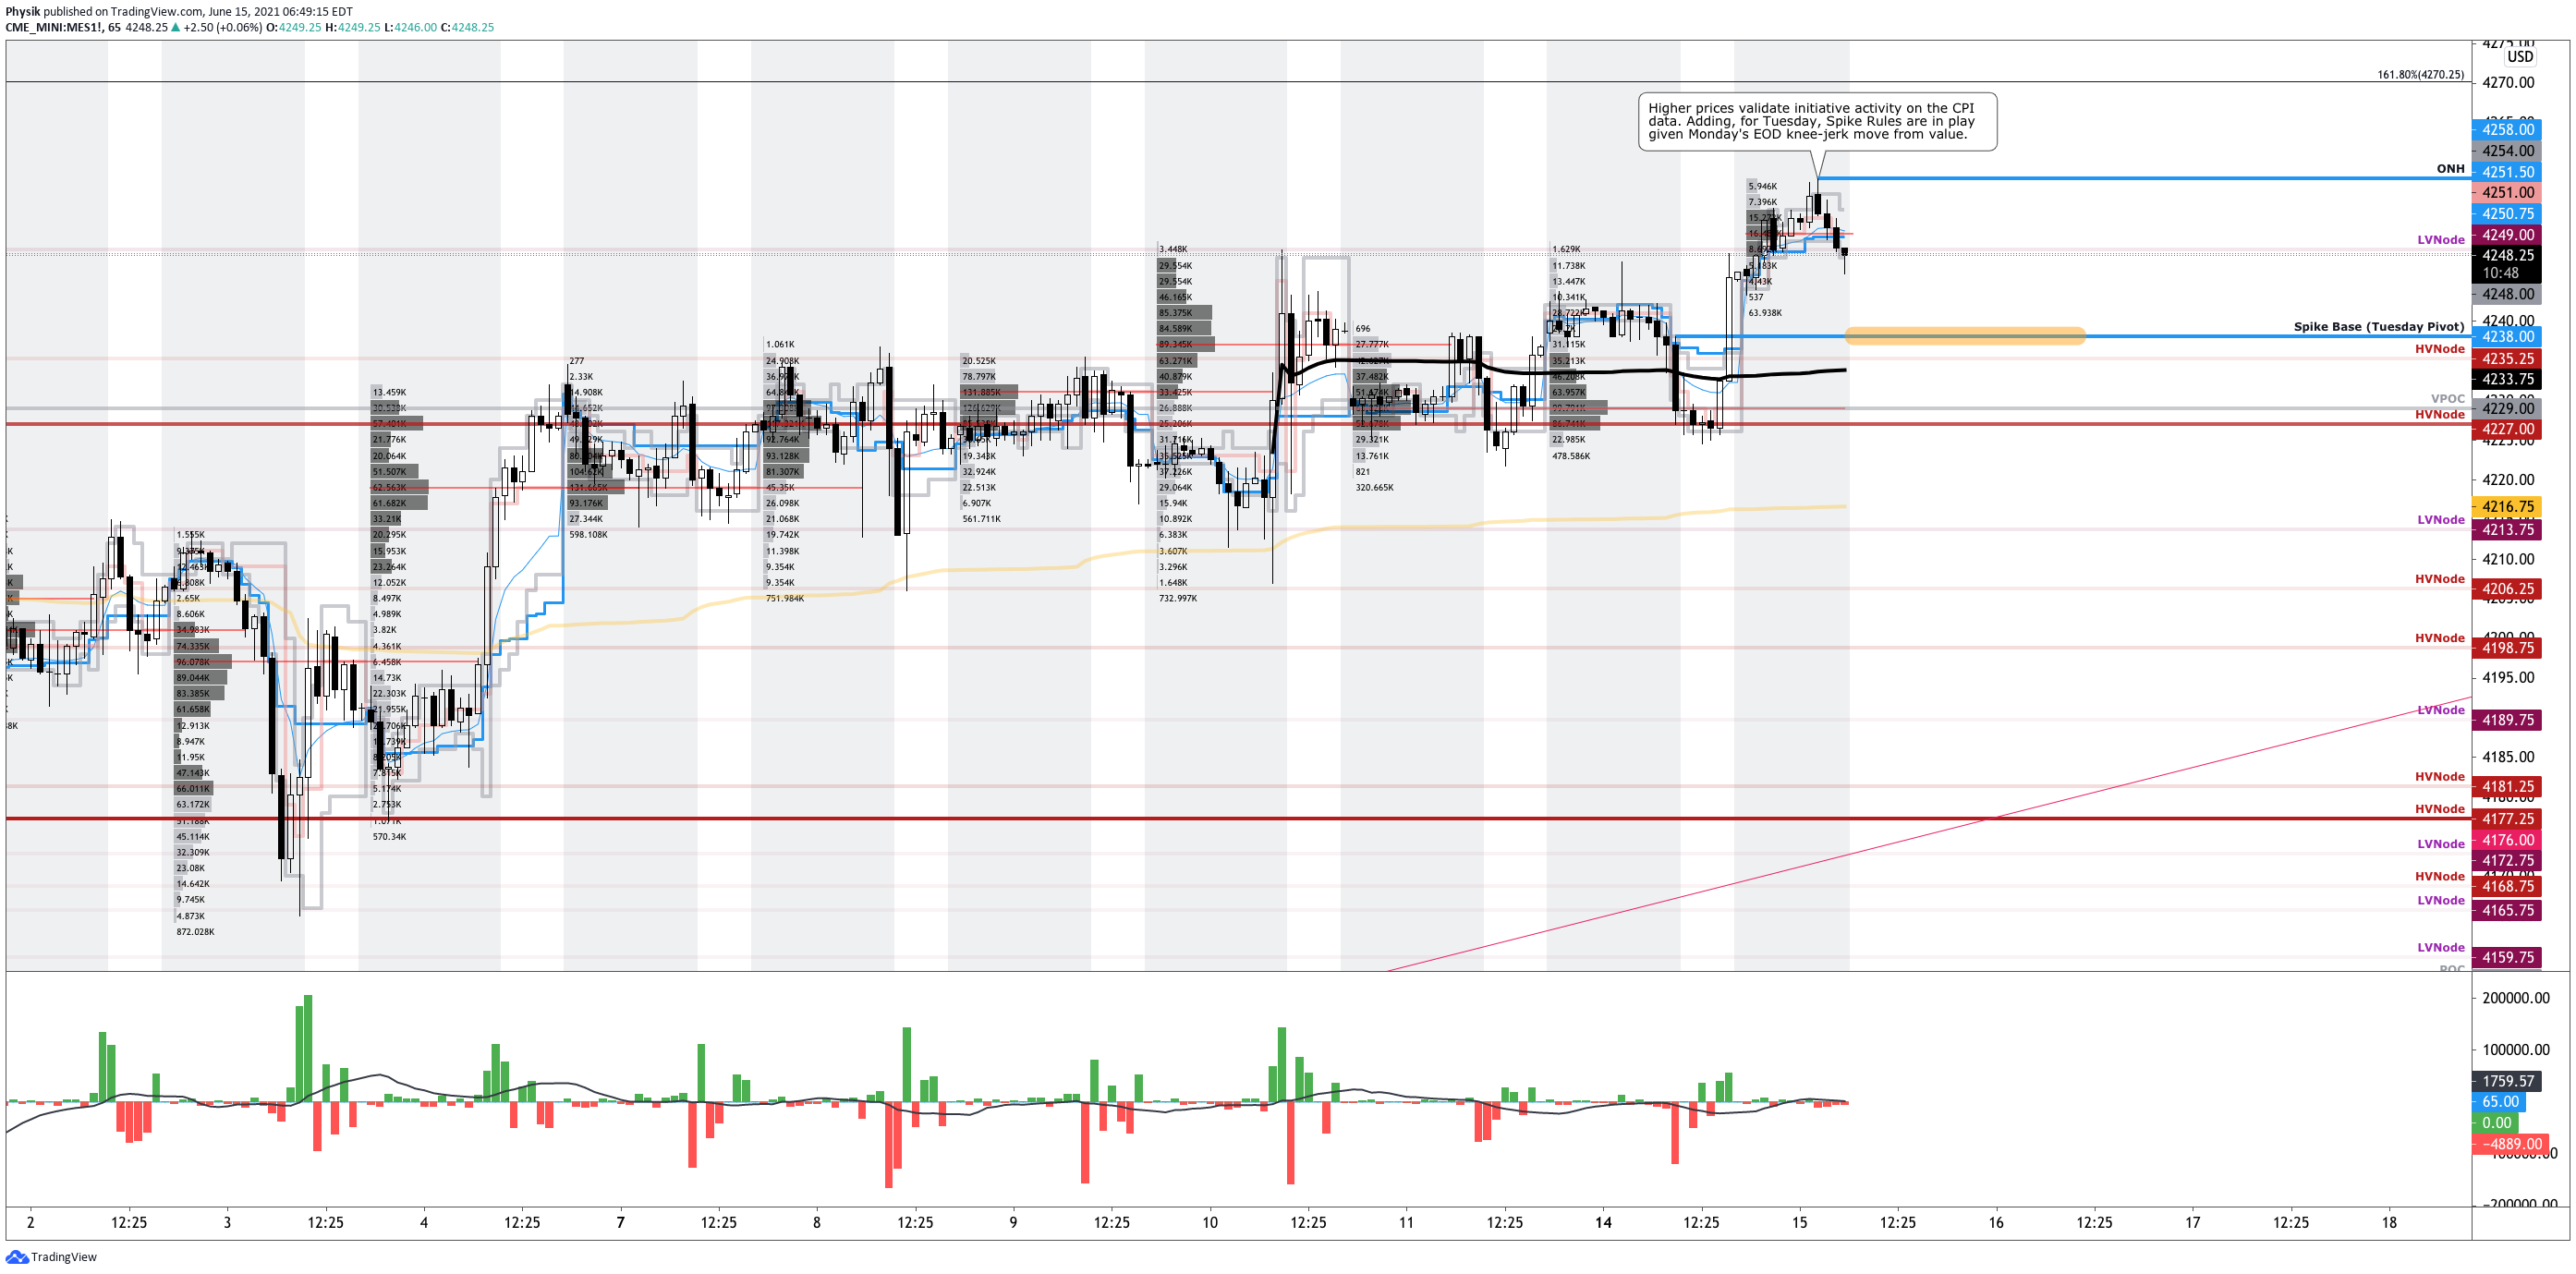
What To Expect: As of 6:20 AM ET, Monday’s regular session (9:30 AM – 4:00 PM EST) in the S&P 500 will likely open outside of prior-range and -value, suggesting a potential for immediate directional opportunity.
Gap Scenarios: Gaps ought to fill quickly. Should they not, that’s a signal of strength; do not fade. Leaving value behind on a gap-fill or failing to fill a gap (i.e., remaining outside of the prior session’s range) is a go-with indicator.

Auctioning and spending at least 1-hour of trade back in the prior range suggests a lack of conviction; in such a case, do not follow the direction of the most recent initiative activity.
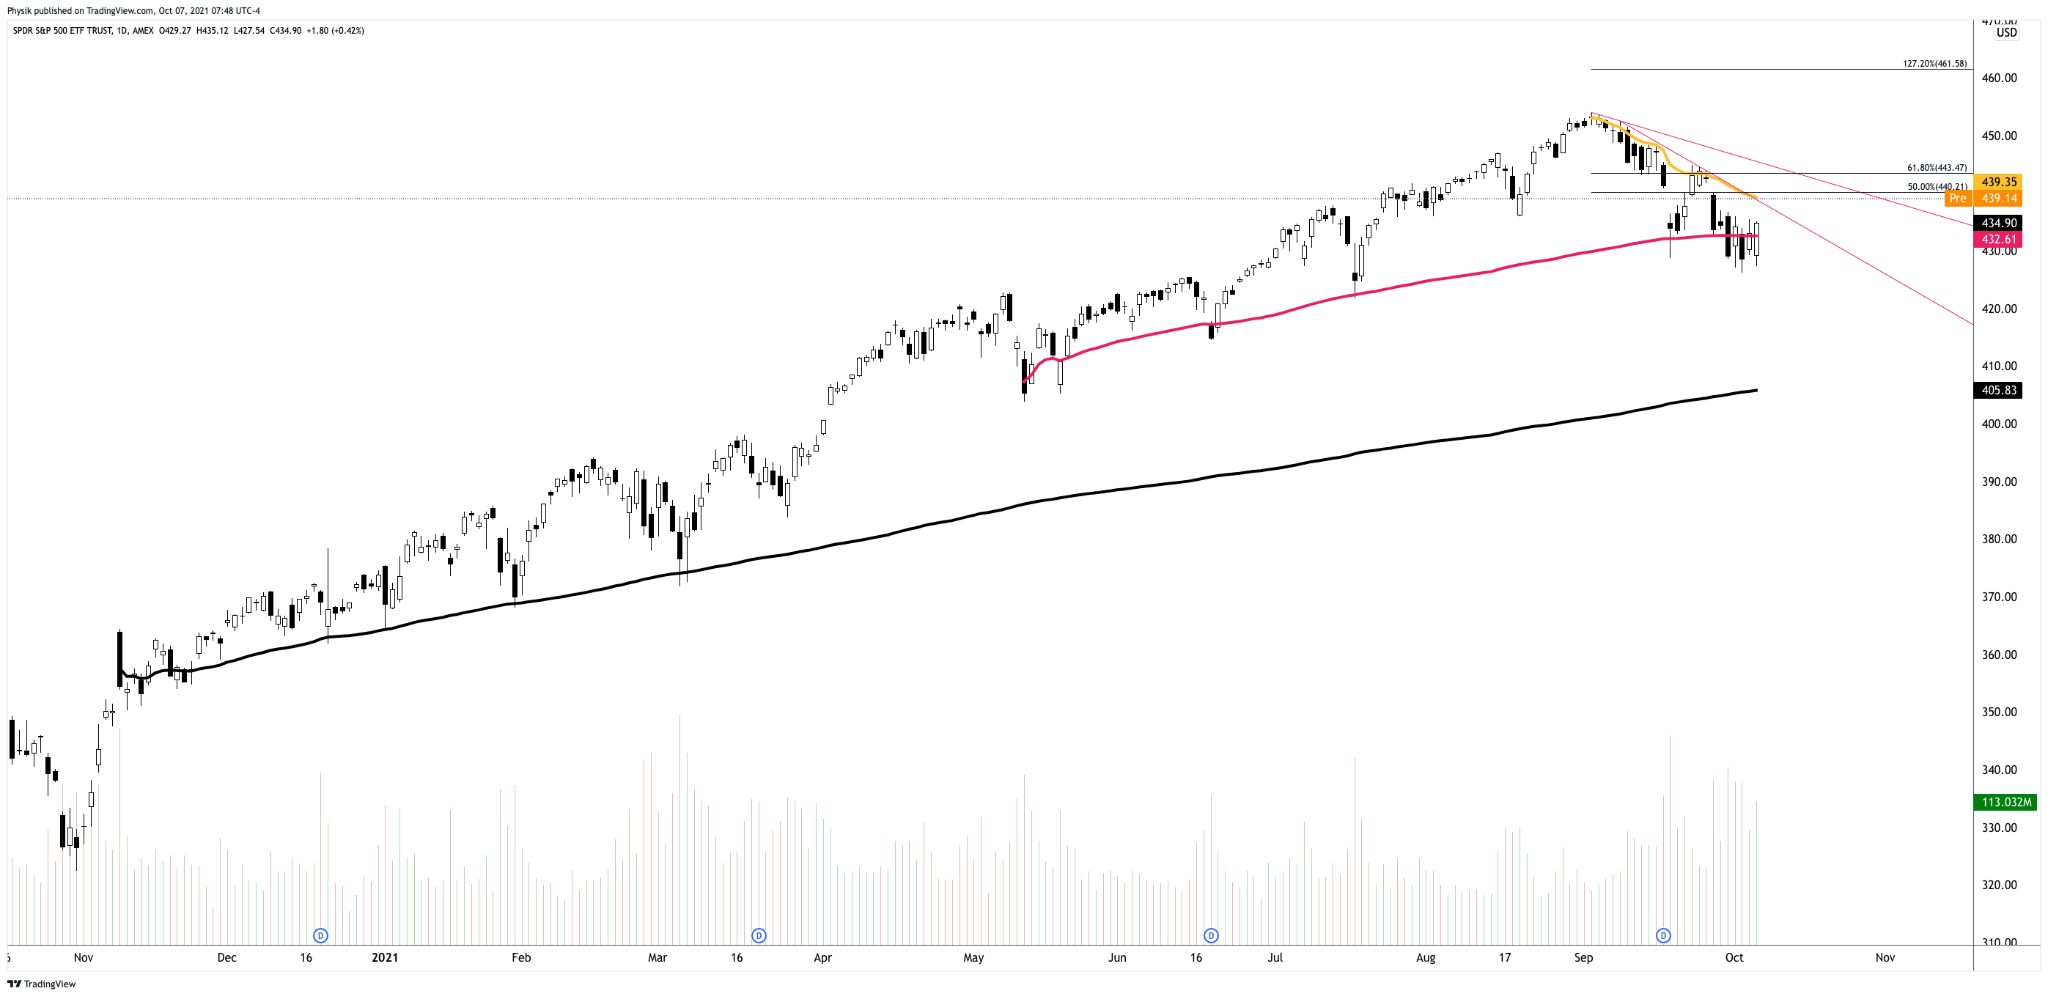
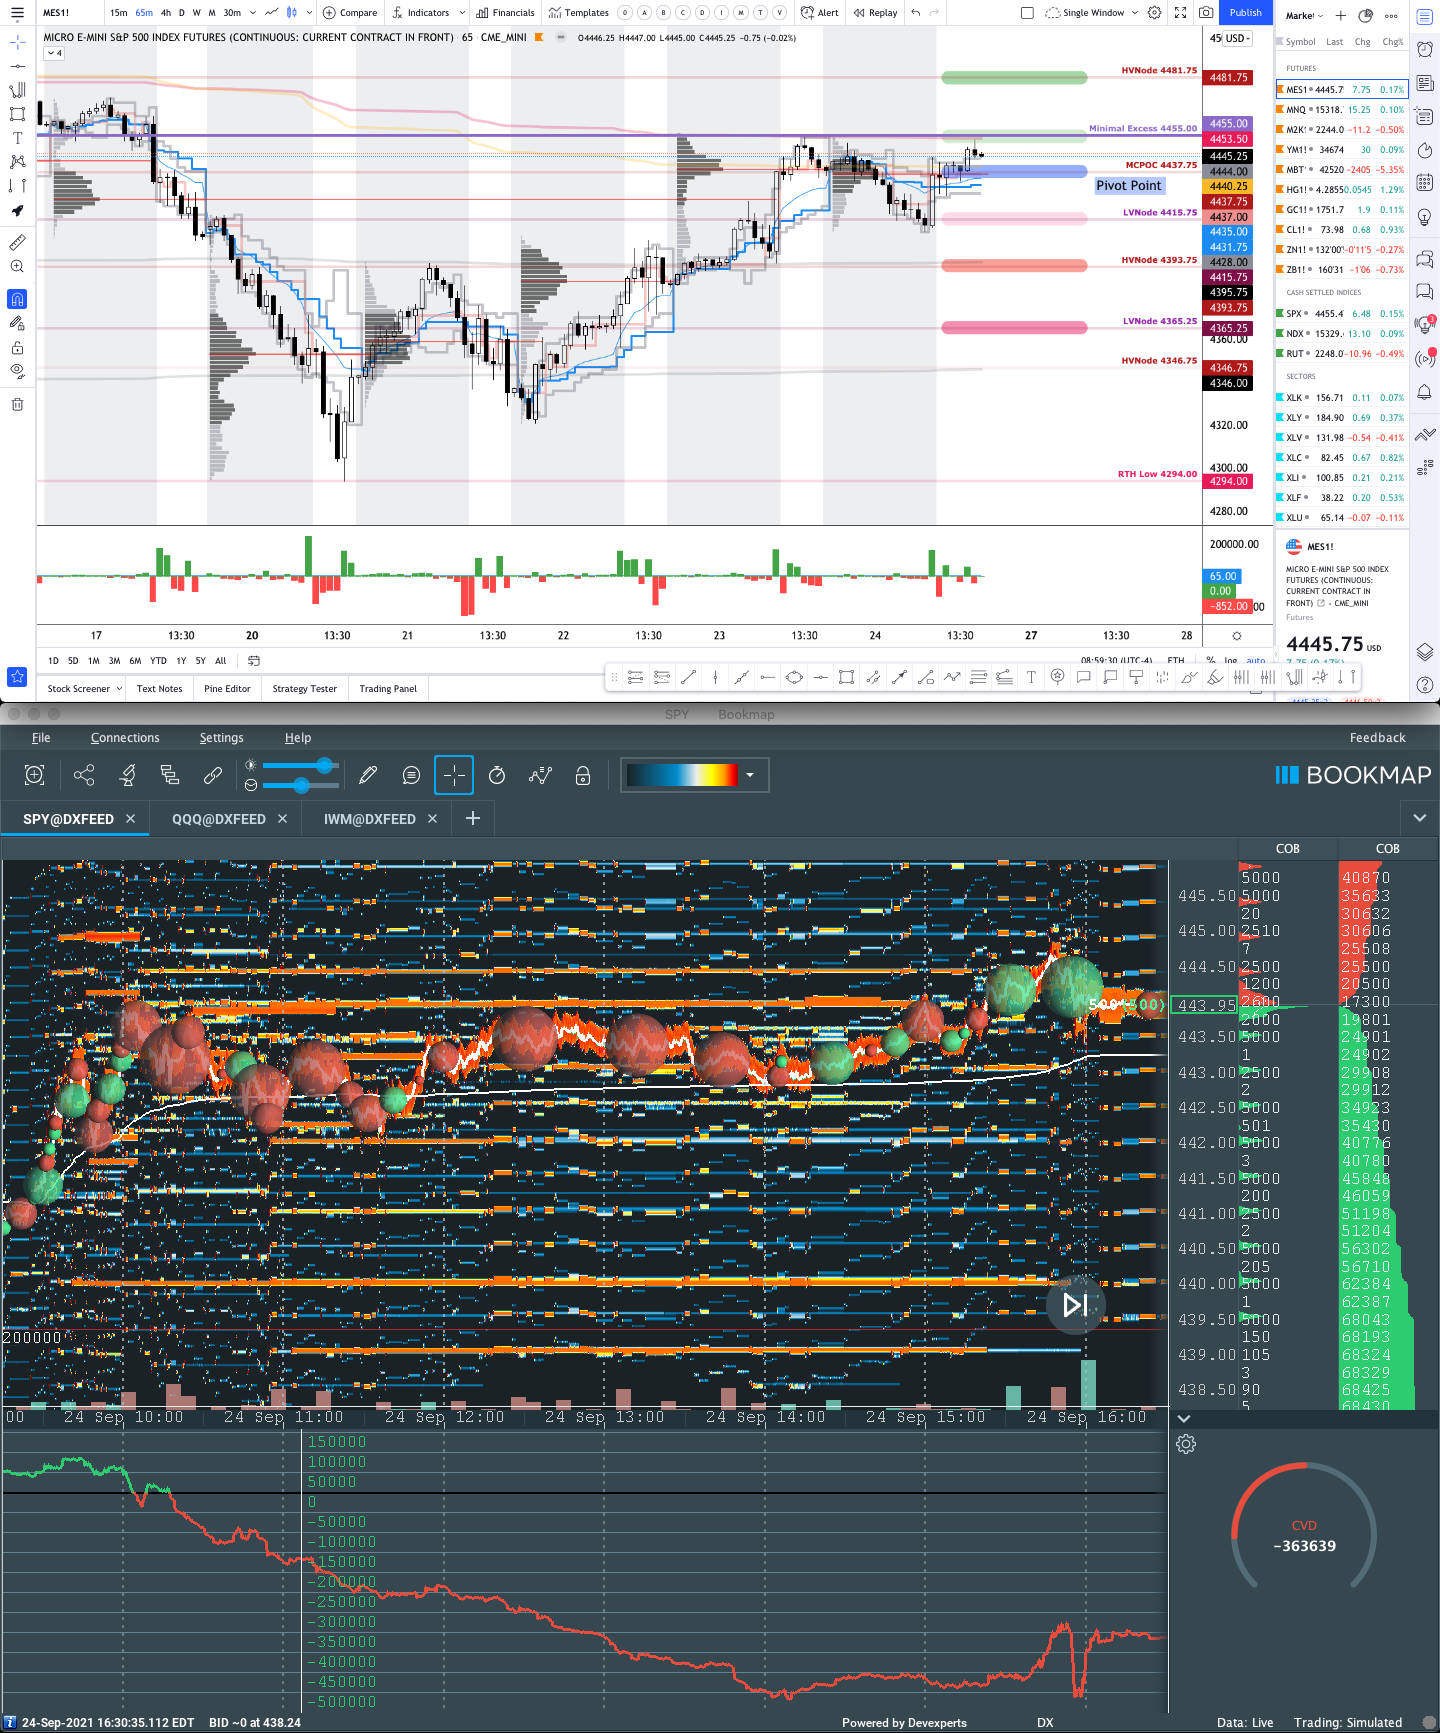
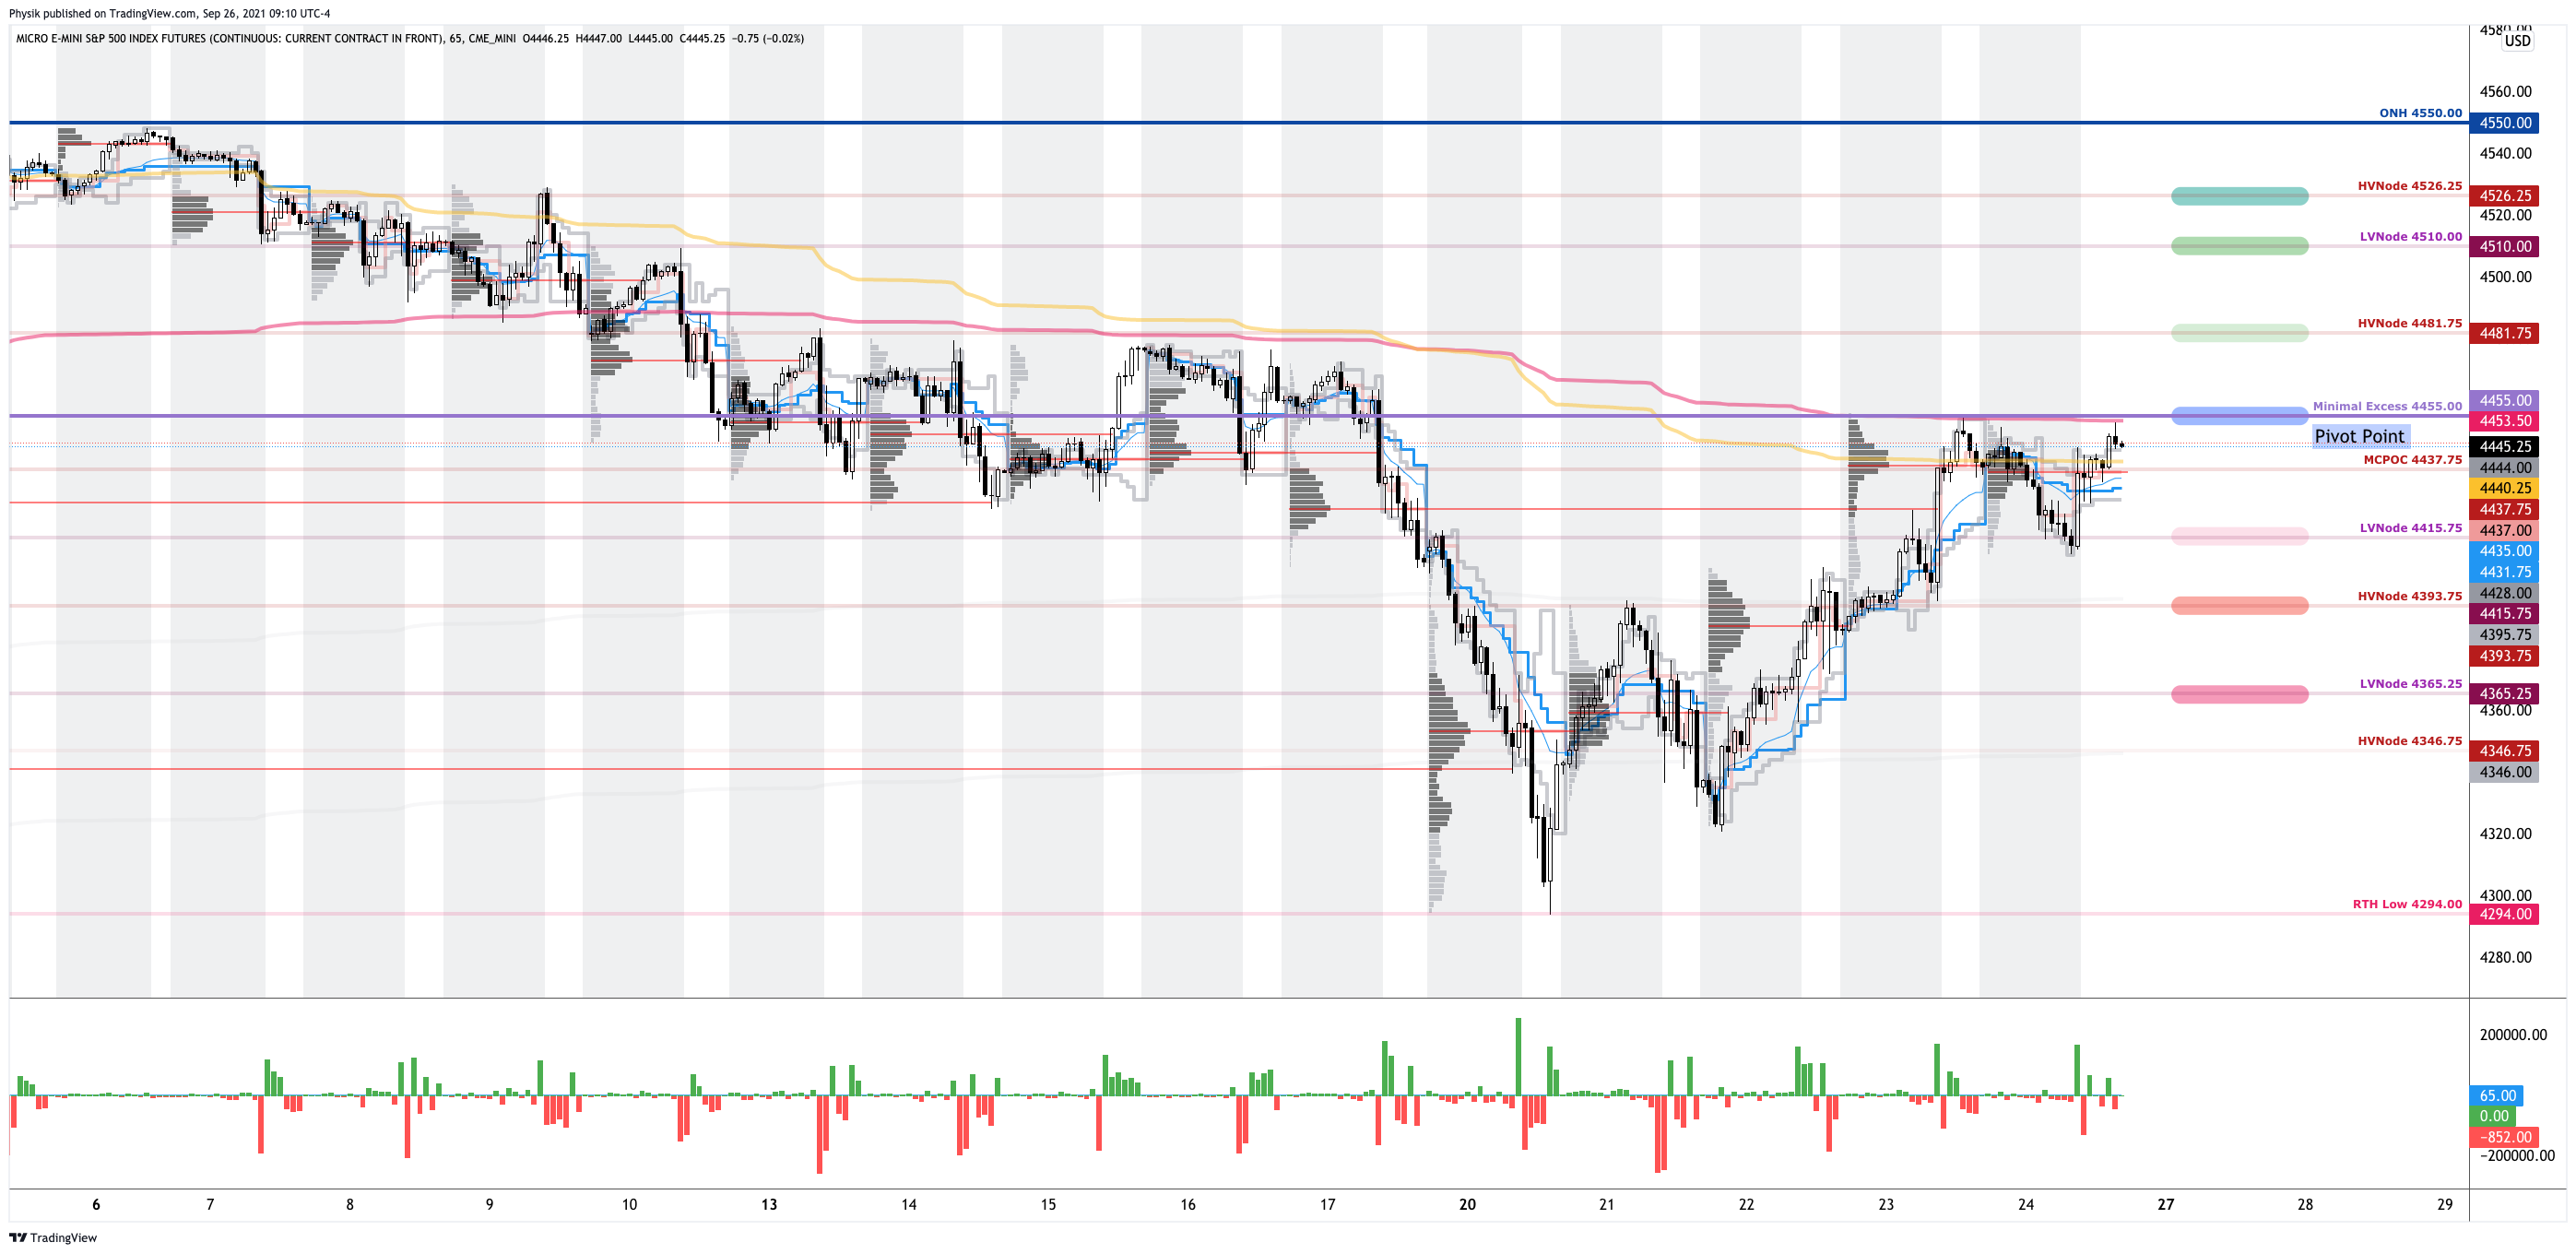
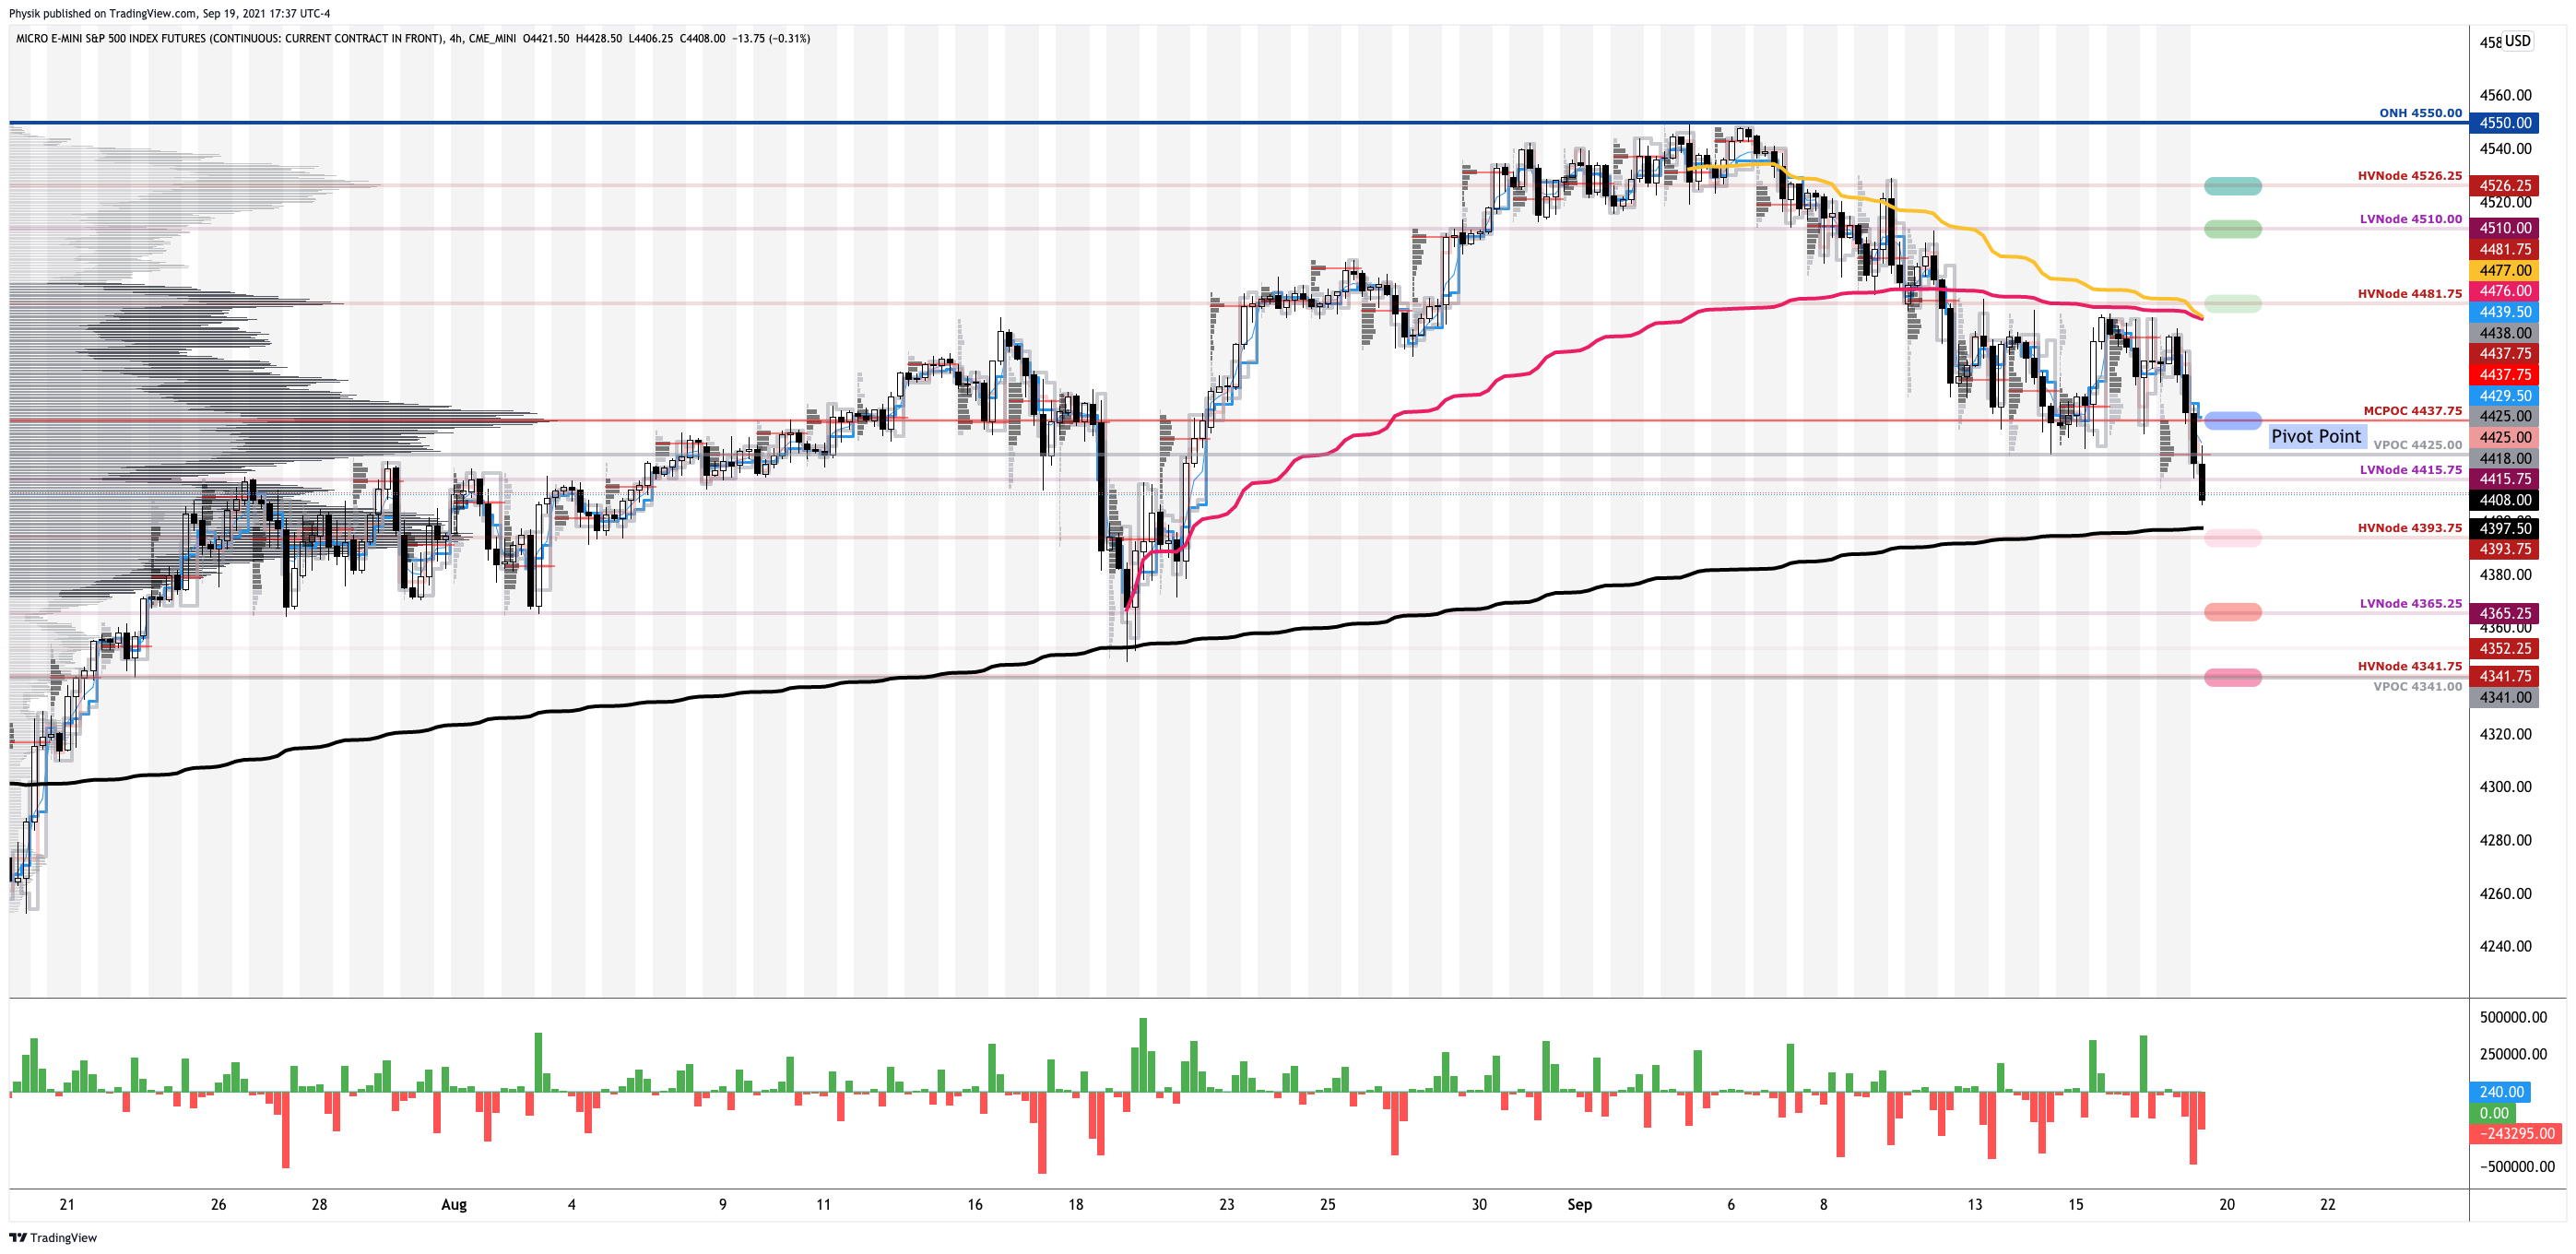
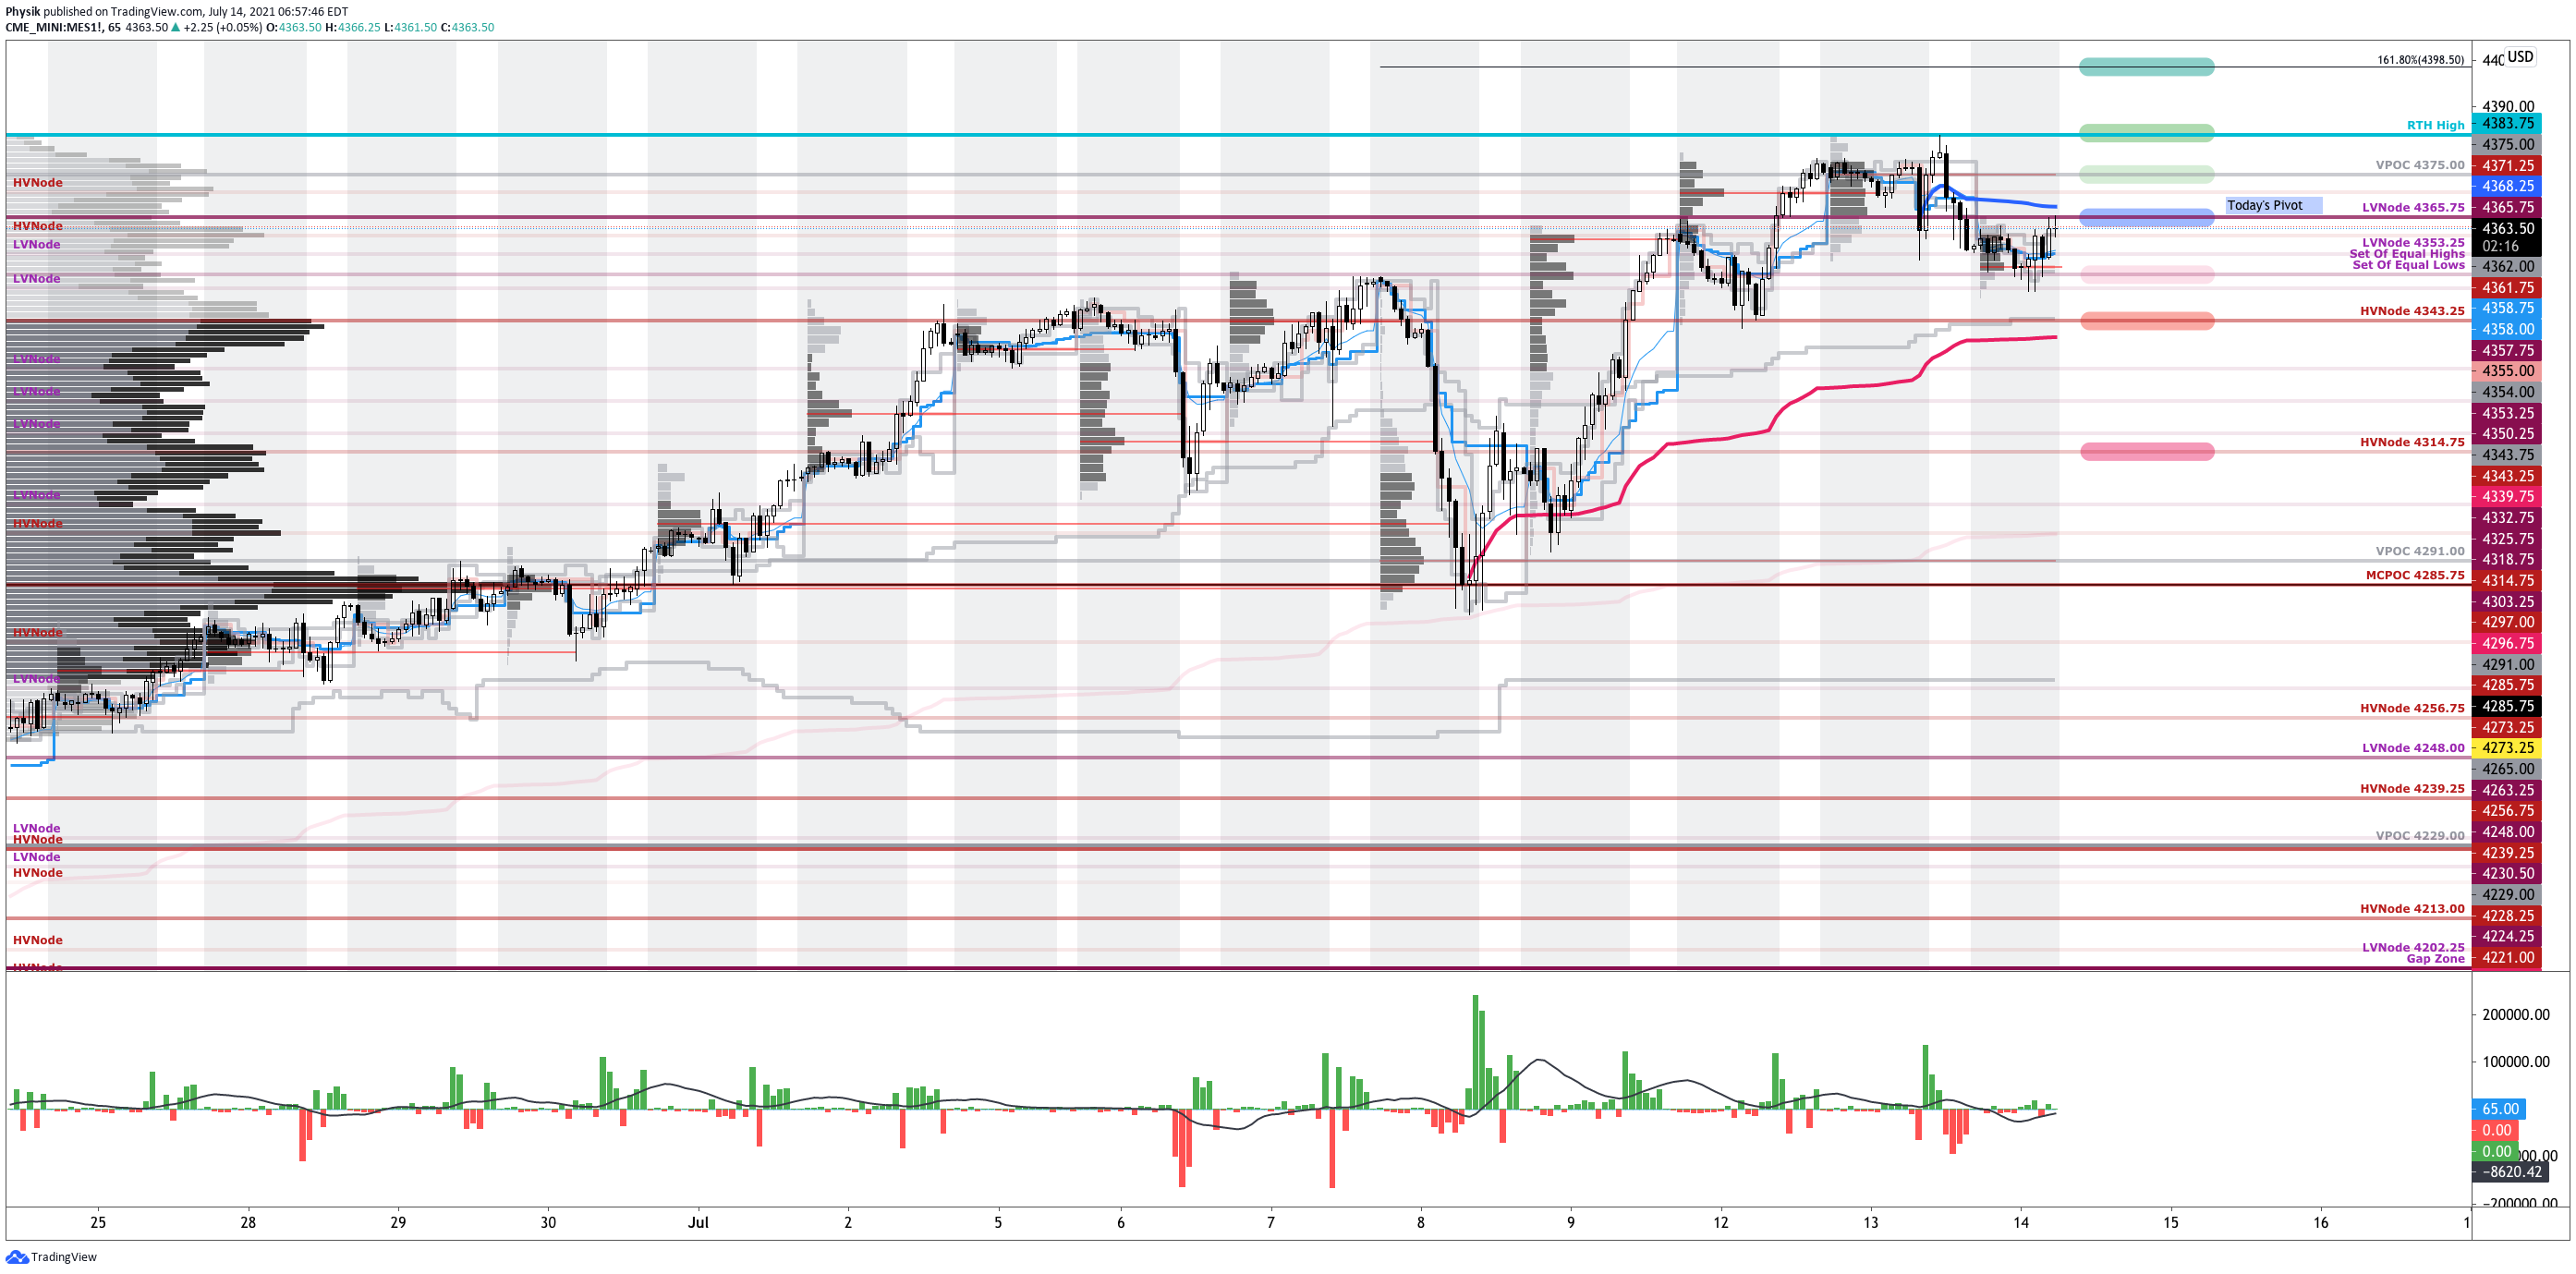
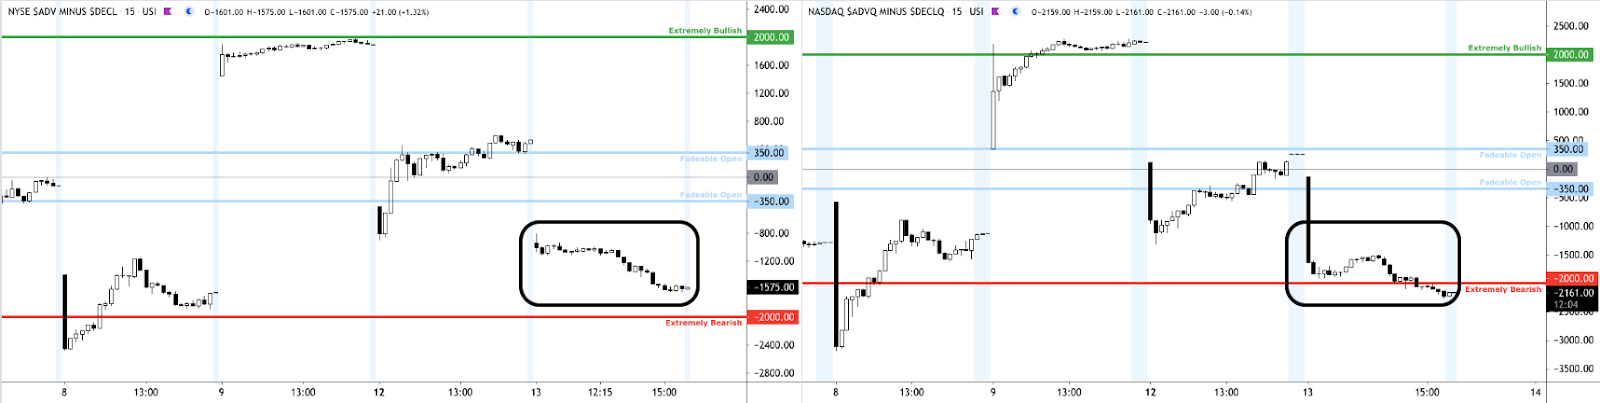
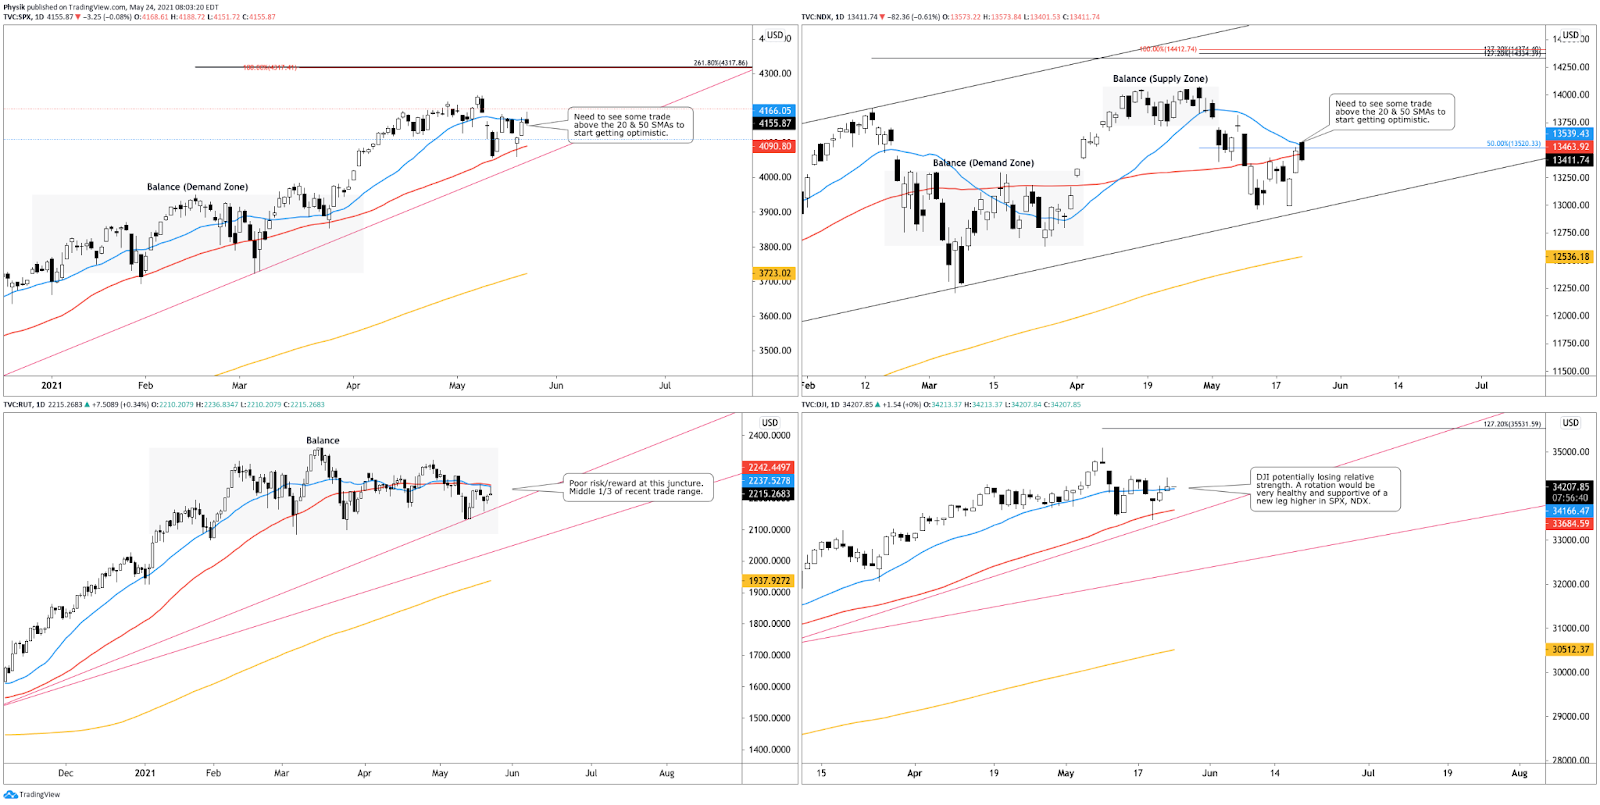
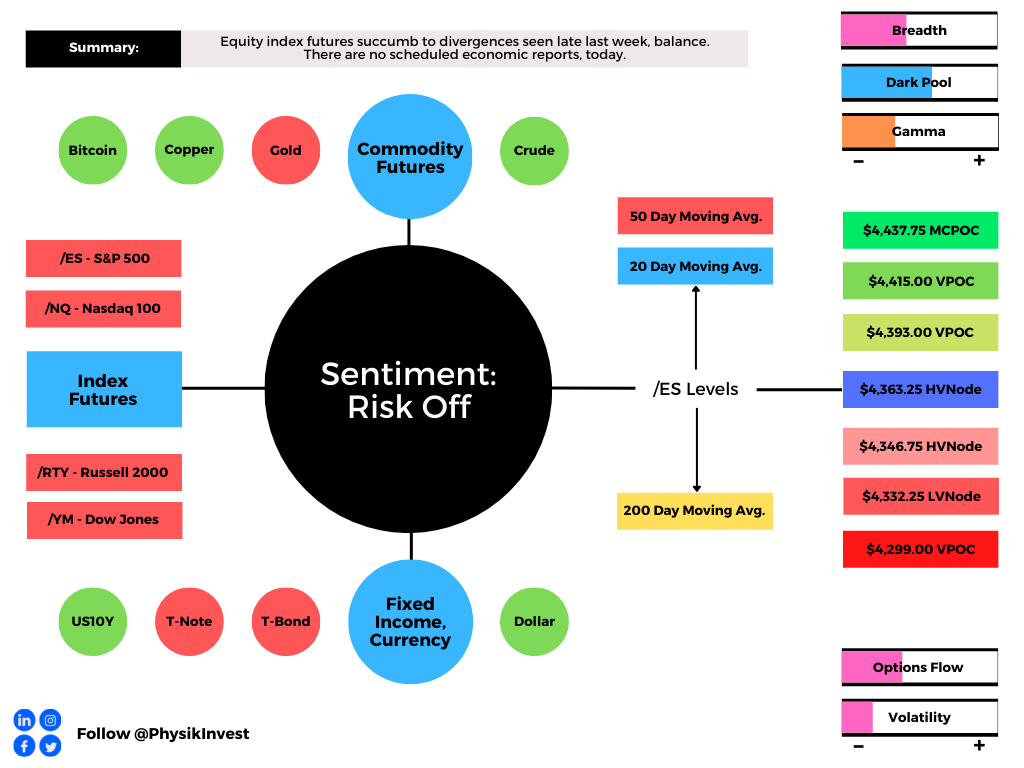
Further, during the prior week’s trade, on mostly strong intraday breadth and divergent market liquidity metrics, equity index futures established a rounded bottom and minimal excess low.
Then, a swift recovery ensued; initiative sellers lacked the wherewithal to take prices lower, beyond the S&P 500’s $4,363.25-$4,278.00 balance area. Initiative buyers were then emboldened, expanding range and value the opposite way.
During this recovery process, the S&P 500 – as evidenced by p-shaped emotional, multiple-distribution profile structures – established a minimal excess high before momentum from covering shorts was overpowered by responsive selling at key areas of resting liquidity, at and around /ES $4,410.25 (SPY $441.00), the site of a key anchored volume-weighted average price (VWAP) level.
Note: Liquidity algorithms are benchmarked and programmed to buy and sell around VWAPs.
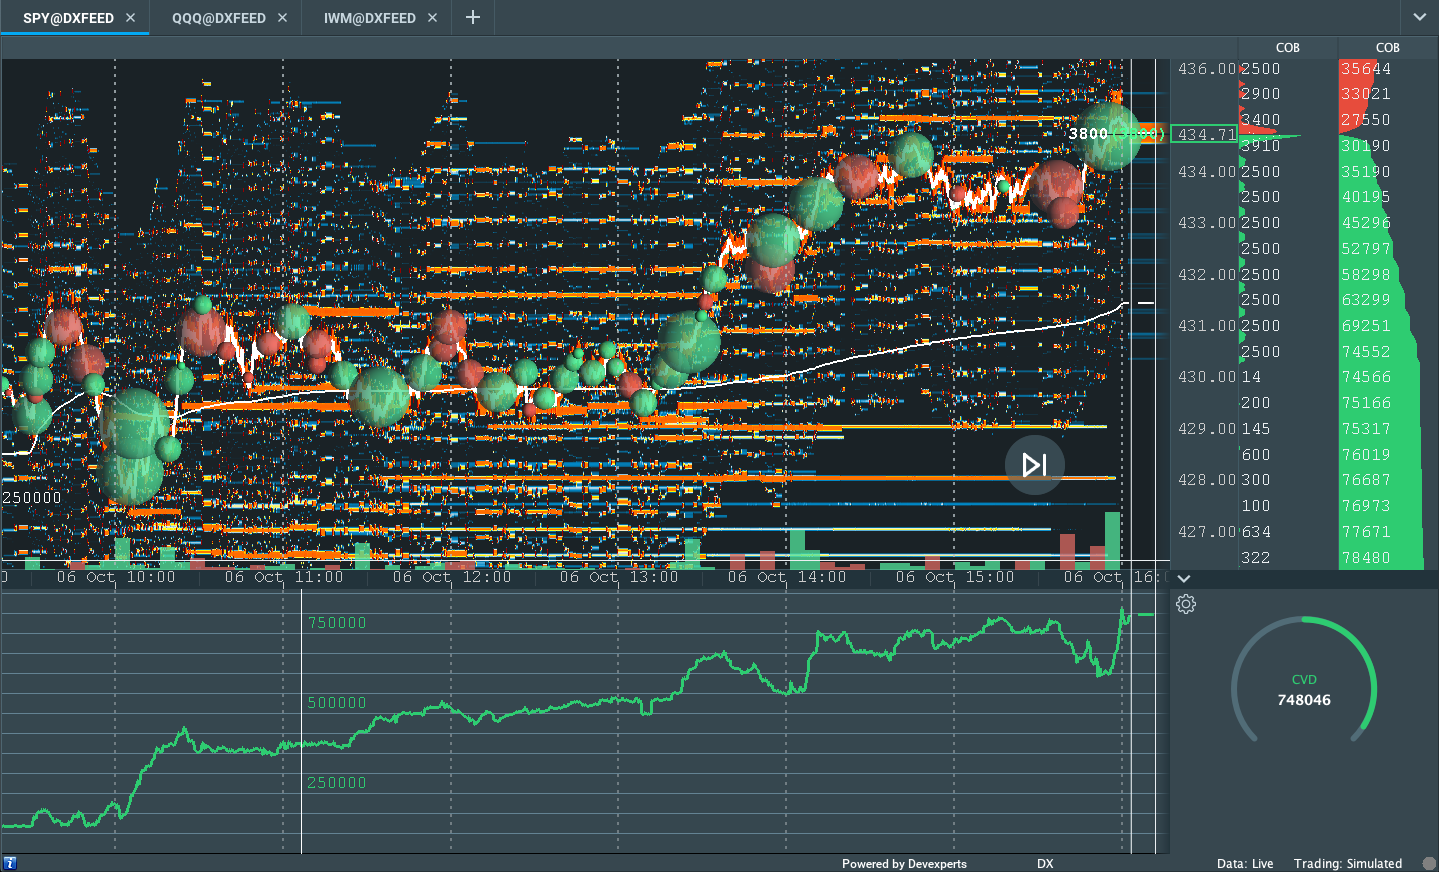
Friday’s session succumbed to divergences in buying and selling power as calculated by the difference in volume traded at the bid and offer, resolving some of the aforementioned emotional structures through what’s called the “cave-fill” process.
During this process, participants revisited, repaired, and strengthened – building out areas of high volume (HVNodes), or value – areas low volume (LVNodes).
Note: The cave-fill process widened the area deemed favorable to transact at by an increased share of participants. This is a good development.
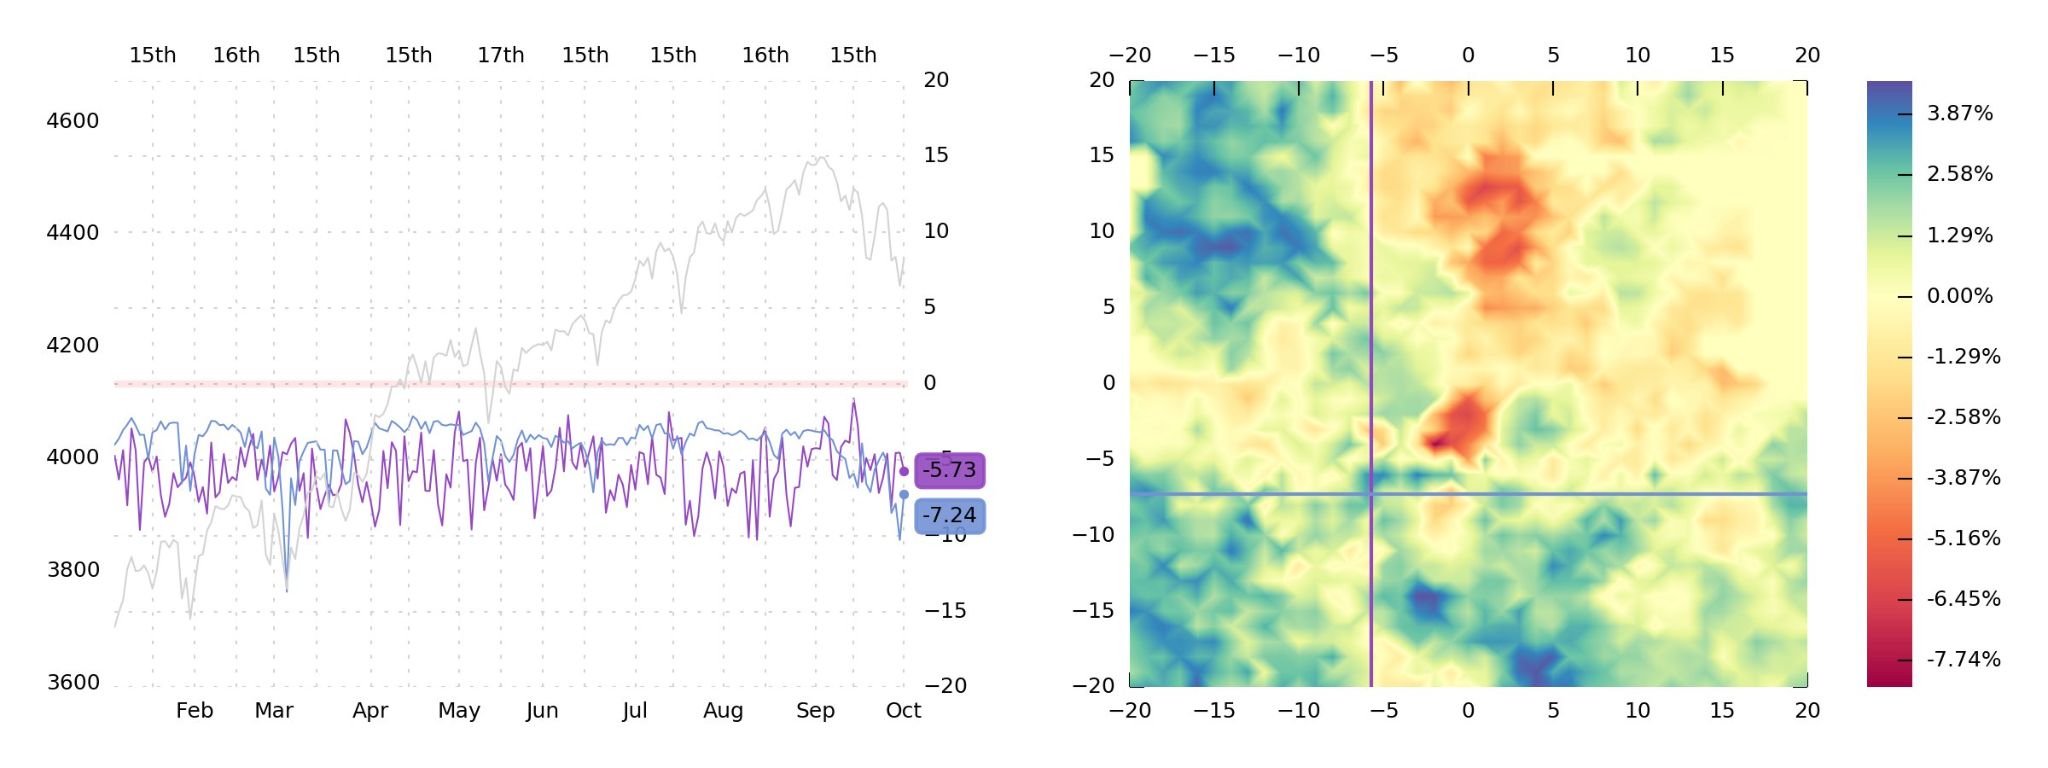
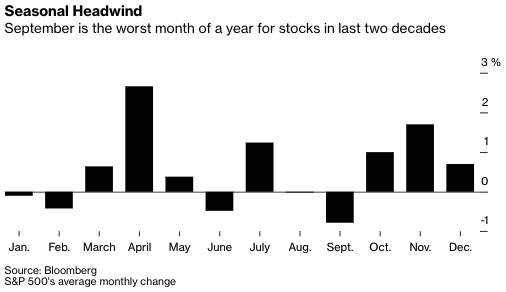
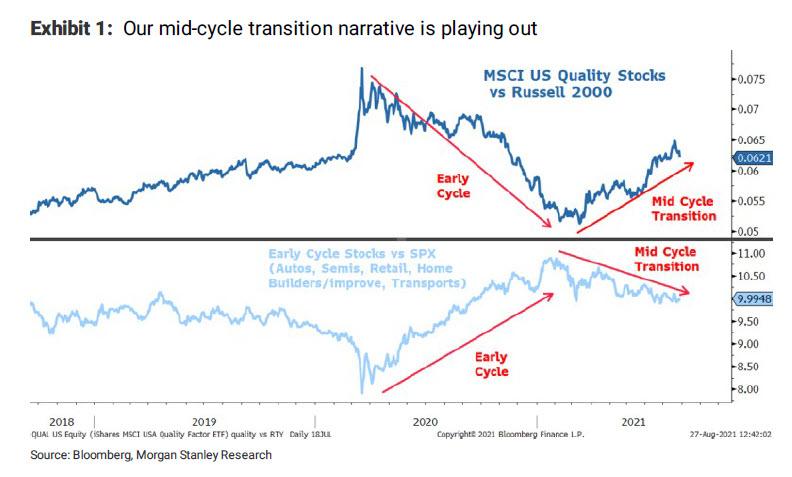
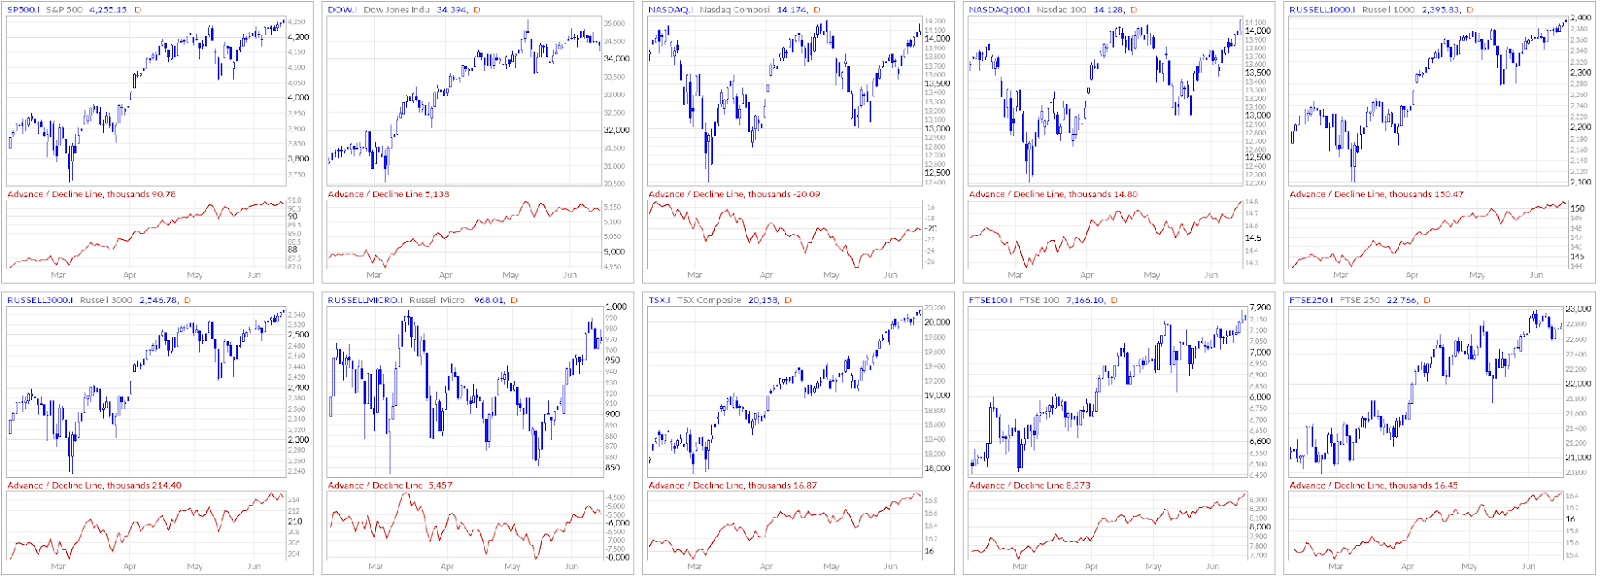
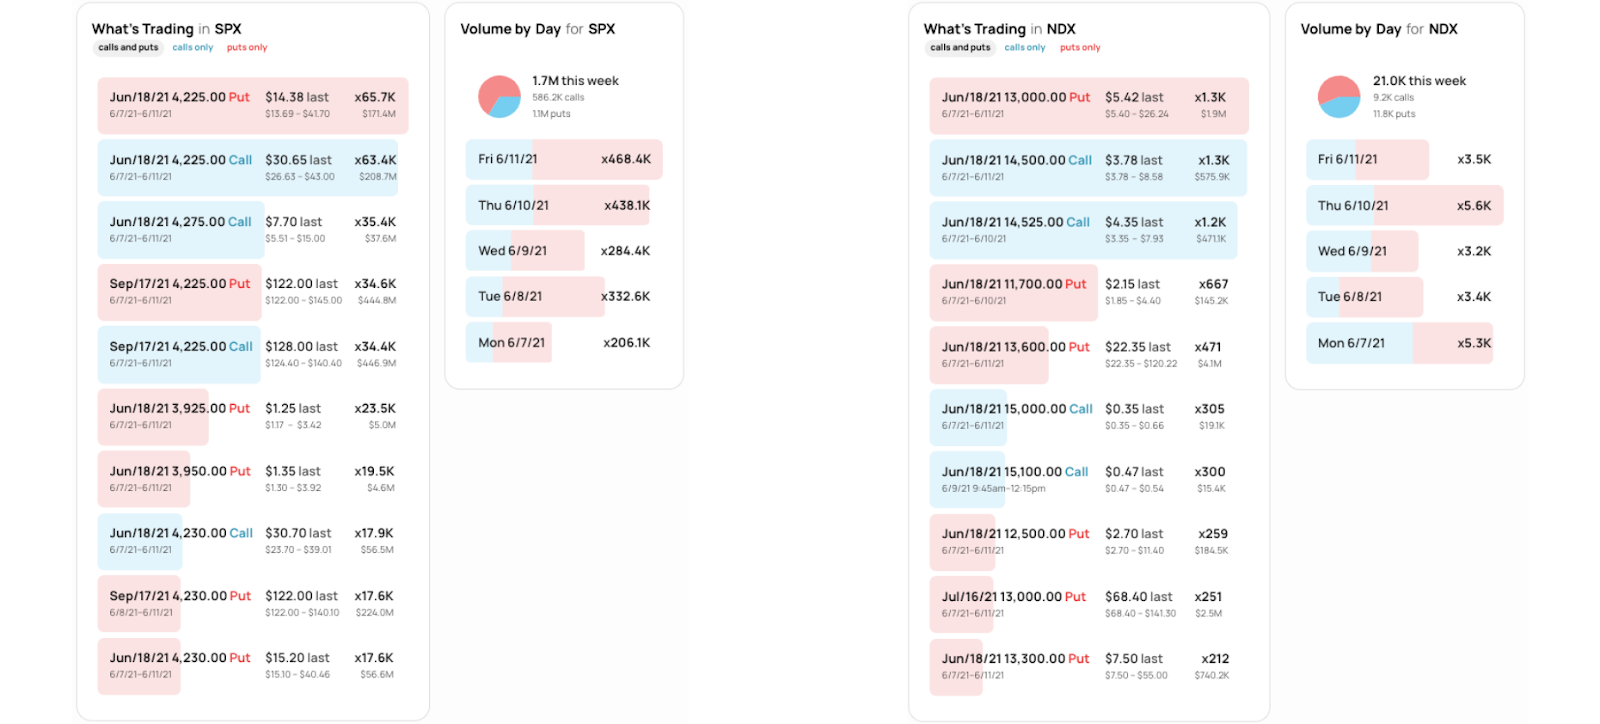
Moreover, September’s seasonally-aligned weakness saw the Nasdaq 100 lead lower. Last week – alongside improvement amongst some positioning metrics – the tone shifted with the cash-settled Nasdaq 100 (INDEX: NDX) rising 4.35% versus the S&P 500 (INDEX: SPX) rising 3.25%.
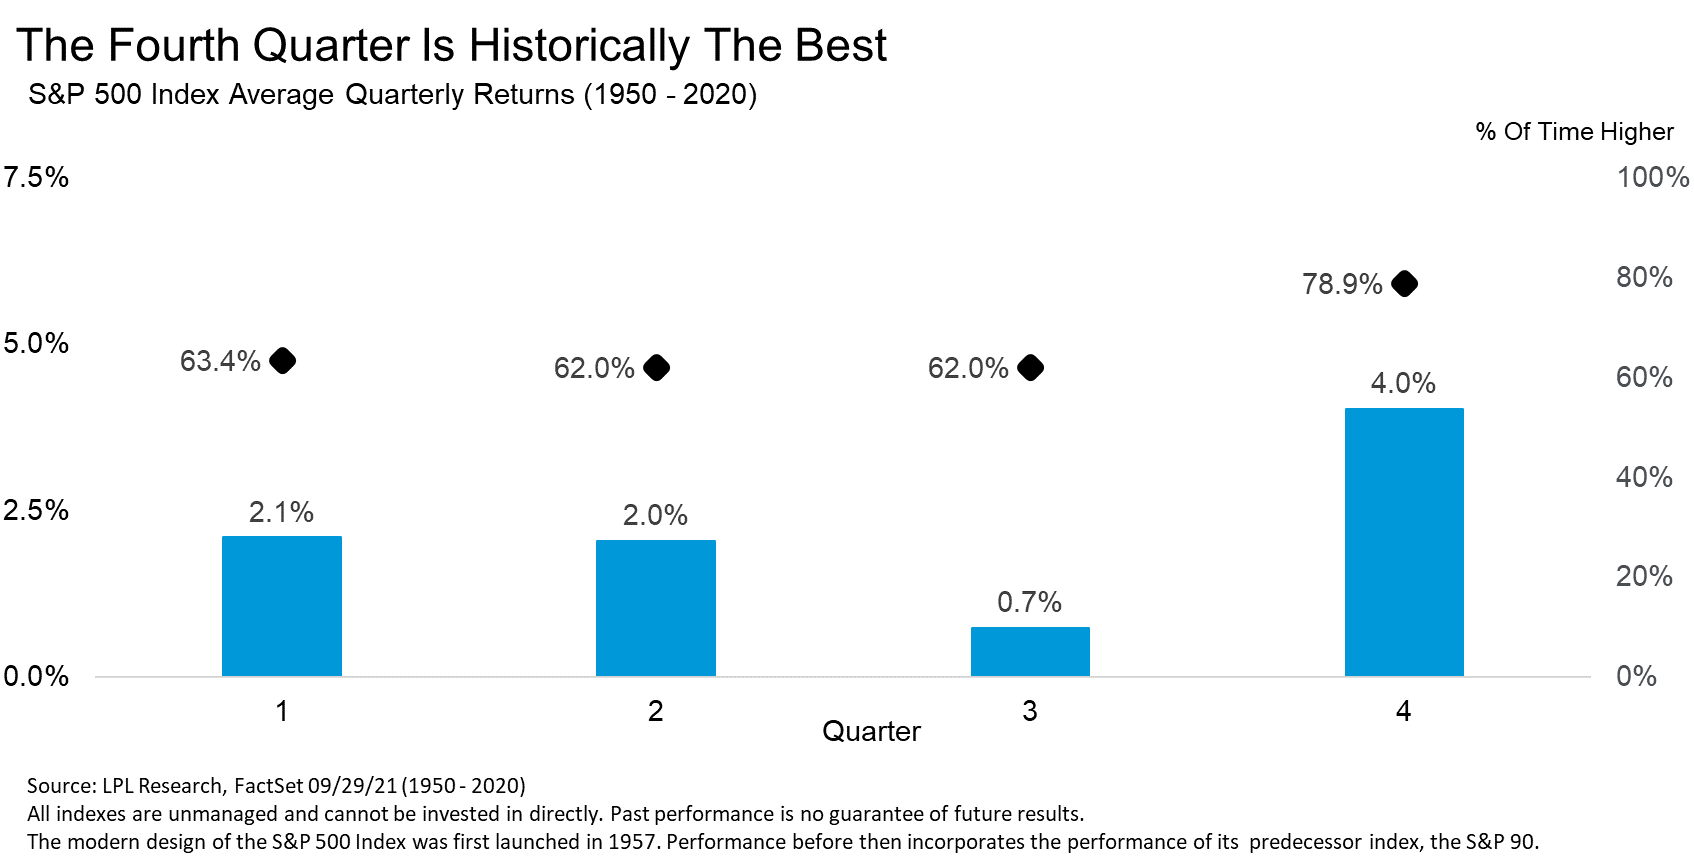
That comes as October traditionally marks an end to weakness amidst a cycle of rebalancing and earnings; according to LPL Financial Research, “Stocks rise 3.8% on average during the fourth quarter, but the past seven times the S&P 500 was up 15% year-to-date heading into the home stretch of the year, the fourth quarter was higher every single time, up a very impressive 5.8%.”
“Earnings for the third quarter should again be strong and mostly outpace expectations,” Leuthold Group chief investment strategist Jim Paulsen adds. “Hours worked in the third quarter rose by about 5% suggesting real GDP for the quarter may be close to 7%. With most companies reporting strong pricing power, solid real GDP growth should result in another surprisingly strong corporate earnings season.”

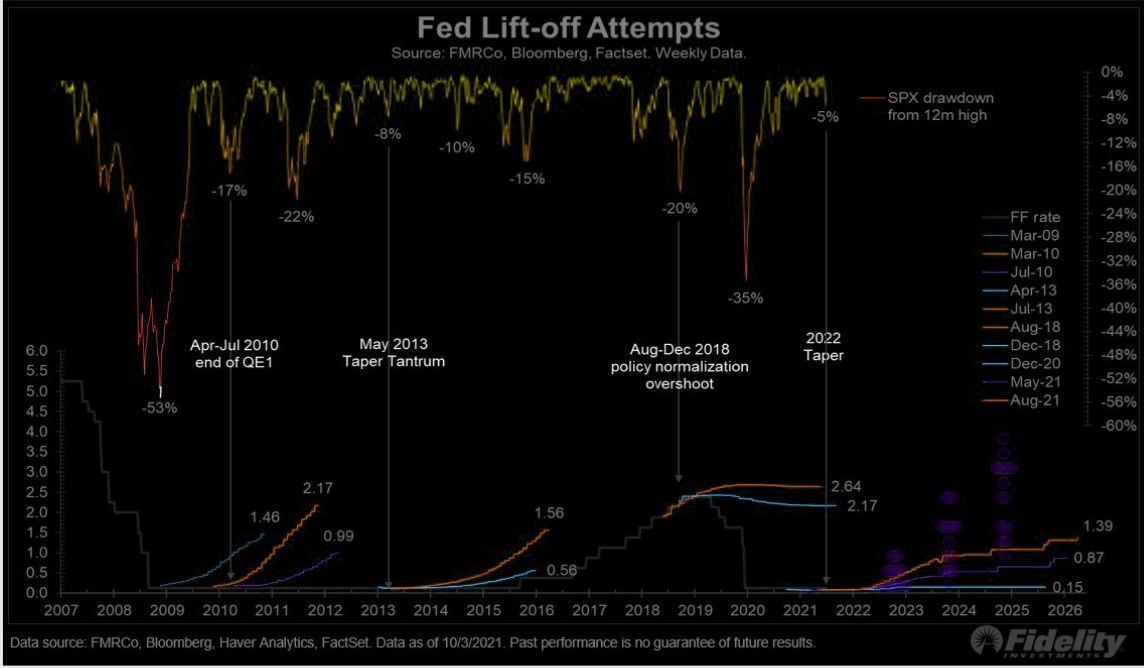
Notwithstanding, some risks to be aware of include the Federal Reserve’s tapering initiatives and the prospects of a rise in the Fed funds rate, amidst hot sentiment, a decline in top-of-book depth, as well as back and forth entry (exit) into (from) short-gamma.
“What we see in the equity space is a lot of sensitivity to higher real yields,” Joseph Little, chief global strategist at HSBC Holdings Plc (NYSE: HSBC) Asset Management, said. “We are seeing policy normalization everywhere. That creates a little bit of a challenge for [the] equity market because it does change the drivers of equity performance.”
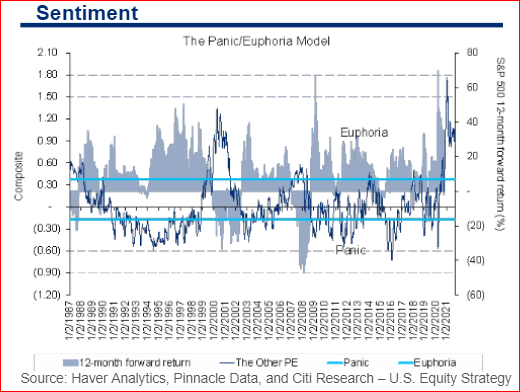
In addition, to balance some of our Q4 bullishness, in a quote highlighted by The Market Ear, Bank of America Corporation (NYSE: BAC) explained: September 30 “was the 24th time since 1928 that the S&P experienced two or more 3-sigma shocks in 10 trading days, … [and] only in 3 of 23 episodes (and 1 in the last 50yrs) did the S&P surpass the prior month’s peak in the month following the second shock.”
Moreover, for today, participants may make use of the following frameworks.
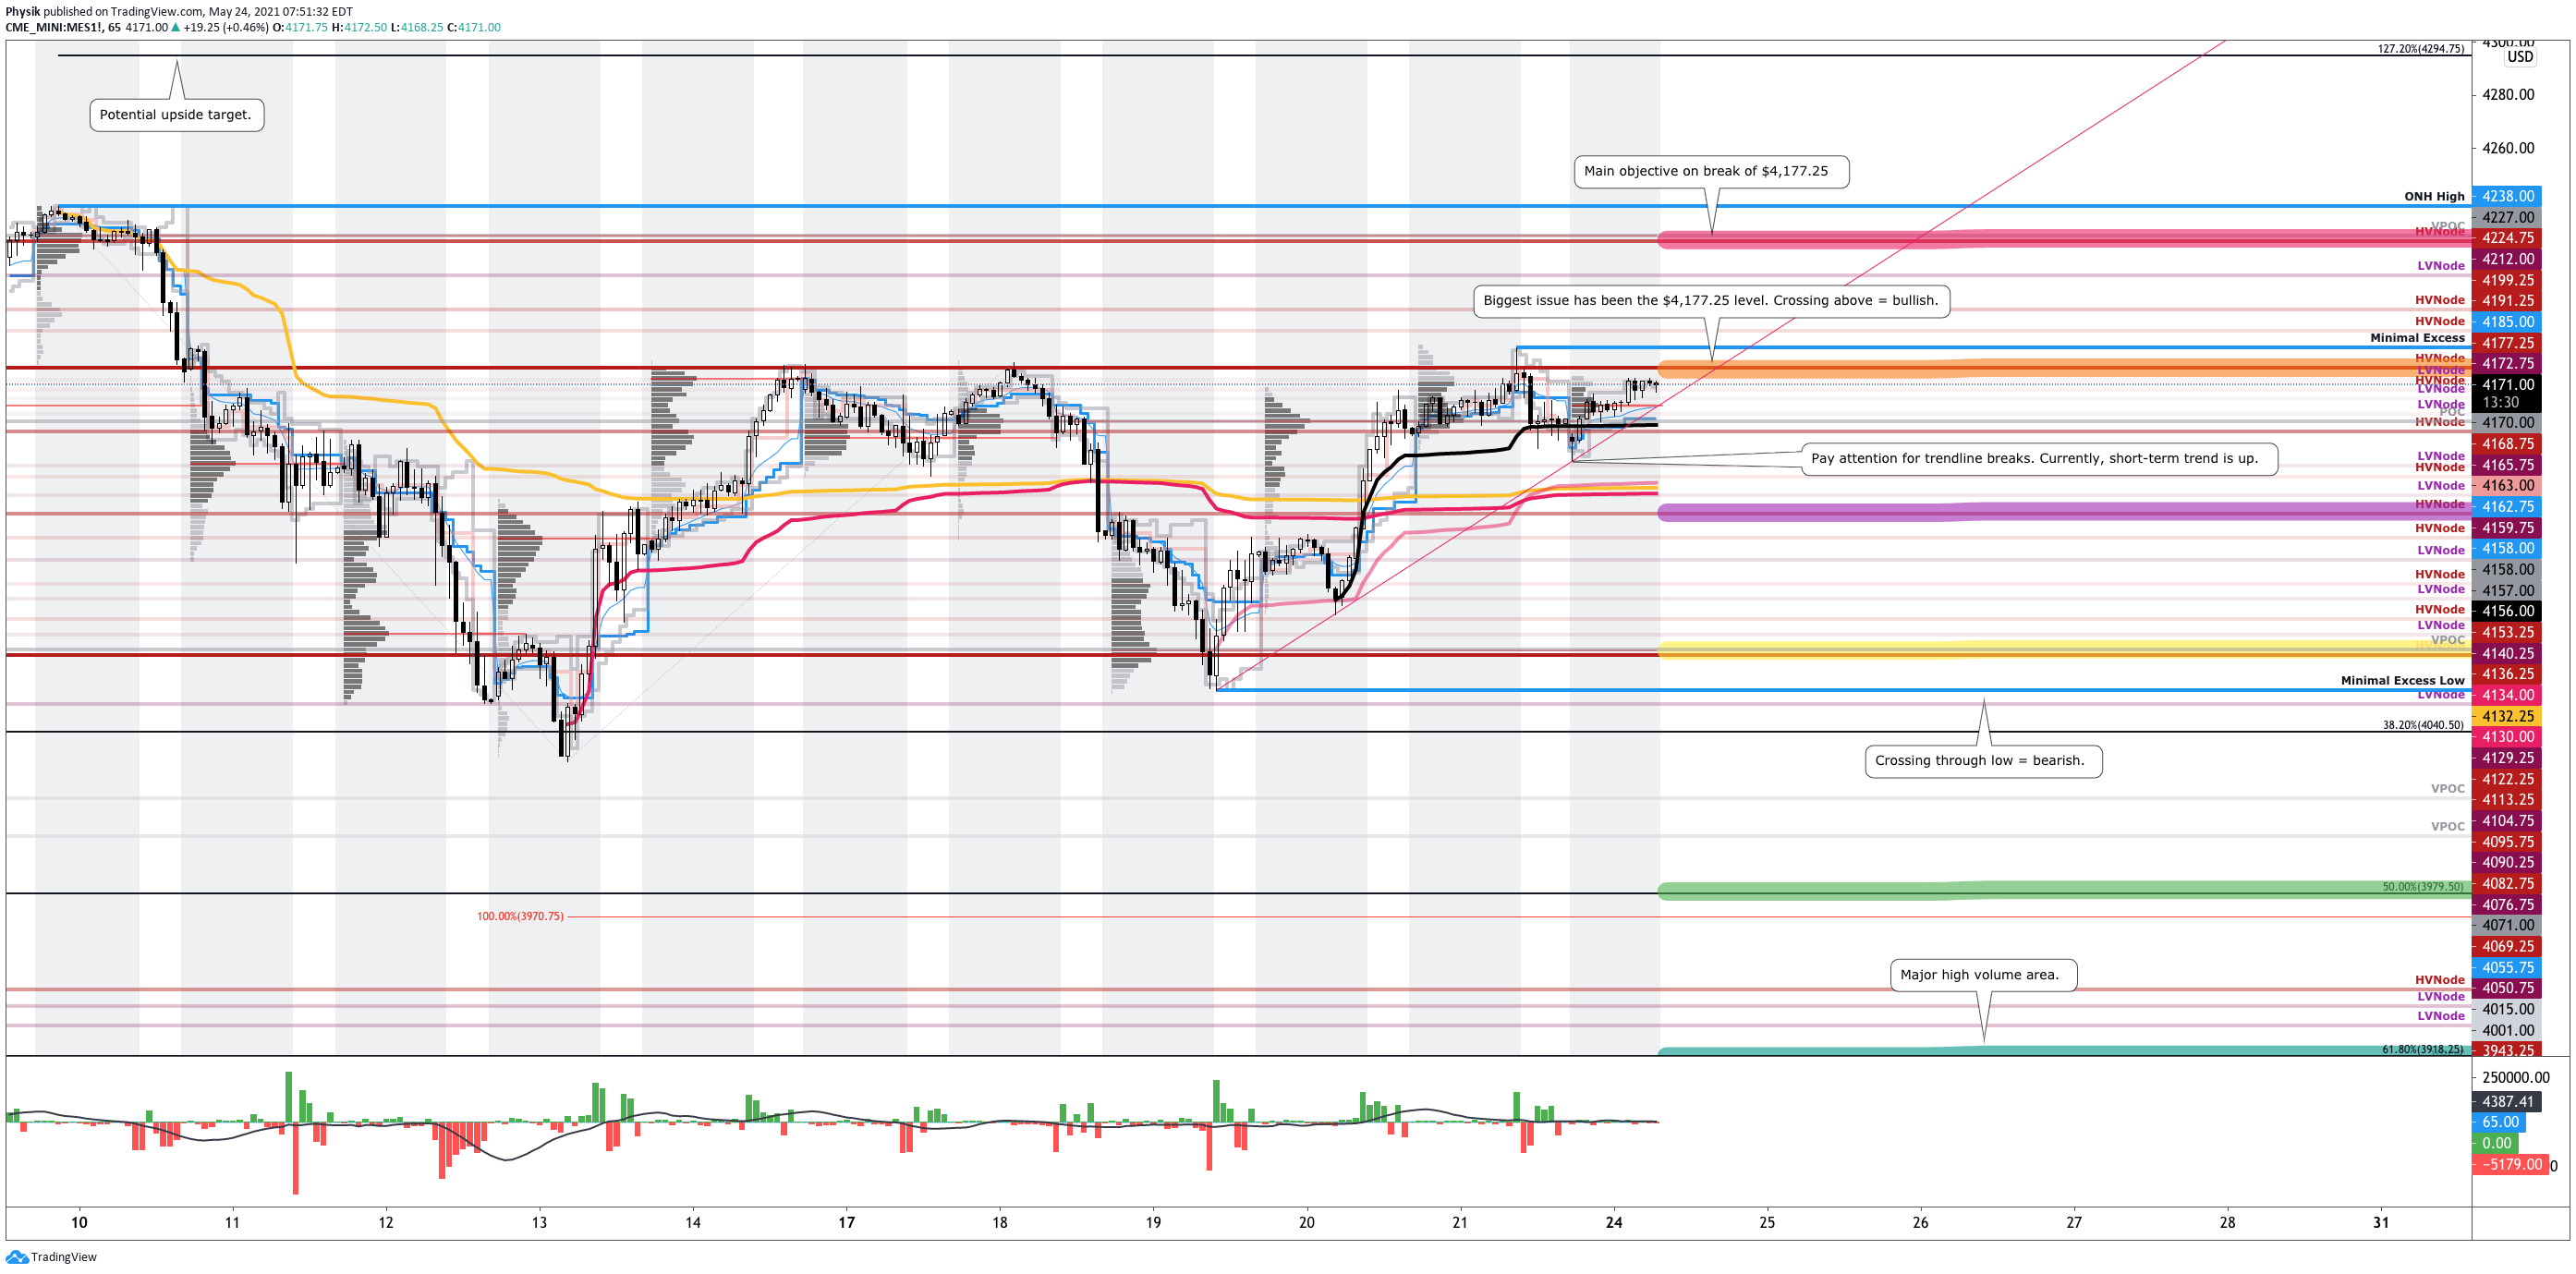
In the best case, the S&P 500 trades sideways or higher; activity above the $4,363.25 high volume area (HVNode) puts in play the $4,393.00 untested point of control (VPOC). Initiative trade beyond the $4,393.00 VPOC could reach as high as the $4,415.00 VPOC and $4,437.75 micro composite point of control (MCPOC), or higher.
In the worst case, the S&P 500 trades lower; activity below the $4,363.25 HVNode puts in play the $4,346.75 HVNode. Initiative trade beyond the HVNode could reach as low as the $4,332.25 low volume area (LVNode) and $4,299.00 VPOC, or lower.

Definitions
Volume Areas: A structurally sound market will build on areas of high volume (HVNodes). Should the market trend for long periods of time, it will lack sound structure, identified as low volume areas (LVNodes). LVNodes denote directional conviction and ought to offer support on any test.
If participants were to auction and find acceptance into areas of prior low volume (LVNodes), then future discovery ought to be volatile and quick as participants look to HVNodes for favorable entry or exit.
Gamma: Gamma is the sensitivity of an option to changes in the underlying price. Dealers that take the other side of options trades hedge their exposure to risk by buying and selling the underlying. When dealers are short-gamma, they hedge by buying into strength and selling into weakness. When dealers are long-gamma, they hedge by selling into strength and buying into weakness. The former exacerbates volatility. The latter calms volatility.
POCs: POCs are valuable as they denote areas where two-sided trade was most prevalent in a prior day session. Participants will respond to future tests of value as they offer favorable entry and exit.
MCPOCs: POCs are valuable as they denote areas where two-sided trade was most prevalent over numerous day sessions. Participants will respond to future tests of value as they offer favorable entry and exit.
Excess: A proper end to price discovery; the market travels too far while advertising prices. Responsive, other-timeframe (OTF) participants aggressively enter the market, leaving tails or gaps which denote unfair prices.
Value-Area Placement: Perception of value unchanged if value overlapping (i.e., inside day). Perception of value has changed if value not overlapping (i.e., outside day). Delay trade in the former case.
News And Analysis
Banks bought epic amounts of safe assets; forget inflation.
The Fed is likely to side with growth and keep policy easy.
Merck seeks emergency use authorization for COVID pills.
Europe Economic Snapshot: Faster-than-expected restart.
Latin America settles into new post-pandemic slow growth.
S&P talking stock-flow confusion again – QE and tapering.
What People Are Saying
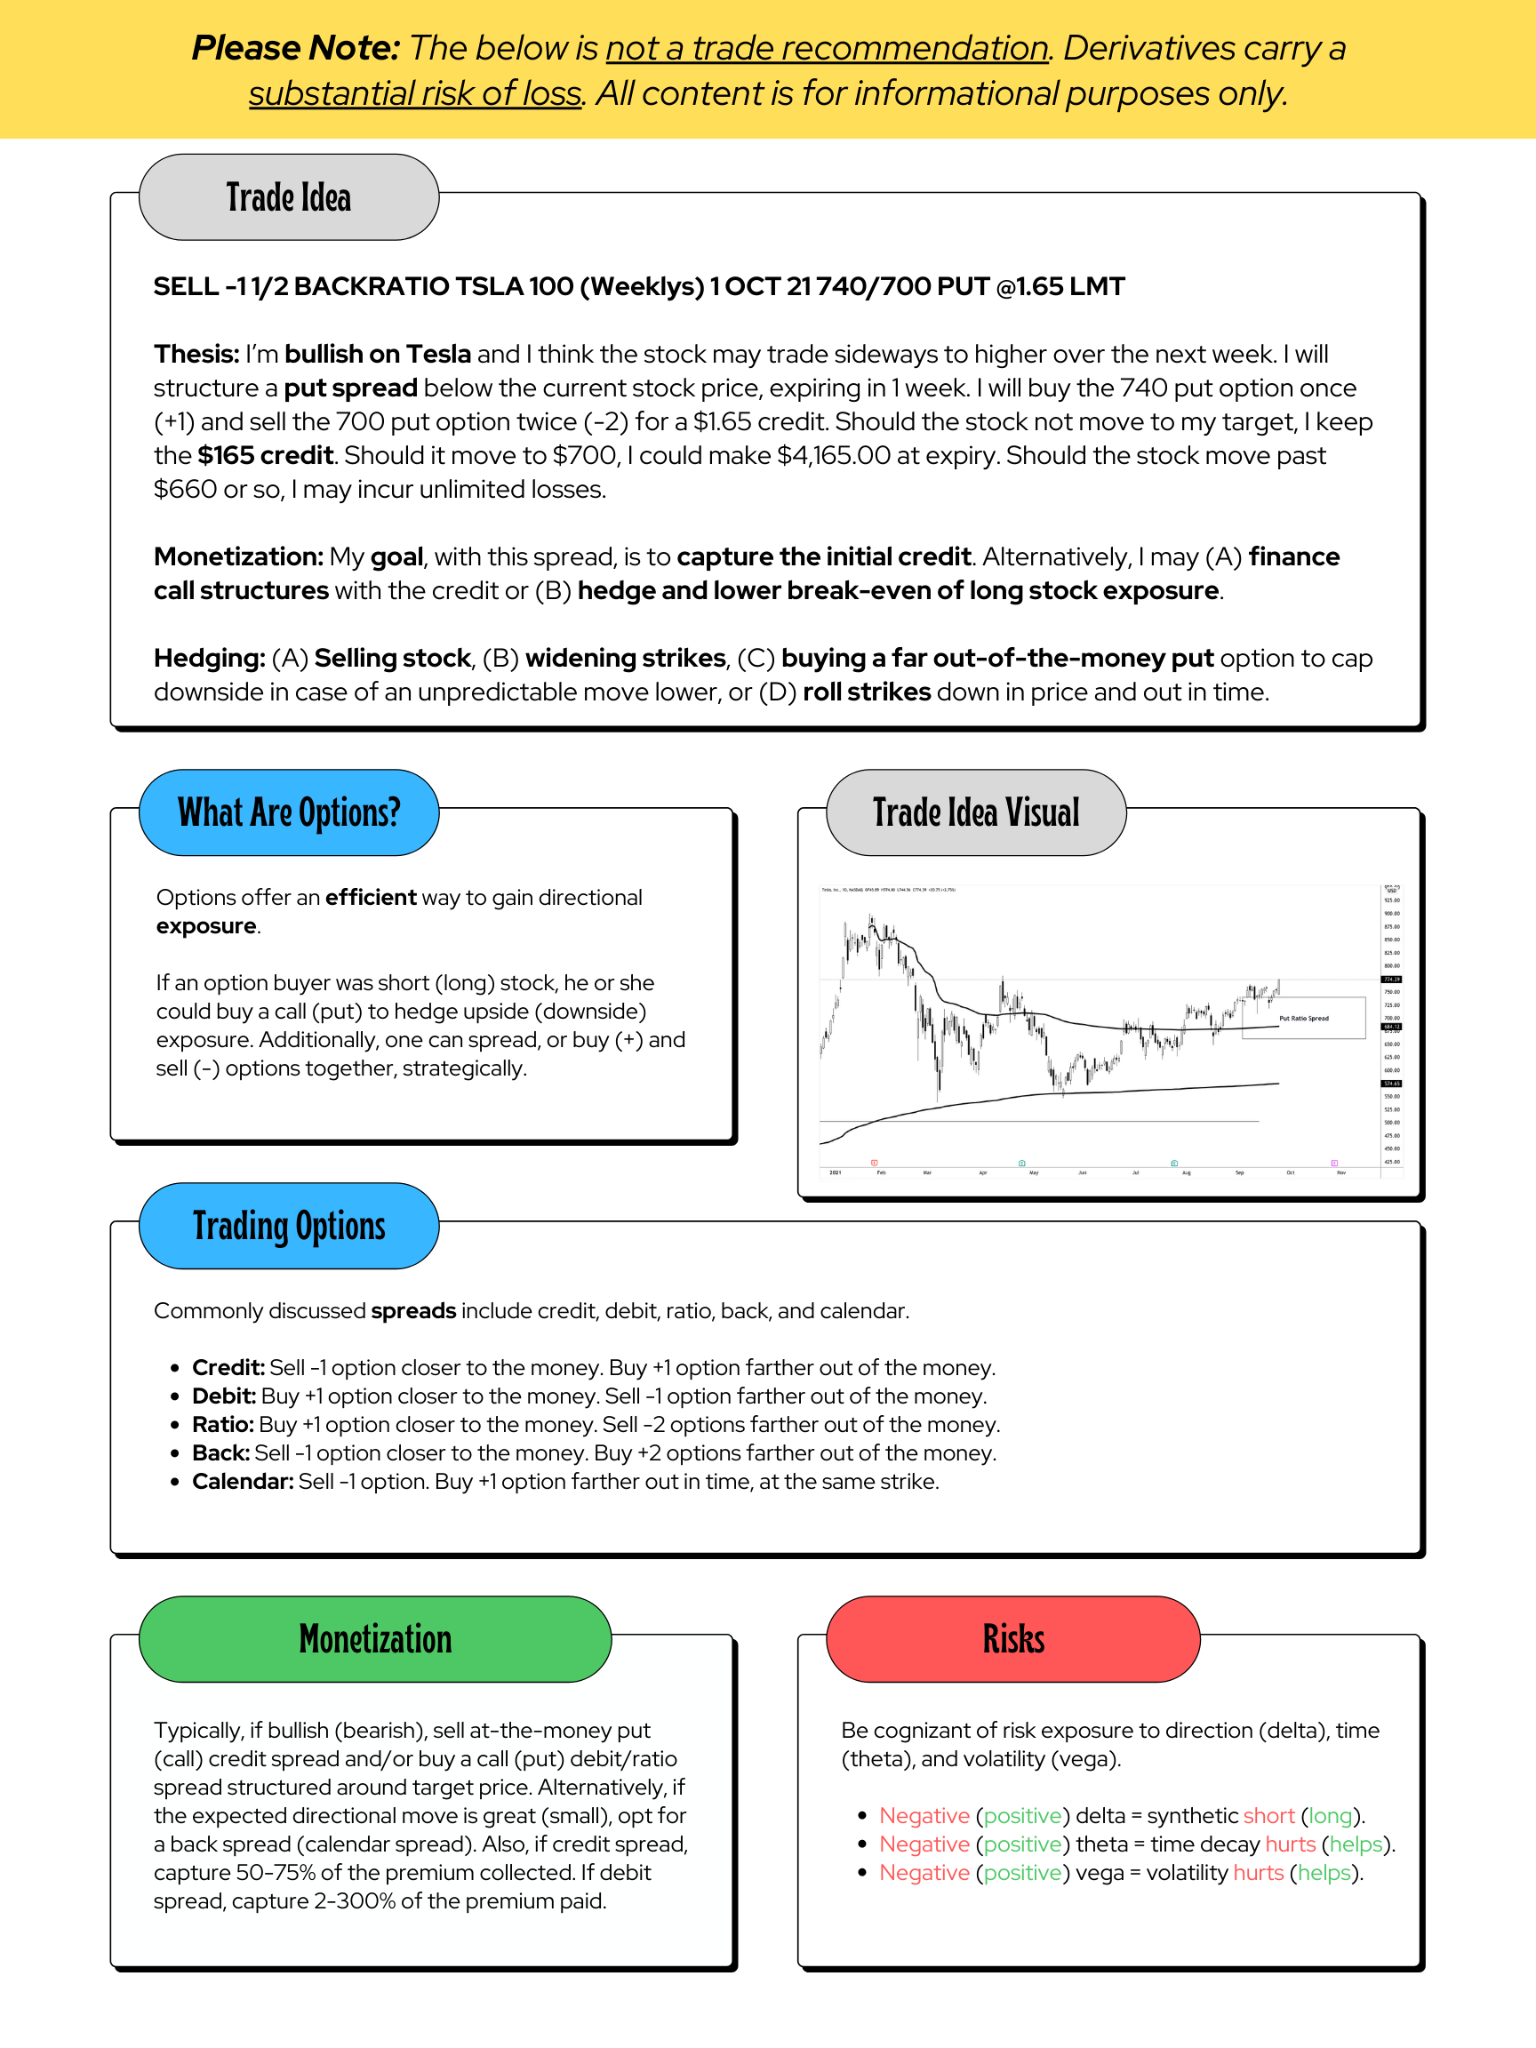
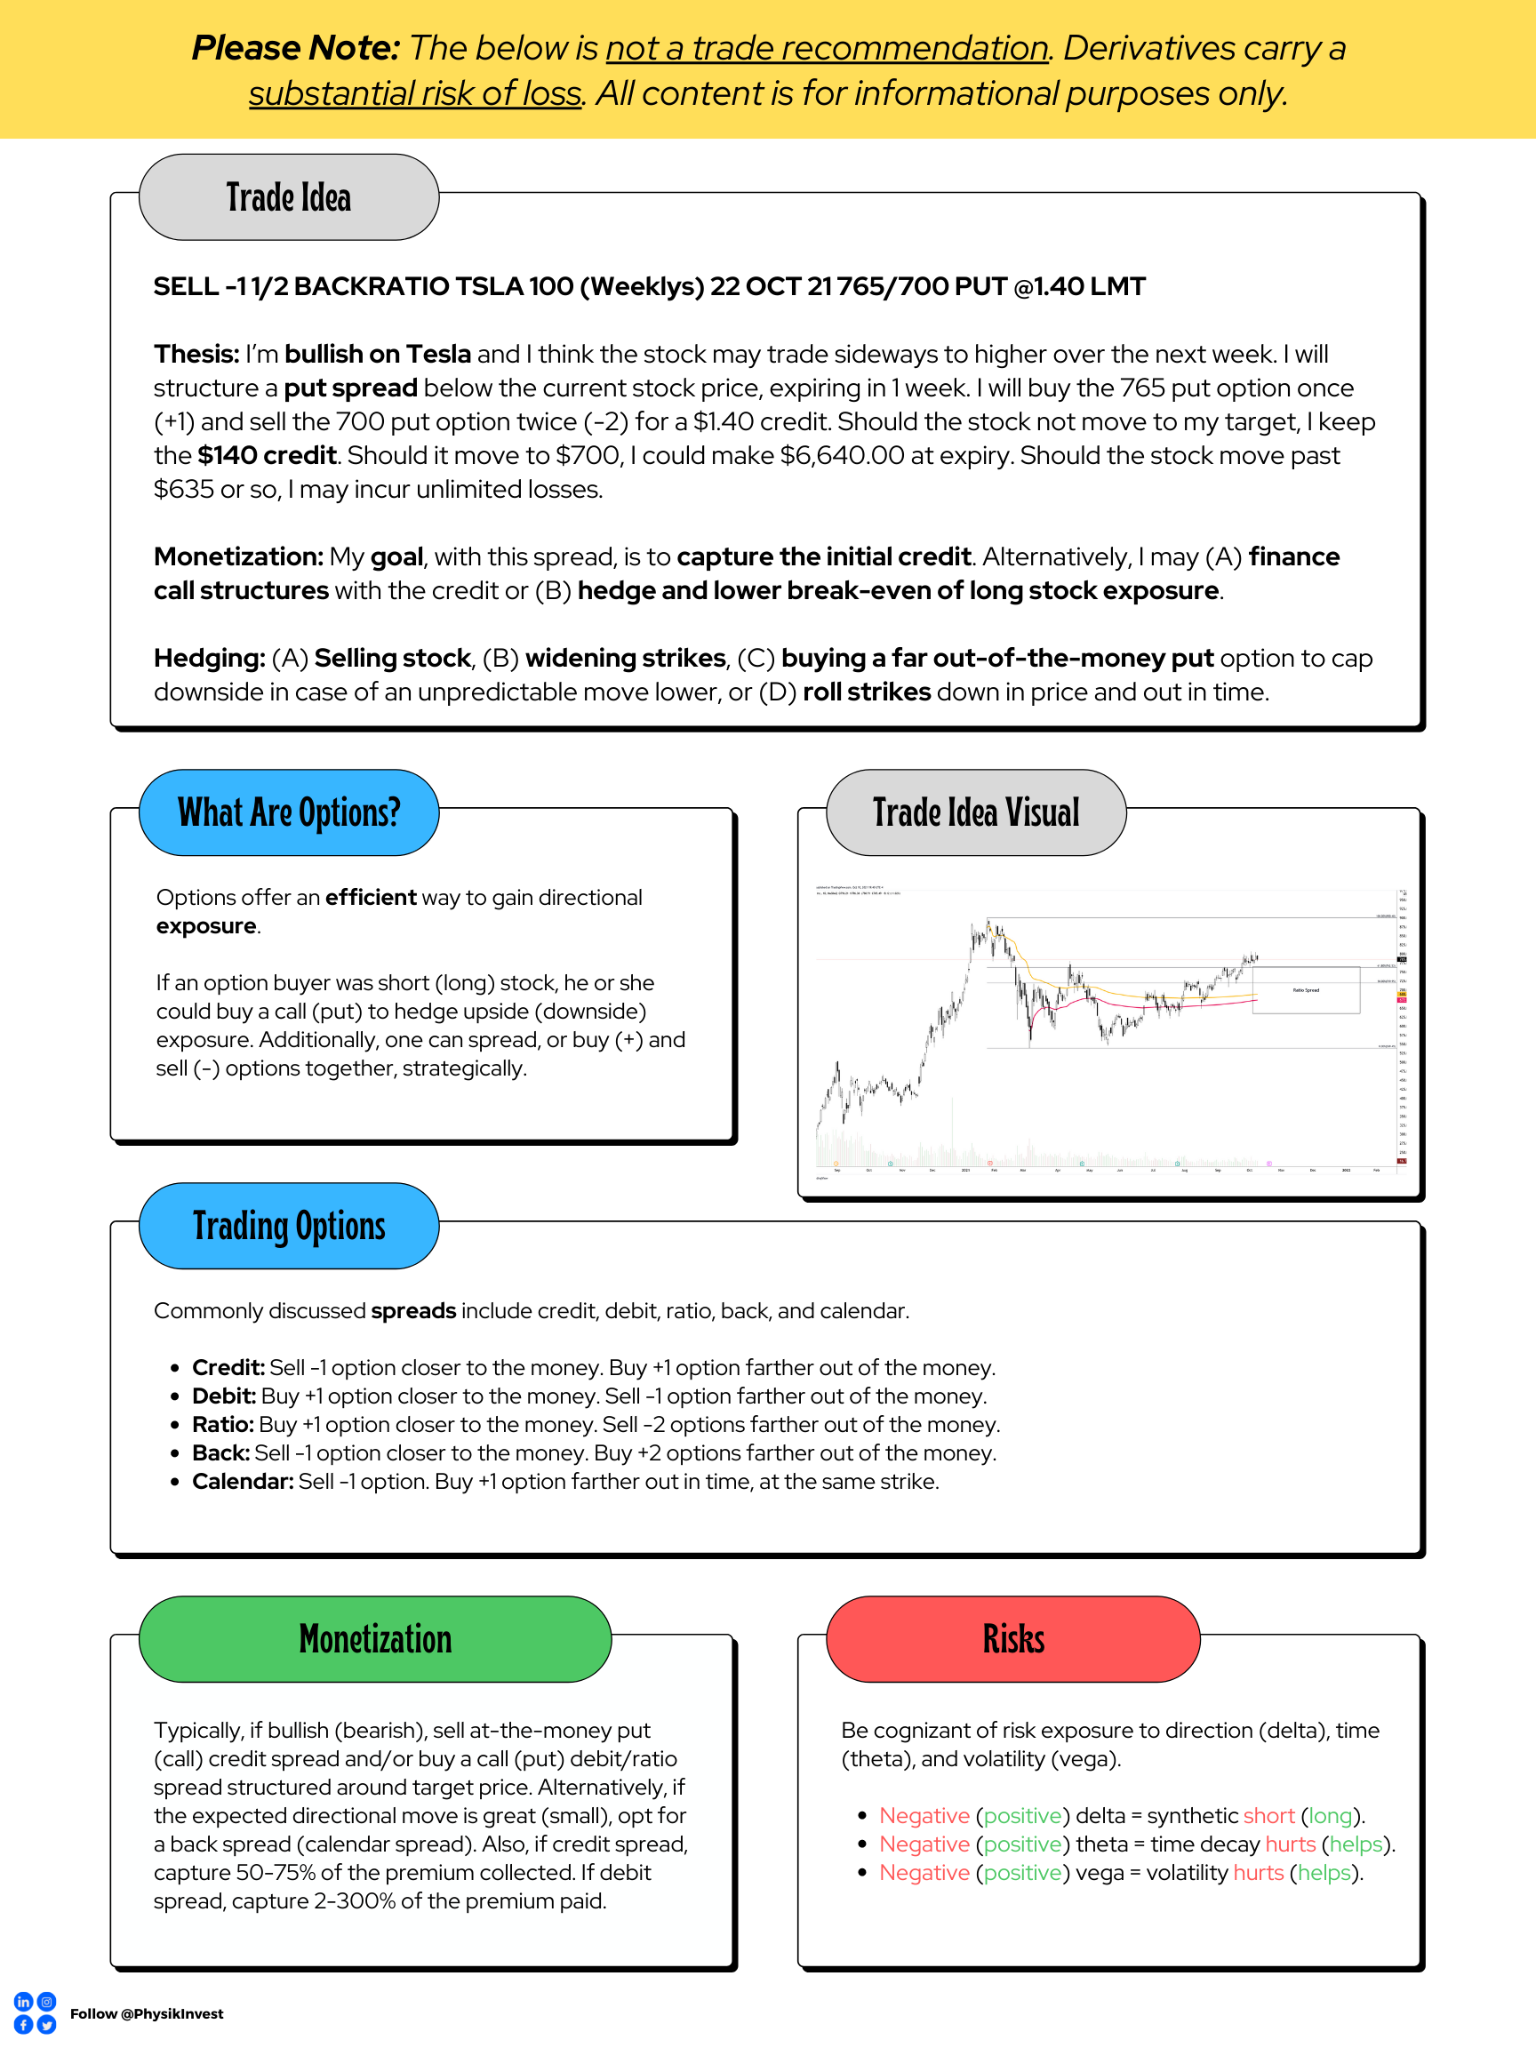
Weekly Trade Idea
About
After years of self-education, strategy development, and trial-and-error, Renato Leonard Capelj began trading full-time and founded Physik Invest to detail his methods, research, and performance in the markets.
Additionally, Capelj is a finance and technology reporter. Some of his biggest works include interviews with leaders such as John Chambers, founder and CEO, JC2 Ventures, Kevin O’Leary, businessman and Shark Tank host, Catherine Wood, CEO and CIO, ARK Invest, among others.
Disclaimer
At this time, Physik Invest does not manage outside capital and is not licensed. In no way should the materials herein be construed as advice. Derivatives carry a substantial risk of loss. All content is for informational purposes only.