What Happened
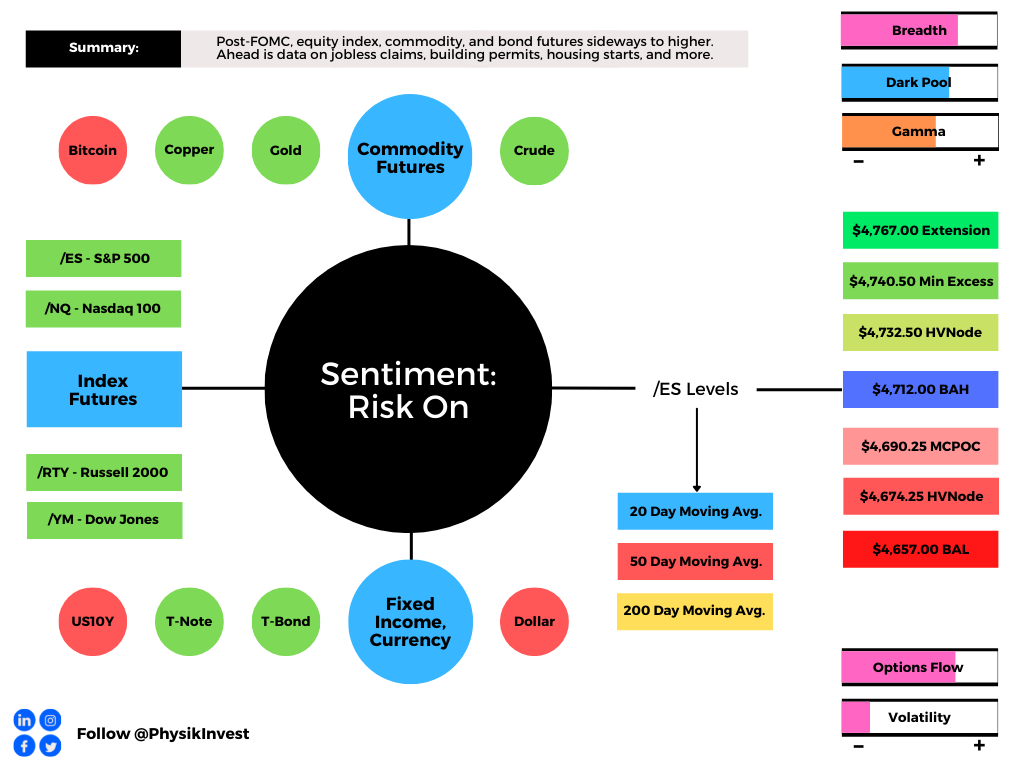
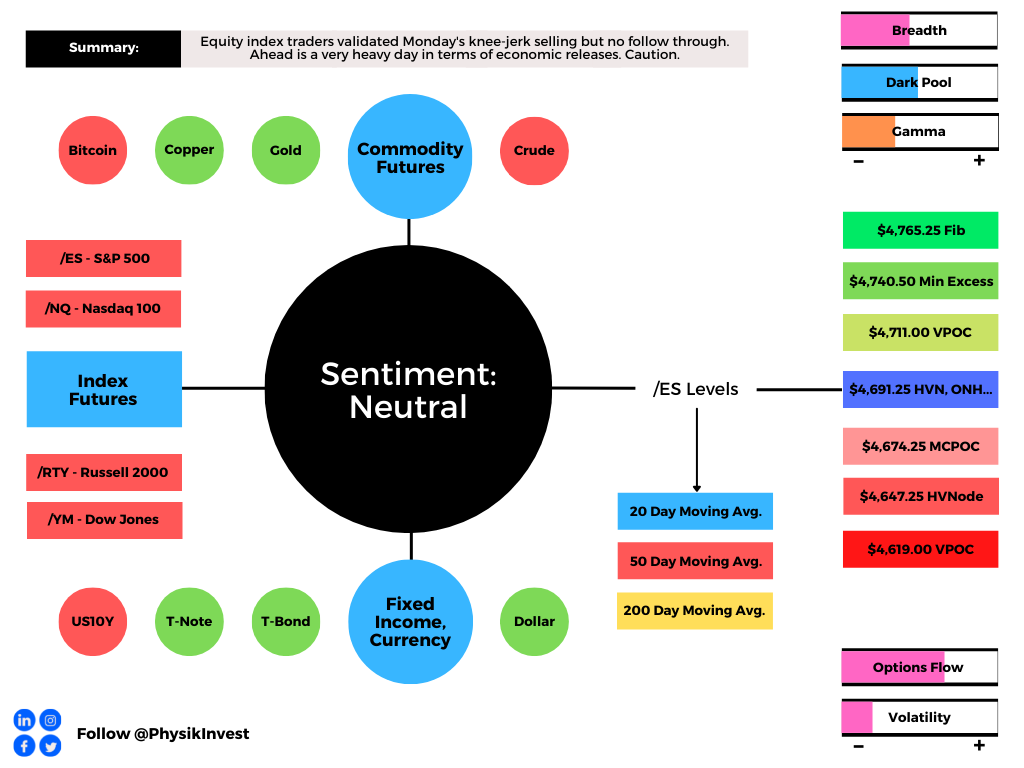
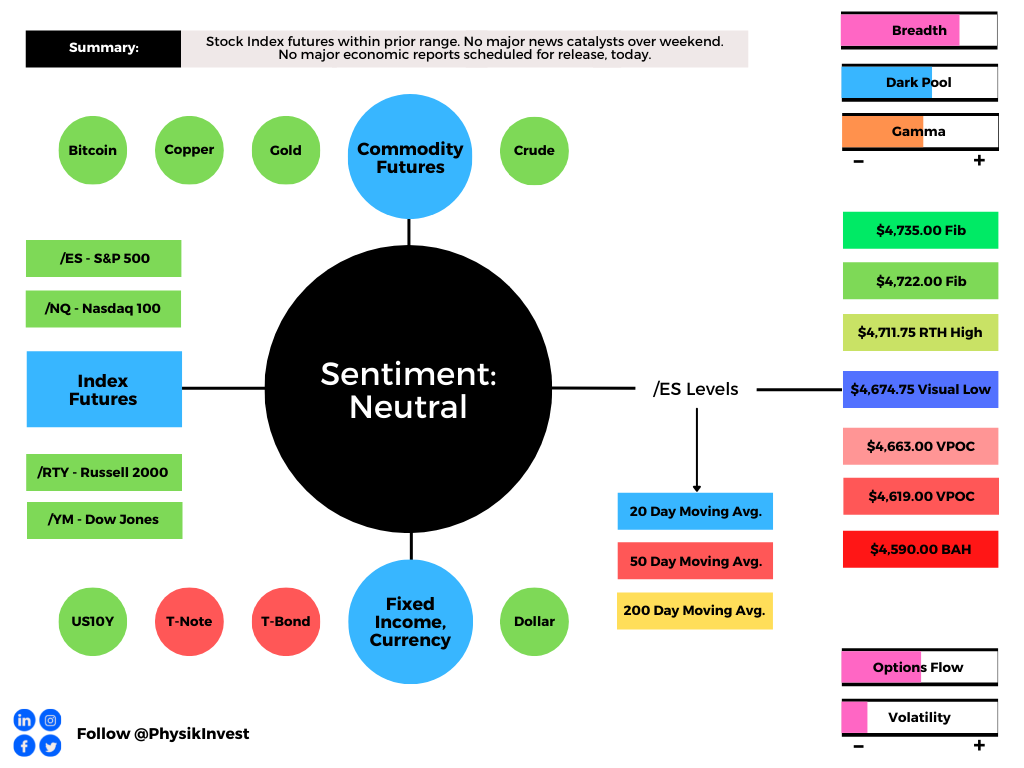
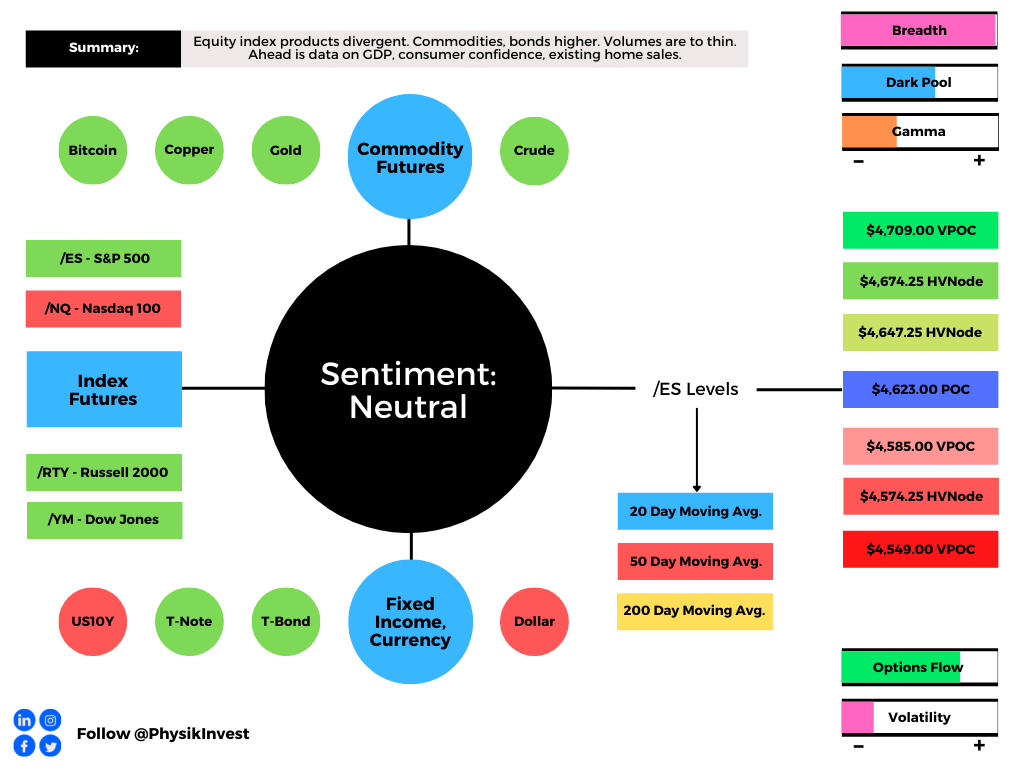
Overnight, equity index futures were divergent while most commodity and bond products were sideways to higher. This is as traders position themselves for the less liquid holiday trade.
Ahead is data on gross domestic product and income (8:30 AM ET), consumer confidence, and existing home sales (10:00 AM ET).
What To Expect
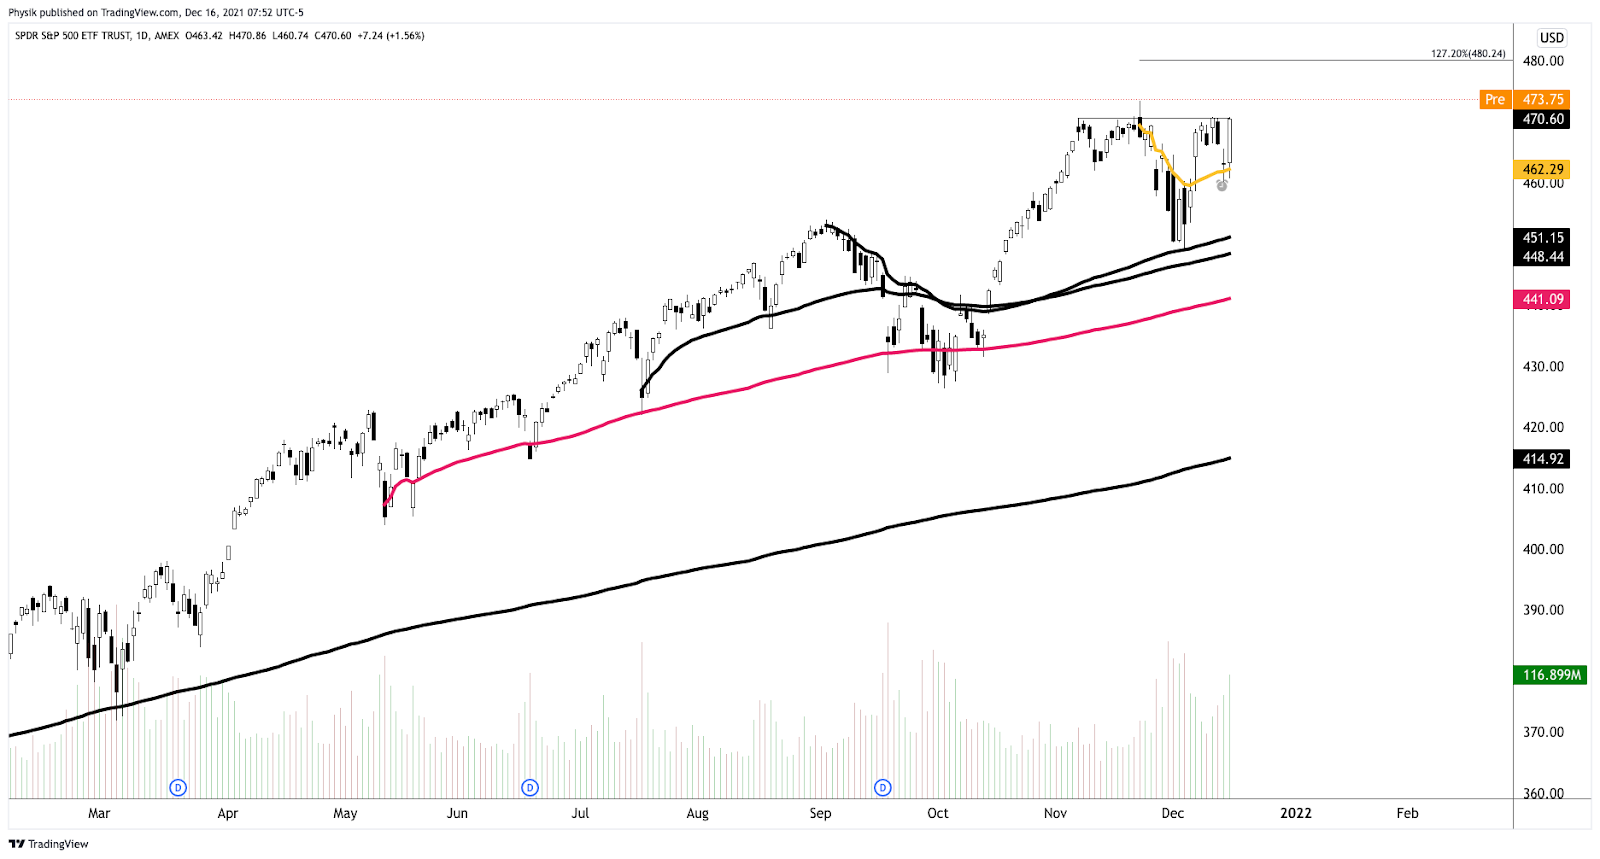
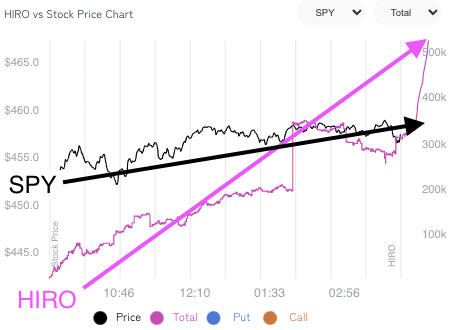
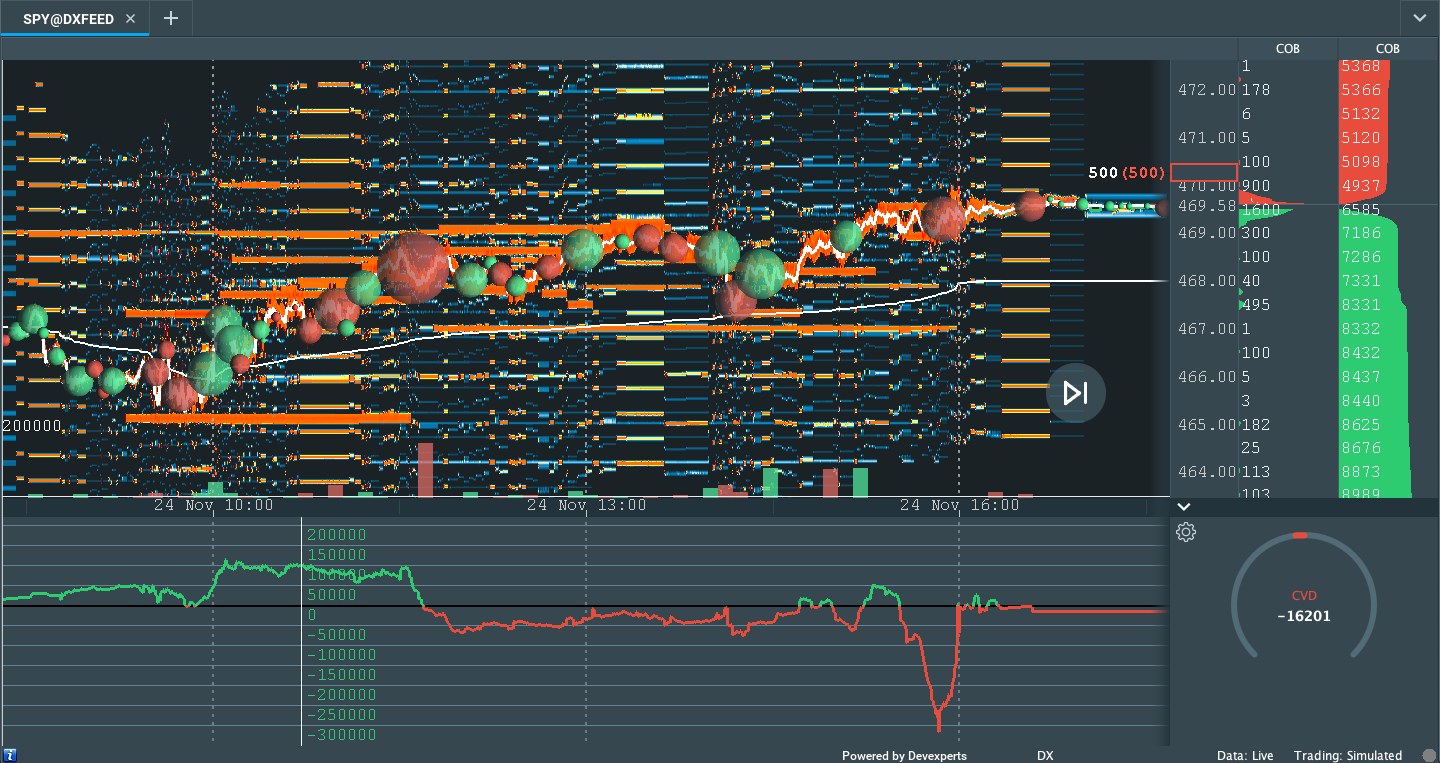
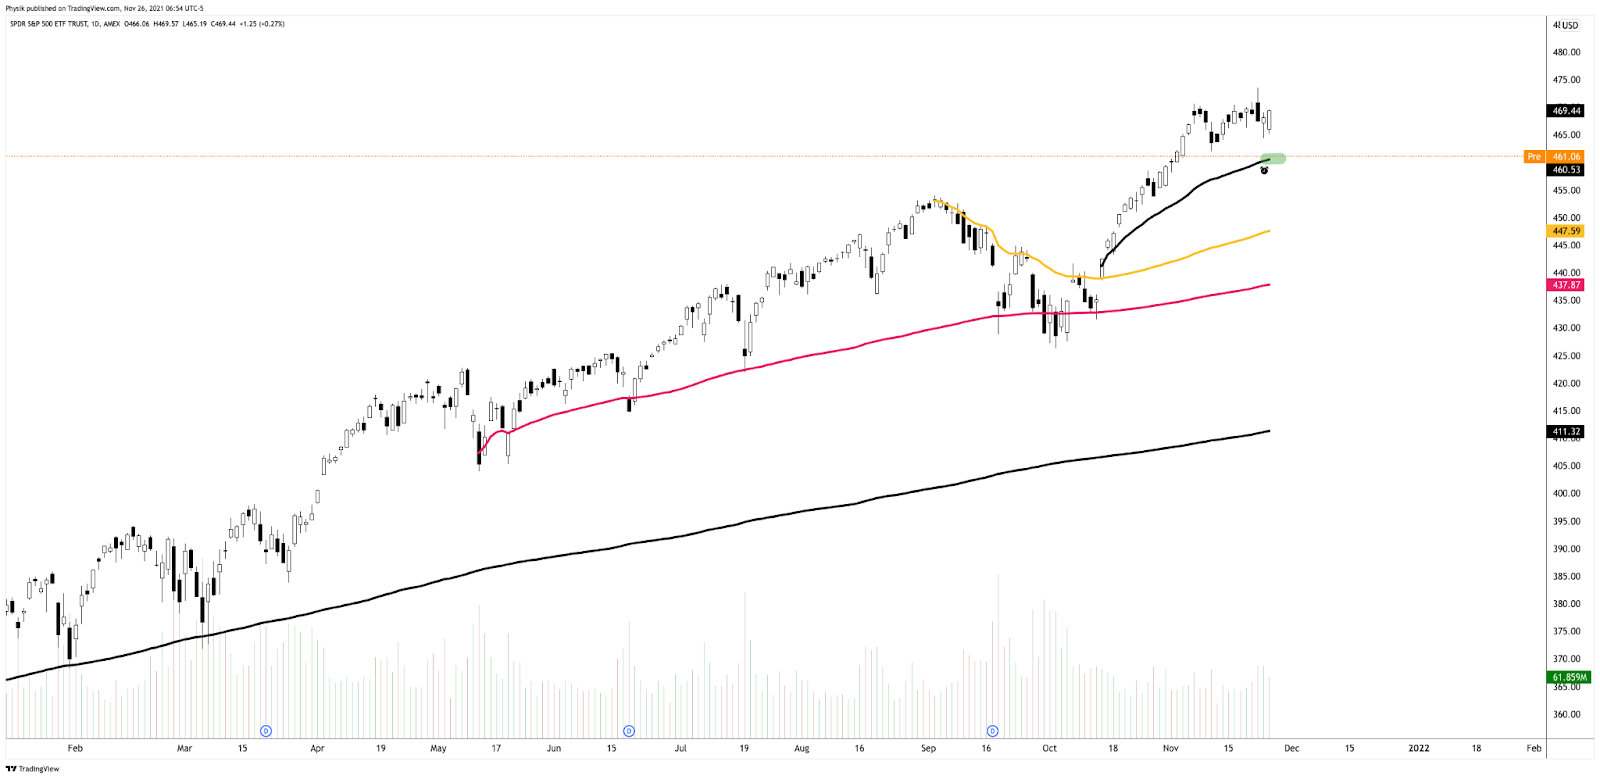
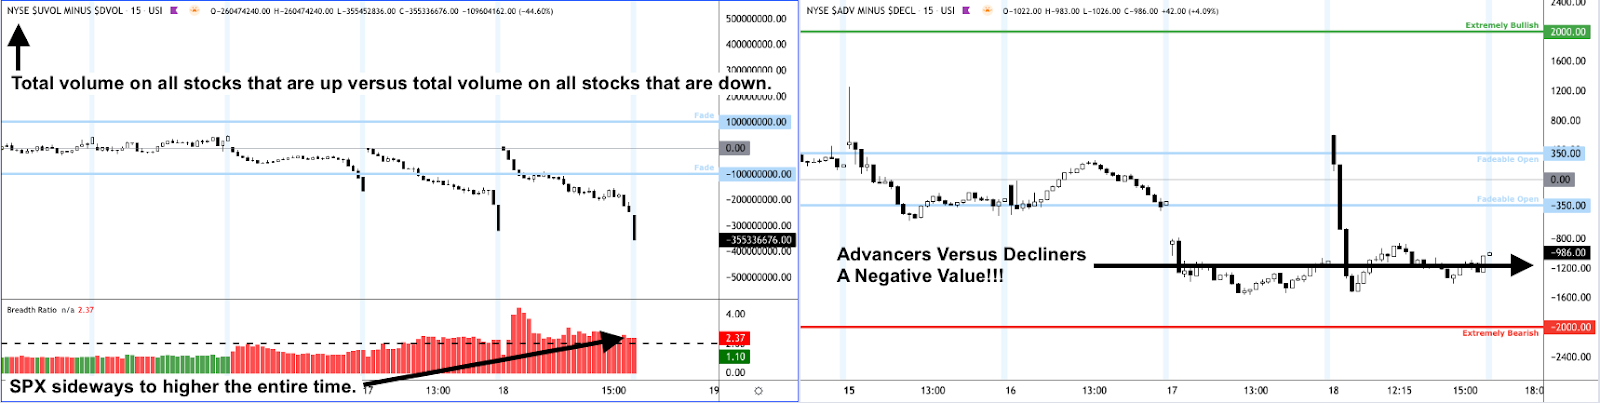
On supportive intraday breadth and divergent market liquidity metrics, the best case outcome occurred; the S&P 500 auctioned away from intraday value, the levels at which participants found it most favorable to trade at.
Given the mechanical responses to key technical levels, visually-driven, weaker-handed participants (which seldom bear the wherewithal to defend retests) are very much in control.
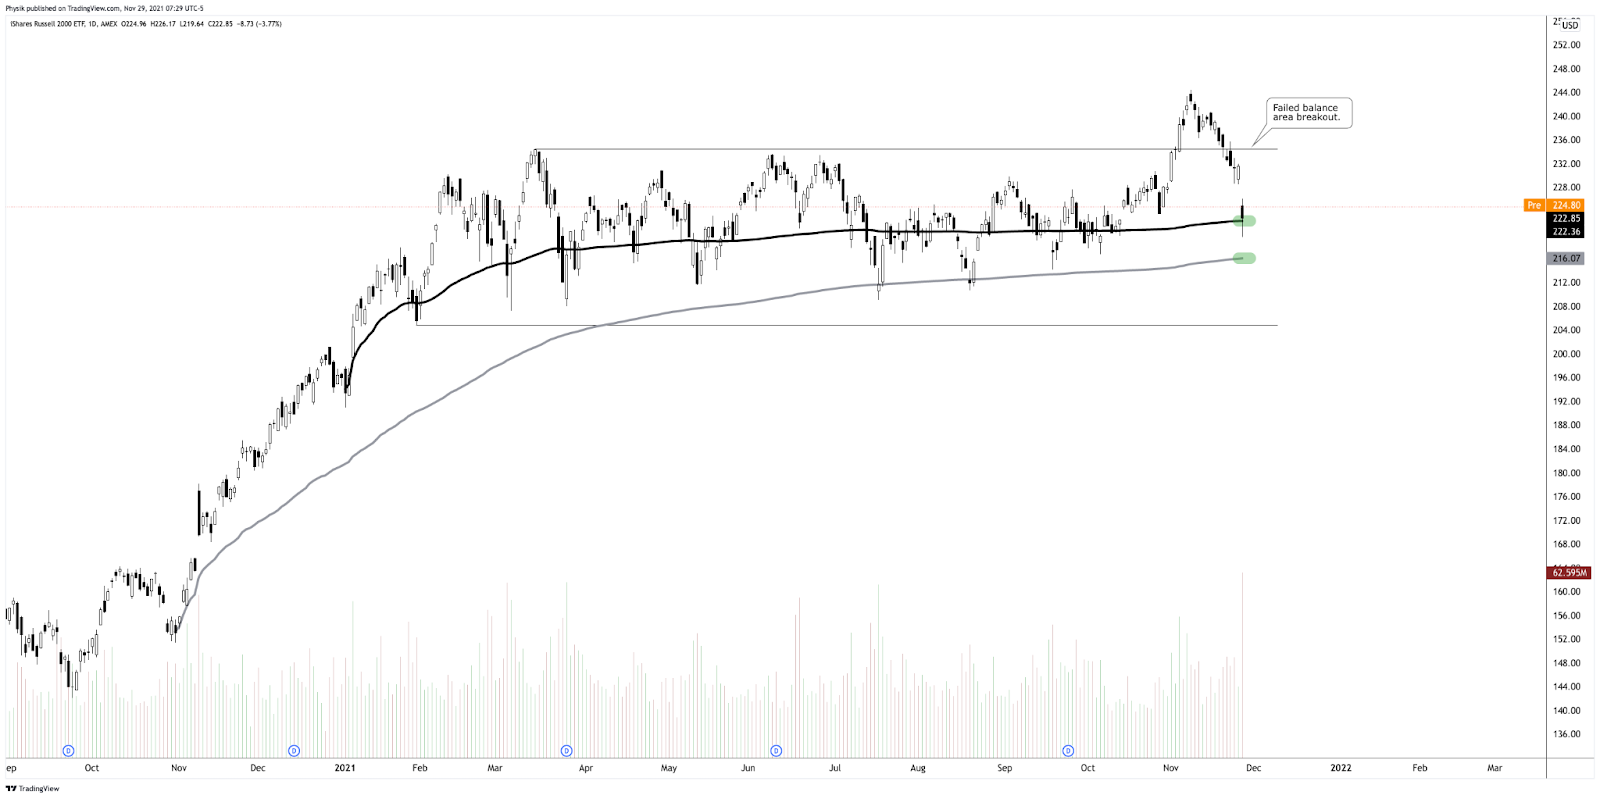
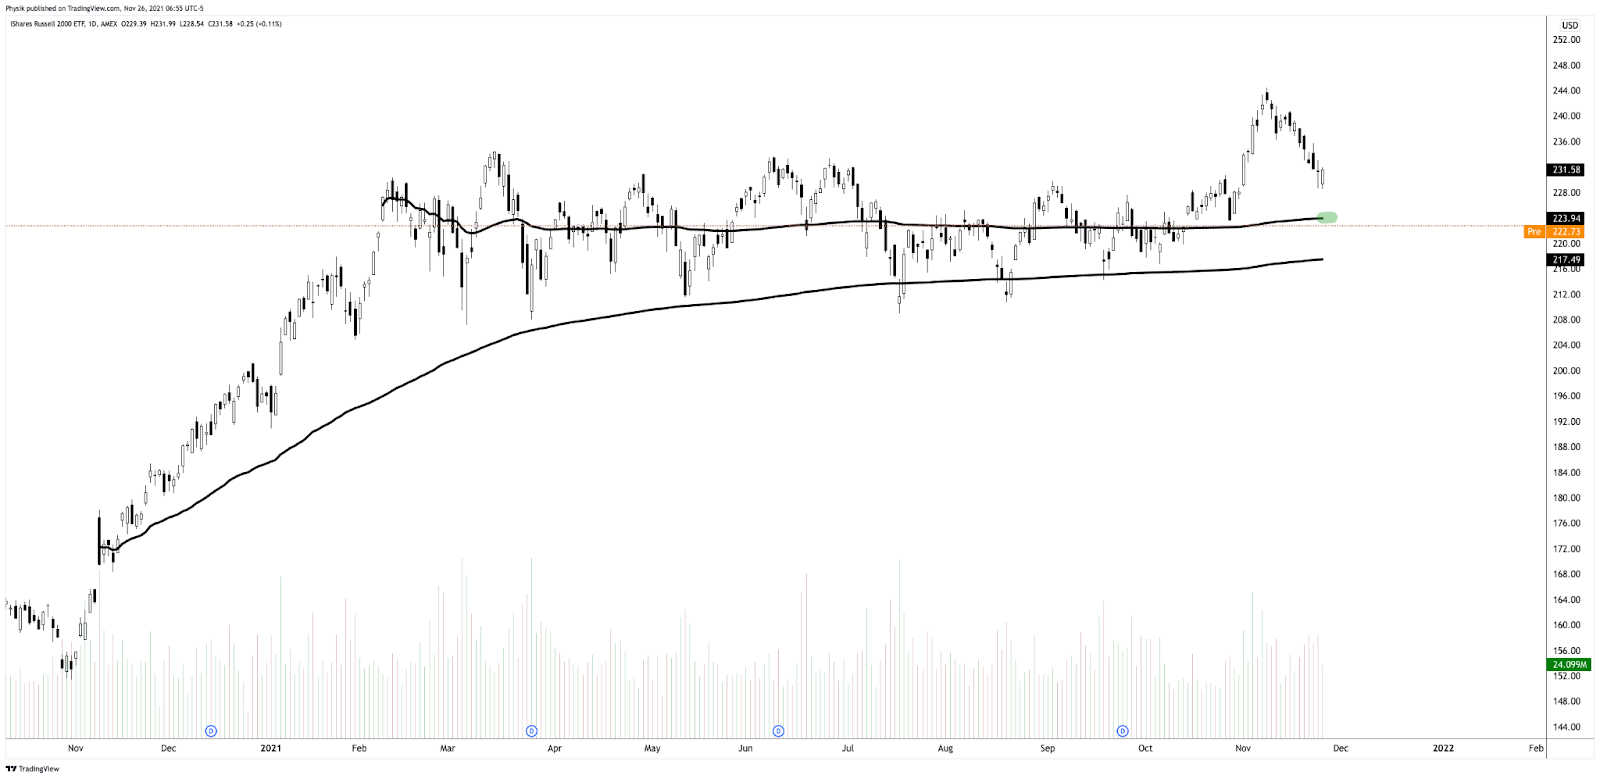
Moreover, Tuesday’s activity, which was follow-through on Monday’s responsive buying, left low-volume structures in its wake.
Virgin tests of the low-volume – a void of sorts – ought to hold. Successful penetration portends follow-through given the participants that were most active at those levels.
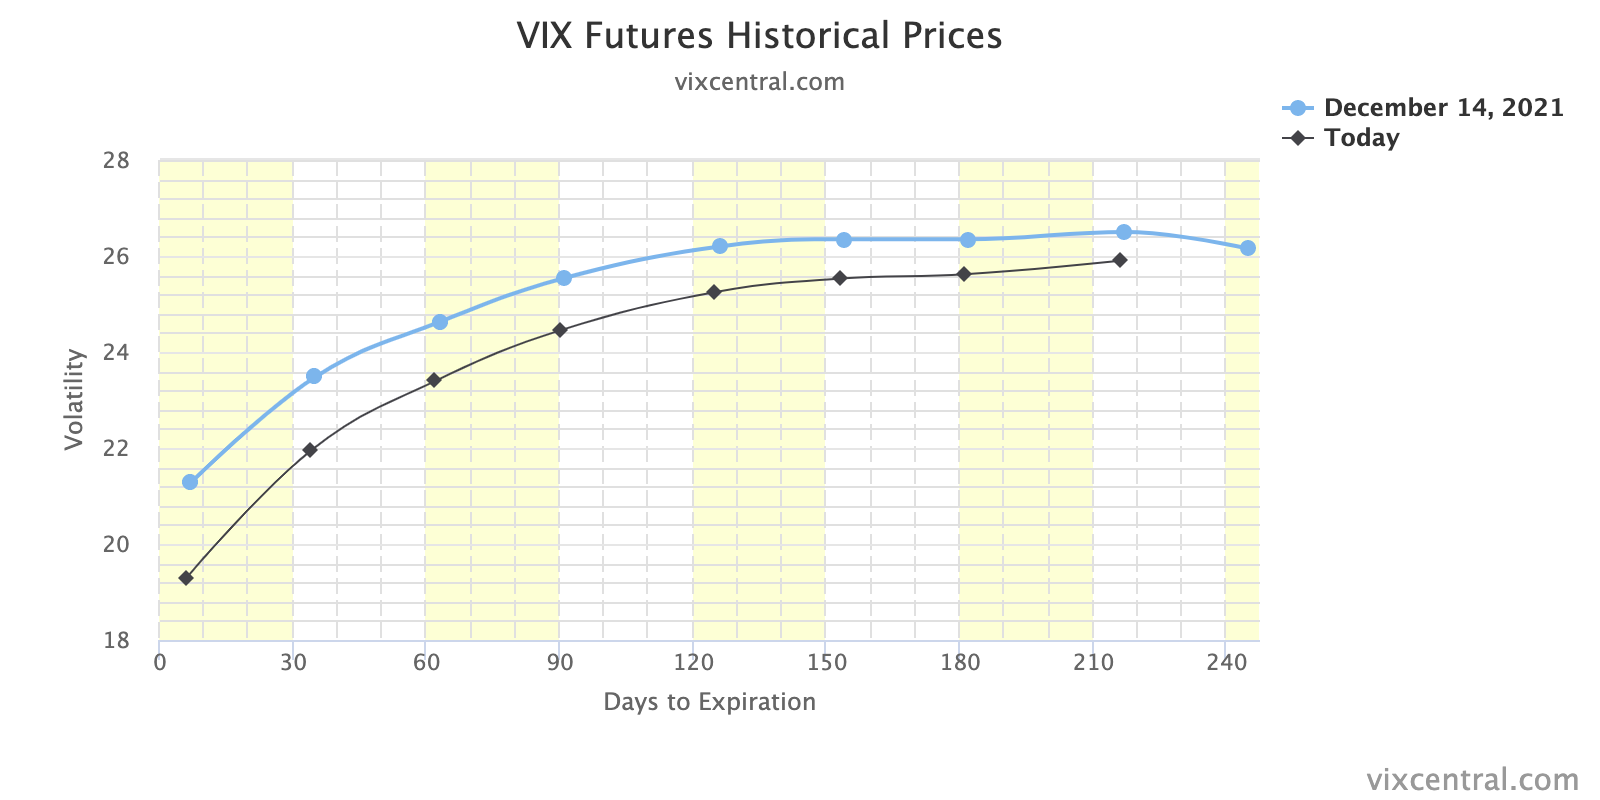
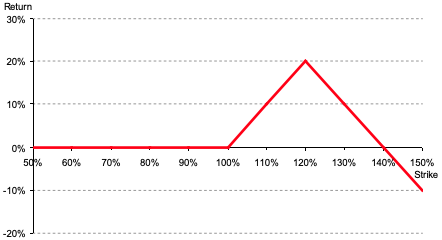
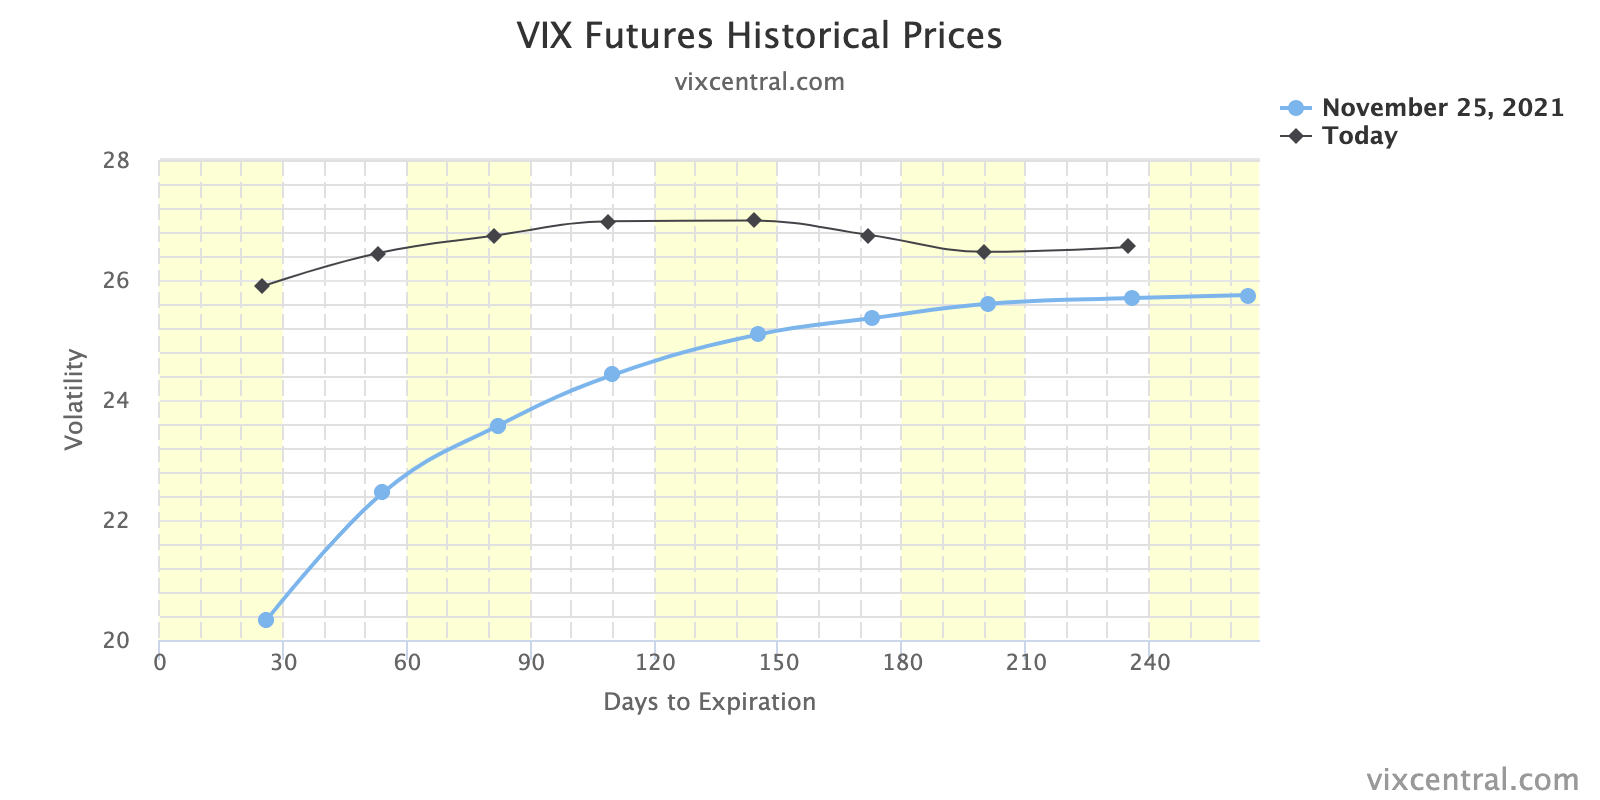
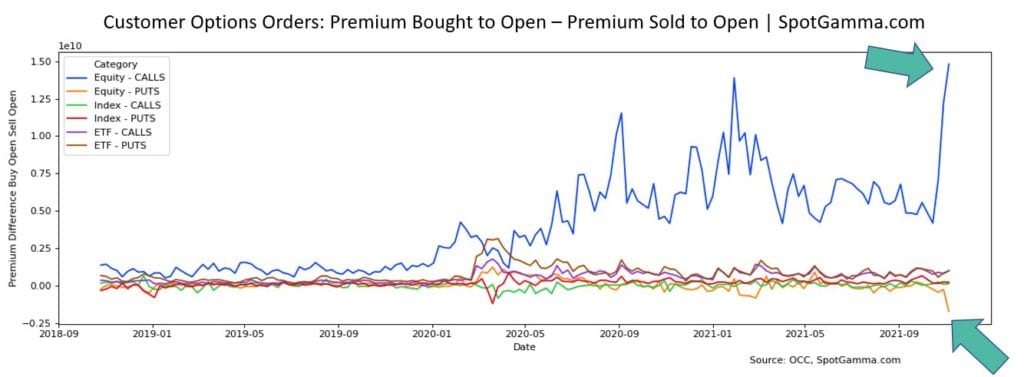
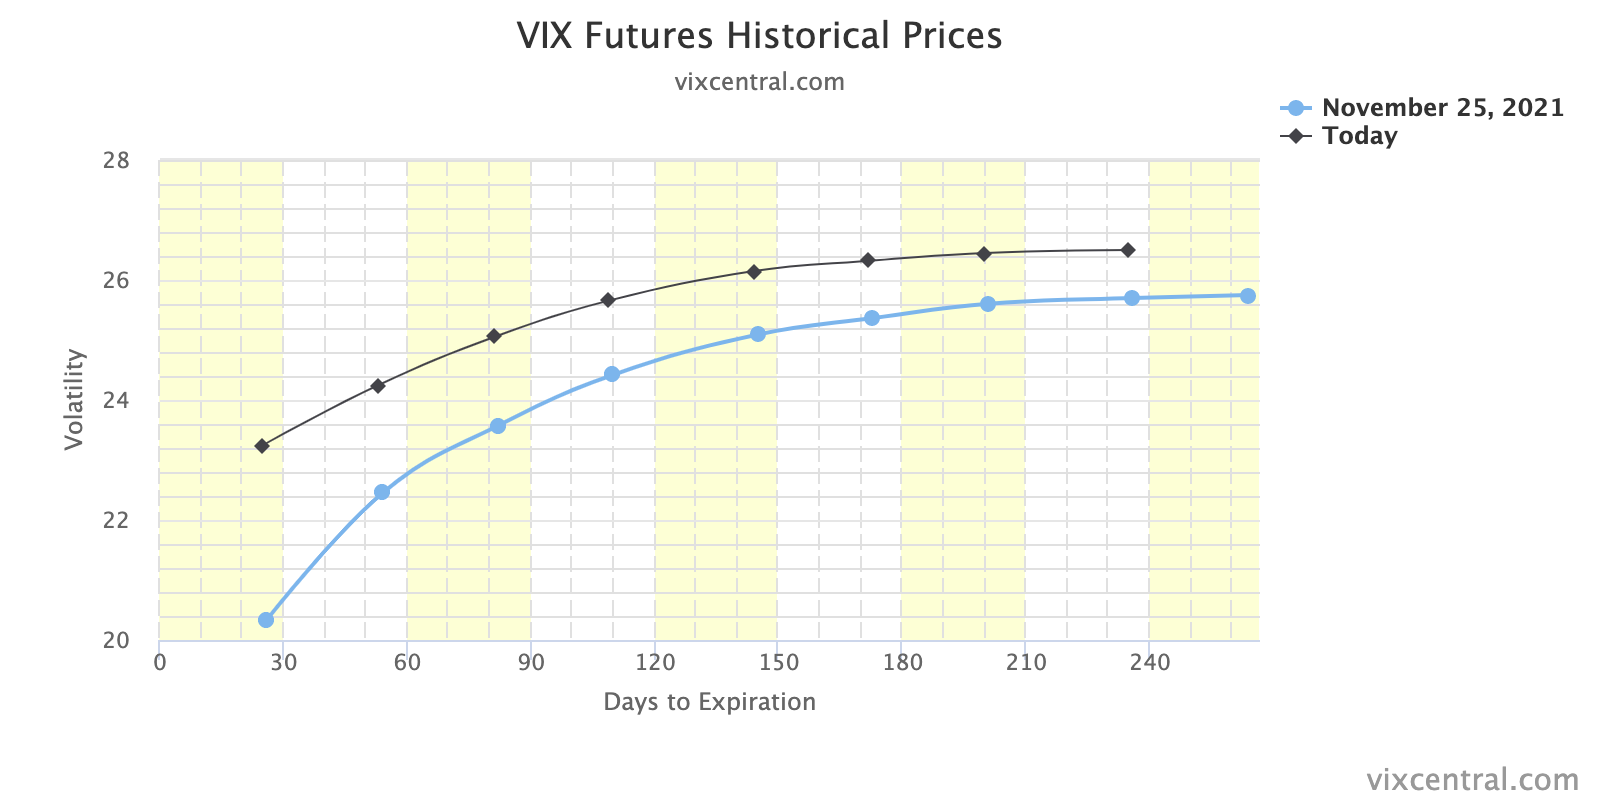
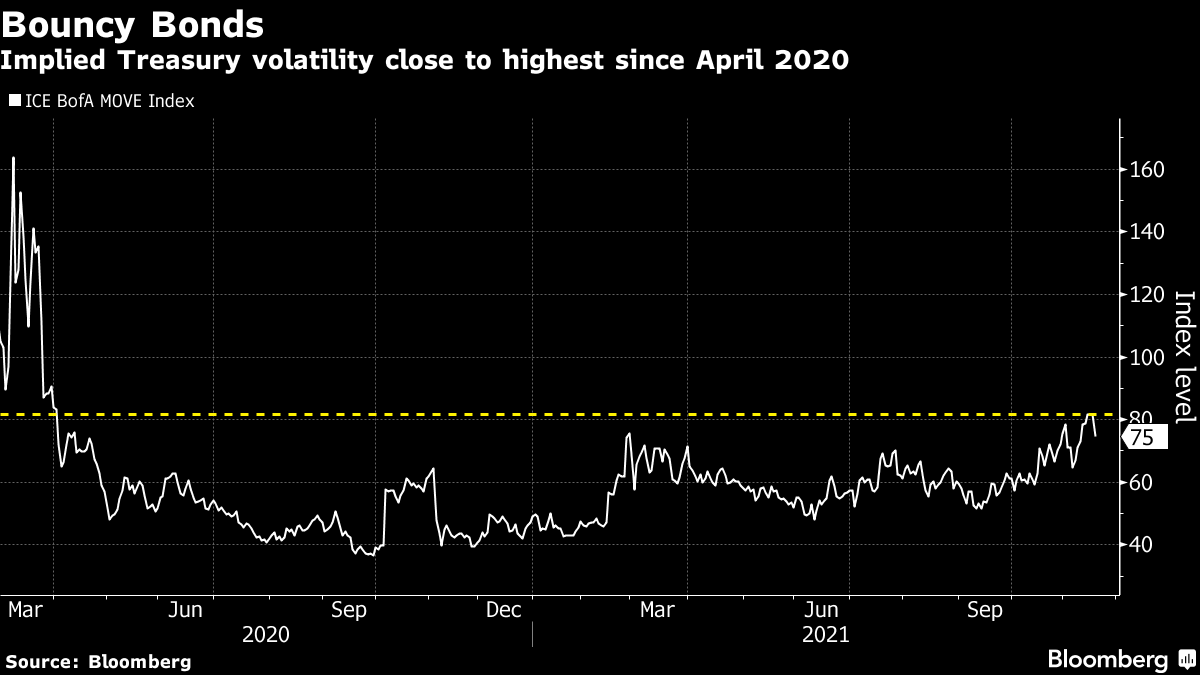
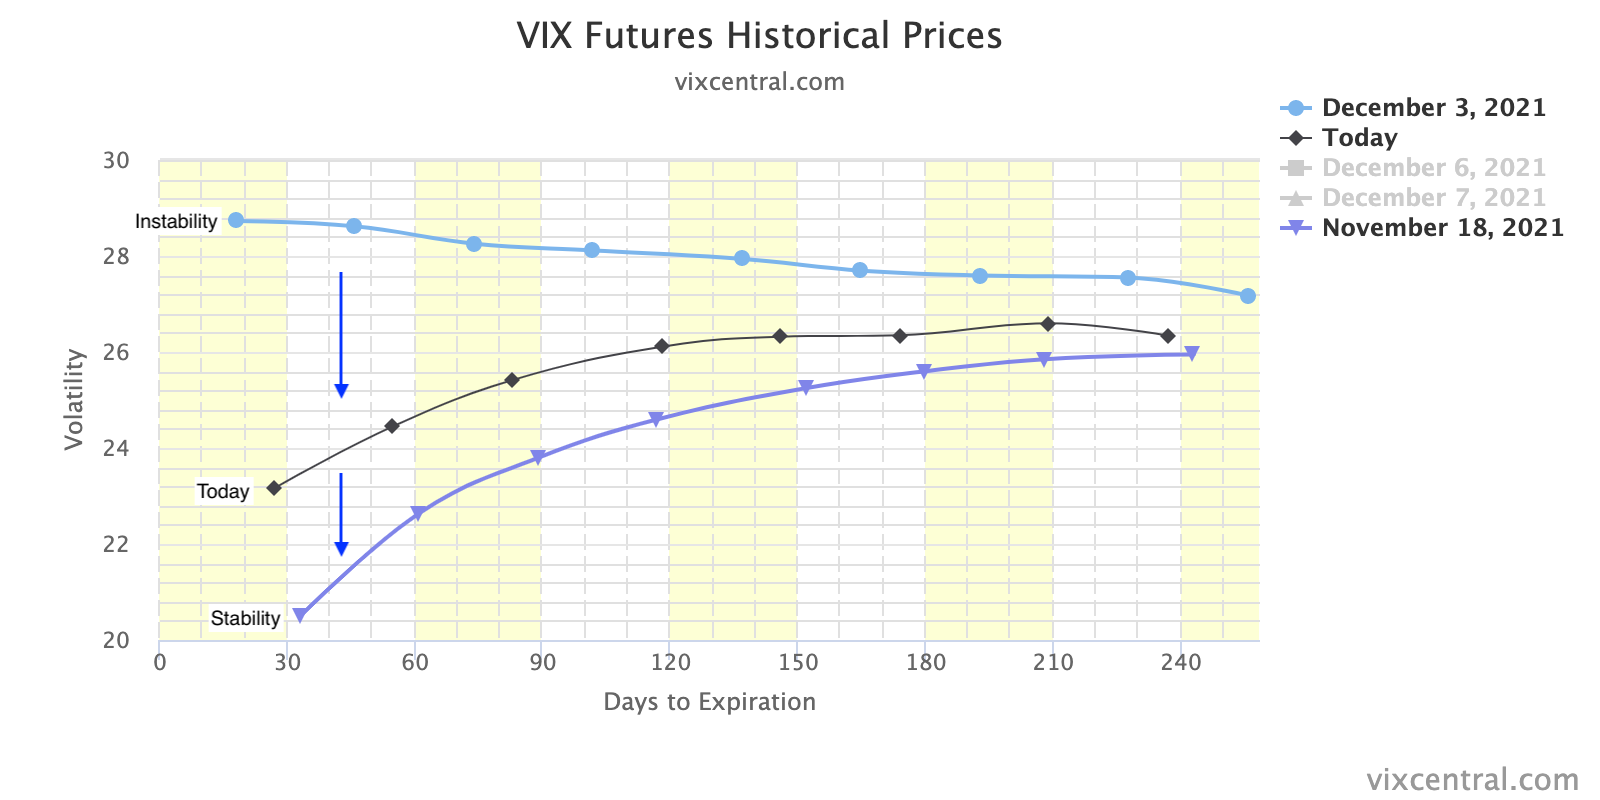
Context: In light of elevated implied volatility and limited macro, and micro catalysts, Goldman Sachs Group (NYSE: GS) sees “options selling strategies as attractive in the near term.”
“We estimate there is a 12% probability of a 1-month 5% down-move in the SPX in this economic environment based on our GS-EQMOVE model. Options are pricing a 22% probability of that size move indicating that puts are overvalued.”
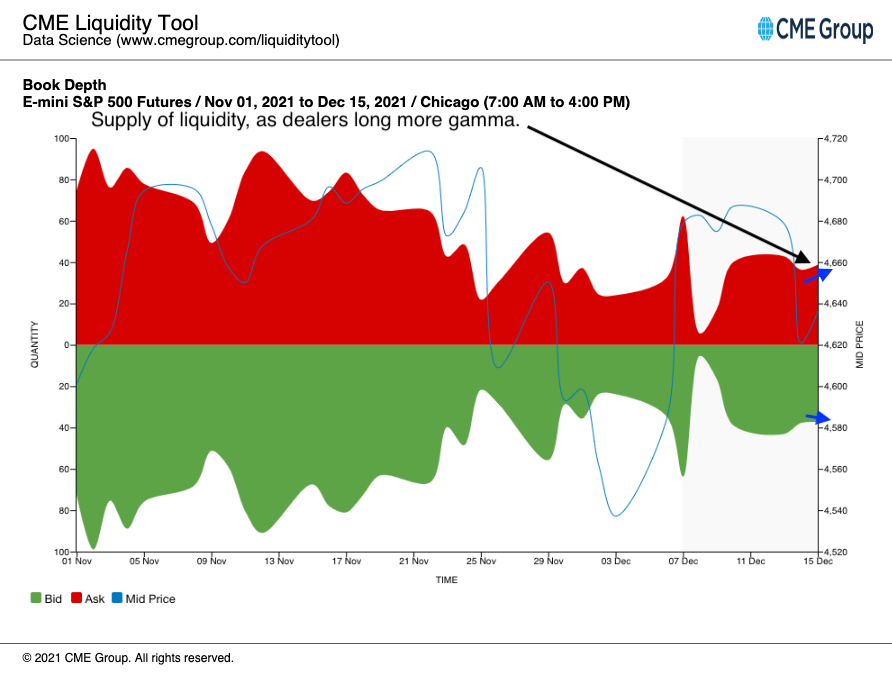
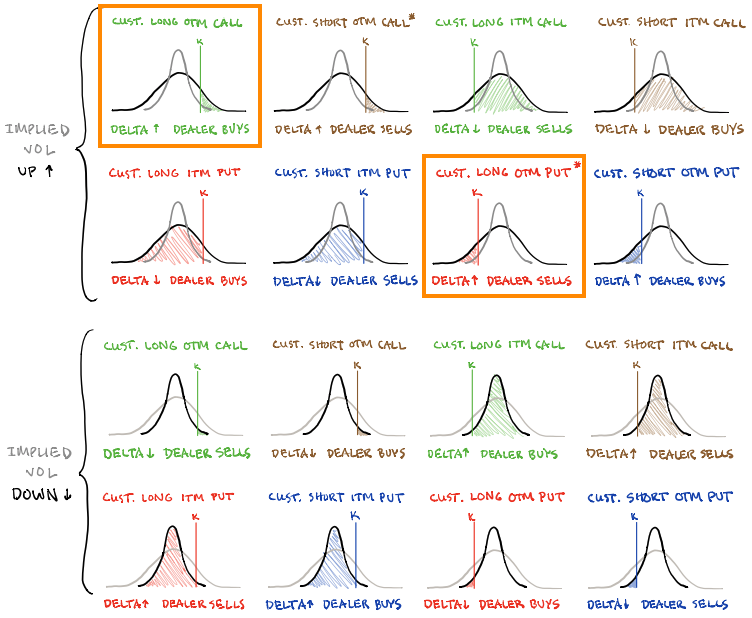
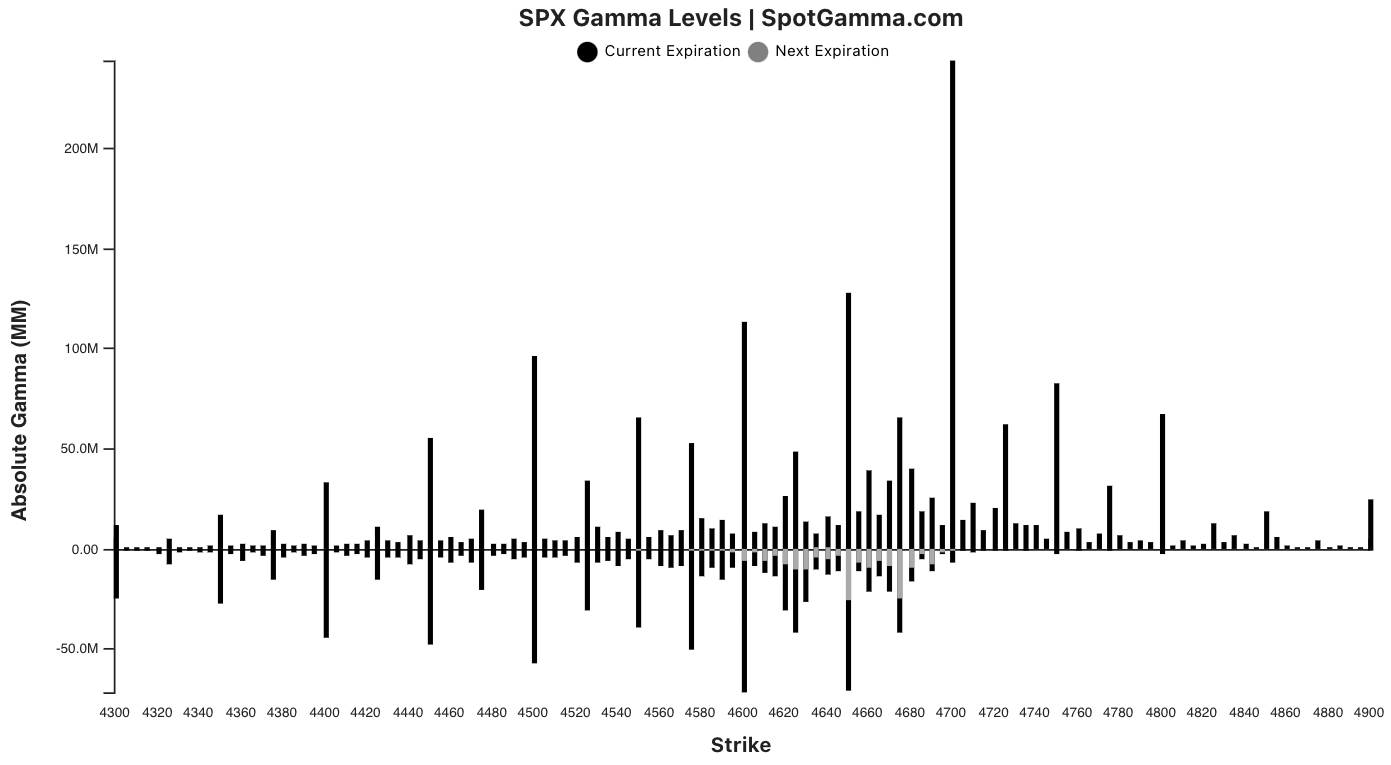
The commitment of capital on lower directional volatility results in counterparties taking on more exposure to positive gamma which they will offset by supplying the market with liquidity, thereby pressuring the price discovery process.
Note: As a position’s delta rises with stock or index price rises, gamma (or how an option’s delta is expected to change given a change in the underlying) is added to the delta.
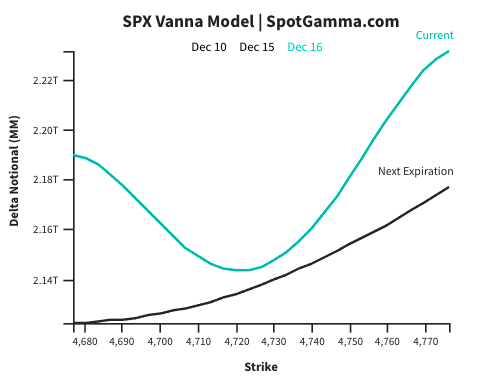
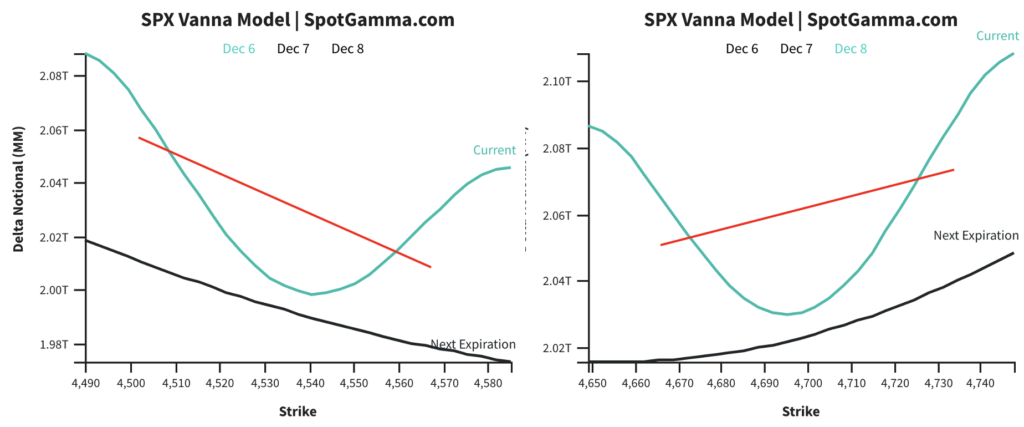
“I use this analogy of a jet,” Kai Volatility’s Cem Karsan once explained to me, referencing the three factors – the change in the underlying price (gamma), implied volatility (vanna), and time (charm) – that are well known to impact an options exposure to directional risk or delta.
“As volatility is compressed, those jets will keep firing because … the hedging vanna and charm flows, and whatnot will push the markets higher.”
Still, many products are in lower liquidity and short-gamma (wherein an options delta decreases with stock prices rises and increases when stock prices drop) in which moves are more erratic.
If the S&P were to further trend sideways, as a result of the aforementioned hedging pressures, a decline in correlation – among volatile constituents – would be the only reconciliation.
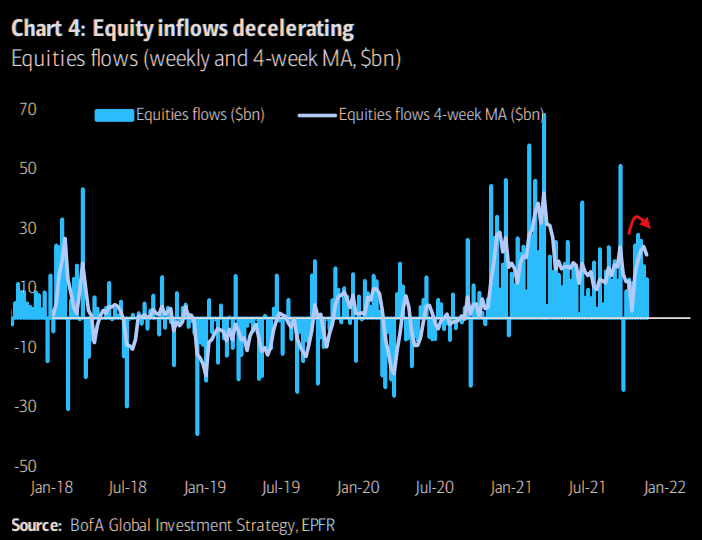
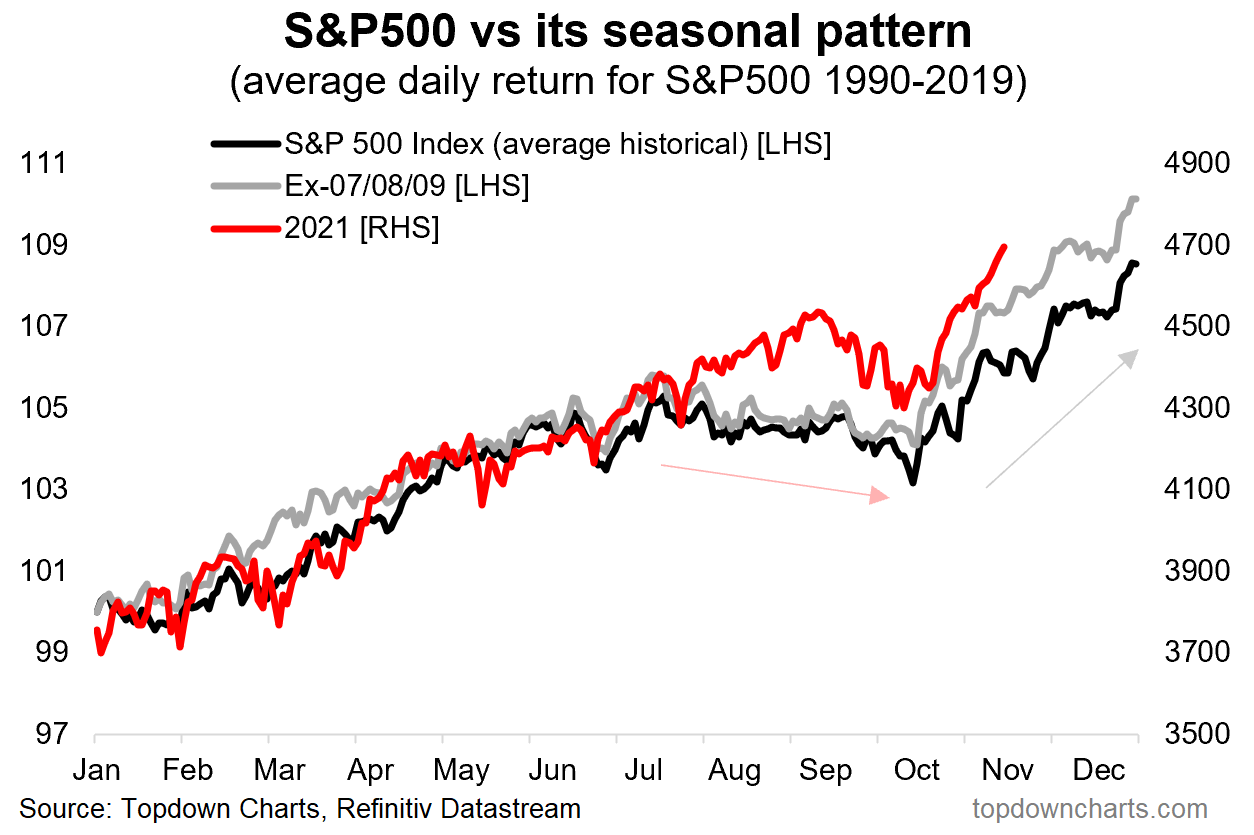
A post-holiday collapse in implied volatility, coupled with the management of massive S&P positions, and relentless, seasonally-aligned “passive buying support,” may bring in positive flows that would bolster any attempt higher.
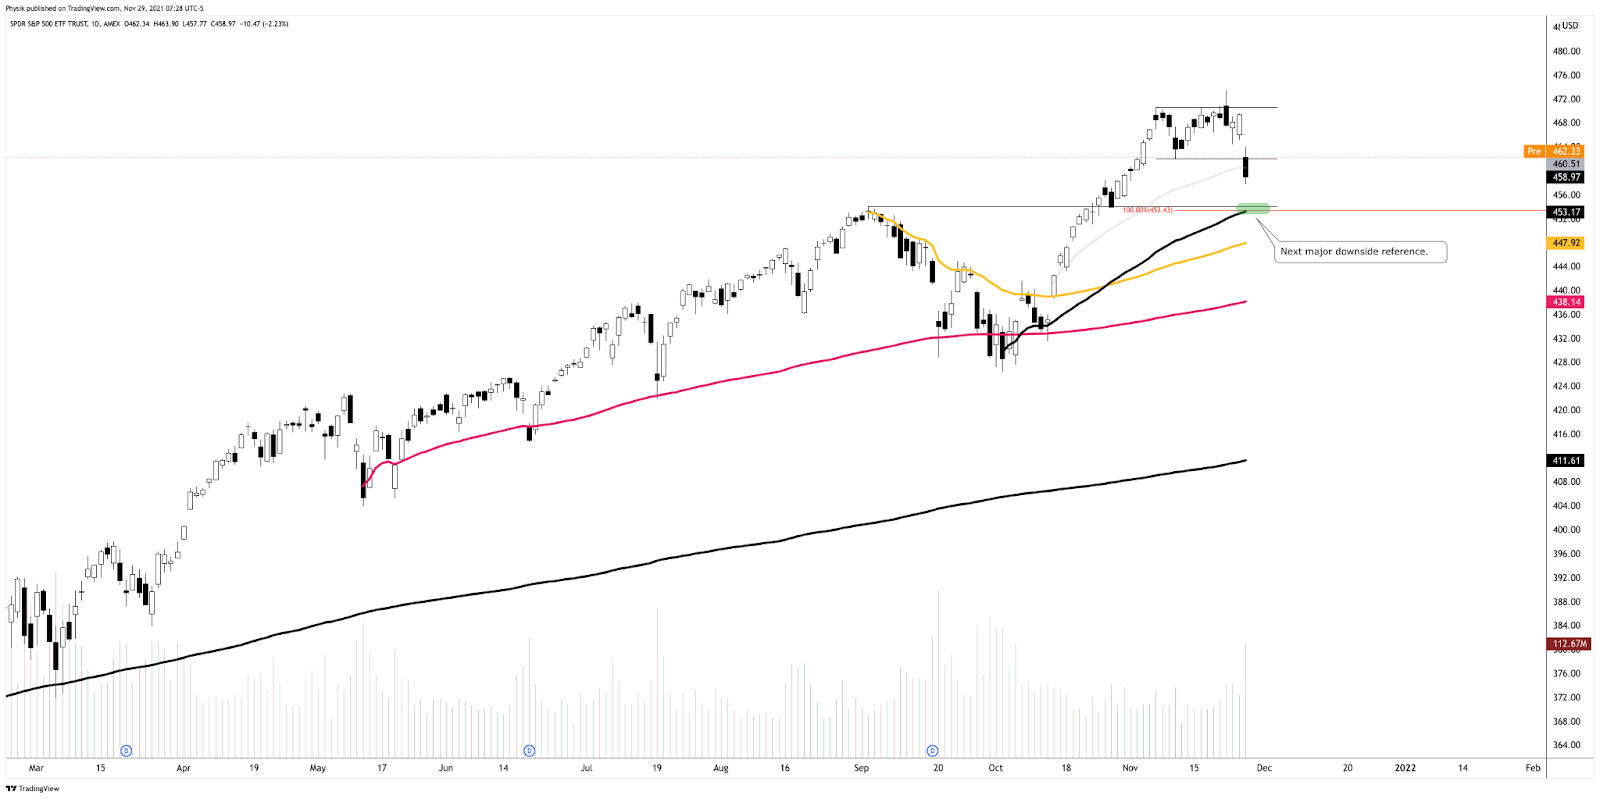
Expectations: As of 6:30 AM ET, Wednesday’s regular session (9:30 AM – 4:00 PM ET), in the S&P 500, will likely open in the upper part of a balanced overnight inventory, just outside of prior-range and -value, suggesting a potential for immediate directional opportunity.
Gap Scenarios In Play: Gaps ought to fill quickly. Should they not, that’s a signal of strength; do not fade. Leaving value behind on a gap-fill or failing to fill a gap (i.e., remaining outside of the prior session’s range) is a go-with indicator.

Auctioning and spending at least 1-hour of trade back in the prior range suggests a lack of conviction; in such a case, do not follow the direction of the most recent initiative activity.
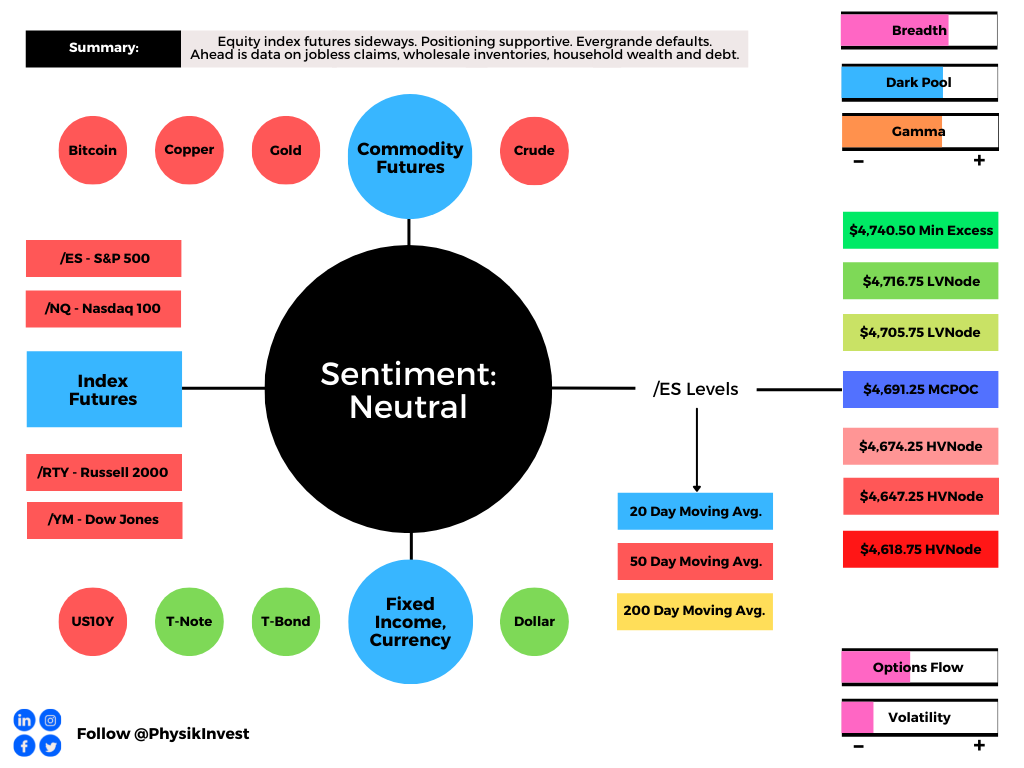
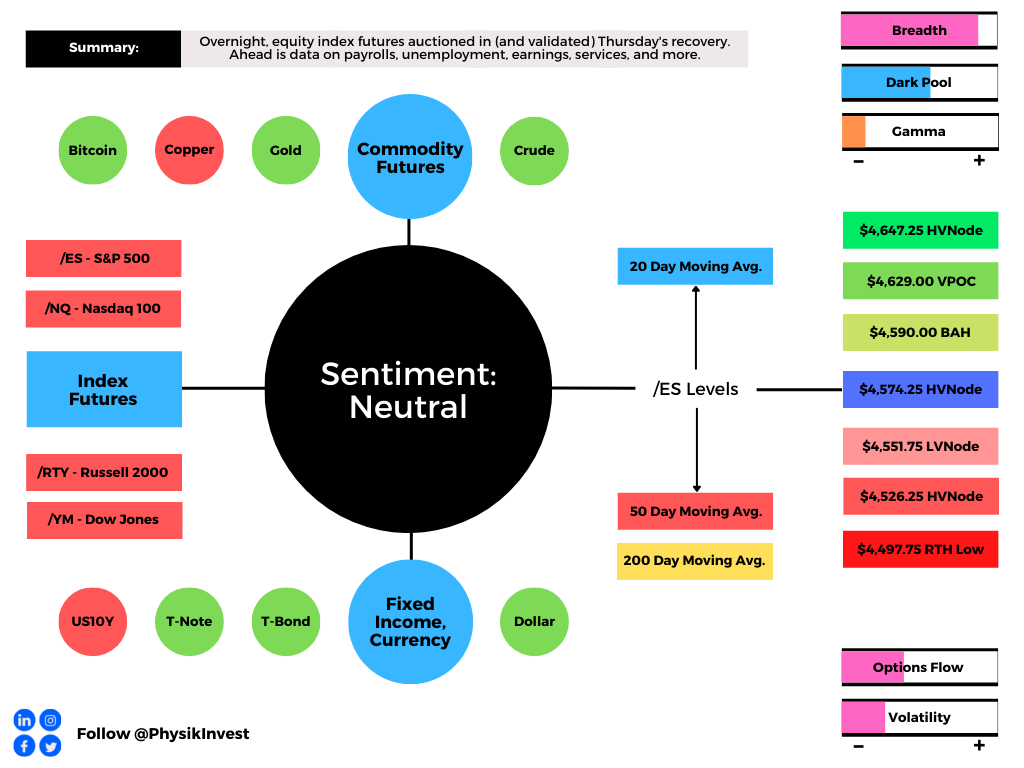
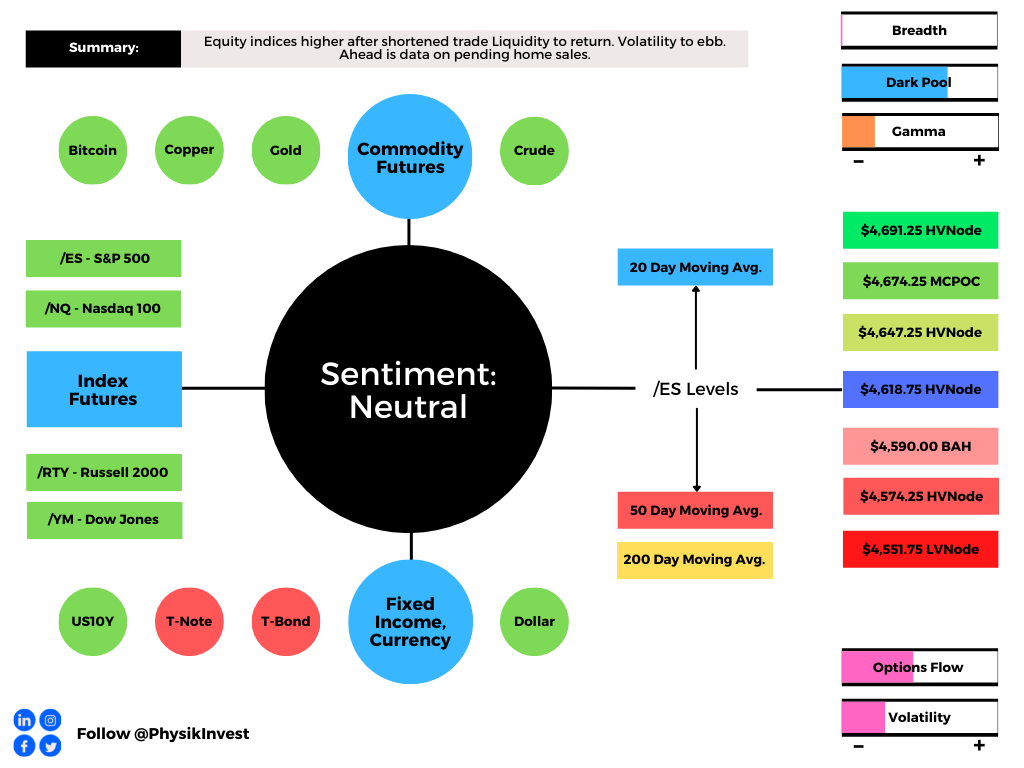
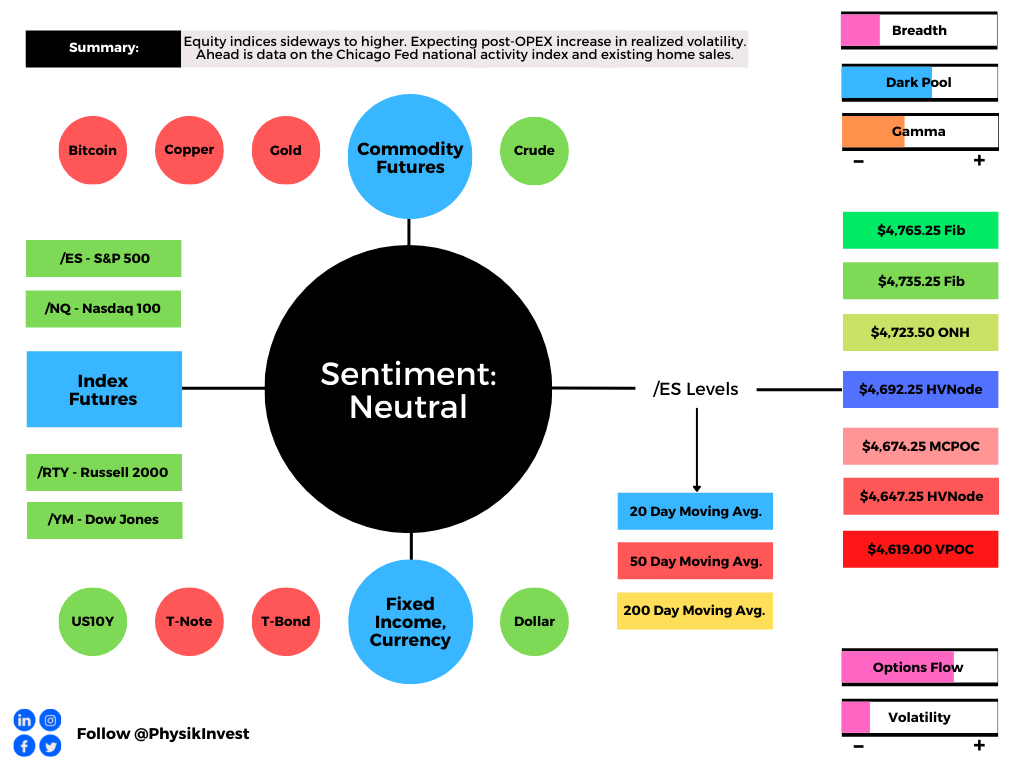
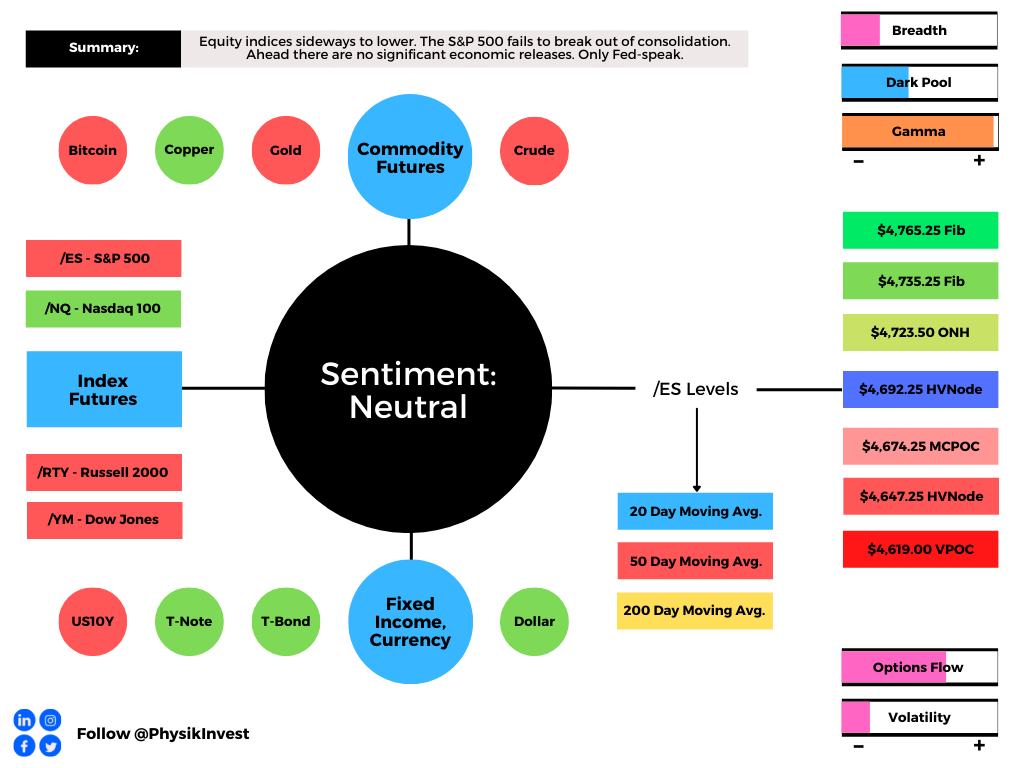
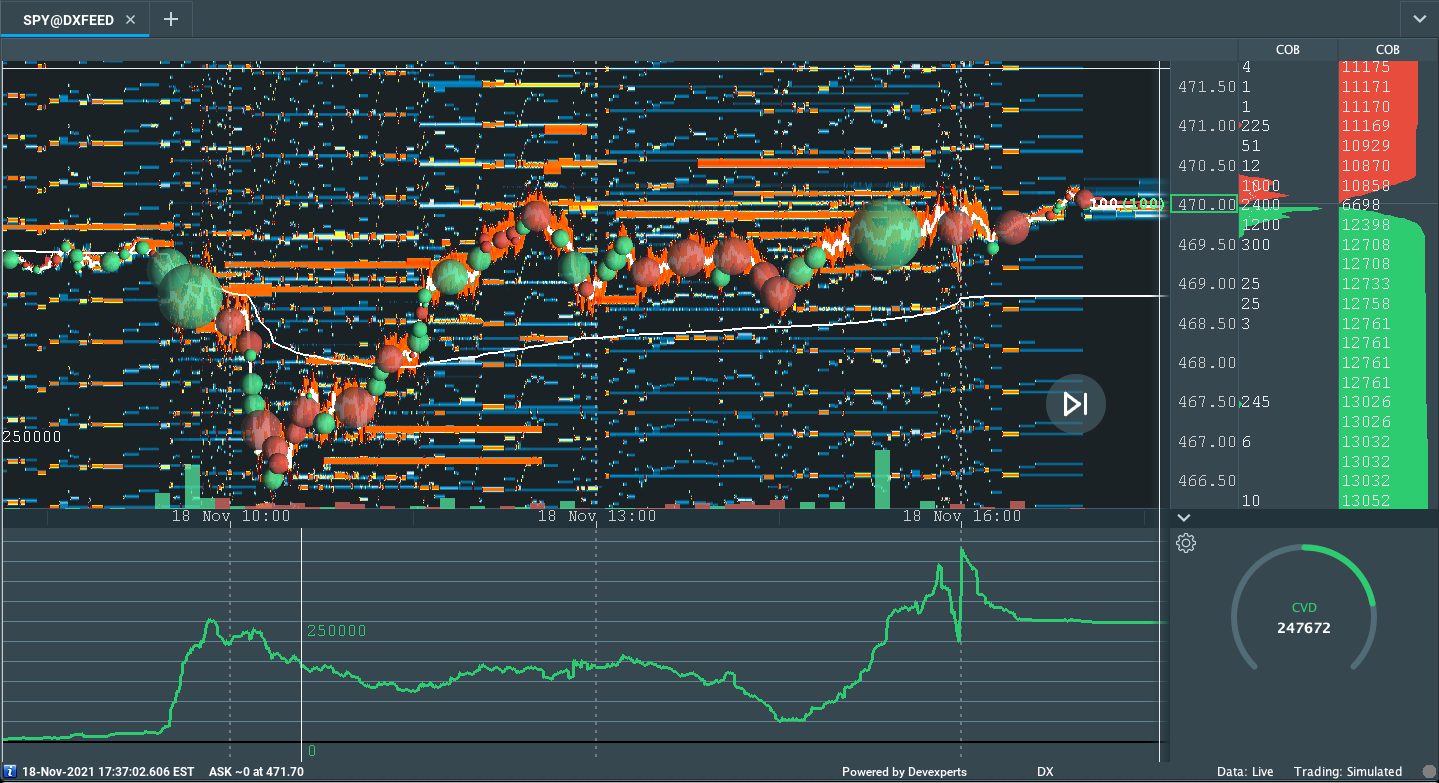
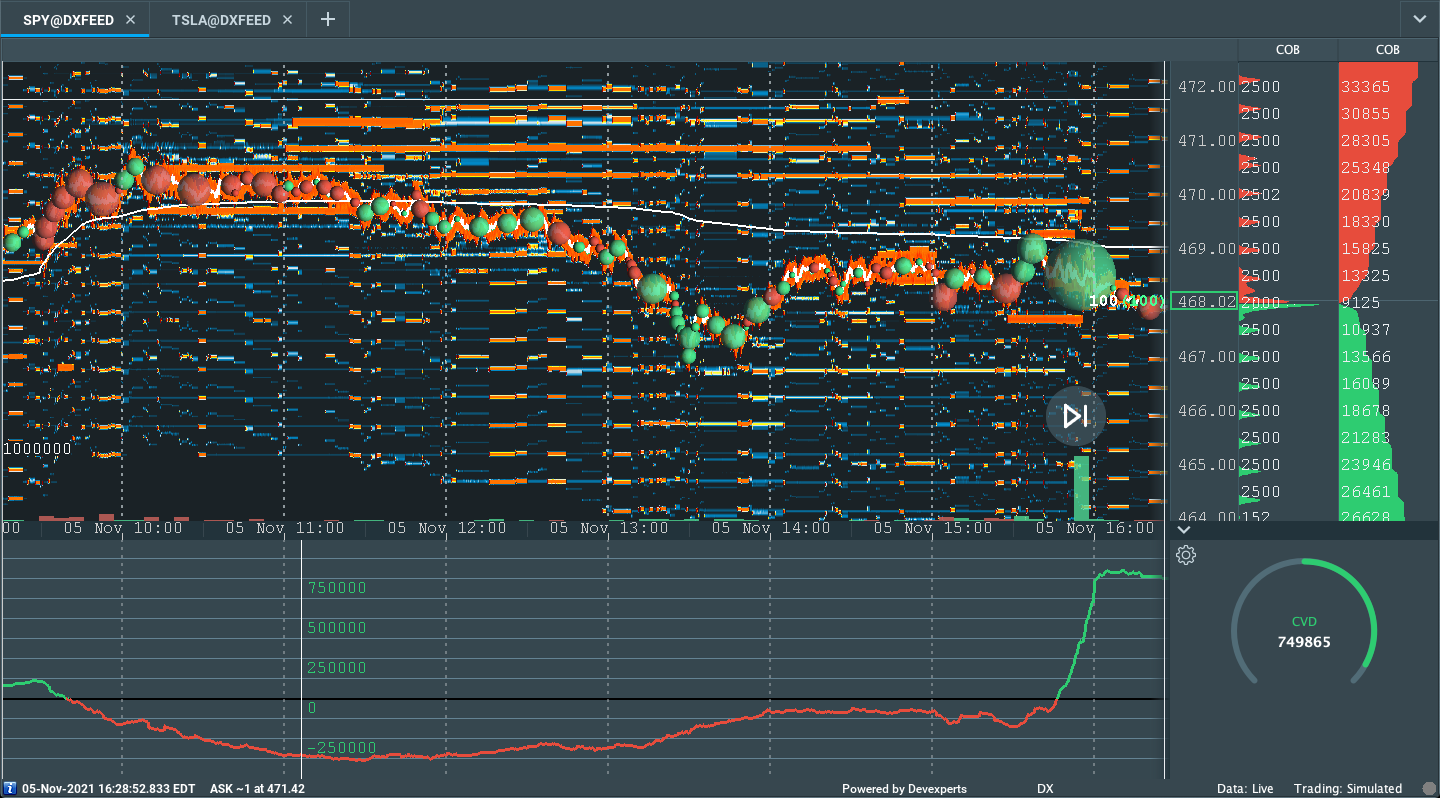
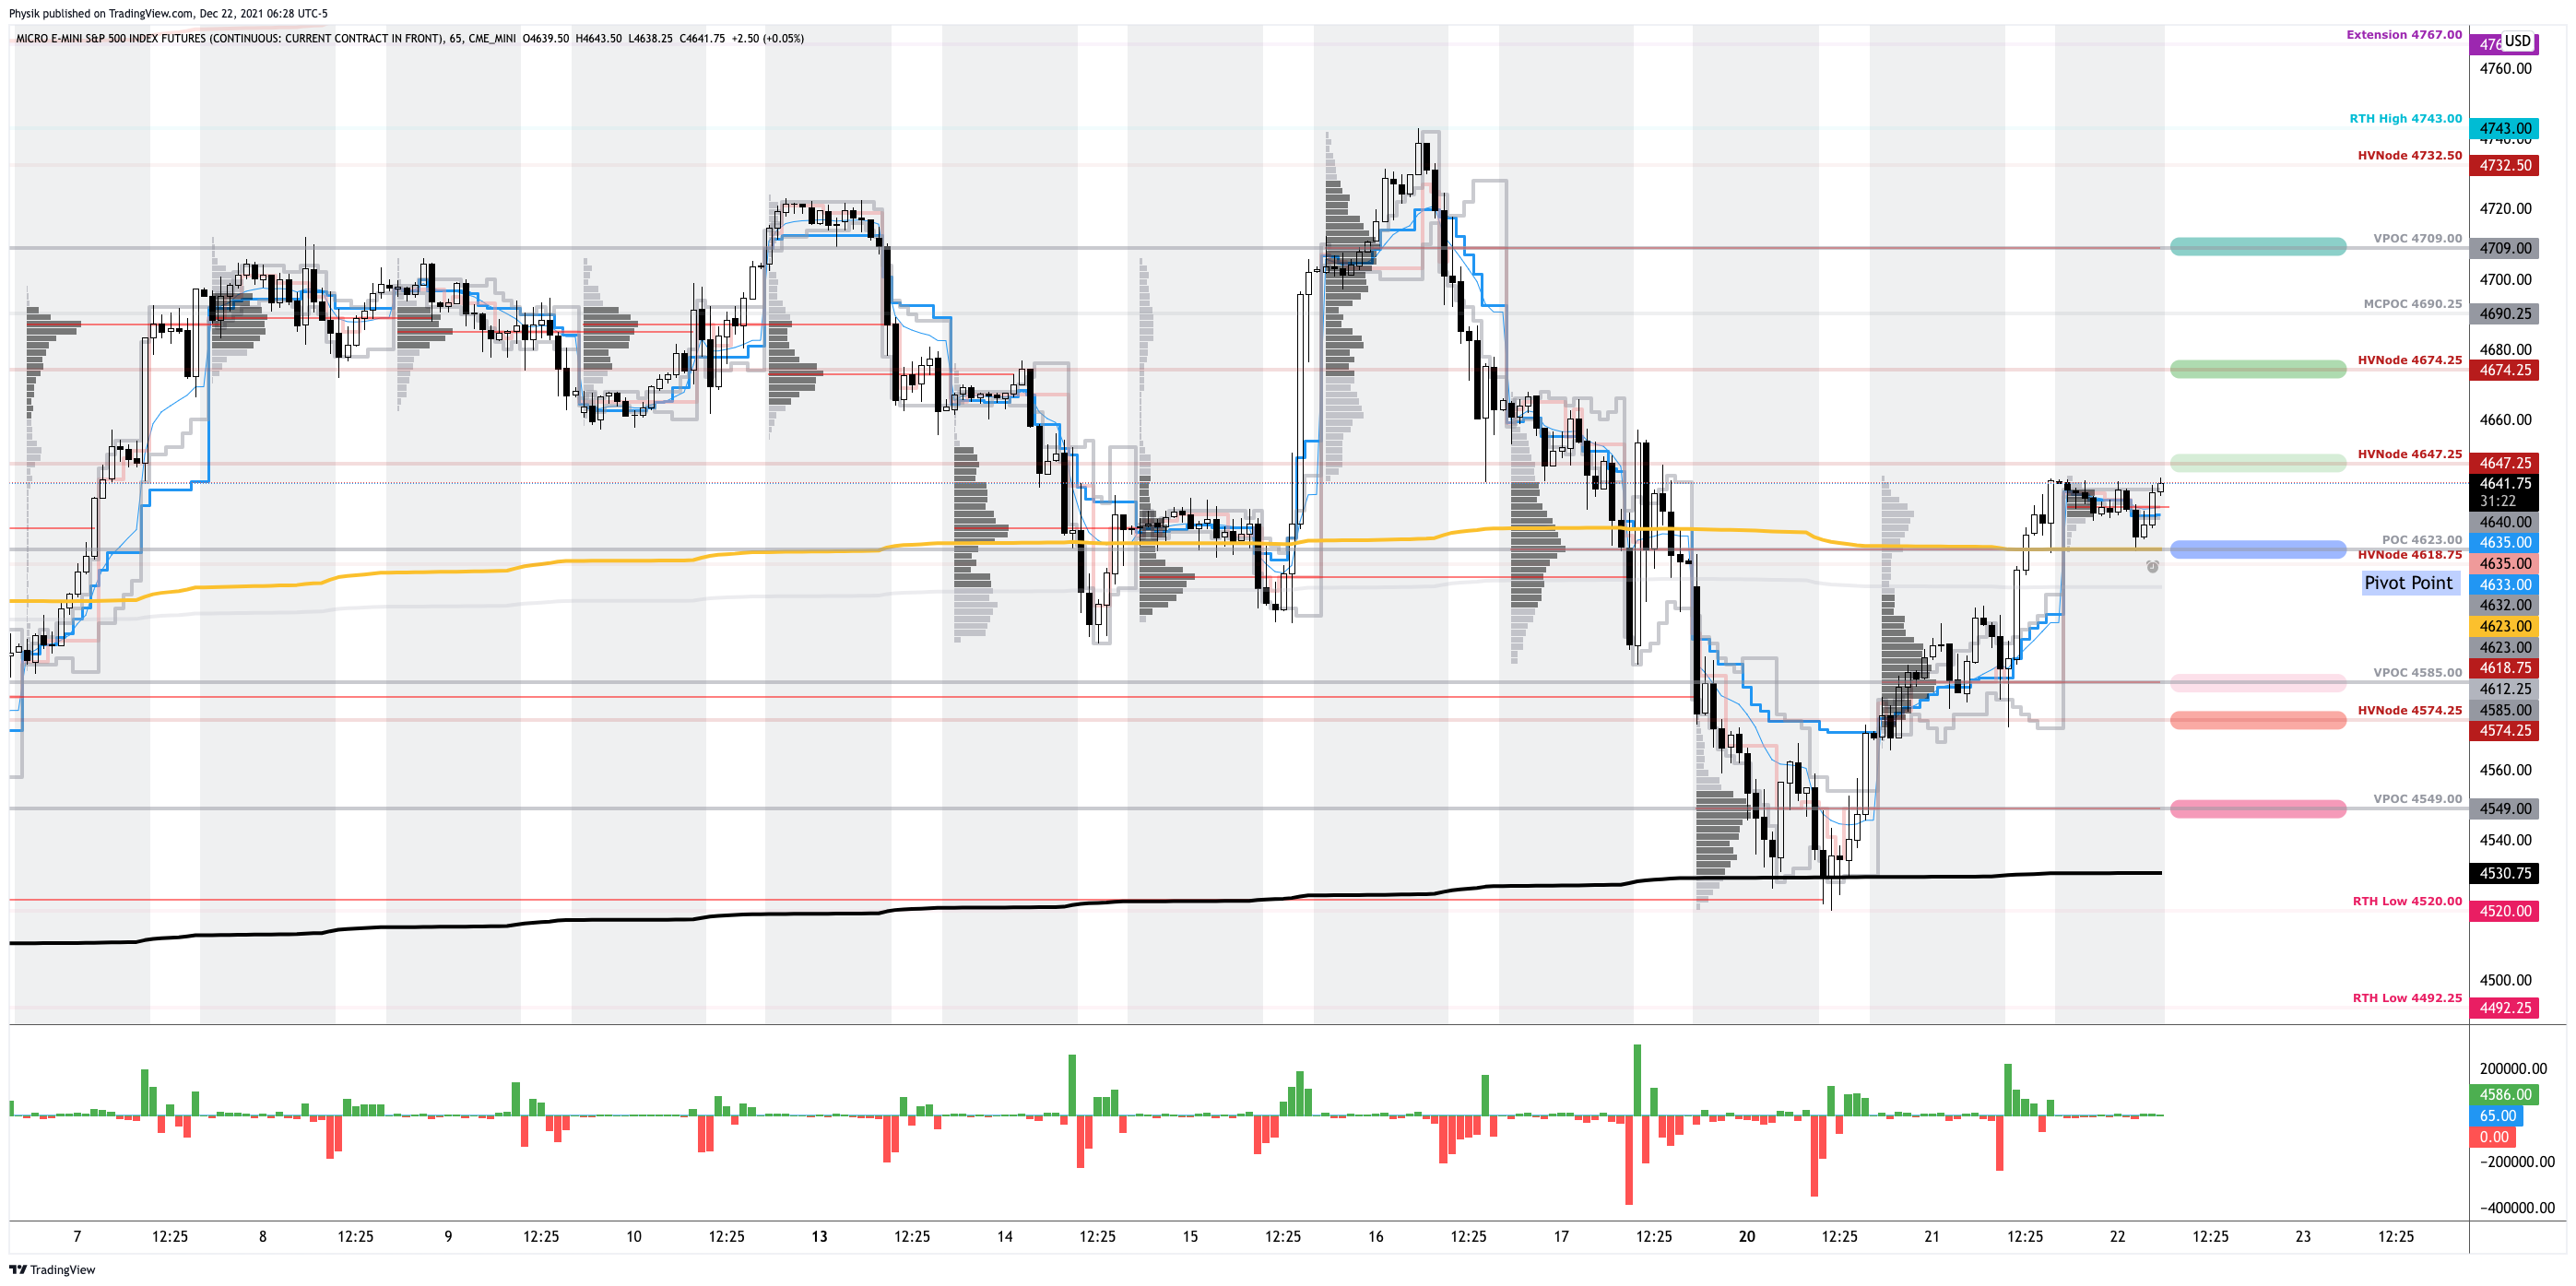
In the best case, the S&P 500 trades sideways or higher; activity above the $4,623.00 point of control (POC) puts in play the $4,647.25 high volume area (HVNode). Initiative trade beyond the HVNode could reach as high as the $4,674.25 HVNode and $4,709.00 VPOC, or higher.
In the worst case, the S&P 500 trades lower; activity below the $4,623.00 POC puts in play the $4,585.00 VPOC. Initiative trade beyond the VPOC could reach as low as the $4,574.25 HVNode and $4,549.00 VPOC, or lower.
Click here to load today’s key levels into the web-based TradingView charting platform. Note that all levels are derived using the 65-minute timeframe. New links are produced, daily.
What People Are Saying
Definitions
Volume Areas: A structurally sound market will build on areas of high volume (HVNodes). Should the market trend for long periods of time, it will lack sound structure, identified as low volume areas (LVNodes). LVNodes denote directional conviction and ought to offer support on any test.
If participants were to auction and find acceptance into areas of prior low volume (LVNodes), then future discovery ought to be volatile and quick as participants look to HVNodes for favorable entry or exit.
POCs: POCs are valuable as they denote areas where two-sided trade was most prevalent in a prior day session. Participants will respond to future tests of value as they offer favorable entry and exit.
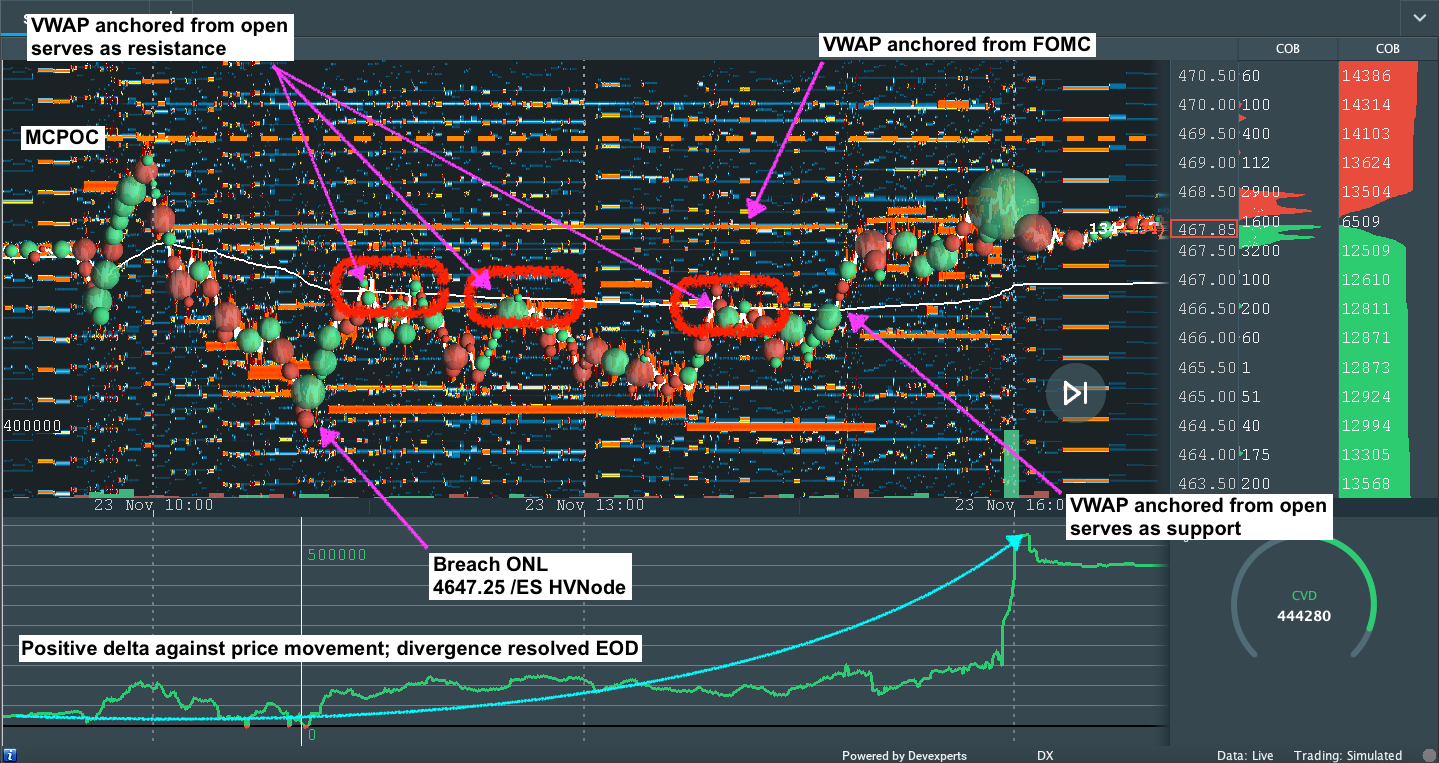
MCPOCs: POCs are valuable as they denote areas where two-sided trade was most prevalent over numerous day sessions. Participants will respond to future tests of value as they offer favorable entry and exit.
Volume-Weighted Average Prices (VWAPs): A metric highly regarded by chief investment officers, among other participants, for quality of trade. Additionally, liquidity algorithms are benchmarked and programmed to buy and sell around VWAPs.
About
After years of self-education, strategy development, and trial-and-error, Renato Leonard Capelj began trading full-time and founded Physik Invest to detail his methods, research, and performance in the markets.
Additionally, Capelj is a Benzinga finance and technology reporter interviewing the likes of Shark Tank’s Kevin O’Leary, JC2 Ventures’ John Chambers, and ARK Invest’s Catherine Wood, as well as a SpotGamma contributor, helping develop insights around impactful options market dynamics.
Disclaimer
At this time, Physik Invest does not carry the right to provide advice. In no way should the materials herein be construed as advice. Derivatives carry a substantial risk of loss. All content is for informational purposes only.