Physik Invest’s Daily Brief is read free by thousands of subscribers. Join this community to learn about the fundamental and technical drivers of markets.
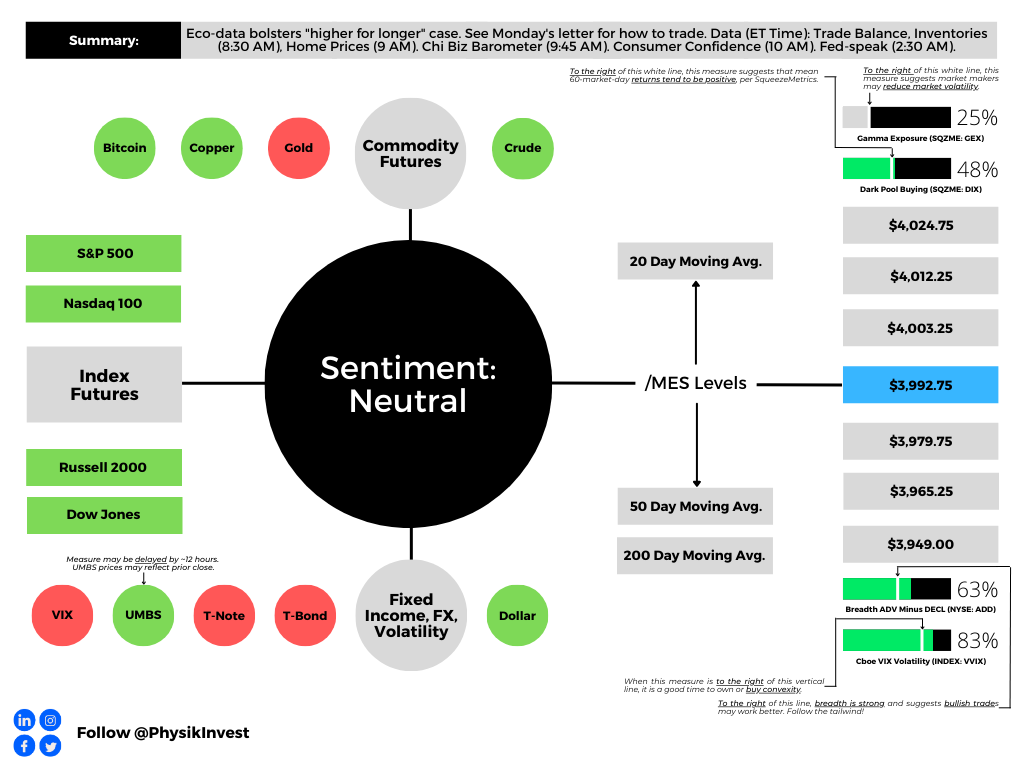
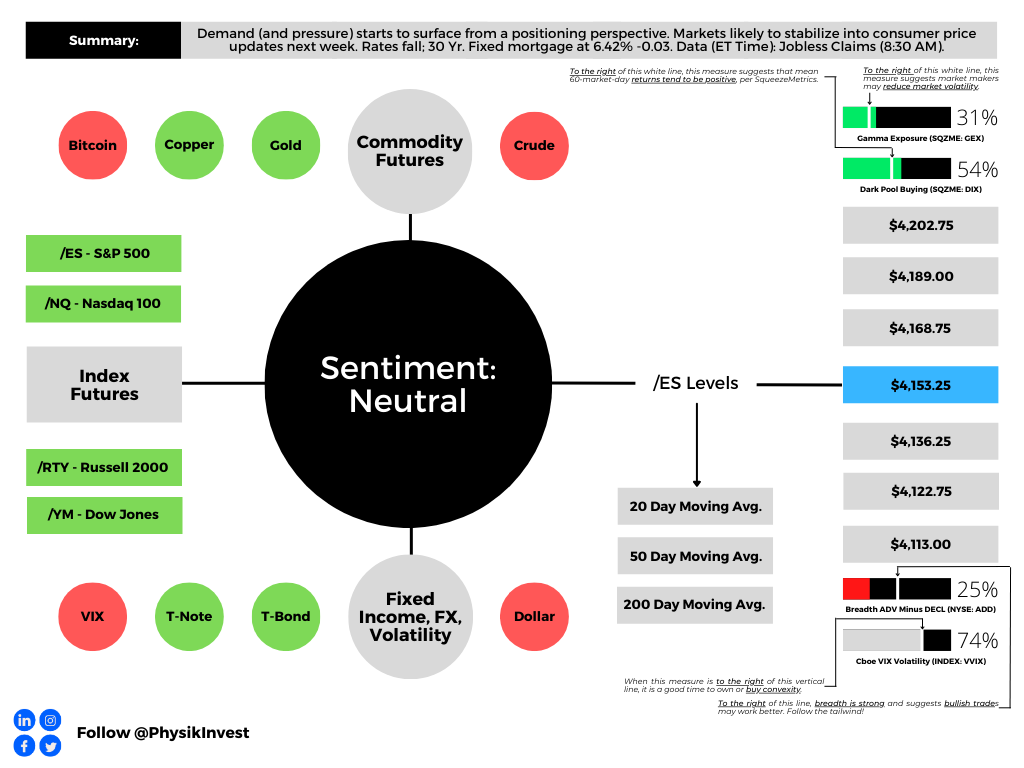
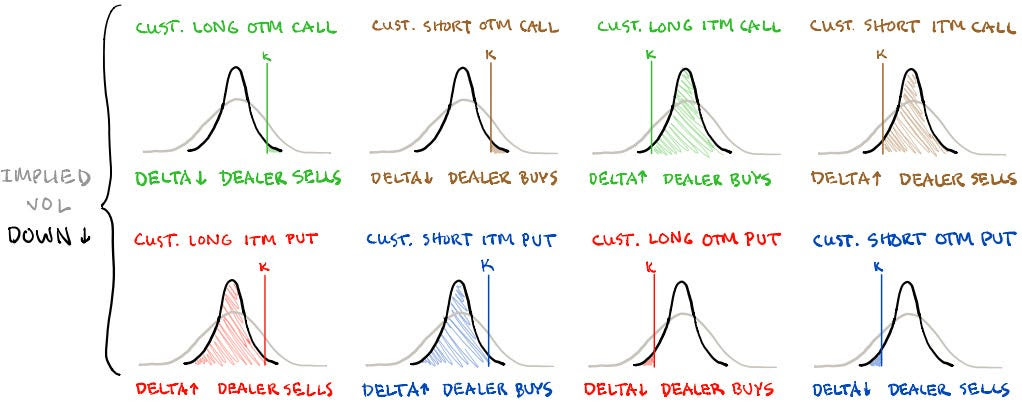
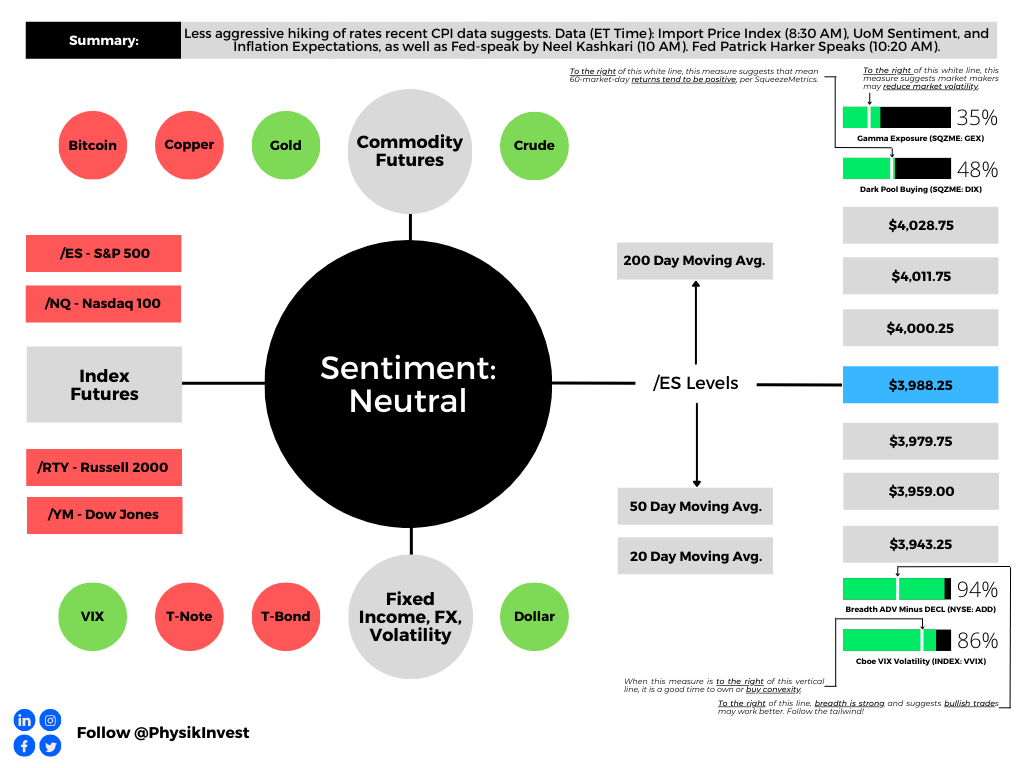
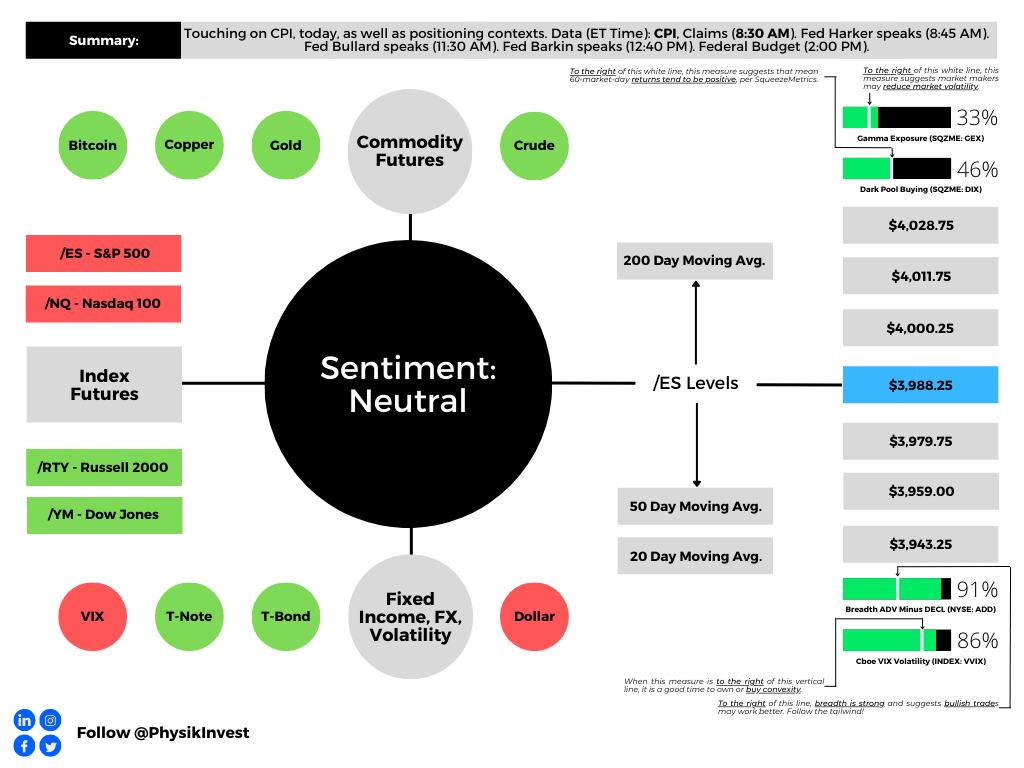
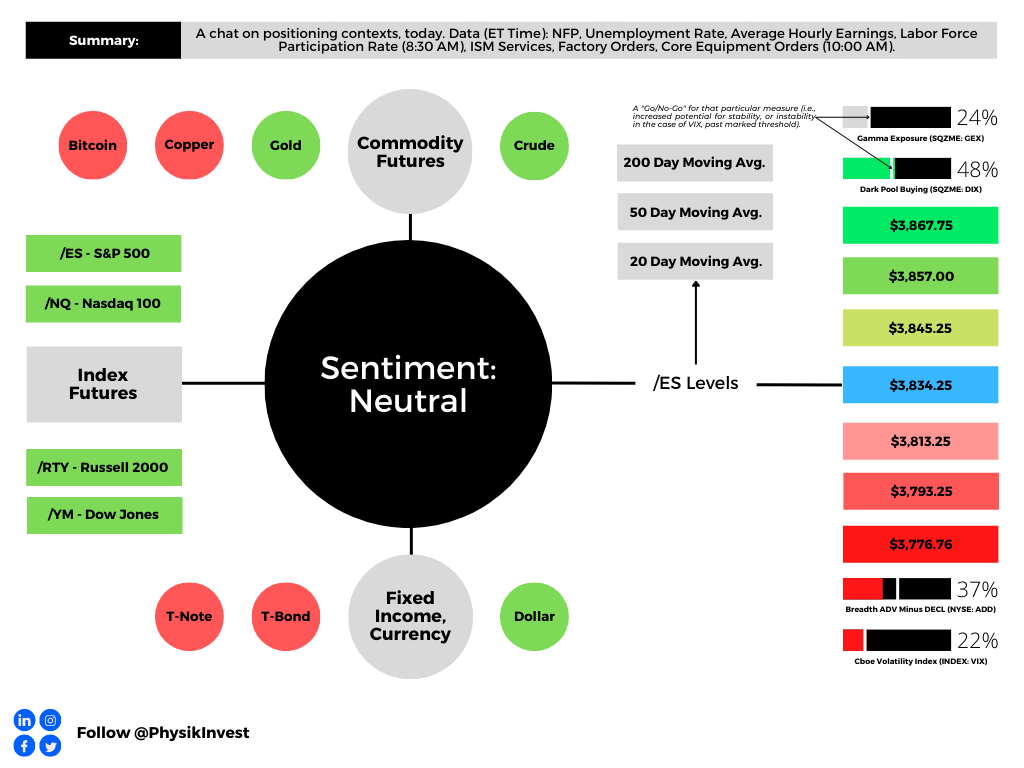
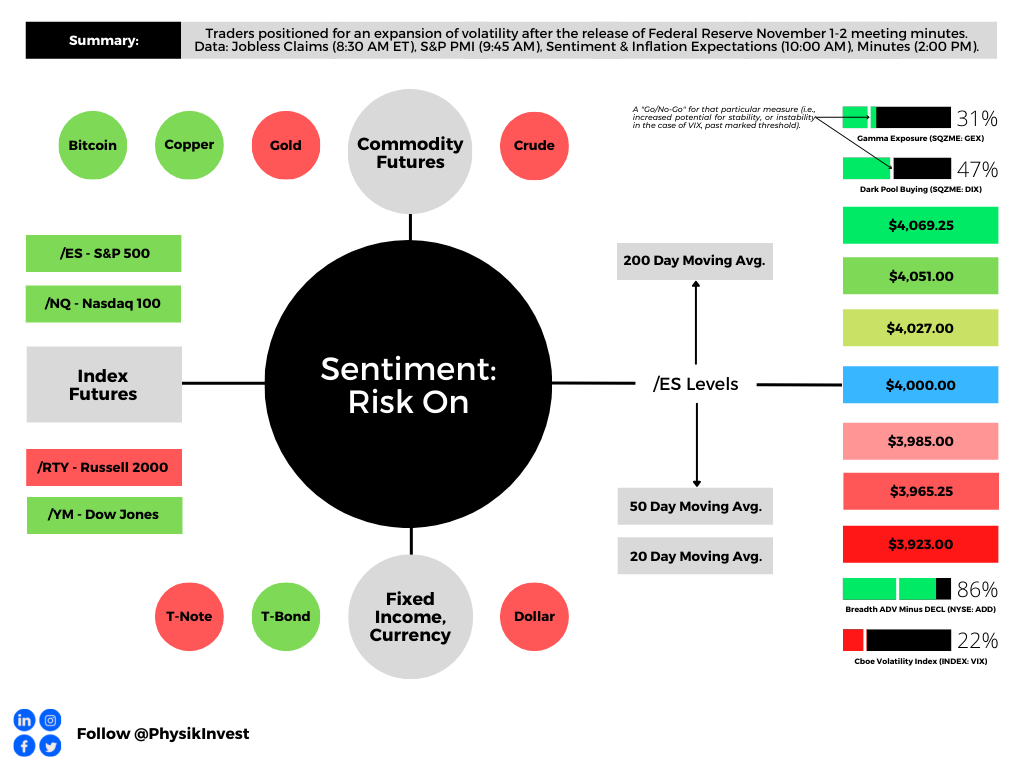
Graphic updated 6:30 AM ET. Sentiment Neutral if expected /MES open is inside of the prior day’s range. /MES levels are derived from the profile graphic at the bottom of this letter. Click here for the latest levels. SqueezeMetrics Dark Pool Index (DIX) and Gamma (GEX) with the latter calculated based on where the prior day’s reading falls with respect to the MAX and MIN of all occurrences available. A higher DIX is bullish. The lower the GEX, the more (expected) volatility. Click to learn the implications of volatility, direction, and moneyness. Breadth reflects a reading of the prior day’s NYSE Advance/Decline indicator. The CBOE VIX Volatility Index (INDEX: VVIX) reflects the attractiveness of owning volatility. UMBS prices via MND. Click here for the economic calendar.
Administrative
A light letter, today.
Check out the Daily Brief for February 27, 2023, for how to take advantage of higher interest rates and define the outcome of your trading.
As an aside, the second to last positioning section paragraph in that letter talks about using short-dated bets like “butterflies, broken-wing butterflies, ratio spreads, back spreads, and beyond.” In the initial version of the letter, your letter writer accidentally wrote box spreads instead of back spreads. Apologies.
Positioning
Yields are ~5.00%, and this is around the S&P 500’s (INDEX: SPX) earnings yield (i.e., the 6-month Treasury yield is about equal to the SPX’s earnings yield of 5.2%).
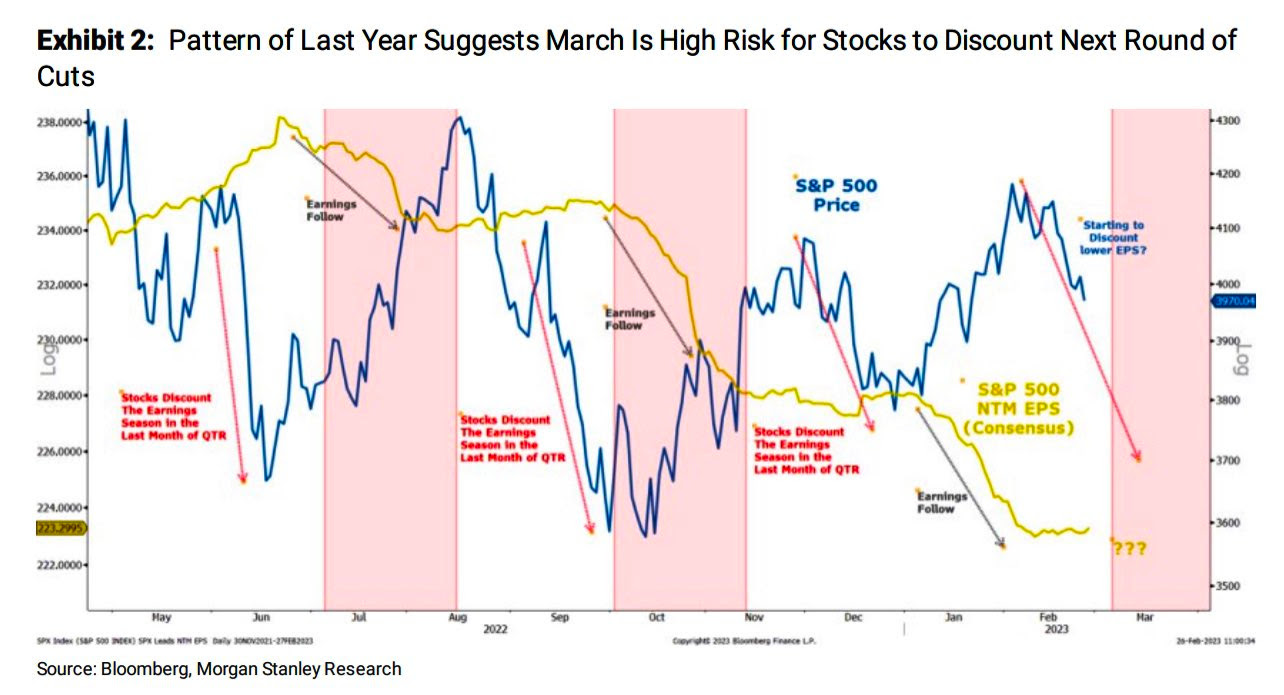
A nod to rising rates and risk premiums, the likes of Morgan Stanley suggest the S&P 500 (INDEX: SPX) will come under further pressure.
Graphic: Retrieved from Morgan Stanley (NYSE: MS).
Since not all who read the letter are active in the same timeframe, in the interest of expanding the opportunity set if we will, your letter writer detailed ways to express one’s longer-term opinion on the upside or downside in a capital-protected way.
Essentially, traders can create their own structured notes, investing in a manner that returns principal only. The difference between the bond/box spread outlay and cash remaining is invested in leverage potential. At maturity, the worst-case is a return of principal.
Further, through such structures, traders can participate in the upside by about the same amount they would with a traditional construction (e.g., 60/40). However, you cut the downside.
Graphic: Retrieved from IPS Strategic Capital’s Pat Hennessy.
Alternatively, traders can bias themselves short or non-directionally. In a short-bias situation, one can buy a put spread (and/or sell a call spread) with an outlay (or max loss) not exceeding the cash remaining after the purchase of a bond or box spread.
Through a short-biased setup, traders may participate in potential downside on the pricing of equity market headwinds.
Graphic: Retrieved from JPMorgan Chase & Co (NYSE: JPM).
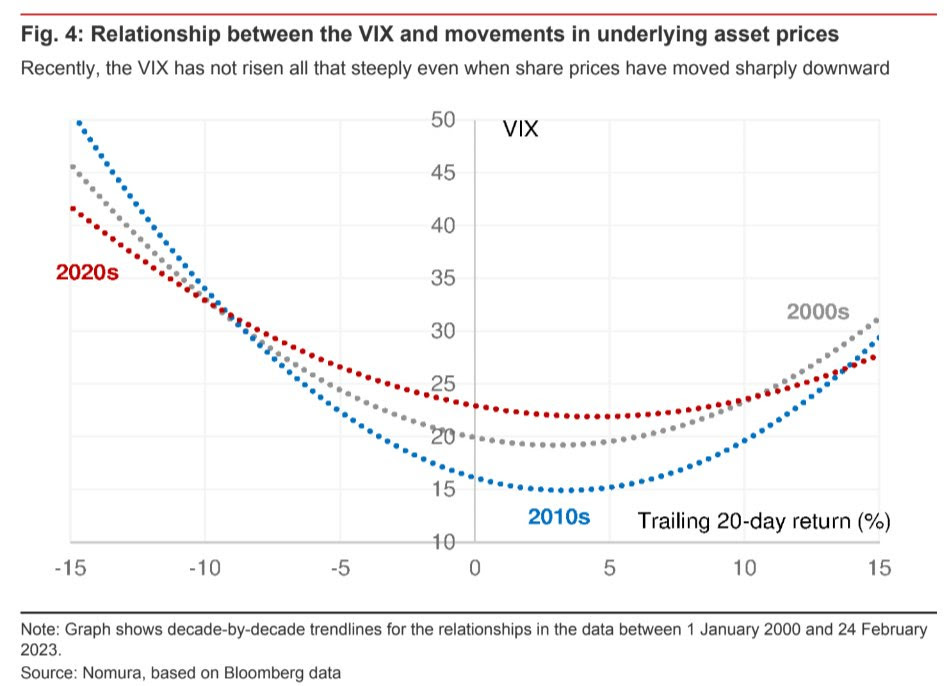
The suggested downside trades are rather attractive now in the absence of hedging demands in longer-dated protection convex in price and volatility. Naive measures like the Cboe VIX Volatility (INDEX: VVIX), as well as the graphic below, allude to the little demands for convexity and a declining sensitivity of the VIX with respect to changes in share prices.
Graphic: Retrieved from Nomura Holdings Inc (NYSE: NMR).
Technical
As of 6:30 AM ET, Tuesday’s regular session (9:30 AM – 4:00 PM ET), in the S&P 500, is likely to open in the upper part of a negatively skewed overnight inventory, inside of the prior day’s range, suggesting a limited potential for immediate directional opportunity.
The S&P 500 pivot for today is $3,992.75.
Key levels to the upside include $4,003.25, $4,012.25, and $4,024.75.
Key levels to the downside include $3,979.75, $3,965.25, and $3,949.00.
Disclaimer: Click here to load the updated key levels via the web-based TradingView platform. New links are produced daily. Quoted levels likely hold barring an exogenous development.
Graphic: 65-minute profile chart of the Micro E-mini S&P 500 Futures.
Definitions
Volume Areas: Markets will build on areas of high-volume (HVNodes). Should the market trend for a period of time, this will be identified by a low-volume area (LVNodes). The LVNodes denote directional conviction and ought to offer support on any test.
If participants auction and find acceptance in an area of a prior LVNode, then future discovery ought to be volatile and quick as participants look to the nearest HVNodes for more favorable entry or exit.
POCs: Areas where two-sided trade was most prevalent in a prior day session. Participants will respond to future tests of value as they offer favorable entry and exit.
MCPOCs: Denote areas where two-sided trade was most prevalent over numerous sessions. Participants will respond to future tests of value as they offer favorable entry and exit.
About
The author, Renato Leonard Capelj, works in finance and journalism.
Capelj spends the bulk of his time at Physik Invest, an entity through which he invests and publishes free daily analyses to thousands of subscribers. The analyses offer him and his subscribers a way to stay on the right side of the market. Separately, Capelj is an options analyst at SpotGamma and an accredited journalist.
You may view this letter’s content calendar at this link.
Disclaimer
Do not construe this newsletter as advice. All content is for informational purposes. Capelj and Physik Invest manage their own capital and will not solicit others for it.
Physik Invest’s Daily Brief is read by thousands of subscribers. You, too, can join this community to learn about the fundamental and technical drivers of markets.
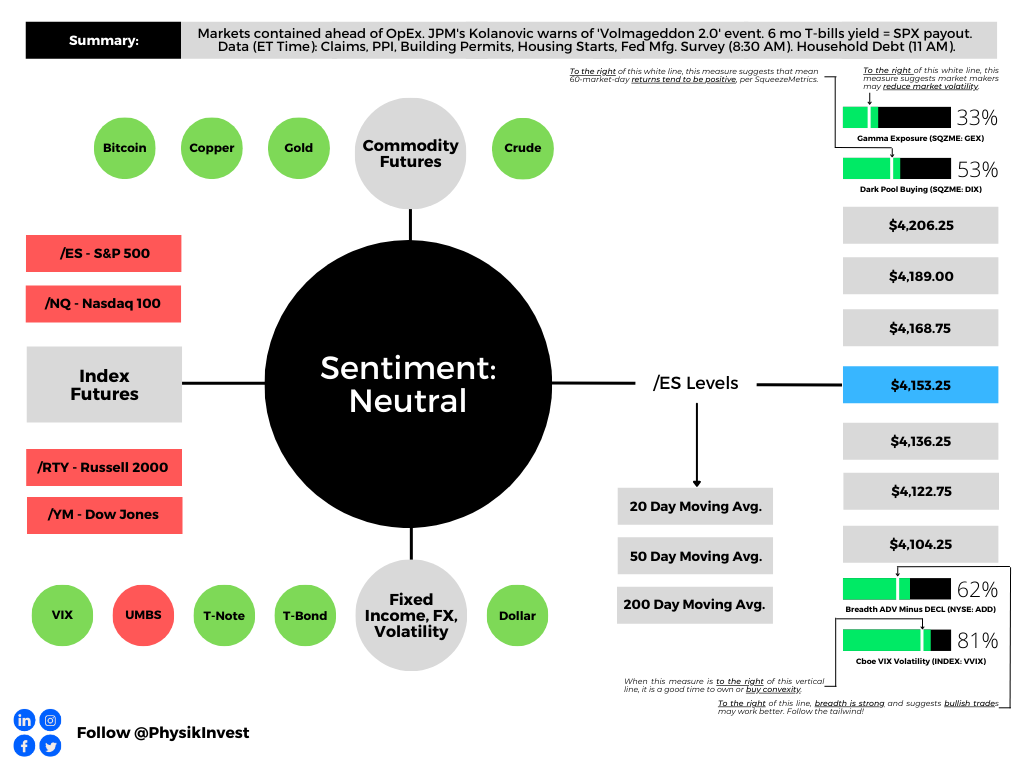
Graphic updated 6:15 AM ET. Sentiment Neutral if expected /ES open is inside of the prior day’s range. /ES levels are derived from the profile graphic at the bottom of this letter. Click here for the latest levels. SqueezeMetrics Dark Pool Index (DIX) and Gamma (GEX) with the latter calculated based on where the prior day’s reading falls with respect to the MAX and MIN of all occurrences available. A higher DIX is bullish. At the same time, the lower the GEX, the more (expected) volatility. Click to learn the implications of volatility, direction, and moneyness. Breadth reflects a reading of the prior day’s NYSE Advance/Decline indicator. The CBOE VIX Volatility Index (INDEX: VVIX) reflects the attractiveness of owning volatility. UMBS price via MND. Click here for the calendar.
Positioning
In the news is quite a bit of noise surrounding ultra-short-dated options with little time to expiry. To quote Nomura Holdings Inc’s (NYSE: NMR) Charlie McElligott, the trading of these options is adding noise; “US equities are such an untradable mess right now.”
However, your letter writer, who mainly trades complex spreads on the cash-settled indexes, thinks there has never been a better time to trade. Ultra-short-dated options enable you to express your opinion in more efficient ways. Additionally, the trade of these options, in the aggregate, can influence market movements, and this is added opportunity if you understand it.
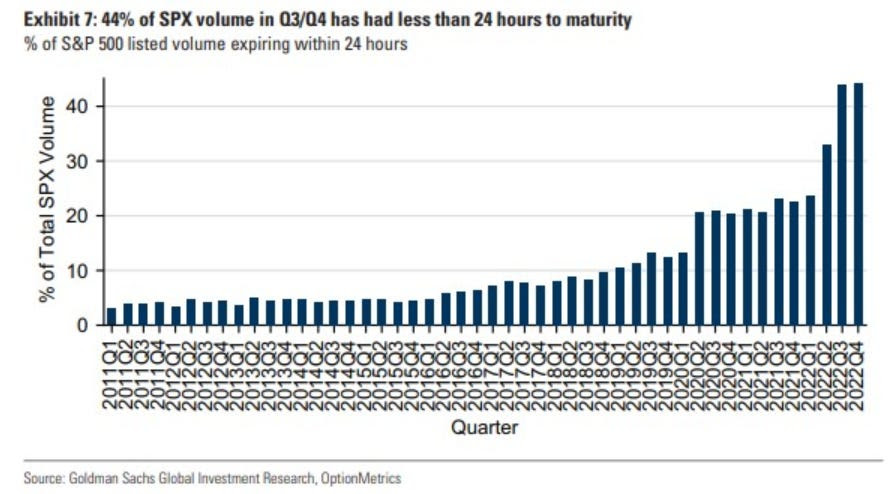
Graphic: Retrieved from Goldman Sachs Group Inc (NYSE: GS) via Bloomberg.
Darrin Johnson, a volatility trader, recently discussed sharp ways to use these options.
Heading into some big events this week, John noted S&P 500 (INDEX: SPX) implied volatility (IVOL) was trading at ~25% on a five-day straddle. Traders could buy this structure while, in the interim, selling other structures like it “against CPI, Retail Sales, and PPI” where IVOL was higher. This would enable you to lower the cost of having positive exposure to movement or positive gamma via the five-day straddle, though this is operating on the premise “that Friday’s volatility will hold mostly steady, while the other 3 deflate.”
Moreover, the ultra-short-dated options are palatable if we will, and other traders, potentially much bigger in size, are observant of this too. The growing interest in these products (e.g., in the second half of last year, ultra-short-dated options made up more than 40% of the S&P 500’s trading volume) is growing in impact on underlying products like the SPX.
In fact, JPMorgan Chase & Co’s (NYSE: JPM) Peng Cheng found these options have an impact that “can vary from a drag of as much as 0.6% to a boost of up to 1.1%.”
To explain, though as of late options counterparties may be playing a smaller role as “customers have taken equal and opposite sides” of positions, per SqueezeMetrics, we can naively look at there being a pool of liquidity to absorb the demand for these ultra-short-dated options which are very sensitive to time, price, and volatility. These increased sensitivities are hedged in a way that impacts this available pool of liquidity. If the trade or impact is large enough, it is transmitted onto underlying market prices.
For instance, consider so-called meme mania and stocks like GameStop Corporation (NYSE: GME) that rocketed as traders’ interest in short-dated options demands rose. To hedge increased demand in call options, for instance, counterparties must buy the underlying stock. This demand boosts the stock.
Likewise, if traders’ consensus is that markets won’t move much until some large macroeconomic events, then their bets against market movement (i.e., sell ultra-short-dated options) will result in counterparties having more exposure to bets on market movement (i.e., positive gamma) which they will hedge in a way that reduces market movement (i.e., buy weakness or sell strength in the underlying stock). So, if traders bet against the movement, resulting in more counterparty positive gamma, then market movement is reduced due to the reaction to this positioning.
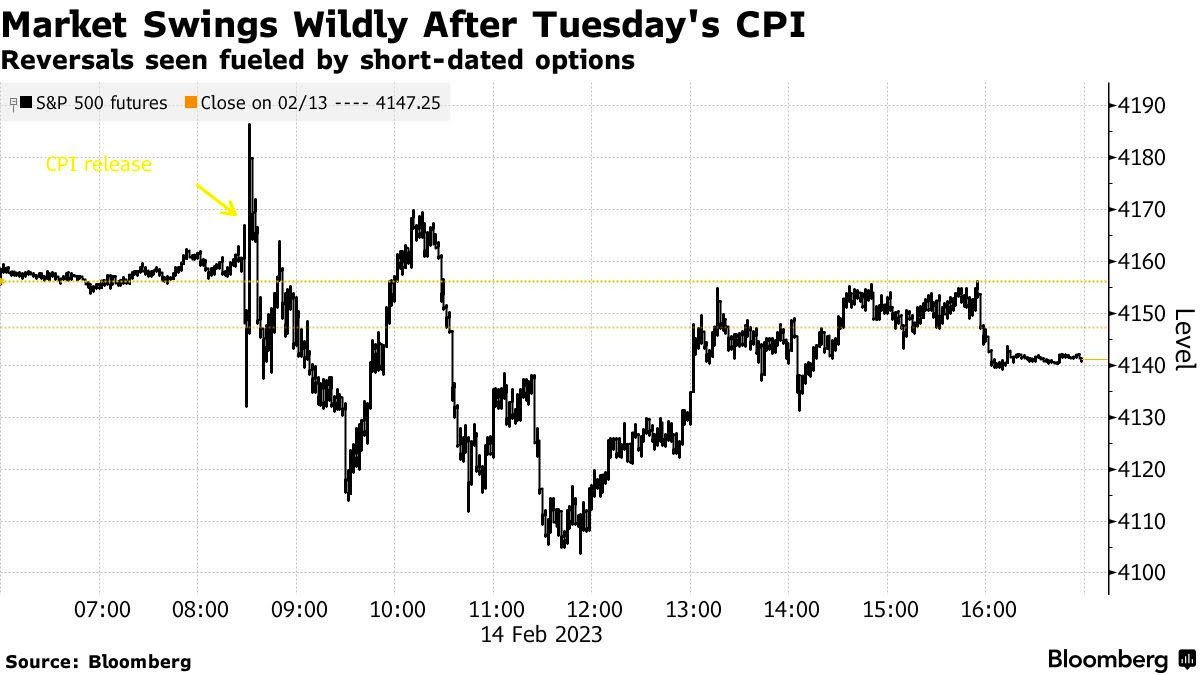
On the other hand, if traders’ consensus is that markets may move a lot, particularly to the downside, their bets on market movement (e.g., buy ultra-short-dated put) will result in counterparties having more exposure to bets against market movement (i.e., negative gamma). This demand for protection will bid options prices, particularly at the front-end of the IVOL term structure as counterparties price this demand in, and the counterparty will sell underlying to hedge. If fears are assuaged and traders no longer demand these bets on market movements, the counterparty can unwind their hedge which, in the put buying example provided, may provide a market boost, such as that which we saw immediately following the release of consumer price updates (CPI) this week; to quote Bloomberg, “[w]hen the worst didn’t happen, these hedges were unwound, helping propel a recovery in futures. It’s partly why the Cboe Volatility Index, or VIX, dropped 7% in a seemingly outsize reaction in a market when the S&P 500 ended the session basically flat.”
Additionally, the re-hedging-inspired recovery was short-lived as well; the impact of ultra-short-dated options, as this letter has stated before, is short-dated. It, too, does much less to influence measures like the Cboe Volatility Index (INDEX: VIX), a floating measure of ~30 day-to-expiry SPX options trading at a fixed-strike IVOL, though it does have an impact. Thus, the dis-interest to hedge stocks traders do not own (or hedge further stocks that may be hedged) out in time, does less to boost the VIX.
Anyways, in January, your letter writer interviewed The Ambrus Group’s co-CIO Kris Sidial about major risks to markets in 2023, as well as reasons why volatility could outperform in 2023 and beyond. Some of the information in that Benzinga interview made it into this newsletter in the days following its release.
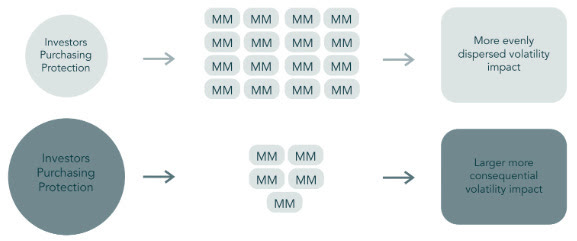
Basically, the SPX and VIX complexes are growing and, on the other side, are a small concentrated group of market makers taking on far more exposure to risk.
Graphic: Retrieved from Ambrus’ publicly available research.
During moments of stress, as we’ve seen in the past with GME for example, options counterparties may be unable to keep up with the demands of investors, so you get a reflexive dynamic that helps push the stock higher. “That same dynamic can happen on the way down”; counterparties will mark up options prices during intense selling. As the options prices rise, options deltas (i.e., their exposure to direction) rise and this prompts so-called bearish vanna counterparty hedging flows in the underlying.
“Imagine a scenario where [some disaster happens] and everybody starts buying 0 DTE puts. That’s going to reflexively drive the S&P lower,” Sidial said. “Take, for example, the JPMorgan collar position that clearly has an effect on the market, and people are starting to understand that effect. That’s just one fund. Imagine the whole derivative ecosystem” leaning one way.
Graphic: Retrieved from Ambrus’ publicly available research.
Well, that’s what JPM’s Marko Kolanovic just said is a major risk and could exacerbate market volatility. “While history doesn’t repeat, it often rhymes,” he explained, noting that the trade of ultra-short-dated options portends a Volmageddon 2.0. If you recall, in 2018, Volmageddon 1.0 turned successful long-running short-volatility trades on their head when traders who were betting against big movements in the market saw their profits erode in days.
Further, to conclude this section since your letter writer is running short on time, as Sidial said, “if you’re trading volatility, let there be an underlying catalyst for doing so.” From a “risk-to-reward perspective, … it’s a better bet to be on the long volatility side,” given “that there are so many things that … keep popping up” from a macro perspective. Check out our letters from the past weeks where we talked about protecting profits (e.g., sell call vertical to finance and buy a put vertical with a lot of time to expiry).
For Ambrus’ publicly available research, click here. Also, follow Sidial on Twitter, here. Consider reading your letter writer’s past two conversations with Sidial, as well. Here is an article on 2021 and the meme stock debacle. Here is another article talking more about Ambrus’ processes.
Technical
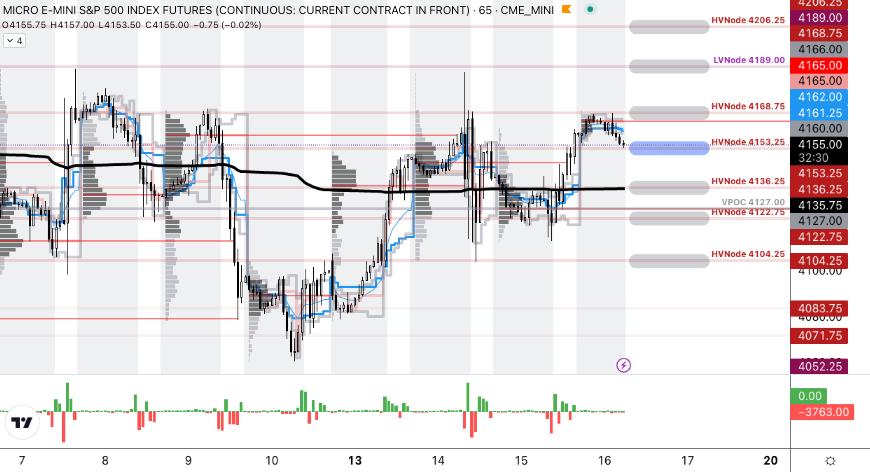
As of 6:15 AM ET, Thursday’s regular session (9:30 AM – 4:00 PM ET), in the S&P 500, is likely to open in the lower part of a balanced overnight inventory, inside of the prior day’s range, suggesting a limited potential for immediate directional opportunity.
The S&P 500 pivot for today is $4,153.25.
Key levels to the upside include $4,168.75, $4,189.00, and $4,206.25.
Key levels to the downside include $4,136.25, $4,122.75, and $4,104.25.
Disclaimer: Click here to load the updated key levels via the web-based TradingView platform. New links are produced daily. Quoted levels likely hold barring an exogenous development.
Graphic: 65-minute profile chart of the Micro E-mini S&P 500 Futures.
Definitions
Volume Areas: Markets will build on areas of high-volume (HVNodes). Should the market trend for a period of time, this will be identified by a low-volume area (LVNodes). The LVNodes denote directional conviction and ought to offer support on any test.
If participants auction and find acceptance in an area of a prior LVNode, then future discovery ought to be volatile and quick as participants look to the nearest HVNodes for more favorable entry or exit.
POCs: Areas where two-sided trade was most prevalent in a prior day session. Participants will respond to future tests of value as they offer favorable entry and exit.
About
The author, Renato Leonard Capelj, works in finance and journalism.
Capelj spends the bulk of his time at Physik Invest, an entity through which he invests and publishes free daily analyses to thousands of subscribers. The analyses offer him and his subscribers a way to stay on the right side of the market. Separately, Capelj is an options analyst at SpotGamma and an accredited journalist.
Physik Invest’s Daily Brief is read by thousands of subscribers. You, too, can join this community to learn about the fundamental and technical drivers of markets.
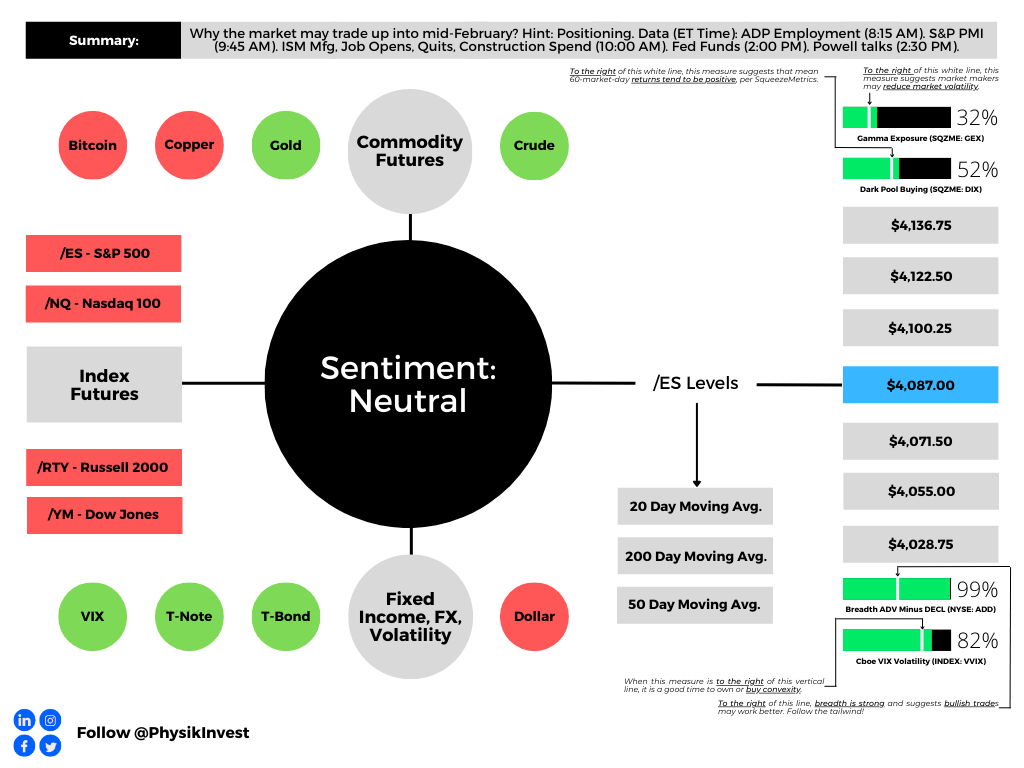
Graphic updated 7:20 AM ET. Sentiment Neutral if expected /ES open is inside of the prior day’s range. /ES levels are derived from the profile graphic at the bottom of this letter. Click here for the latest levels. SqueezeMetrics Dark Pool Index (DIX) and Gamma (GEX) with the latter calculated based on where the prior day’s reading falls with respect to the MAX and MIN of all occurrences available. A higher DIX is bullish. At the same time, the lower the GEX, the more (expected) volatility. Click to learn the implications of volatility, direction, and moneyness. Breadth reflects a reading of the prior day’s NYSE Advance/Decline indicator. The CBOE VIX Volatility Index (INDEX: VVIX) reflects the attractiveness of owning volatility.
Positioning
The cross-cutting forces on inflation are set to net out says Bob Elliott, the CIO at Unlimited. The former Bridgewater Associates executive thinks short-term inflation pressures are skewed upward, and that new data suggests “the respite in inflation … is probably going to fade and higher numbers are going to print.”
In short, disinflation from oil prices and the amelioration of supply chains “cannot persist, and that’s what we’re seeing now. It looks like those upward pressures on inflation are moving faster than the pace that services prices and housing costs are moving down.”
Consequently, there is a potential for broad inflation measures to remain higher for longer, hence the thinking that the Federal Reserve (Fed) indeed stays tougher on inflation for longer (i.e., higher rates for longer). This would support traders’ recent desire to bet large on downside movement next week when the Consumer Price Index (CPI) is set to update.
Publicized by Kai Volatility’s Cem Karsan and Damped Spring’s Andy Constan, some trader(s) bought to open 24,000 put options at the $4,050.00 S&P 500 (FUTURE: /ES) strike expiring February 17, 2023. The trade coincided with market makers selling to open “roughly 7,200 [/ES] futures contracts worth roughly $1.5 billion.” This “caused the local low,” Constan, who also worked at Bridgewater (and your letter writer had the honor of interviewing before), explained.
This trade, and others like it, compounded the pressures of the dealers selling their existing stock and futures “to re-hedge their call options exposures that are declining in value.”
Graphic: Retrieved from SqueezeMetrics.
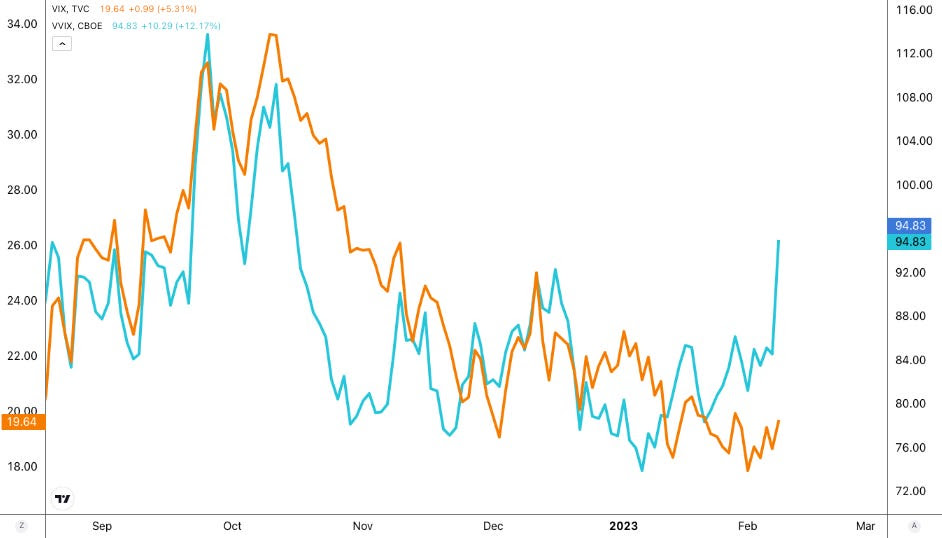
Accordingly, the Cboe Volatility Index (INDEX: VIX) is bid, as is the Cboe VIX Volatility Index (INDEX: VVIX), which your letter writer talked about in a SpotGamma note last night. Basically, traders are hedging more, and this is observed by previously low readings of convexity moving higher. Still, given that there is still some time to CPI, there’s potential for “current prices the SPX trades at [to] appear sticky for lack of better phrasing,” SpotGamma explained; pre-CPI, traders often sell short-term volatility as a bet on limited movement. It’s the post-CPI expirations in which implied volatility (IVOL) is wound and will serve as a catalyst for a fast move higher or lower.
Graphic: Retrieved from TradingView. Blue = VVIX. Orange = VIX.
So, in the short-term, there may be some pinning, followed by an expansion of range into the mid-February (2/17) monthly options expiration (OpEx). This event likely puts the market in a precarious position and at the whims of macro-type repositioning, which may be bearish based on the insights this letter has covered in the past.
Graphic: Retrieved from Physik Invest. Data from SqueezeMetrics. Gamma exposure is set to fall in mid-February, and this may result in less support from the options market.
Trades that look and are working well include those that use short-call vertical credits to finance long-put vertical debits out months from now. For instance, for every two units of short call verticals (SOLD -1 VERTICAL SPX 100 19 MAY 23 [AM] 4150/4200 CALL), your letter writer is looking to own one unit of the long put vertical (BUY +1 VERTICAL SPX 100 16 JUN 23 [AM] 3450/3350 PUT). Remember that your letter writer may not necessarily think the market will trade that far, rather it may be a bet on IVOL repricing.
A case study on last week’s ultra-successful call ratio spreads is coming soon. Take care and watch your risk!
Technical
As of 7:20 AM ET, Thursday’s regular session (9:30 AM – 4:00 PM ET), in the S&P 500, is likely to open in the upper part of a positively skewed overnight inventory, inside of the prior day’s range, suggesting a limited potential for immediate directional opportunity.
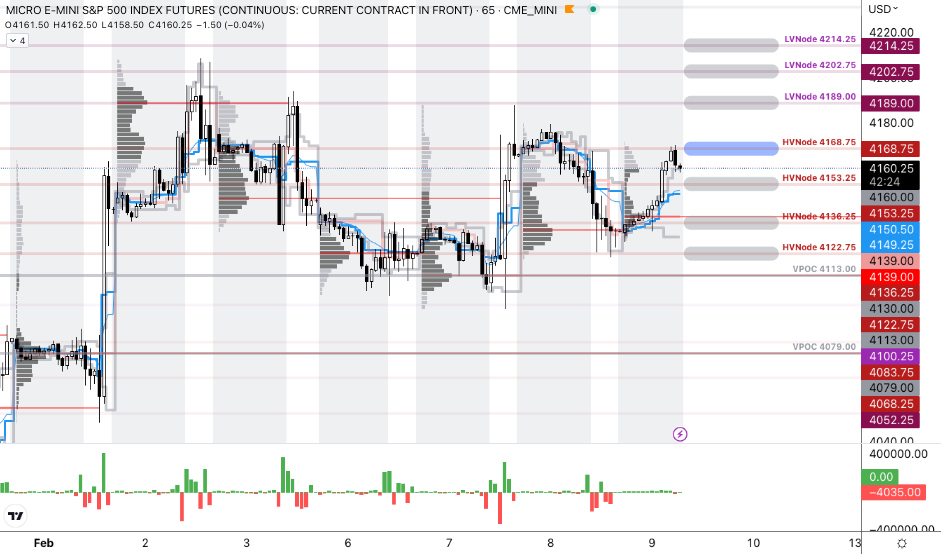
The S&P 500 pivot for today is $4,168.75.
Key levels to the upside include $4,189.00, $4,202.75, and $4,214.25.
Key levels to the downside include $4,153.25, $4,136.25, and $4,122.75.
Disclaimer: Click here to load the updated key levels via the web-based TradingView platform. New links are produced daily. Quoted levels likely hold barring an exogenous development.
Graphic: 65-minute profile chart of the Micro E-mini S&P 500 Futures.
Definitions
Volume Areas: Markets will build on areas of high-volume (HVNodes). Should the market trend for a period of time, this will be identified by a low-volume area (LVNodes). The LVNodes denote directional conviction and ought to offer support on any test.
If participants auction and find acceptance in an area of a prior LVNode, then future discovery ought to be volatile and quick as participants look to the nearest HVNodes for more favorable entry or exit.
About
The author, Renato Leonard Capelj, works in finance and journalism.
Capelj spends the bulk of his time at Physik Invest, an entity through which he invests and publishes free daily analyses to thousands of subscribers. The analyses offer him and his subscribers a way to stay on the right side of the market. Separately, Capelj is an options analyst at SpotGamma and an accredited journalist.
Physik Invest’s Daily Brief is read by thousands of subscribers. You, too, can join this community to learn about the fundamental and technical drivers of markets.
Graphic updated 8:00 AM ET. Sentiment Neutral if expected /ES open is inside of the prior day’s range. /ES levels are derived from the profile graphic at the bottom of this letter. Click here for the latest levels. SqueezeMetrics Dark Pool Index (DIX) and Gamma (GEX) with the latter calculated based on where the prior day’s reading falls with respect to the MAX and MIN of all occurrences available. A higher DIX is bullish. At the same time, the lower the GEX, the more (expected) volatility. Click to learn the implications of volatility, direction, and moneyness. Breadth reflects a reading of the prior day’s NYSE Advance/Decline indicator. The CBOE VIX Volatility Index (INDEX: VVIX) reflects the attractiveness of owning volatility.
Positioning
Markets think the Federal Reserve (Fed) raises its benchmark rate by 25 basis points. Notwithstanding the less aggressive hike, strategists believe the Fed will stay tougher on inflation for far longer and, accordingly, crush traders’ optimism.
“I suspect the Fed messaging tomorrow will push back against the pivot narrative and thereby current bond market pricing,” DoubleLine Capital CIO Jeffrey Gundlach said. Former investment banker and trader, as well as the president of the Minneapolis Fed, Neel Kashkari warned the Fed is set on finishing the job and cutting inflation, even if it costs millions of Americans their jobs. “I’ve spent enough time around Wall Street to know that they are culturally, institutionally, optimistic,” he said.
Further, relief in markets (e.g., stocks, housing) is a boon for asset owners and may enable companies to raise cash, bid up equipment prices, and demand new hires.
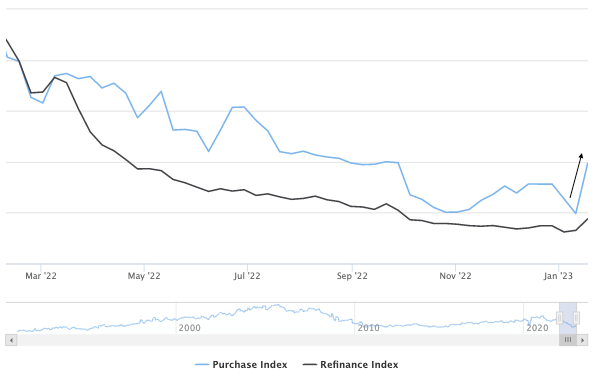
Graphic: Retrieved from Mortgage News Daily. “A trend of [increasing] purchase applications implies home buyer demand is [increasing].” The prevailing narrative is that the Fed wants less inflation and less demand. This narrative’s been disrupted, in part. Recall our Monday letter talking about investors’ desire to put their cash to work and the demand for treasuries (i.e., bond bid and yield pressured) which forced investors into previously depressed assets.
With inflation still a problem, regardless of whether there are better solutions as we put forth in the January 31 letter, the Fed is looking to keep rates above 5% for the rest of 2023, though markets are pricing a pivot far earlier and at a lower rate.
Despite the expectation of toughness from the Fed, markets have not broken down. Rather, if we zoom out, they are trending sideways to higher and may continue to do so. That’s according to Kai Volatility’s Cem Karsan who says that implied volatility (IVOL) is heightened across options with very little time to expiry (1- to 3-days).
“Event vol, which is the pricing of one-, two-, and three-day options, is significantly higher than everything else behind it right now,” he said, noting that customers’ or traders’ demands for downside put protection is the culprit. That said, despite the committee’s recent hawkishness, “the market responded relatively well at those levels, and you’re seeing vol come back down.”
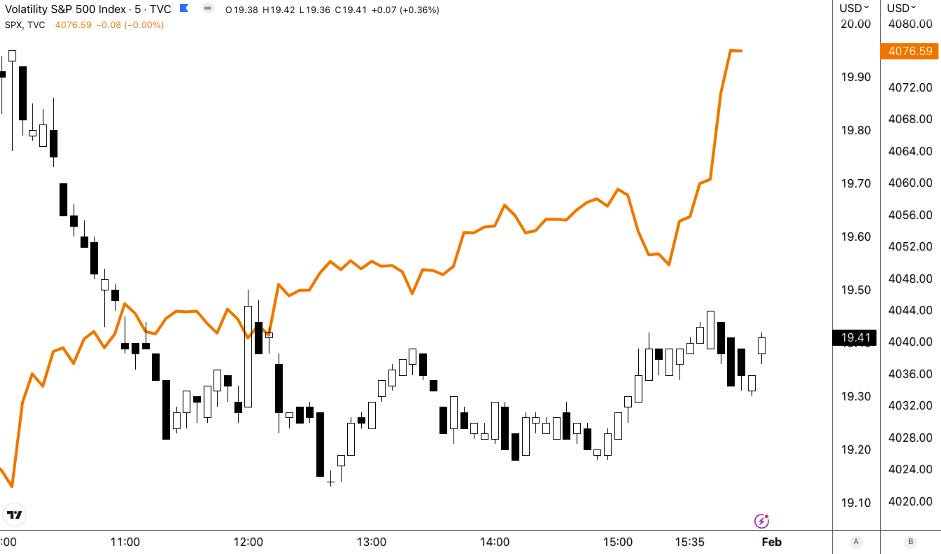
Graphic: Retrieved from TradingView. First included in SpotGamma’s PM Note for 1/31/2023. During Tuesday’s strength, measures of IVOL, such as the Cboe Volatility Index (INDEX: VIX) fell, though the VIX did not move lower in as sharp of a fashion that the S&P 500 (INDEX: SPX) traded higher. In fact, the VIX trended up into the close, after a mid-day bottom, suggesting some left-over hedging demands ahead of some important macroeconomic drivers this week.
“I think that’s kind of likely what you’re going to see, regardless of what the Fed does,” Karsan added. That’s because, barring some unexpected development, traders will not be able to justify the pricing of ultra-short-dated options post-Fed; the supply and expiry of short-dated options will coincide with the dealers or market makers who are short-stock against the puts they supplied buying back their hedges.
“Vol structurally affects how markets move. Puts are the way people hedge in the market and dealers are short the puts. If you have an event vol that comes down, those vanna and charm effects will naturally lead to a buyback,” post-Fed.
For context, vanna is the change in an options delta with respect to changes in IVOL. Charm is the change in an options delta with respect to changes in time. These are second-order derivatives of an option’s value, once to time or IVOL, and once to delta.
You might have heard the old #trading adage "never short a dull market", Cem Karsan @jam_croissant explains how some second order Greeks, vanna & charm, play a role in proving out that phrase. #Vol411pic.twitter.com/AMnd7kQQdA
As your letter writer explained in a SpotGamma analysis yesterday, we saw an interest to hedge heading into this week’s Fed announcement. This coincided with a slight rebound in measures like the Cboe VIX Volatility (INDEX: VVIX) (which, in general, reads low and suggests convexity is a good place to be), and put a damper on the rally, hence its climax on Friday.
Moreover, if “macroeconomic events do not disappoint, IVOL compression may provide markets a boost,” SpotGamma explained. “Notwithstanding, the marginal compression of heightened IVOL, because of its lower starting point, probably does less to encourage a longer-lasting rally,” hence the thought that, if there was to be relief post-Fed, it would likely last up until the mid-February monthly options expiration (OpEx). OpEx’s removal of traders’ options protection (as well as dealers’ supportive buyback to those options that were demanded), may leave the market at risk of bearish macro-type flows.
Compounding the risk is traders’ expected reaction in case of weakness. The desire to hedge during a drop would coincide with a re-pricing in IVOL dangerous to anyone who is short volatility, hence this letter’s recent focus on owning the S&P 500 (INDEX: SPX) via call butterflies and call ratio spreads, the sorts of trades that would benefit from an SPX and VIX up environment (the result of traders bidding up call options due to their fear of missing out, in the context of less liquidity to absorb those demands).
To summarize everything, we have the Fed rate decision coming up. After, markets will be volatile but more likely to trend higher into mid-February, bolstered by traders’ fears of missing out in the context of a lower liquidity environment, as well as stimulus (e.g., falling Treasury General Account played into an easing of financial conditions by making it easier for banks to lend and finance trading activities). After mid-February, the window for markets to weaken and accelerate to the downside may open, based on the information we have today.
As an aside, the last time the Nasdaq 100 (INDEX: NDX) was up more than 10% in January was in 2001, The Market Ear informed subscribers yesterday.
Graphic: Retrieved from BNP Paribas ADR (OTC: BNPQY) via The Market Ear.
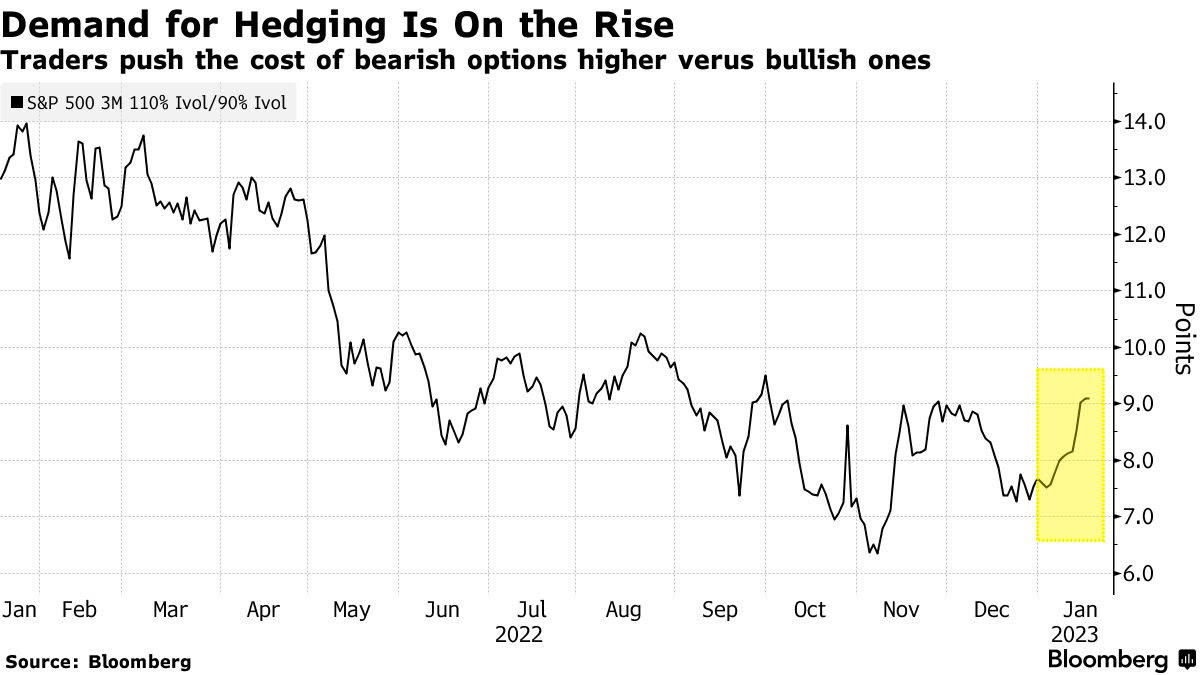
Should you wish to hedge, longer-dated SPX IVOL is cheap, relative to recent history.
Graphic: Retrieved from Bank of America Corporation (NYSE: BAC) via The Market Ear.
Finally, if you’re interested in following further along the fundamental conversation in Tuesday’s letter, check out Dr. Pippa Malmgren’s post on “ancient empires springing back to life.”
Technical
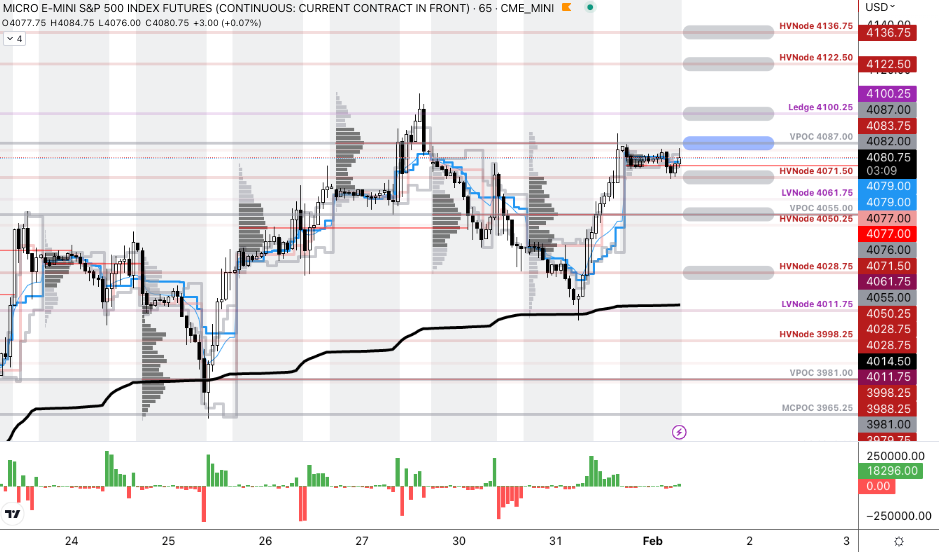
As of 8:00 AM ET, Wednesday’s regular session (9:30 AM – 4:00 PM ET), in the S&P 500, is likely to open in the middle part of a negatively skewed overnight inventory, inside of the prior range, suggesting a limited potential for immediate directional opportunity.
The S&P 500 pivot for today is $4,087.00.
Key levels to the upside include $4,100.25, $4,122.50, and $4,136.75.
Key levels to the downside include $4,071.50, $4,055.00, and $4,028.75.
Disclaimer: Click here to load the updated key levels via the web-based TradingView platform. New links are produced daily. Quoted levels hold weight barring an exogenous development.
Graphic: 65-minute profile chart of the Micro E-mini S&P 500 Futures.
Definitions
Volume Areas: Markets will build on areas of high-volume (HVNodes). Should the market trend for a period of time, this will be identified by a low-volume area (LVNodes). The LVNodes denote directional conviction and ought to offer support on any test.
If participants auction and find acceptance in an area of a prior LVNode, then future discovery ought to be volatile and quick as participants look to the nearest HVNodes for more favorable entry or exit.
POCs: Areas where two-sided trade was most prevalent in a prior day session. Participants will respond to future tests of value as they offer favorable entry and exit.
About
In short, Renato Leonard Capelj is an economics graduate working in finance and journalism.
Capelj spends most of his time as the founder of Physik Invest through which he invests and publishes daily analyses to subscribers, some of whom represent well-known institutions.
Separately, Capelj is an equity options analyst at SpotGamma and an accredited journalist interviewing global leaders in business, government, and finance.
Physik Invest’s Daily Brief is read by thousands of subscribers. You, too, can join this community to learn about the fundamental and technical drivers of markets.
Graphic updated 8:00 AM ET. Sentiment Risk-On if expected /ES open is above the prior day’s range. /ES levels are derived from the profile graphic at the bottom of this letter. Click here for the latest levels. SqueezeMetrics Dark Pool Index (DIX) and Gamma (GEX) with the latter calculated based on where the prior day’s reading falls with respect to the MAX and MIN of all occurrences available. A higher DIX is bullish. At the same time, the lower the GEX, the more (expected) volatility. Click to learn the implications of volatility, direction, and moneyness. Breadth reflects a reading of the prior day’s NYSE Advance/Decline indicator. The CBOE VIX Volatility Index (INDEX: VVIX) reflects the attractiveness of owning volatility.
Positioning
It’s a dynamic this letter has discussed before. Levels quoted in the bottom section of this letter have proved useful in recent trade, marking the bottom and top of rallies precisely. A factor to blame is short-term participation. Let’s explain this further.
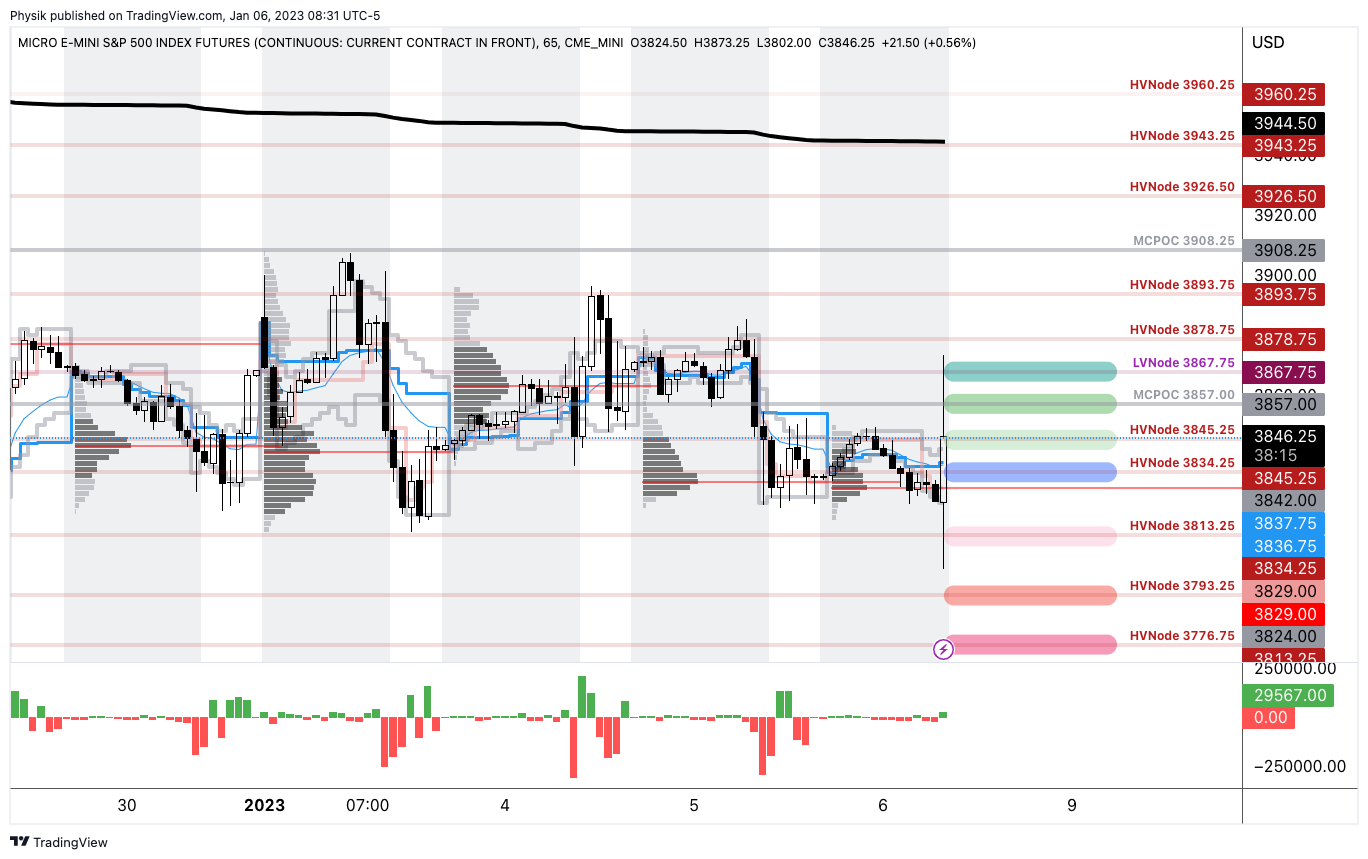
Graphic: 65-minute profile chart of the Micro E-mini S&P 500 Futures.
For instance, as SpotGamma said this morning, volumes at options strikes, very close to levels this letter quotes, are very large relative to the open interest changes. These volumes are large enough to add to the movement and result in responses to certain areas, but their impact is not long-lasting. In fact, some suggest the activity is part of “trading for risk positioning” and the impact “can net out” over a longer time horizon.
It is this letter writer’s opinion that the noise is easy to get swept into. Rather, we are interested in participating in the bigger strides, hence the trades we’ve quoted prior.
As your letter writer elaborated in a recent note for SpotGamma, following weakness heading into the January monthly options expiration (OpEx), the window was open for relief. A cross above big inflections like the 200-day simple moving average, a trigger for some to buy stocks, coupled with measures like the Cboe Volatility Index (INDEX: VIX) trending higher, partly the result of the fear of missing out and hedging in a lower liquidity environment, had us leaning optimistic.
Notwithstanding, with measures like the Cboe VIX Volatility (INDEX: VVIX) “at low levels and rebounding” implying “(1) traders are looking to hedge for cheap and (2) convexity remains a good place to be”, we had the interest to limit downside via call structures with long and short options. The short options help us harvest a bit of call skew and lower the cost of the spread, helping it retain “value better through time.”
In short, though “the marginal positivity of further IV compression likely does little to keep stocks on an upward trajectory”, SpotGamma explained, structures we explained recently may enable you to get on the right side of an SPX and VIX up environment (explained by SpotGamma), all the while limiting downside on the eventual turn.
If you’re averse to directional risk, consider trades like the Box Spreads we talked about many letters back, which are now gaining popularity.
Technical
As of 8:00 AM ET, Thursday’s regular session (9:30 AM – 4:00 PM ET), in the S&P 500, is likely to open in the upper part of a positively skewed overnight inventory, outside of prior-range and -value, suggesting a potential for immediate directional opportunity.
Our S&P 500 pivot for today is $4,050.25.
Key levels to the upside include $4,061.75, $4,071.50, and $4,083.75.
Key levels to the downside include $4,028.75, $4,011.75, and $3,998.25.
Click here to load updated key levels into the web-based TradingView platform. All levels are derived using the 65-minute timeframe. New links are produced, daily.
Graphic: 65-minute profile chart of the Micro E-mini S&P 500 Futures.
Definitions
Volume Areas: Markets will build on areas of high-volume (HVNodes). Should the market trend for long periods of time, it will be identified by low-volume areas (LVNodes). LVNodes denote directional conviction and ought to offer support on any test.
If participants auction and find acceptance in an area of a prior LVNode, then future discovery ought to be volatile and quick as participants look to HVNodes for favorable entry or exit.
POCs: Denote areas where two-sided trade was most prevalent in a prior day session. Participants will respond to future tests of value as they offer favorable entry and exit.
About
In short, Renato Leonard Capelj is an economics graduate working in finance and journalism.
Capelj spends most of his time as the founder of Physik Invest through which he invests and publishes daily analyses to subscribers, some of whom represent well-known institutions.
Separately, Capelj is an equity options analyst at SpotGamma and an accredited journalist interviewing global leaders in business, government, and finance.
Physik Invest’s Daily Brief is read by thousands of subscribers. You, too, can join this community to learn about the fundamental and technical drivers of markets.
Graphic updated 7:00 AM ET. Sentiment Neutral if expected /ES open is inside of the prior day’s range. /ES levels are derived from the profile graphic at the bottom of this letter. Levels may have changed since initially quoted; click here for the latest levels. SqueezeMetrics Dark Pool Index (DIX) and Gamma (GEX) with the latter calculated based on where the prior day’s reading falls with respect to the MAX and MIN of all occurrences available. A higher DIX is bullish. At the same time, the lower the GEX, the more (expected) volatility. Click to learn the implications of volatility, direction, and moneyness. Breadth reflects a reading of the prior day’s NYSE Advance/Decline indicator. The CBOE VIX Volatility Index (INDEX: VVIX) measure reflects the total attractiveness of owning volatility.
Administrative
A bit late as your letter writer is getting ready to travel. Sorry and have a great Friday!
Fundamental
Thursday’s inflation update was as expected.
The Consumer Price Index (CPI) saw a 6.5% rise year-over-year (YoY) and a 0.1% fall month-over-month (MoM). Core CPI was +5.7% YoY and +0.3% MoM.
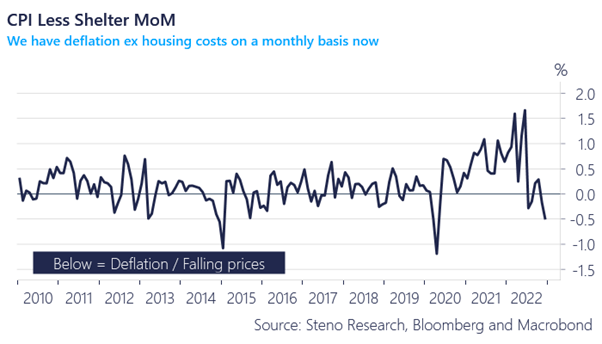
In his post-CPI analysis, Andreas Steno Larsen said inflation has mostly disappeared, and, if we cut shelter costs, which are outdated, “deflation on a quarterly and monthly basis is here.”
The Federal Reserve’s (Fed) “favored statistical measures for underlying inflationary pressure all confirm a decline,” added Bloomberg’s John Authers.
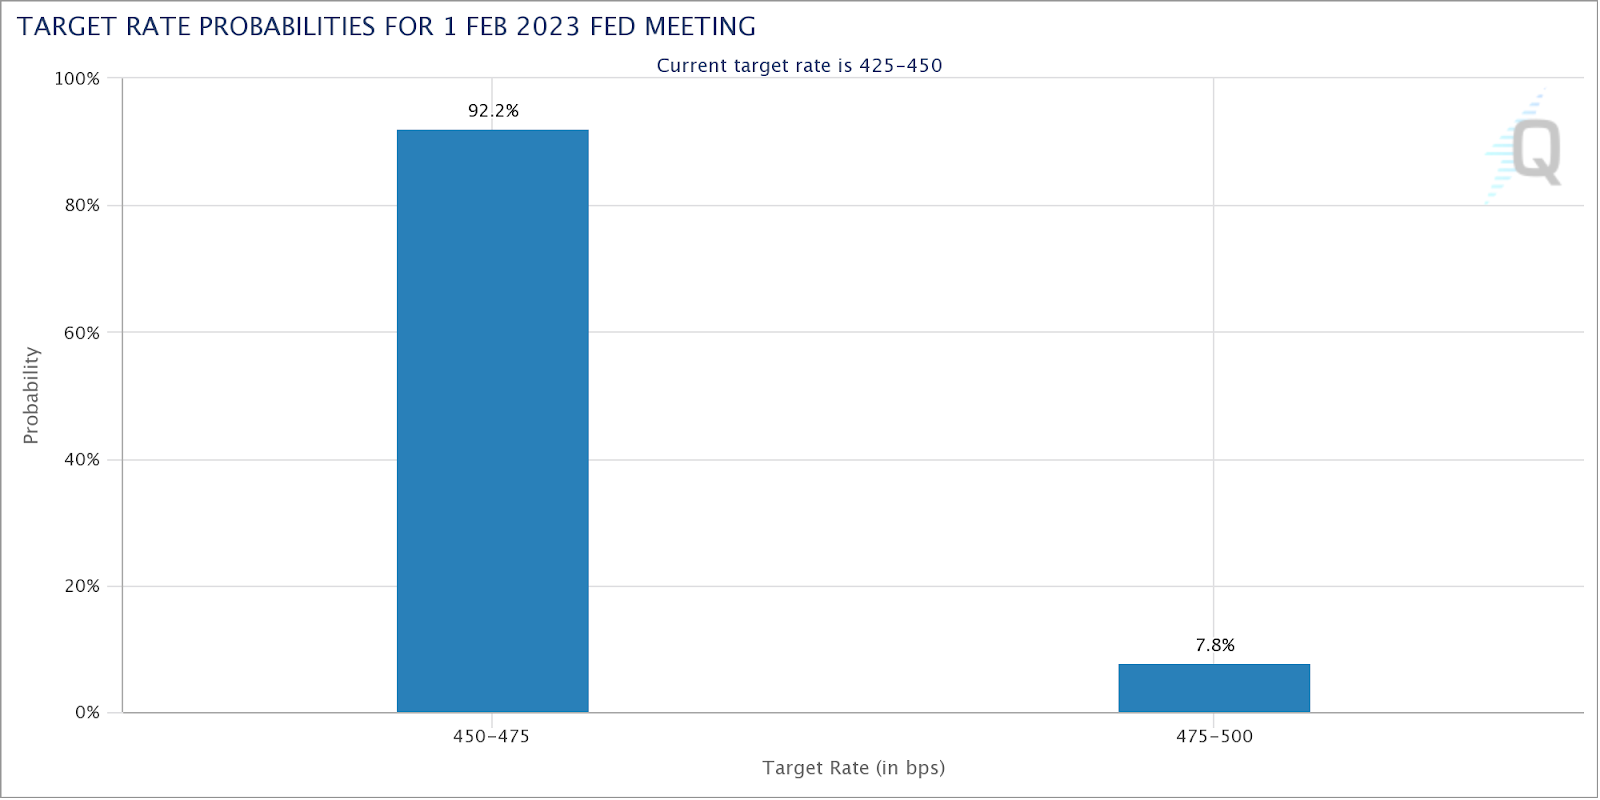
“Prices are beginning to behavemore as central bankers would wish,” paving the way to a downshift in tightening, as is priced by the markets. Using the CME Group Inc’s (NASDAQ: CME) FedWatch Tool, traders were split, and the odds of a 25 or 50 basis point hike were more even prior to CPI.
The odds are now skewed toward a 25 basis point hike.
Graphic: Retrieved from CME Group Inc’s (NASDAQ: CME) FedWatch Tool. Depending on the measure, rates are seen peaking between 4.9% and 5.10%.
Despite the odds of a less aggressive hike – yields falling and swaps suggesting the Fed could skip a hike in March – and the impact that has on valuing businesses (e.g., firm profits worth less at higher interest rates hence the de-rate of 2022), the data suggests that “inflation spikes have never been vanquished until the federal funds rate exceeds the inflation rate,” and, with the return in deflation, Steno Larsen said, the outlook for stocks remains poor.
“Remember that the PPI (and the CPI for that matter) is a leading indicator for EPS.” Consequently, “we are in for negative EPS.”
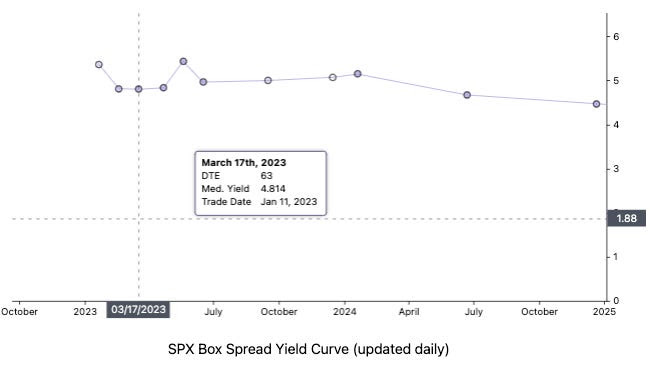
If you’re not an active trader and unable to participate in both the up- and down-side of markets, then you may capitalize on higher interest rates with Treasury bills or Box Spreads, which allow you to create loan structures similar to a Treasury bill. Upon the spread’s maturity, it settles and earns a competitive interest rate.
If you’re an active trader, as I said to one subscriber privately, “the more depressed technology names to the upside for debits [were] attractive” (i.e., buying call option structures in the likes of Tesla and Amazon).
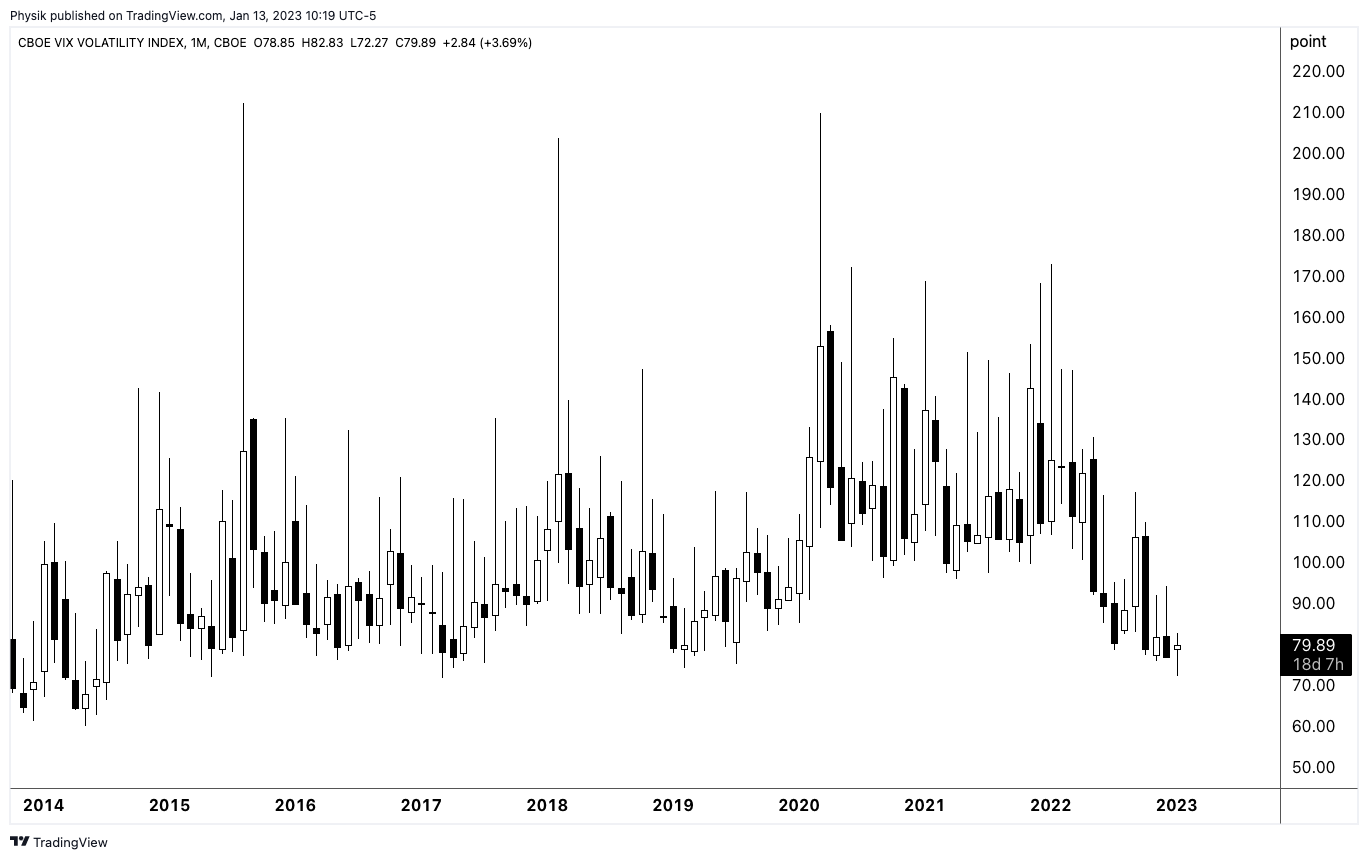
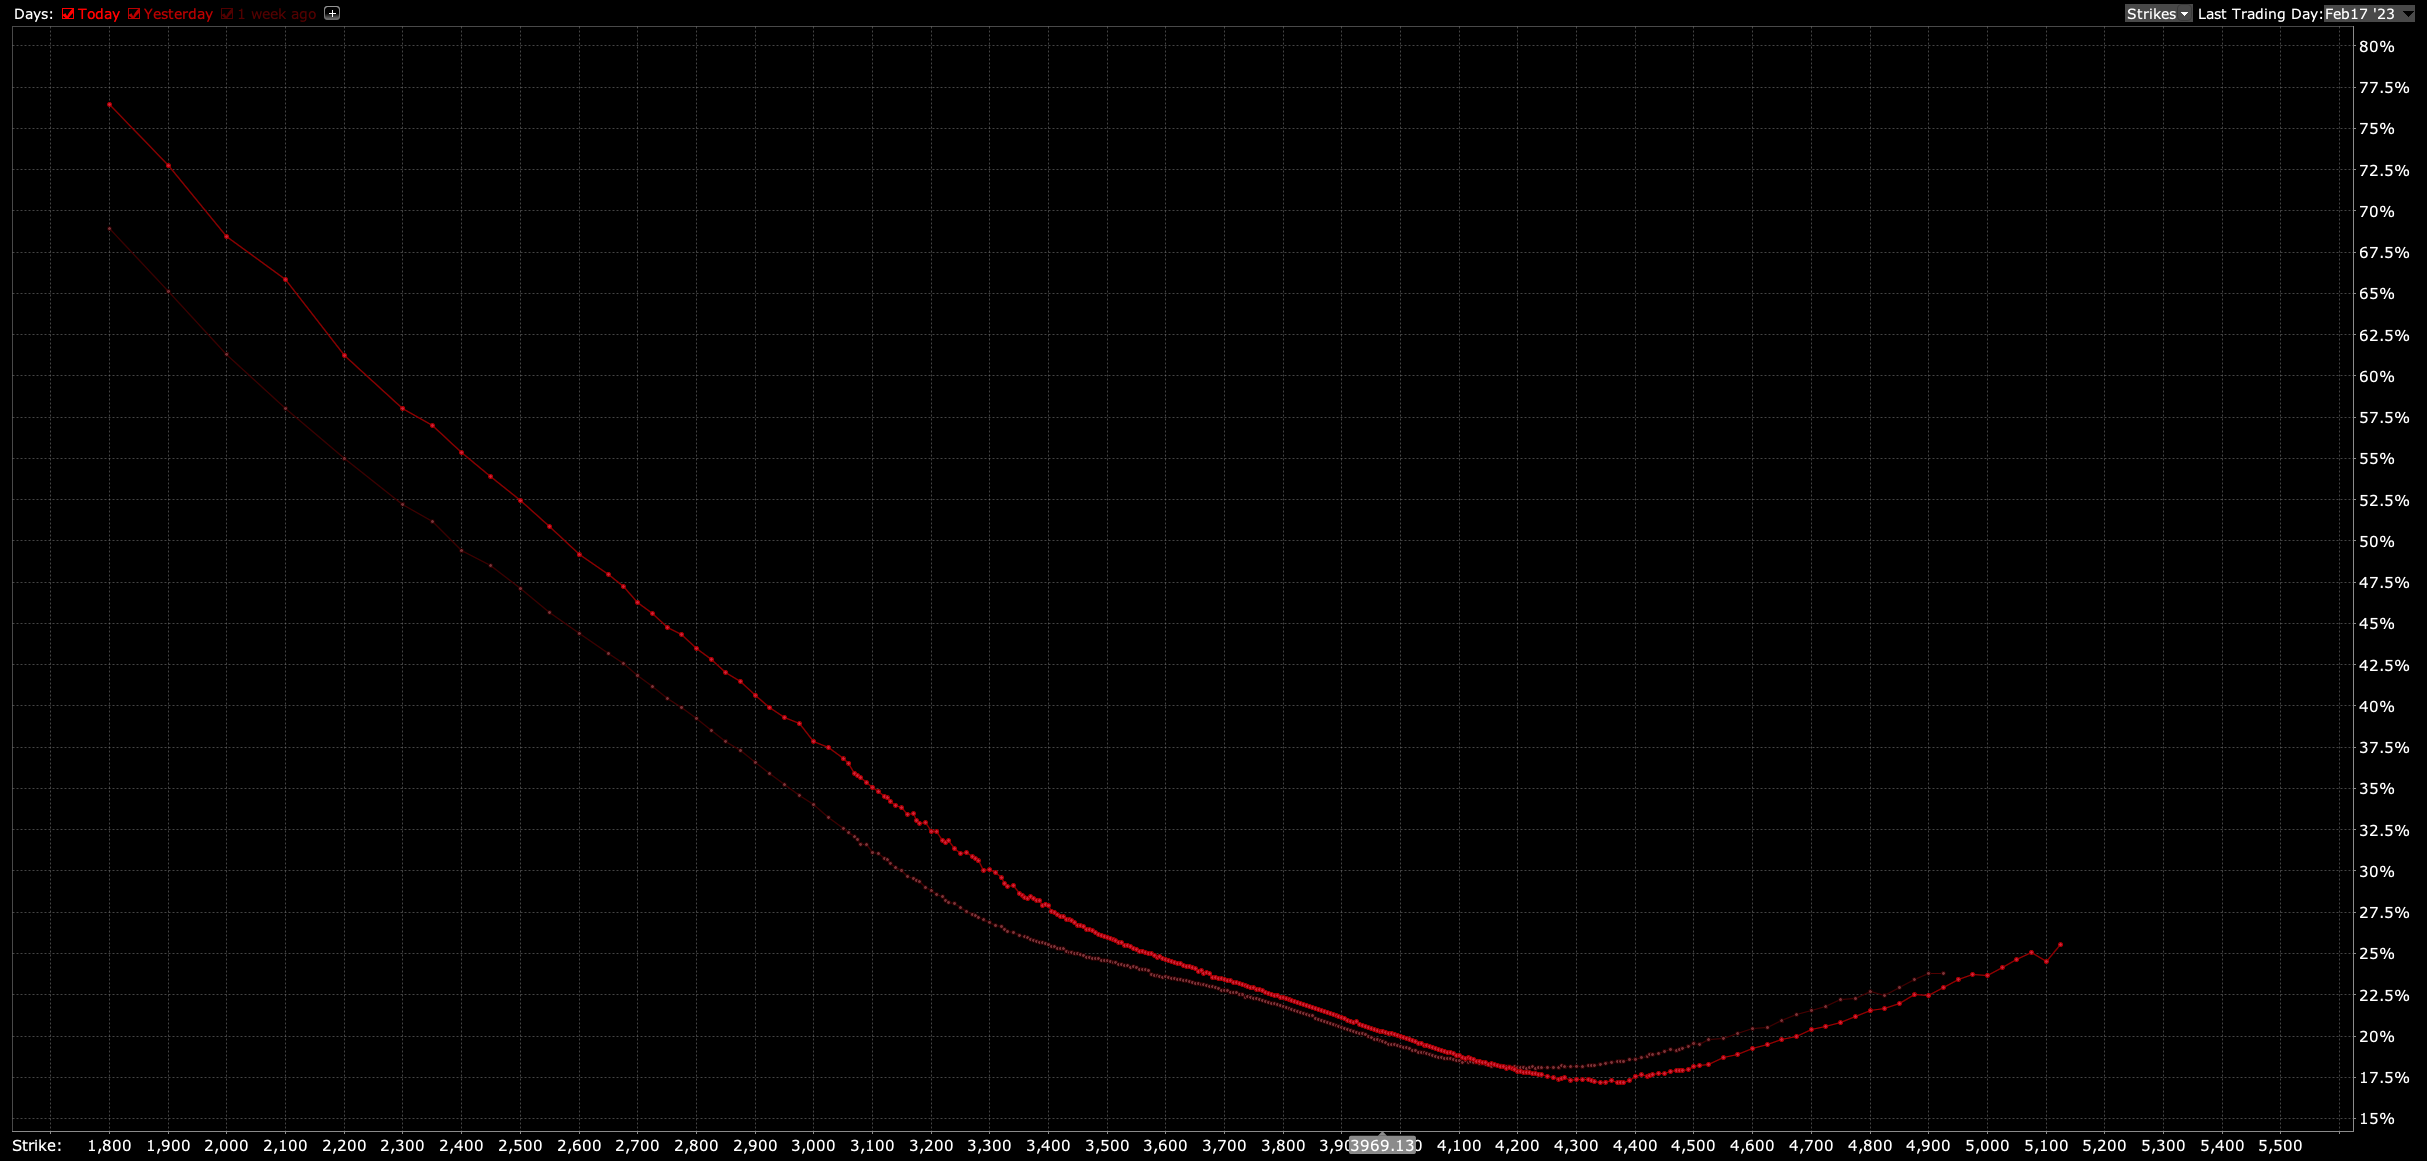
This is while put structures you may monetize in case of a large repricing in volatility have kept their values well amid what appears to be a shift higher in the skew; in the past days, we talked about measures including the Cboe VIX Volatility (INDEX: VVIX) printing at historic levels.
Graphic: Updated January 12, 2023. S&P 500 (INDEX: SPX) volatility skew retrieved from Interactive Brokers Group Inc’s (NASDAQ: IBKR) Trader Workstation.
Measures like the VVIX suggests “we can get cheap exposure to convexity while a lot of people are worried,” as The Ambrus Group’s Kris Sidial said in one article. Though volatility can be bimodal (i.e., stay low for longer for lack of better phrasing), from a “risk-to-reward perspective, … it’s a better bet to be on the long volatility side,” given “that there are so many things that … keep popping up” from a macro perspective.
Graphic: Cboe VIX Volatility (INDEX: VVIX) via TradingView.
Technical
As of 7:00 AM ET, Friday’s regular session (9:30 AM – 4:00 PM ET), in the S&P 500, is likely to open in the lower part of a negatively skewed overnight inventory, inside of prior-range and -value, suggesting a limited potential for immediate directional opportunity.
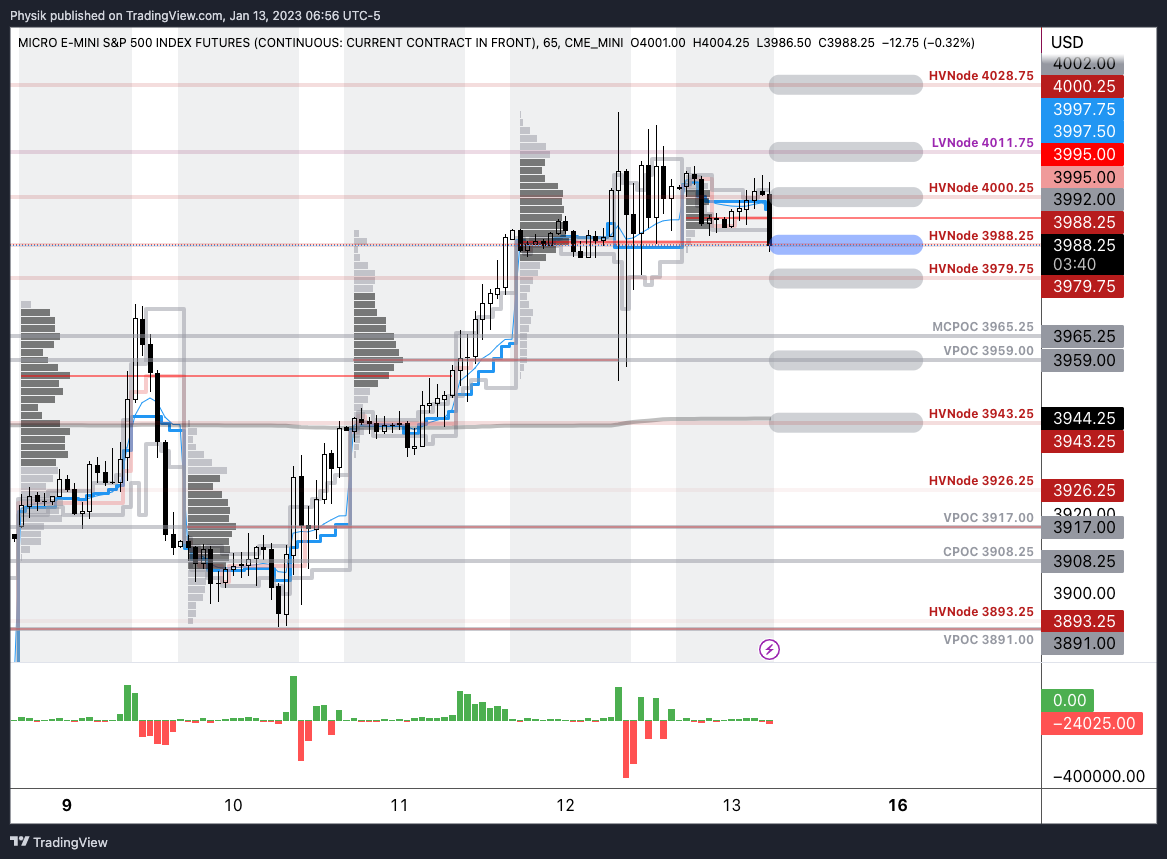
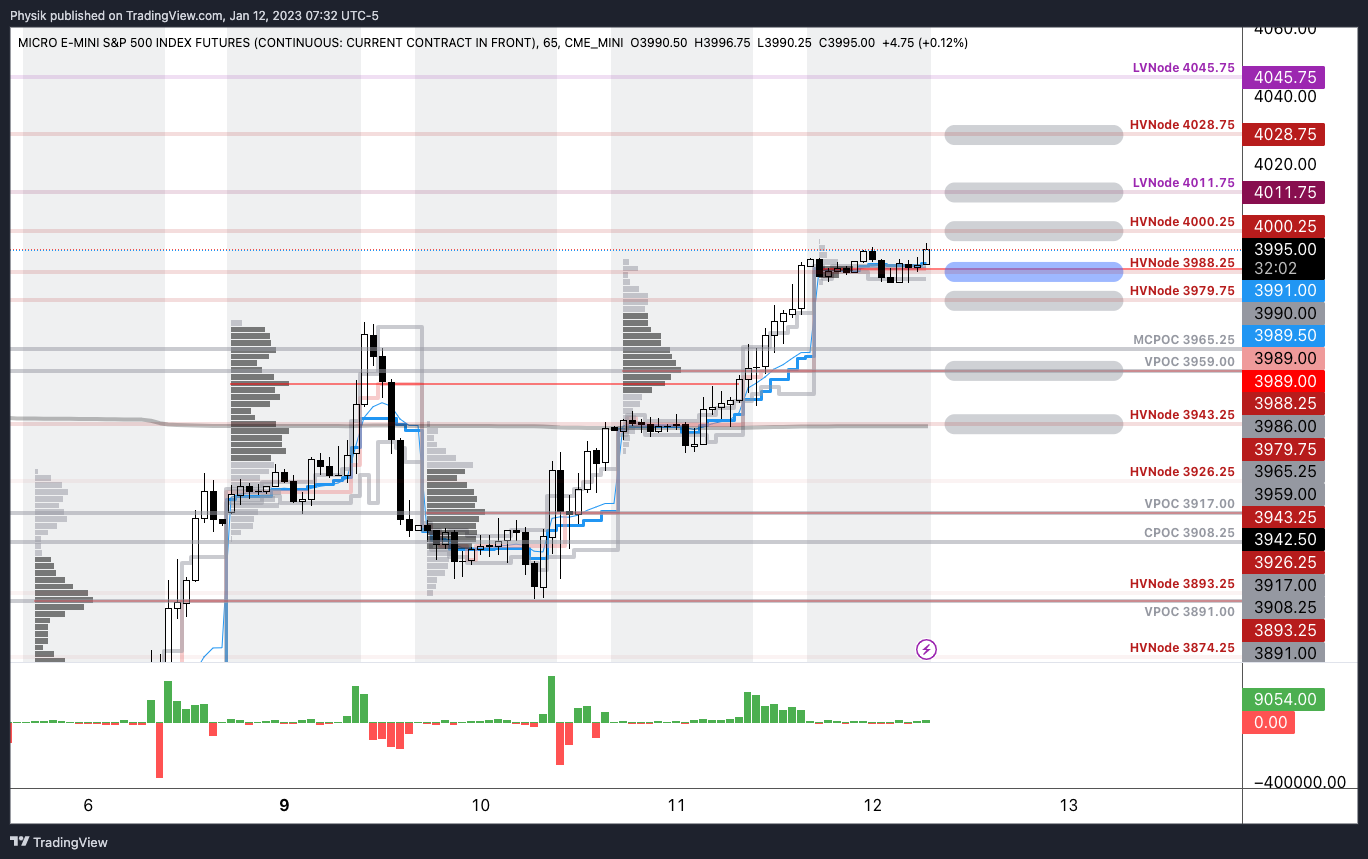
Our S&P 500 pivot for today is $3,988.25 HVNode.
Key levels to the upside include $4,000.25, $4,011.75, and $4,028.75.
Key levels to the downside include $3,979.75, $3,959.00, and $3,943.25.
Click here to load today’s key levels into the web-based TradingView platform. All levels are derived using the 65-minute timeframe. New links are produced, daily.
As a disclaimer, the S&P 500 could trade beyond the levels quoted in the letter. Therefore, you should load the above link on your browser for more relevant levels.
Graphic: 65-minute profile chart of the Micro E-mini S&P 500 Futures.
Definitions
Volume Areas: Markets will build on areas of high-volume (HVNodes). Should the market trend for long periods of time, it will be identified by low-volume areas (LVNodes). LVNodes denote directional conviction and ought to offer support on any test.
If participants auction and find acceptance in an area of a prior LVNode, then future discovery ought to be volatile and quick as participants look to HVNodes for favorable entry or exit.
POCs: Denote areas where two-sided trade was most prevalent in a prior day session. Participants will respond to future tests of value as they offer favorable entry and exit.
MCPOCs: Denote areas where two-sided trade was most prevalent over numerous sessions. Participants will respond to future tests of value as they offer favorable entry and exit.
About
In short, an economics graduate working in finance and journalism.
Capelj spends most of his time as the founder of Physik Invest through which he invests and publishes daily analyses to subscribers, some of whom represent well-known institutions.
Separately, Capelj is an equity options analyst at SpotGamma and an accredited journalist interviewing global leaders in business, government, and finance.
Physik Invest’s Daily Brief is read by thousands of subscribers. You, too, can join this community to learn about the fundamental and technical drivers of markets.
Graphic updated 8:45 AM ET. Sentiment Neutral if expected /ES open is inside of the prior day’s range. /ES levels are derived from the profile graphic at the bottom of this letter. Levels may have changed since initially quoted; click here for the latest levels. SqueezeMetrics Dark Pool Index (DIX) and Gamma (GEX) with the latter calculated based on where the prior day’s reading falls with respect to the MAX and MIN of all occurrences available. A higher DIX is bullish. At the same time, the lower the GEX, the more (expected) volatility. Click to learn the implications of volatility, direction, and moneyness. Breadth reflects a reading of the prior day’s NYSE Advance/Decline indicator. The CBOE VIX Volatility Index (INDEX: VVIX) measure reflects the total attractiveness of owning volatility.
Administrative
A quick letter today, apologies.
Given the large, post-CPI movement, the above dashboard may be out of date!
Separately, your letter writer will be heading to Davos, Switzerland during next week’s World Economic Forum. Let me know if you’ll be in town. Take care!
Fundamental
Today, market participants received data that appears in line with estimates.
Expected was a 6.5% rise year-over-year (YoY) and a 0.1% fall month-over-month (MoM). These numbers were +7.1% and +0.1% the release prior.
Mattering most is core inflation, which the Fed has more control over. The expectation was that core CPI rose 5.7% YoY and 0.3% MoM. In the release prior, these numbers were 6.0% and 0.2%, respectively.
Overall, the view that inflation is trending in the right direction is supported.
We often unpack the implications, but we will save that for a coming analysis.
Positioning
We saw meaningful outperformance in realized volatility (RVOL). This was, in part, a result of increased demand for short-dated exposures to movements (i.e., gamma), as well as a supply of farther-dated volatility (i.e., +gamma worked, +vega did not).
The trends, as your letter writer explained in recent write-ups, and in a Benzinga article, may eventually exhaust; measures like the VVIX, which is the volatility of the VIX or the volatility of the S&P 500’s volatility, are printing at levels seen in 2017.
According to Kai Volatility’s Cem Karsan, markets are in a transition period and what’s worked in 2022 may not work as well in 2023; trades are becoming crowded and S&P 500 volatility skews have hit a lower bound of sorts. That was echoed by The Ambrus Group’s Kris Sidial who said that “we can get cheap exposure to convexity while a lot of people are worried.”
Since the start of the year, the skew shifted meaningfully higher while the S&P 500 and VIX have moved higher in sync, as well. Some, like SpotGamma, have their own explanation (e.g., the fear of missing out on a move higher results in call buying that bids volatility), expressing that this may be a trend that persists through events like Thursday’s consumer price update.
This letter’s takeaway is as follows. Markets can experience more of the same. As history has shown, the right trade may turn out to be short volatility across longer time horizons, and long/own volatility across shorter time horizons, for longer (i.e., current trends promoting realized volatility outperformance may persist longer).
However, should current trends persist, the market is likely to become far less well-hedged, as Karsan said in the video. If a catalyst arises, there may be a repricing in volatility which traders would not want to be on the wrong side of. Notwithstanding, as Sidial says, “[if] you’re trading volatility, let there be an underlying catalyst for doing so.” Don’t just buy it because it is cheap, or sell it because it is expensive.
We’ll go through the charts and implications in far more detail over the coming sessions. Your letter writer is stretched for time this morning. Take care!
Technical
As of 7:30 AM ET, Thursday’s regular session (9:30 AM – 4:00 PM ET), in the S&P 500, is likely to open in the upper part of a positively skewed overnight inventory, outside of prior-range and -value, suggesting a potential for immediate directional opportunity.
Our S&P 500 pivot for today is $3,988.25 HVNode.
Key levels to the upside include $4,000.25, $4,011.75, and $4,028.75.
Key levels to the downside include $3,979.75, $3,959.00, and $3,943.25.
Click here to load today’s key levels into the web-based TradingView platform. All levels are derived using the 65-minute timeframe. New links are produced, daily.
As a disclaimer, the S&P 500 could trade beyond the levels quoted in the letter. Therefore, you should load the above link on your browser for more relevant levels.
Graphic: 65-minute profile chart of the Micro E-mini S&P 500 Futures.
Definitions
Volume Areas: Markets will build on areas of high-volume (HVNodes). Should the market trend for long periods of time, it will be identified by low-volume areas (LVNodes). LVNodes denote directional conviction and ought to offer support on any test.
If participants auction and find acceptance in an area of a prior LVNode, then future discovery ought to be volatile and quick as participants look to HVNodes for favorable entry or exit.
POCs: Denote areas where two-sided trade was most prevalent in a prior day session. Participants will respond to future tests of value as they offer favorable entry and exit.
MCPOCs: Denote areas where two-sided trade was most prevalent over numerous sessions. Participants will respond to future tests of value as they offer favorable entry and exit.
About
In short, an economics graduate working in finance and journalism.
Capelj spends most of his time as the founder of Physik Invest through which he invests and publishes daily analyses to subscribers, some of whom represent well-known institutions.
Separately, Capelj is an equity options analyst at SpotGamma and an accredited journalist interviewing global leaders in business, government, and finance.
Physik Invest’s Daily Brief is read by thousands of subscribers. You, too, can join this community to learn about the fundamental and technical drivers of markets.
Graphic updated 7:50 AM ET. Sentiment Risk-On if expected /ES open is above the prior day’s range. /ES levels are derived from the profile graphic at the bottom of this letter. Levels may have changed since initially quoted; click here for the latest levels. SqueezeMetrics Dark Pool Index (DIX) and Gamma (GEX) with the latter calculated based on where the prior day’s reading falls with respect to the MAX and MIN of all occurrences available. A higher DIX is bullish. At the same time, the lower the GEX, the more (expected) volatility. Click to learn the implications of volatility, direction, and moneyness. Breadth reflects a reading of the prior day’s NYSE Advance/Decline indicator. The CBOE VIX Volatility Index (INDEX: VVIX) measure reflects the attractiveness of owning volatility. Green means that owning volatility is attractive.
Administrative
In last week’s letters, we discussed, mainly, fundamental and positioning contexts. Today’s letter will add to the discussion on the positioning.
Positioning
Last week, for an article published on Benzinga.com over the weekend, your letter writer spoke with The Ambrus Group’s co-chief investment officer Kris Sidial. Shared were the things to look out for in 2023 and tips for newer traders. The article can be viewed here, at this link.
In short, there are four big takeaways.
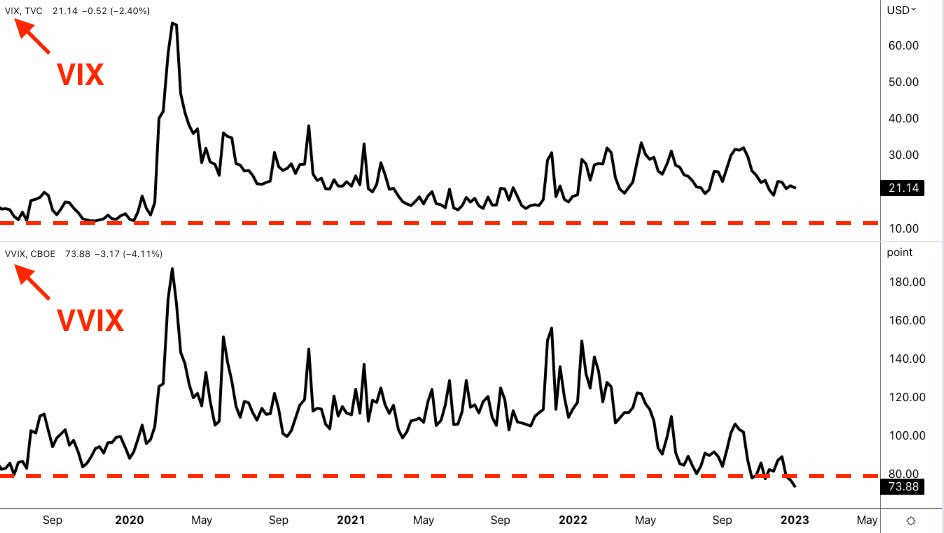
First, though options prices could stay under pressure, naive measures like the VVIX, which is the volatility of the VIX, or the volatility of the S&P 500’s volatility, are printing at levels last seen in 2017. This means “we can get cheap exposure to convexity while a lot of people are worried.”
Graphic: Retrieved from TradingView. Cboe Volatility Index (INDEX: VIX) is on the top. The volatility of the VIX itself (INDEX: VVIX) is at the bottom.
Second, on the other side of the growing S&P 500 and VIX complexes is a small concentrated group of market makers taking on far more exposure to risk.
Graphic: Retrieved from Ambrus’ publicly available research.
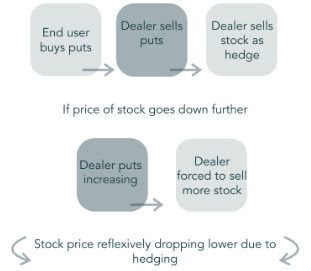
During moments of stress, these market makers may be “unable to keep up with the demands of frenetic investors,” Sidial said, pointing to GameStop Corporation (NYSE: GME) where “there was this reflexive dynamic” that helped push the stock higher in 2021.
“That same dynamic can happen on the way down”; market makers will mark up options prices during intense selling. As the options prices rise, options deltas (i.e., their exposure to direction) rise and this prompts so-called bearish vanna hedging flows.
Graphic: Retrieved from Ambrus’ publicly available research.
“Imagine a scenario where [some disaster happens] and everybody starts buying 0 DTE puts. That’s going to reflexively drive the S&P lower,” Sidial said. “Take, for example, the JPMorgan collar position that clearly has an effect on the market, and people are starting to understand that effect. That’s just one fund. Imagine the whole derivative ecosystem” leaning one way.
Graphic: Retrieved from Ambrus’ publicly available research.
The third is in reference to liquidity. As private market investors’ “deals are getting marked down, [t]o source liquidity, they may have to sell some of their holdings in the public equity markets.” Benn Eifert, the CIO at QVR Advisors, recently put forth that “late-stage technology is a great example where public comps are down 80-90% but privates marked down 20% or not at all. It is possible to imagine large institutions engaging in forced selling of liquid public equities to meet capital calls in private fund investments.”
And, lastly, investors often go “back and forth” and do not stick to a strict process. In trying to pick what will work at one specific time, investors can “miss what is going to work in the future.” Consequently, Sidial says investors should have an outlook and process to express that outlook. “It’s not as easy as saying: ‘Buy volatility because it’s cheap or sell it because it is expensive.’”
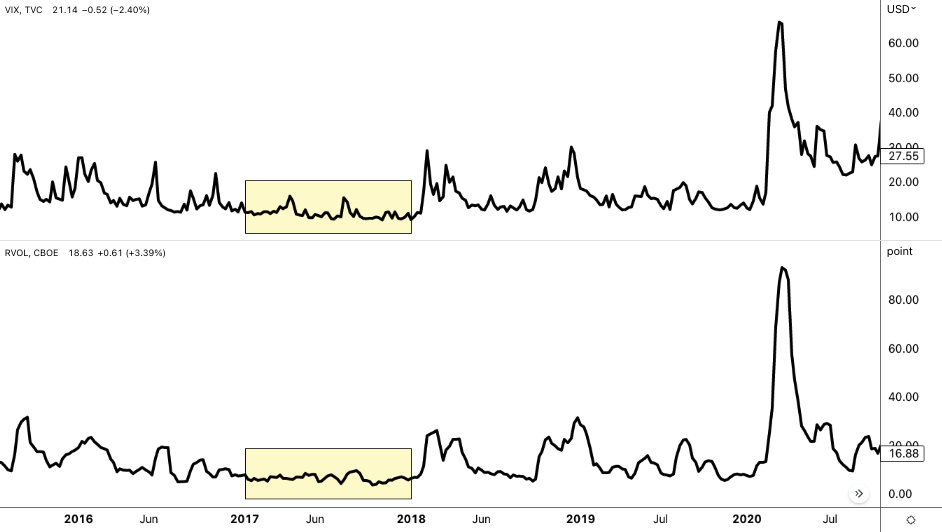
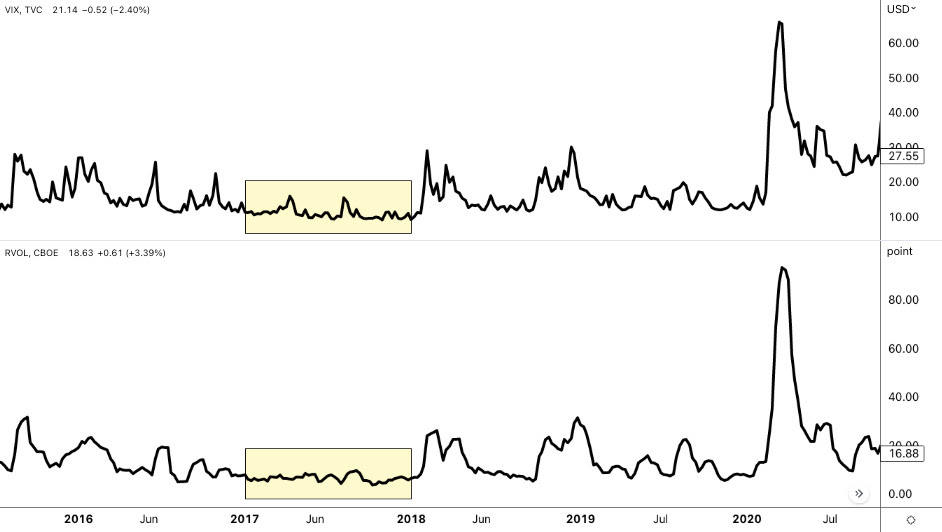
As a validation, in the Benzinga article, your letter writer wrote about 2017 when volatility was at some of its lowest levels. Back then, the correct trade was to sell volatility, in some cases, due to volatility’s bimodality; if you sold volatility back then, you made money due to its clustering.
Graphic: Retrieved from TradingView. Cboe Volatility Index (INDEX: VIX) is on the top. Cboe Realized Volatility (INDEX: RVOL) is at the bottom.
So, “if you’re trading volatility, let there be an underlying catalyst for doing so.” That said, from a “risk-to-reward perspective, … it’s a better bet to be on the long volatility side,” given “that there are so many things that … keep popping up” from a macro perspective.
For Ambrus’ publicly available research, click here. Also, follow Sidial on Twitter, here. Consider reading your letter writer’s past two conversations with Sidial, as well. Here is an article on 2021 and the meme stock debacle. Here is another article talking more about Ambrus’ processes.
Technical
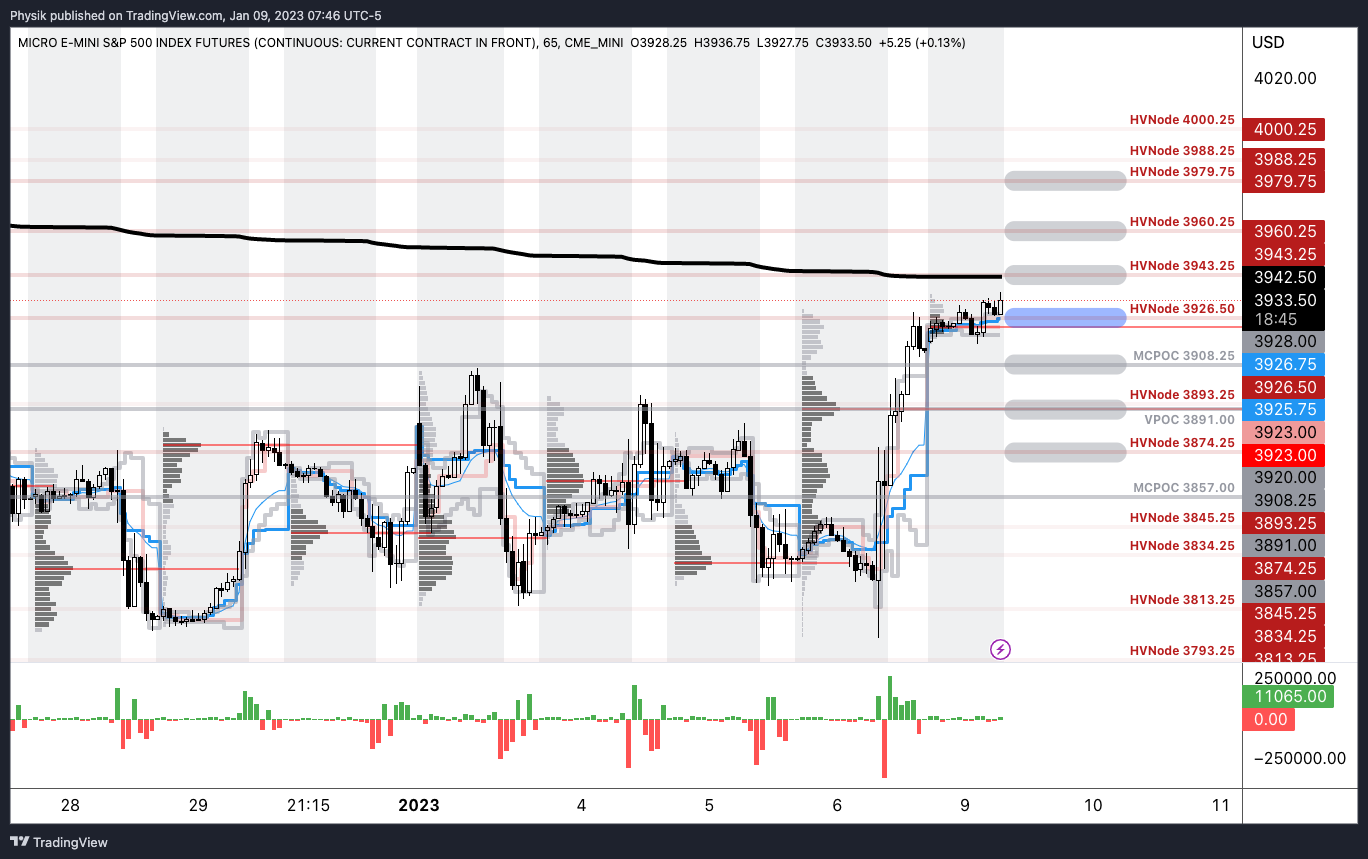
As of 7:50 AM ET, Monday’s regular session (9:30 AM – 4:00 PM ET), in the S&P 500, is likely to open in the upper part of a positively skewed overnight inventory, outside of prior-range and -value, suggesting a potential for immediate directional opportunity.
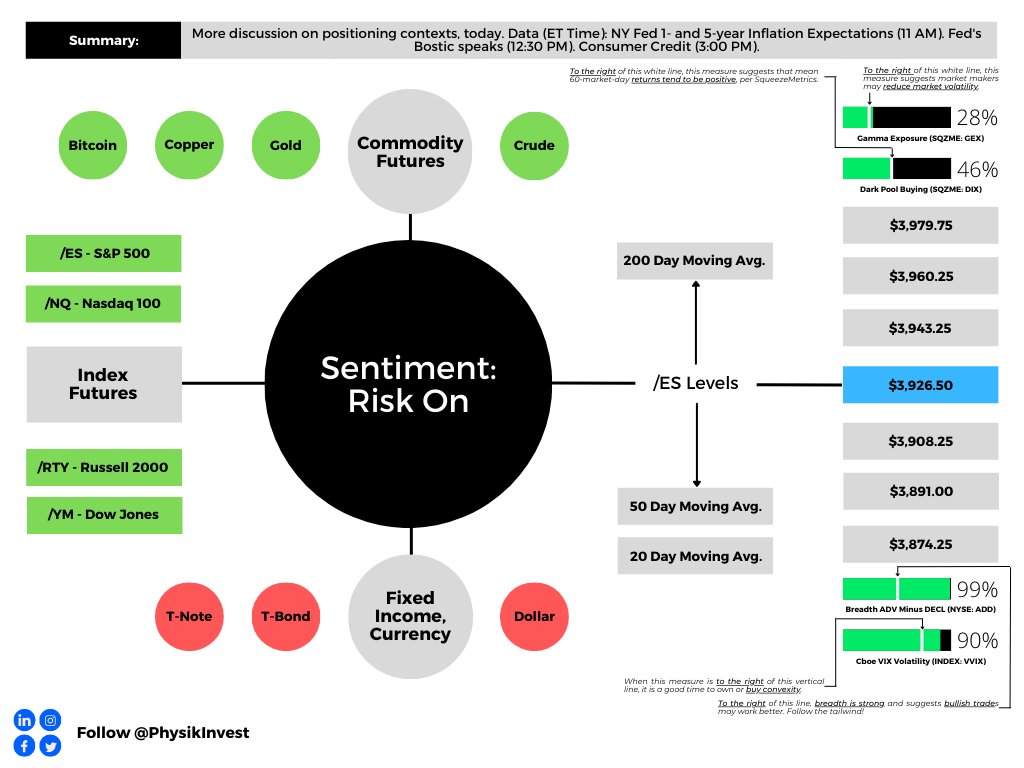
Our S&P 500 pivot for today is $3,926.50.
Key levels to the upside include $3,943.25, $3,960.25, and $3,979.75.
Key levels to the downside include $3,908.25, $3,891.00, and $3,874.25.
Click here to load today’s key levels into the web-based TradingView platform. All levels are derived using the 65-minute timeframe. New links are produced, daily.
As a disclaimer, note the S&P 500 could trade beyond the levels quoted in the letter. Therefore, you should load the key levels on your browser.
Graphic: 65-minute profile chart of the Micro E-mini S&P 500 Futures.
Definitions
Volume Areas: Markets will build on areas of high-volume (HVNodes). Should the market trend for long periods of time, it will be identified by low-volume areas (LVNodes). LVNodes denote directional conviction and ought to offer support on any test.
If participants auction and find acceptance in an area of a prior LVNode, then future discovery ought to be volatile and quick as participants look to HVNodes for favorable entry or exit.
Vanna: The rate at which the Delta of an option changes with respect to implied volatility.
POCs: Denote areas where two-sided trade was most prevalent in a prior day session. Participants will respond to future tests of value as they offer favorable entry and exit.
MCPOCs: Denote areas where two-sided trade was most prevalent over numerous sessions. Participants will respond to future tests of value as they offer favorable entry and exit.
About
In short, an economics graduate working in finance and journalism.
Capelj spends most of his time as the founder of Physik Invest through which he invests and publishes daily analyses to subscribers, some of whom represent well-known institutions.
Separately, Capelj is an equity options analyst at SpotGamma and an accredited journalist interviewing global leaders in business, government, and finance.
Physik Invest’s Daily Brief is read by thousands of subscribers. You, too, can join this community to learn about the fundamental and technical drivers of markets.
Graphic updated 8:30 AM ET. Sentiment Neutral if expected /ES open is inside of the prior day’s range. /ES levels are derived from the profile graphic at the bottom of this letter. Levels may have changed since initially quoted; click here for the latest levels. SqueezeMetrics Dark Pool Index (DIX) and Gamma (GEX) with the latter calculated based on where the prior day’s reading falls with respect to the MAX and MIN of all occurrences available. A higher DIX is bullish. At the same time, the lower the GEX, the more (expected) volatility. Click to learn the implications of volatility, direction, and moneyness. Breadth reflects a reading of the prior day’s NYSE Advance/Decline indicator. VIX reflects a current reading of the CBOE Volatility Index (INDEX: VIX) from 0-100.
Administrative
Hey team, hope you had a great week! Please consider reading our letters for January 3 and 4. In those letters, we discussed the potential drivers of long-lasting inflation that may not be good for traditional portfolio constructions like 60/40.
In today’s letter, we talk about some positioning contexts, leaning into this letter writer’s interview with The Ambrus Group’s Kris Sidial for a Benzinga article to be published either this weekend or next week.
This letter will serve as a primer. Next week, we will go into further depth. Have a great weekend!
Positioning
In a conversation with your letter writer prior to 2022, and on YouTube, Sidial and some other Ambrus members said markets were increasingly fragile and traditional portfolio constructions such as 60/40 (i.e., 60% of holdings held in stocks and 40% of the holdings held in bonds) would not perform as well as history would imply.
Instead, options (colloquially referred to as volatility) may “potentially outperform the market” and limit losses.
Pursuant to Ambrus’ warnings, 60/40 logged one of its worst stretches as inflation and interest rates rose. On the other hand, Ambrus, which is a volatility arbitrage fund, managed to end the year unscathed.
“That does not mean all volatility funds ended the same way,” Sidial said in a nod to his team’s unique approach to leveraging options’ multi-dimensionality in reducing the cost of protection they own for investors.
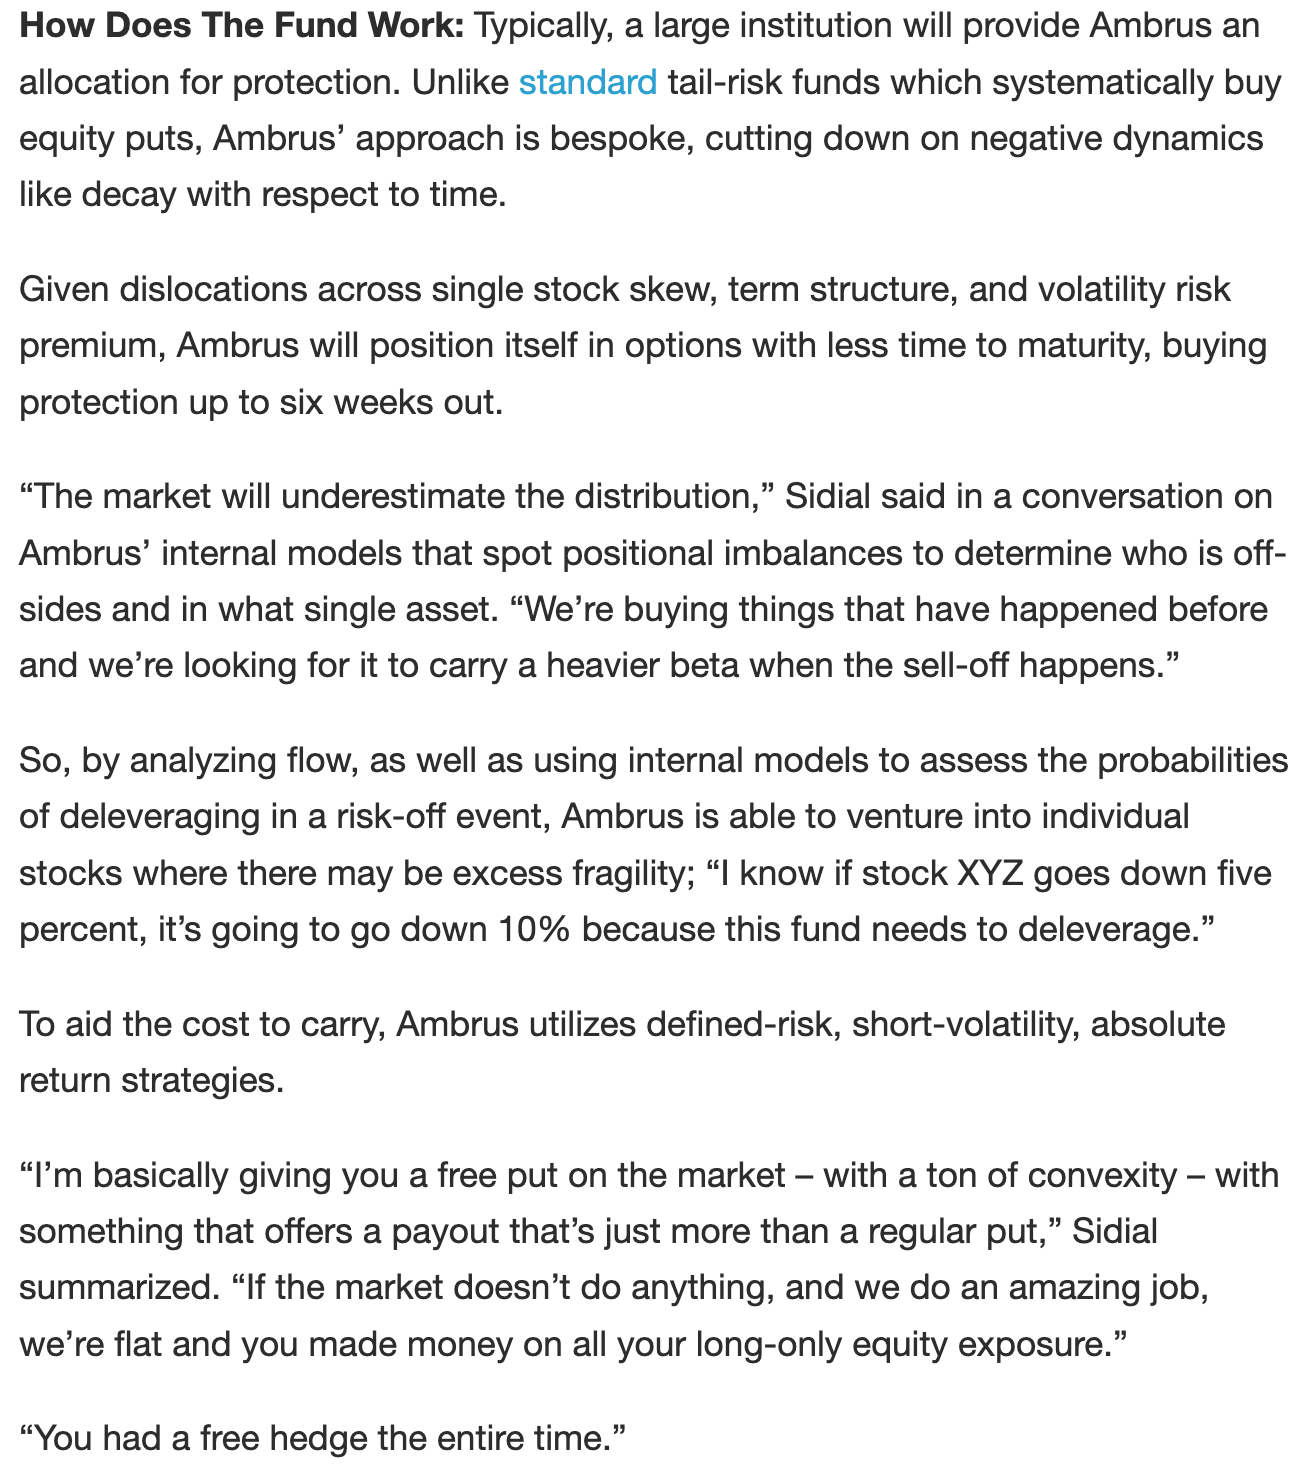
Here’s more on Ambrus’ approach from a previous conversation your letter writer had with Sidial for a Benzinga article.
This approach is limiting, though, Sidial notes. Increasing assets under management can eat into the firm’s own alpha.
Anyways, Sidial went on to discuss the performance of volatility in 2022 and its potential to outperform in 2023 and beyond.
“It caught everybody by surprise that long volatility underperformed,” he said in reference to a high spot-vol beta (i.e., volatility’s sensitivity to underlying prices) in 2021 suggesting volatility was likely to come to life in 2022, and “there would be more follow-through.”
However, there was no follow-through, and Sidial believes this was the result of allocations to commodity trading advisors or CTAs, and the “consensus trade,” or the sales of volatility on expectations markets would grind and chop lower for the entirety of 2022.
As this letter has put forth in the past, traders proactively hedged heading into 2022. The unwind or supply of some of these hedges, coupled with investors’ expectation markets would continue to grind far lower, prompted more volatility sales (a pressure on options prices), masked by the persistently high, albeit tame Cboe Volatility Index (INDEX: VIX) and metrics like the put-to-call ratio appearing inflated, potentially the result of stock loan desks replacing short stock with in-the-money puts given high-interest rates.
Though the price of volatility could move toward the extremes (i.e., clustering/mean-reverting), trends may be near exhaustion.
Naive measures like the VVIX, which is the volatility of the VIX (i.e., the volatility of the S&P 500 volatility), are printing at levels last seen in 2017. This suggests “we can get cheap exposure to convexity while a lot of people are worried.”
Therefore, “even if inflation continues, the rate at which inflation rises won’t be the same. Due to this, CTA exposures likely will not perform as well as they did in 2022, and that’s why you may see more opportunities in the volatility space.”
Moving on, though not catalysts or reasons for Ambrus to initiate trades per se, risks Sidial said could result in volatility performing well include the concentration of market makers and private markets’ sourcing of liquidity (or raising cash) through sales of public equity markets.
“During moments of market stress, the market makers are unable to keep up with the demands of frenetic investors. If you think of GameStop Corp (NYSE: GME), which we talked about before, there was this reflexive dynamic that happened when investors rushed into the stock one way.”
“That same dynamic can happen on the way down”; market makers mark up volatility during stress which can pressure markets. As the price of volatility rises, option deltas rise and this prompts bearish vanna hedging flows, as they are called.
Your letter writer will pause the commentary at this point while he further unpacks his discussion with Sidial, but at least you got a sneak peek ahead of next week’s article release. Take care!
Technical
As of 8:30 AM ET, Friday’s regular session (9:30 AM – 4:00 PM ET), in the S&P 500, is likely to open in the middle part of a balanced overnight inventory, inside of prior-range and -value, suggesting a limited potential for immediate directional opportunity.
Our S&P 500 pivot for today is $3,834.25.
Key levels to the upside include $3,845.25, $3,857.00, and $3,867.75.
Key levels to the downside include $3,813.25, $3,793.25, and $3,776.75.
Click here to load today’s key levels into the web-based TradingView platform. All levels are derived using the 65-minute timeframe. New links are produced, daily.
Note that early morning news may result in quoted levels not performing well. Please make sure to use the link to view the real-time chart for more levels that may be in play.
Graphic: 65-minute profile chart of the Micro E-mini S&P 500 Futures.
Definitions
Volume Areas: Markets will build on areas of high-volume (HVNodes). Should the market trend for long periods of time, it will be identified by low-volume areas (LVNodes). LVNodes denote directional conviction and ought to offer support on any test.
If participants auction and find acceptance in an area of a prior LVNode, then future discovery ought to be volatile and quick as participants look to HVNodes for favorable entry or exit.
MCPOCs: Denote areas where two-sided trade was most prevalent over numerous sessions. Participants will respond to future tests of value as they offer favorable entry and exit.
About
In short, an economics graduate working in finance and journalism.
Capelj spends most of his time as the founder of Physik Invest through which he invests and publishes daily analyses to subscribers, some of whom represent well-known institutions.
Separately, Capelj is an equity options analyst at SpotGamma and an accredited journalist interviewing global leaders in business, government, and finance.
Physik Invest’s Daily Brief is read by over 1,200 people. To join this community and learn about the fundamental and technical drivers of markets, subscribe below.
Graphic updated 6:45 AM ET. Sentiment Risk-On if expected /ES open is above the prior day’s range. /ES levels are derived from the profile graphic at the bottom of this letter. Levels may have changed since initially quoted; click here for the latest levels. SqueezeMetrics Dark Pool Index (DIX) and Gamma (GEX) with the latter calculated based on where the prior day’s reading falls with respect to the MAX and MIN of all occurrences available. A higher DIX is bullish. At the same time, the lower the GEX, the more (expected) volatility. Click to learn the implications of volatility, direction, and moneyness. Breadth reflects a reading of the prior day’s NYSE Advance/Decline indicator. VIX reflects a current reading of the CBOE Volatility Index (INDEX: VIX) from 0-100.
Team, it’s been insane on my end. Physik Invest’s Daily Brief will be paused through the end of this week (November 24 and 25). Wishing you happy holidays!
Hopefully, clearer notes and consistent releases to resume, after the break.
Crypto Turmoil Persists:
The FTX (CRYPTO: FTT) debacle has induced even more illiquidity.
Bloomberg’s Matt Levine wrote that the fall in liquidity “has been dubbed the ‘Alameda Gap,’” noting that “[p]lunges in liquidity usually come during periods of volatility as trading shops pull bids and asks from their order books.”
Turmoil and Opportunity:
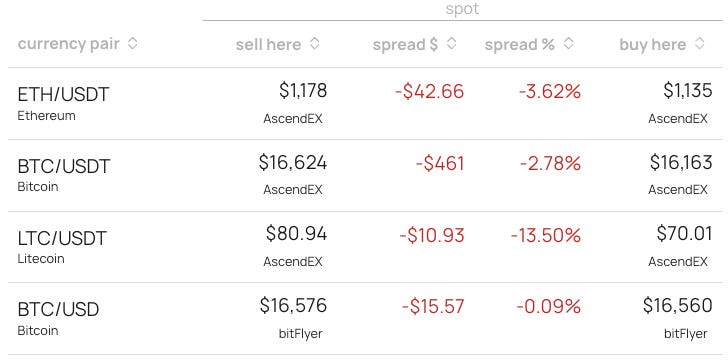
You may take advantage of the aforementioned uncertainties through arbitrage (i.e., buy at a lower price at one venue and sell at a higher price at another venue). Notice the ~$500 spread on BTC/USDT, for instance.
Graphic: Retrieved from Shift Search at 6:53 AM ET on November 23, 2022.
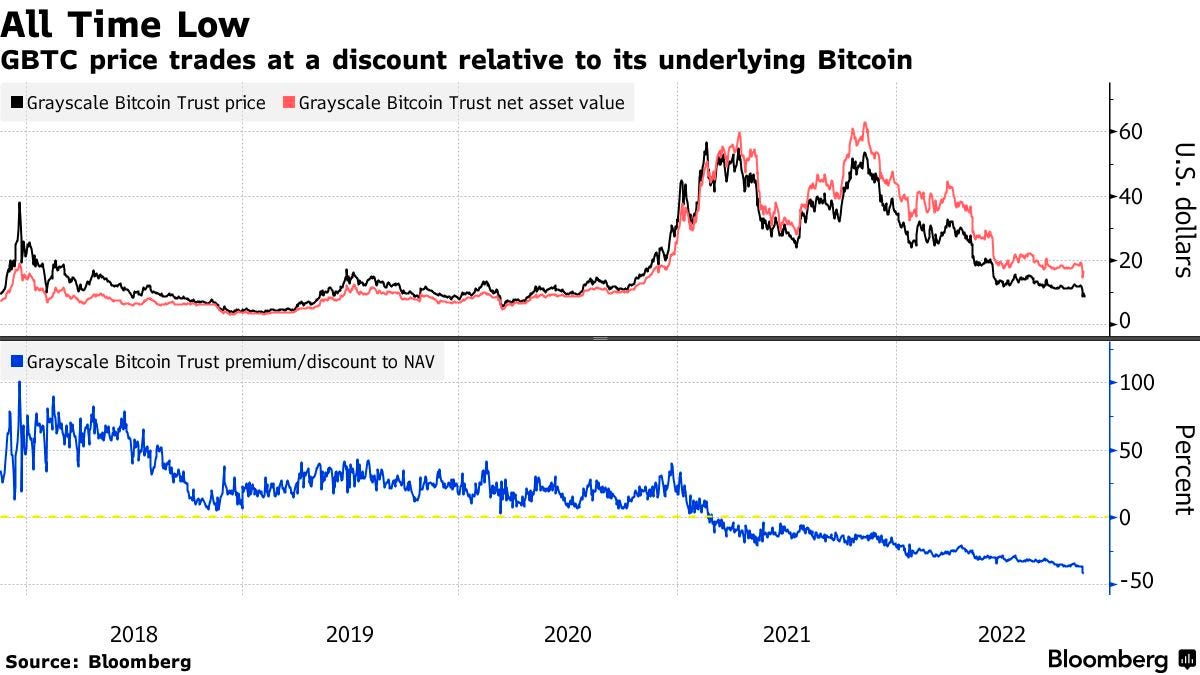
Elsewhere, the Grayscale Bitcoin Trust (OTC: GBTC) is trading at a ~43.00% discount to the value of the Bitcoin (CRYPTO: BTC) it holds.
Per Bloomberg, “US regulators have repeatedly denied applications to convert GBTC into a physically-backed exchange-traded fund,” and that means the fund is not “able to redeem shares to keep pace with shifting demand.”
To note, the discount pales in comparison to the 101.00% premium to the net-asset value achieved in December 2017. The average net-asset value is a 12.00% premium.
Anyways, in greater detail, we discussed the crypto turmoil on November 9 and 10. Those notes may be of interest if the context is desired. Though this is not a crypto-focused letter, crypto is “tied up in the liquidity bubble that exists across all assets.”
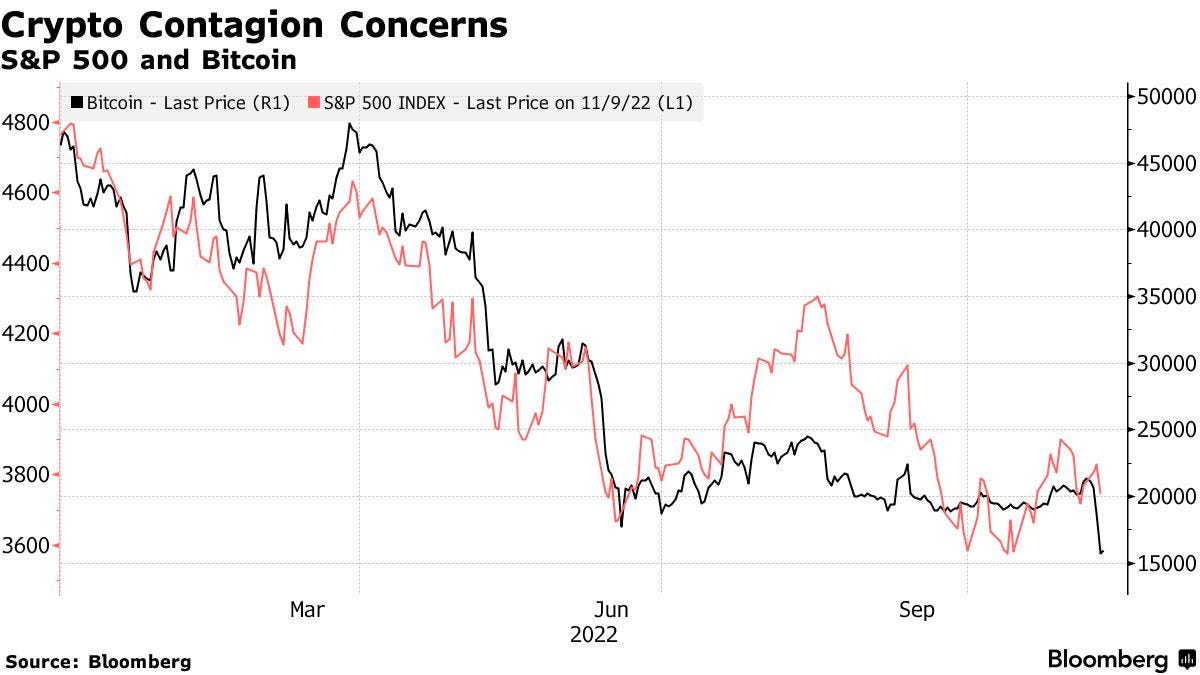
Graphic: Retrieved from Physik Invest’s Daily Brief posted on November 10, 2022.
As an example, during the week of November 8, when the narrative surrounding FTX’s demise was at its peak, the S&P 500 (INDEX: SPX), Bitcoin (CRYPTO: BTC), and FTX Trading token (CRYPTO: FTT) slid lower, bottomed, and rallied in sync.
Uncertainty, Correlation, and Positioning:
This is a part of the letter that may appear somewhat similar. We continue carrying forward and building on past analyses.
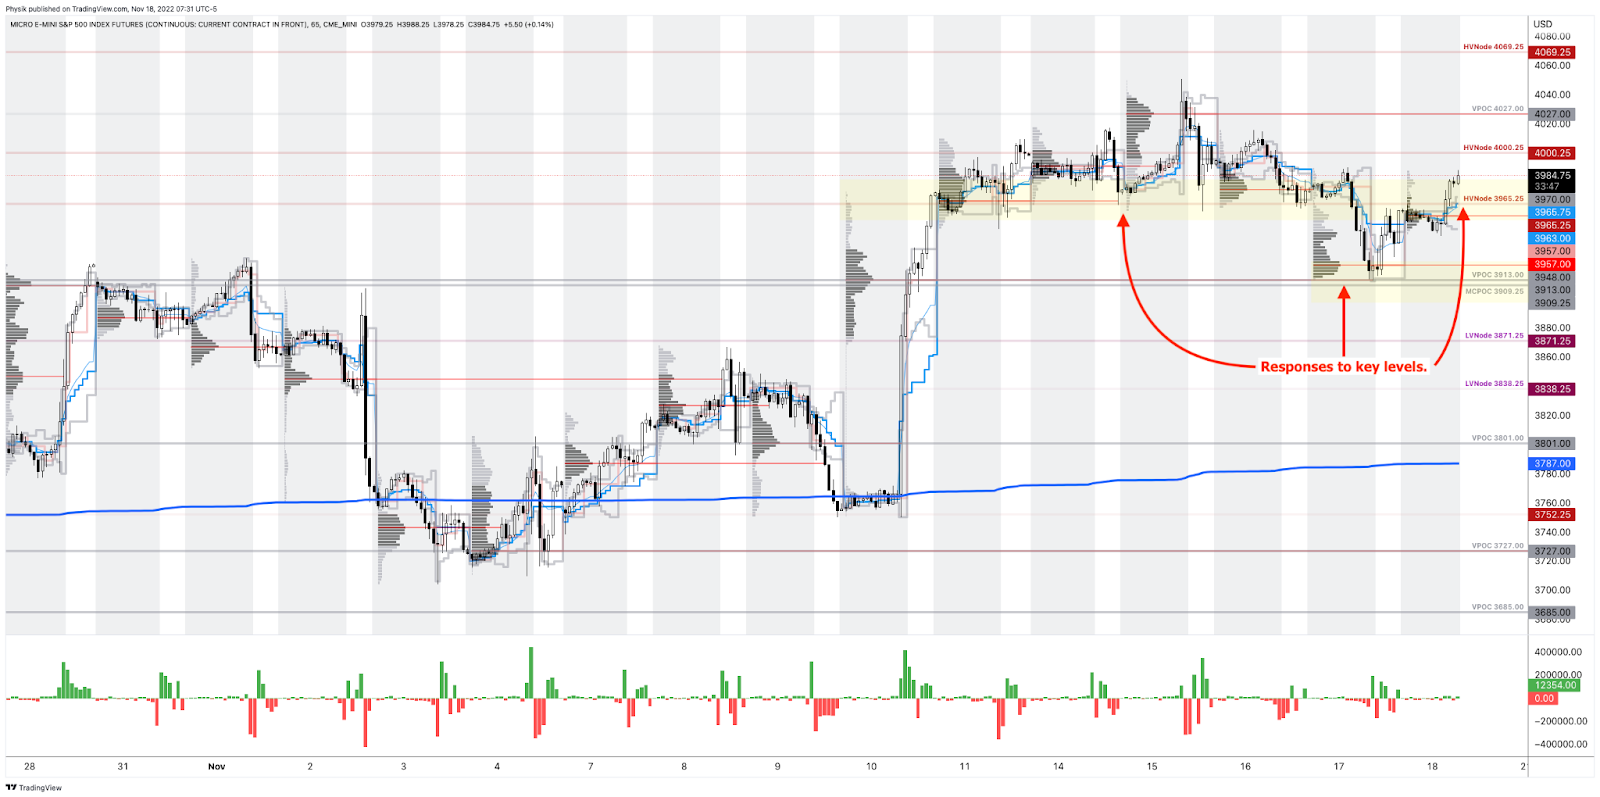
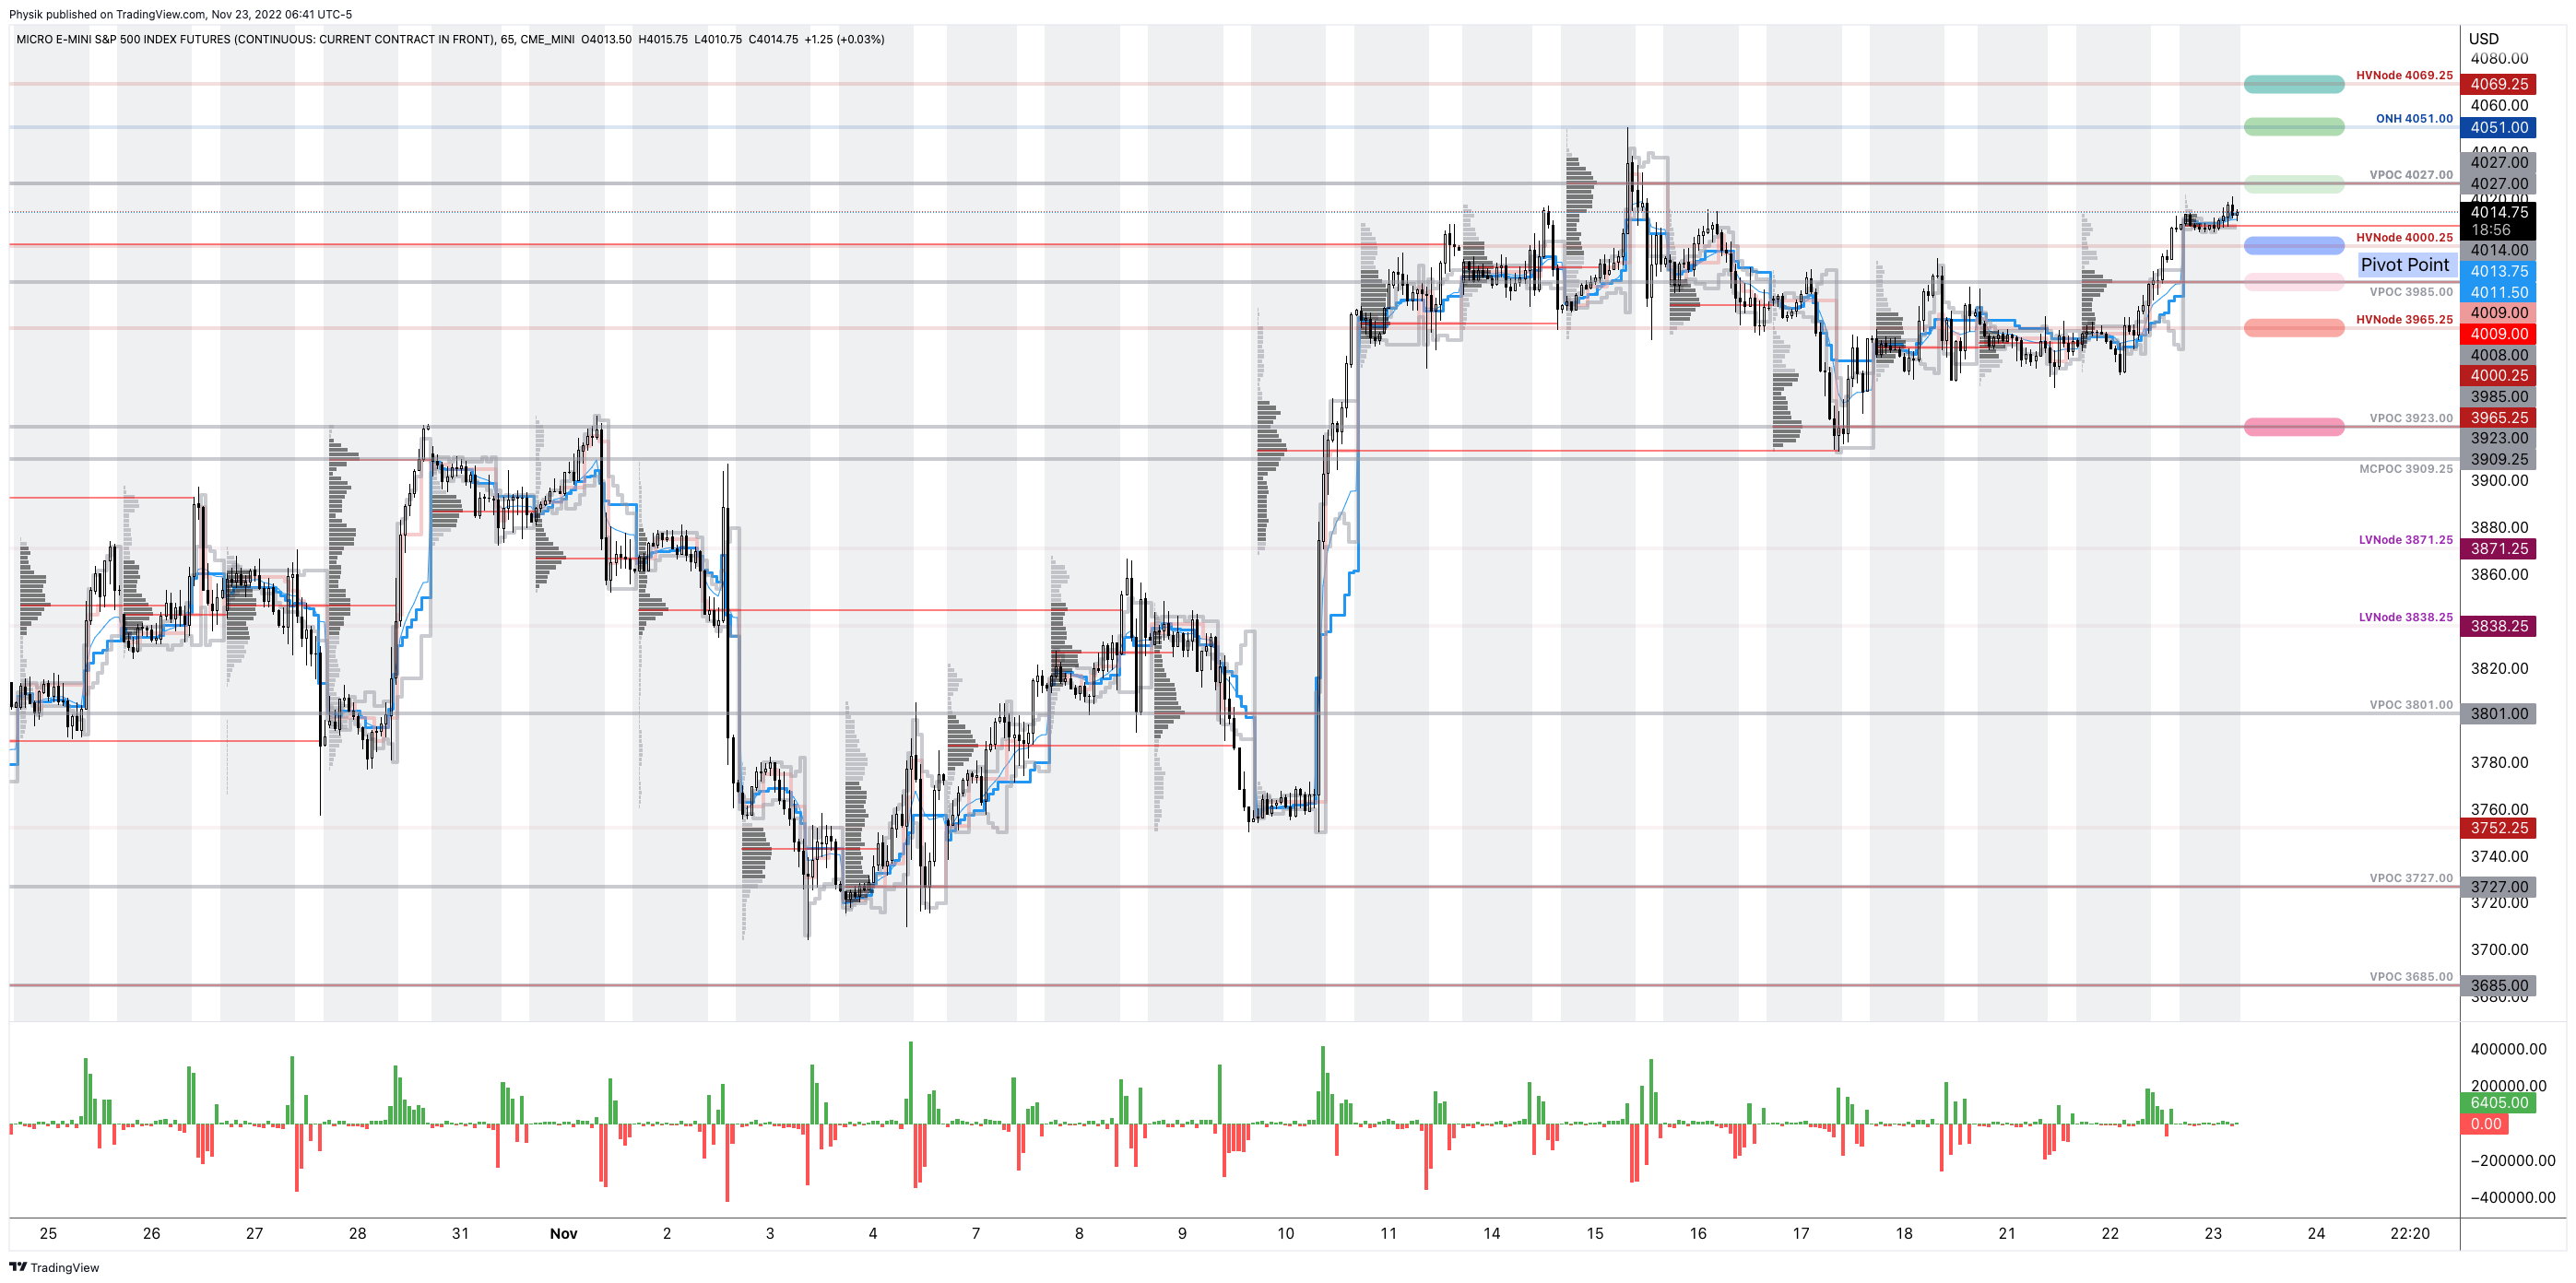
At its core, breakages in correlations some may have observed are accentuated by positioning forces we have talked about recently, as well as the above. These forces are important as you may have noticed the S&P 500’s tendency in responding to areas quoted by this letter.
Graphic: 65-minute profile chart of the Micro E-mini S&P 500 Futures.
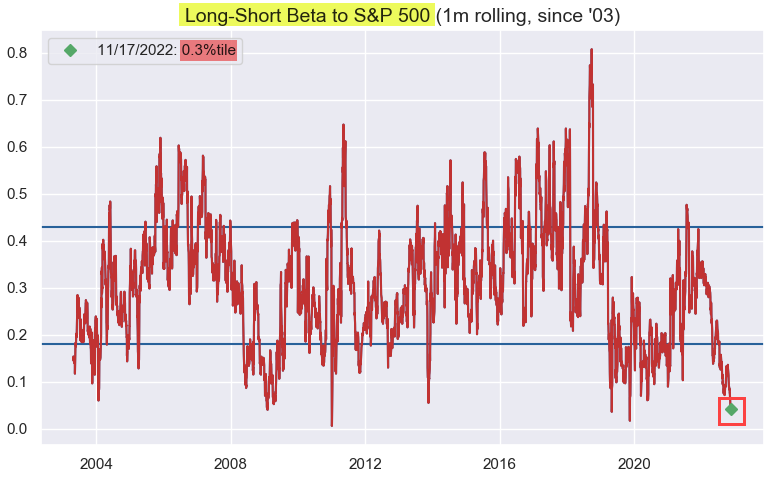
In a nutshell, in light of a “de-grossing of ‘shorts’” per Nomura Holdings Inc (NYSE: NMR), the sale of the volatility investors owned, after events such as elections and CPI, boosted markets indirectly (i.e., counterparty exposure to risk declines as the market rises and investors sell volatility → counterparty reduces the size of their negative Delta hedges → this reduces market pressure and bolsters a rally).
Graphic: Retrieved from Nomura Holdings Inc (NYSE: NMR) via ZeroHedge.
Investors’ continued supply of protection, all the while markets were rising, resulted in further indirect support and, later, prompted responsiveness to key areas at which the options activity was concentrated. This was better detailed on November 16 and 18.
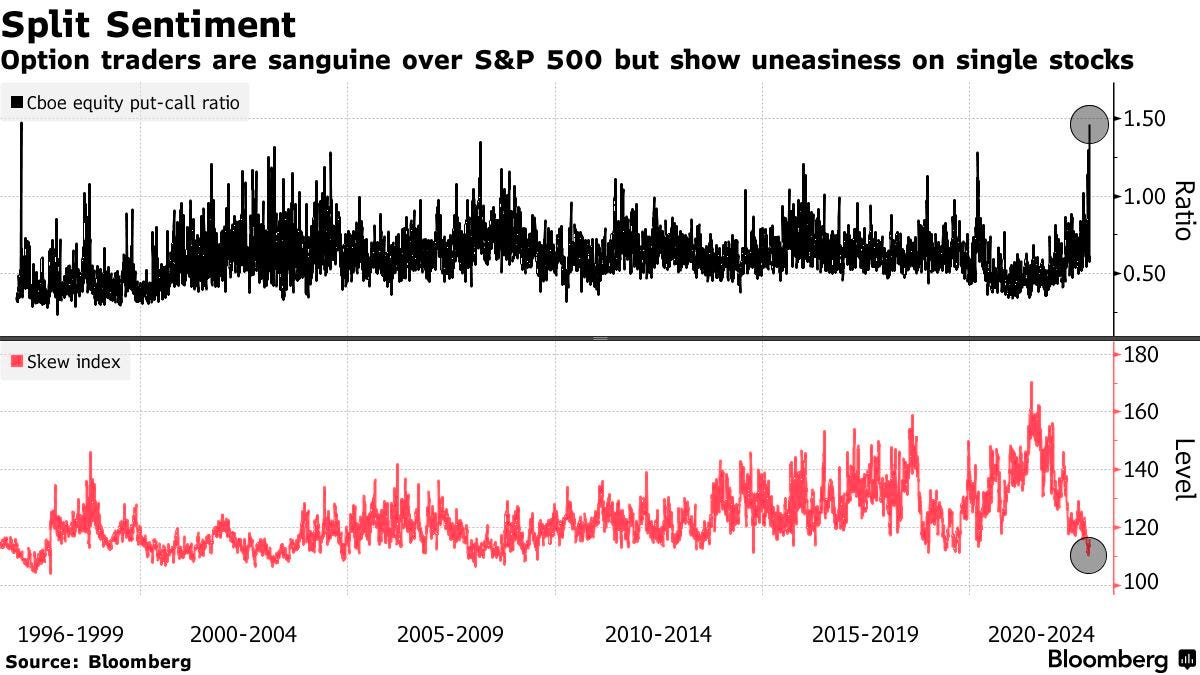
While this activity is happening – the S&P pinning – underlying constituents are swinging far more amid traders’ own “uneasiness” in stocks and the crypto turmoil; if there are forces pinning and supporting the S&P, all the while there are constraints connecting it to wild(er) components, then something (e.g., correlation) has to give.
Expecting More Of The Same For Now:
Nonetheless, it’s likely for this wild activity under the surface to continue, and for the S&P 500, itself, to be the recipient of even more supportive flows.
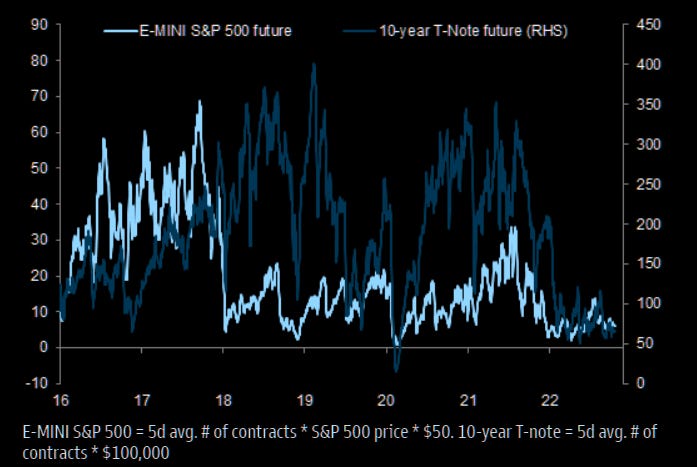
For example, the buyback related to the pulled-forward decay of options’ Delta with respect to time (Charm) and continued sale of volatility (Vanna), in a lower liquidity environment, likely results in hedging flows enforcing seasonality and masking the wild(ness) mentioned above.
Graphic: Retrieved from Goldman Sachs Group Inc (NYSE: GS) via The Market Ear.
Risks Building Under The Surface:
However, what is happening right now may set the stage for persistently high realized volatility (RVOL) when something bad does happen and those flows we talked about do less to resist that underlying volatility and weakness.
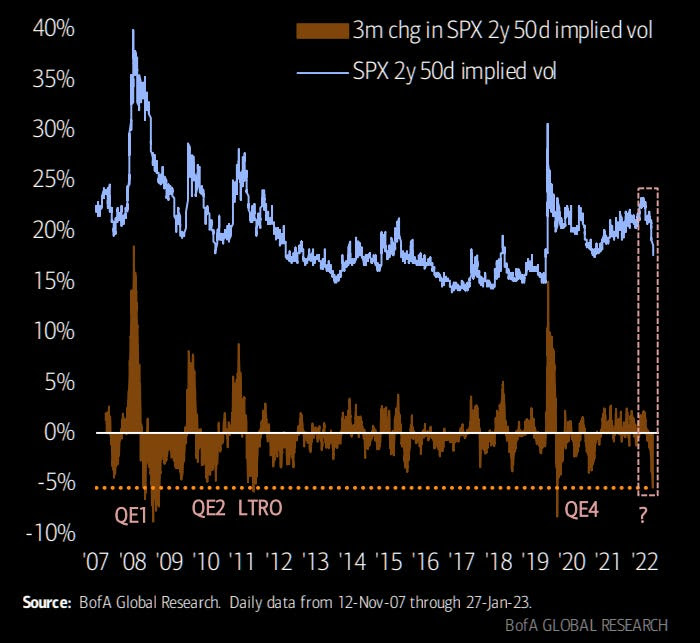
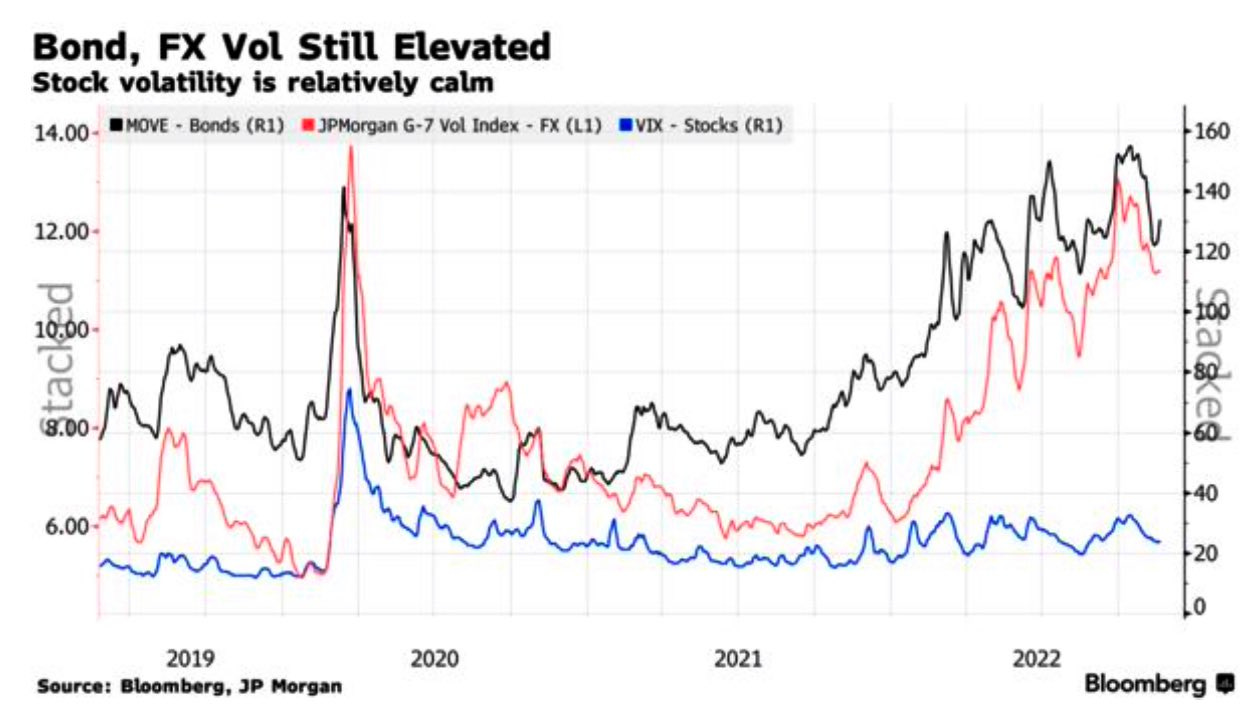
To explain, implied volatility (IVOL) has performed poorly in the context of 2022’s far-reaching decline. That’s in part the result of proactive hedging and monetization of protection (i.e., supply) into the decline.
Graphic: Retrieved from Bloomberg. Measures of equity IVOL tame relative to bonds and FX.
Investors, with IVOL performing poorly, are pushed into better-performing strategies. That includes selling IVOL which does less and less to boost the markets more and more (i.e., per SpotGamma, “the marginal impact of added volatility compression is far lower” at this juncture).
Accordingly, the market is left in a more precarious, less well-hedged position, and that’s concerning given some of the cracks that have appeared including the Credit Suisse Group AG (NYSE: CS) debacle covered in October, the UK liability-driven investment funds covered in September, interest rate swap risks, and beyond.
SCT Capital’s Hari Krishnan talked about some of these risks on a recent podcast.
In Essence, It’s Cheap To Hedge:
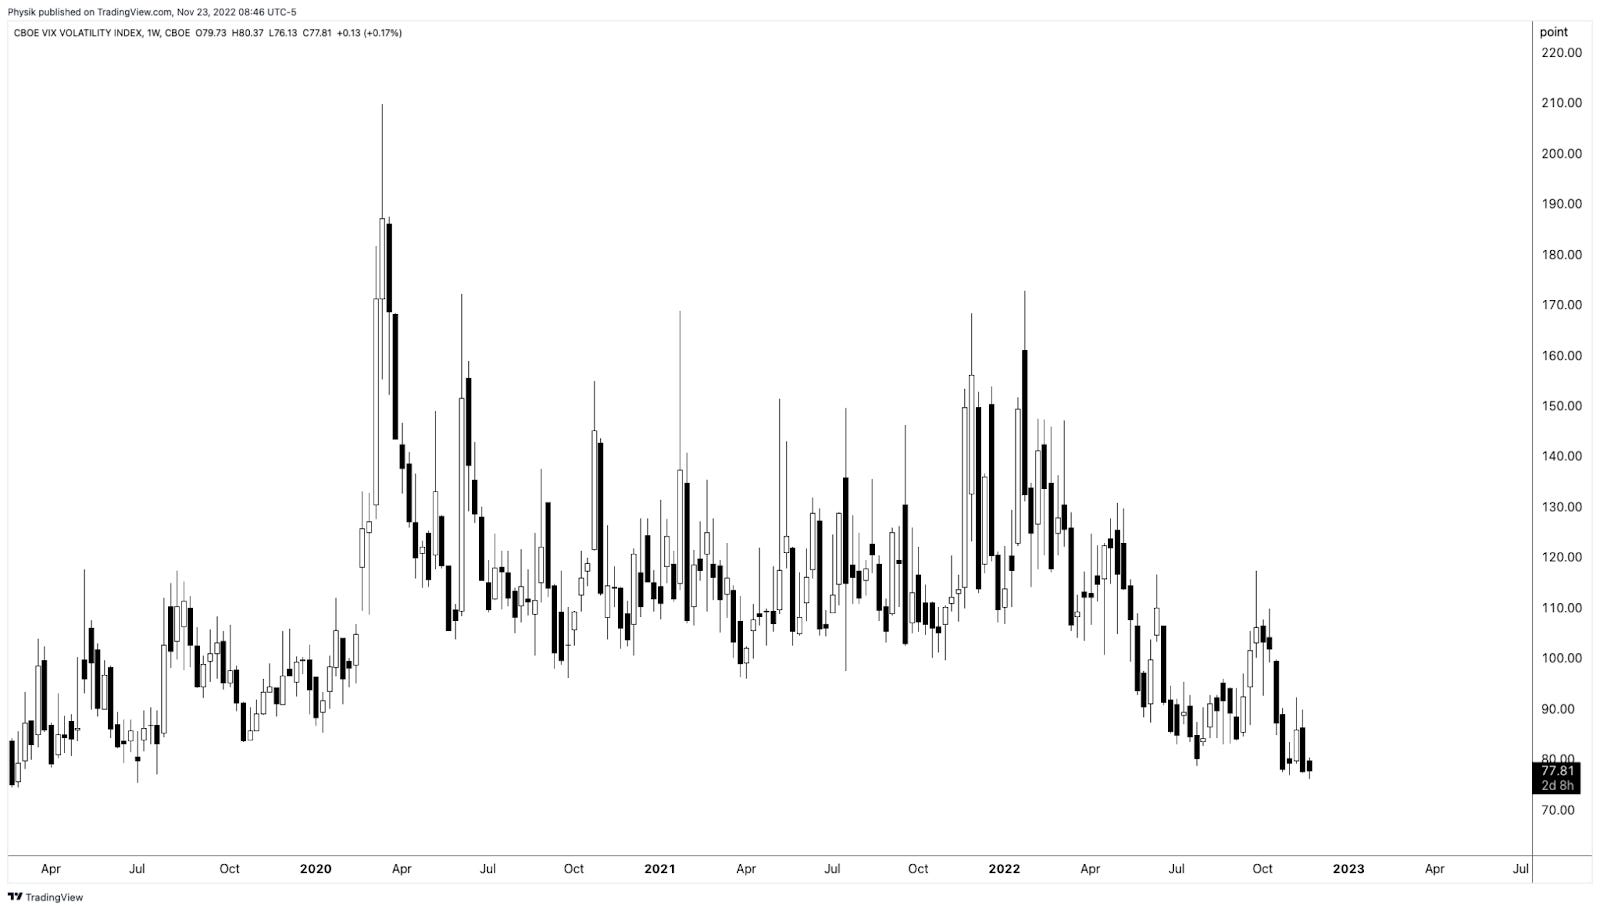
According to SpotGamma, “if you wanted to hedge, … it is historically cheap.”
Graphic: Cboe VVIX (INDEX: VVIX) measuring the expected volatility of the 30-day forward price of the VIX. Retrieved from TradingView. Via SpotGamma: “The VVIX is a naive check of participants’ exposure to the volatility of volatility itself (i.e., the non-linear sensitivity of an options price to changes in volatility or Vega convexity). This goes back to the point about the marginal impact of much more volatility compression; the marginal impact of volatility (expansion) compression would have a (bigger) smaller impact, comparatively.”
When you think there is to be an outsized move in the underlying, relative to what is priced, you buy options (+Gamma or positive exposure to directional movement).
When you think there is to be an outsized move in the implied volatility, relative to what is priced, you buy options (+Volga or positive exposure to IVOL changes).
If there’s a large change in direction (RVOL) or IVOL repricing, you may make money.
As an example, in mid-June, a trading partner and I noticed a change in tone in the non-linearity of volatility and skew with respect to linear changes in the price of the market (or S&P 500). The prices of ratio spread structures (i.e., long or short one option near-the-money, short or long two or more further out-of-the-money) changed by hundreds of percent for only a few basis points of change in the indexes.
At the time, Kai Volatility’s Cem Karsan noted this was “a spike in short-dated -sticky skew, [the] first we’ve seen since [the] secular decline began and it hints [at] a potentially critical change in dealer positioning [and] the distribution of underlying outcomes.”
“We’re transitioning to a fat left tail, right-based distribution,” he added.
So why does any of this matter?
In essence, it’s cheap to hedge and the context is there for you to do so, at least from a volatility (not directional) perspective.
Here is an excerpt from Mohamed Bouzoubaa et al’s book Exotic Options and Hybrids to support some of the earlier statements.
Options have a “non-zero second-order price sensitivity (or convexity) to a change in volatility,” Bouzoubaa et al explain. “ATM vanillas are [not] convex in the underlying’s price, … but OTM vanillas do have vega convexity … [so], when the holder of an option is long vega convexity, we say she is long vol-of-vol.”
In other words, by owning protection that’s far from current prices, you are positioned to monetize on a non-linear repricing of volatility, something we saw earlier this year and may continue to see.
Doing this in a manner that cuts decay (when nothing happens) is the difficult part.
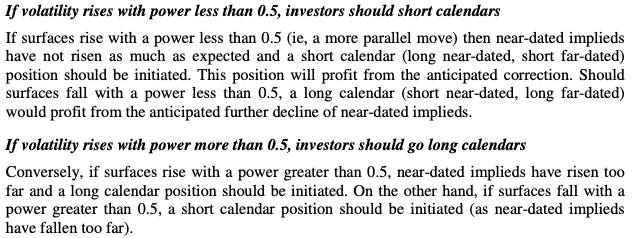
Calendar and diagonal spreads come to mind (i.e., sell a short-dated option and buy a far-dated option). You are betting against movement (negative Gamma) over a span of time you don’t think the market will move (e.g., Thanksgiving). And, you are betting on movement (positive Gamma) over a larger span of time (e.g., after Thanksgiving) where decay may not be as accelerated.
Graphic: Retrieved from Trading Volatility, Correlation, Term Structure and Skew by Colin Bennett et al. Originally sourced via Academia.edu.
Ultimately, counterparties’ response to new demands for protection, if something bad happens later, would exacerbate movement and aid in the repricing of IVOL.
At that new IVOL level, there would be more stored energy to catalyze a rally and this letter would express that.
To sell downside volatility (or puts) at this juncture (with time) is a poor trade. To sell downside volatility as part of a larger, more complex structure could be a good trade (e.g., sell a call spread to finance an ultra-wide SPX put ratio spread).
It all depends on structure and management.
Technical
As of 6:45 AM ET, Wednesday’s regular session (9:30 AM – 4:00 PM ET), in the S&P 500, is likely to open in the middle part of a positively skewed overnight inventory, outside of the prior-range and -value, suggesting a potential for immediate directional opportunity.
Our S&P 500 pivot for today is $4,000.25.
Key levels to the upside include $4,027.00, $4,051.00, and $4,069.25.
Key levels to the downside include $3,985.00, $3,965.25, and $3,923.00.
Click here to load today’s key levels into the web-based TradingView platform. All levels are derived using the 65-minute timeframe. New links are produced, daily.
Graphic: 65-minute profile chart of the Micro E-mini S&P 500 Futures.
Definitions
Volume Areas: A structurally sound market will build on areas of high volume (HVNodes). Should the market trend for long periods of time, it will lack sound structure, identified as low volume areas (LVNodes). LVNodes denote directional conviction and ought to offer support on any test.
If participants were to auction and find acceptance into areas of prior low volume (LVNodes), then future discovery ought to be volatile and quick as participants look to HVNodes for favorable entry or exit.
POCs: POCs are valuable as they denote areas where two-sided trade was most prevalent in a prior day session. Participants will respond to future tests of value as they offer favorable entry and exit.
MCPOCs: POCs are valuable as they denote areas where two-sided trade was most prevalent over numerous day sessions. Participants will respond to future tests of value as they offer favorable entry and exit.
About
After years of self-education, strategy development, mentorship, and trial-and-error, Renato Leonard Capelj began trading full-time and founded Physik Invest to detail his methods, research, and performance in the markets.
Capelj also writes options market analyses at SpotGamma and is a Benzinga journalist.